|
||||||||||||||||||||
| |
| Phenotypic Information (metabolism pathway, cancer, disease, phenome) |
| |
| |
| Gene-Gene Network Information: Co-Expression Network, Interacting Genes & KEGG |
| |
|


| Gene Summary for AMY2B |
| Top |
| Phenotypic Information for AMY2B(metabolism pathway, cancer, disease, phenome) |
| Cancer | CGAP: AMY2B |
| Familial Cancer Database: AMY2B | |
| * This gene is included in those cancer gene databases. |
|
|
|
|
|
|
| ||||||||||||||
Oncogene 1 | Significant driver gene in UCEC 6, | |||||||||||||||||||
| cf) number; DB name 1 Oncogene; http://nar.oxfordjournals.org/content/35/suppl_1/D721.long, 2 Tumor Suppressor gene; https://bioinfo.uth.edu/TSGene/, 3 Cancer Gene Census; http://www.nature.com/nrc/journal/v4/n3/abs/nrc1299.html, 4 CancerGenes; http://nar.oxfordjournals.org/content/35/suppl_1/D721.long, 5 Network of Cancer Gene; http://ncg.kcl.ac.uk/index.php, 6 http://www.nature.com/nature/journal/v497/n7447/full/nature12113.html, 7Therapeutic Vulnerabilities in Cancer; http://cbio.mskcc.org/cancergenomics/statius/ |
| KEGG_STARCH_AND_SUCROSE_METABOLISM REACTOME_METABOLISM_OF_CARBOHYDRATES | |
| OMIM | 104660; gene. |
| Orphanet | |
| Disease | KEGG Disease: AMY2B |
| MedGen: AMY2B (Human Medical Genetics with Condition) | |
| ClinVar: AMY2B | |
| Phenotype | MGI: AMY2B (International Mouse Phenotyping Consortium) |
| PhenomicDB: AMY2B | |
| Mutations for AMY2B |
| * Under tables are showing count per each tissue to give us broad intuition about tissue specific mutation patterns.You can go to the detailed page for each mutation database's web site. |
| There's no structural variation information in COSMIC data for this gene. |
| * From mRNA Sanger sequences, Chitars2.0 arranged chimeric transcripts. This table shows AMY2B related fusion information. |
| ID | Head Gene | Tail Gene | Accession | Gene_a | qStart_a | qEnd_a | Chromosome_a | tStart_a | tEnd_a | Gene_a | qStart_a | qEnd_a | Chromosome_a | tStart_a | tEnd_a |
| AW583683 | CADPS | 1 | 117 | 3 | 62578345 | 62631434 | AMY2B | 110 | 247 | 1 | 104122016 | 104122153 | |
| BJ994441 | PCK1 | 1 | 94 | 20 | 56136166 | 56136259 | AMY2B | 93 | 552 | 1 | 104108055 | 104114815 | |
| DB221809 | SMEK2 | 2 | 137 | 2 | 55842586 | 55843732 | AMY2B | 133 | 499 | 1 | 104114175 | 104114879 | |
| Top |
| There's no copy number variation information in COSMIC data for this gene. |
| Top |
|
 |
| Top |
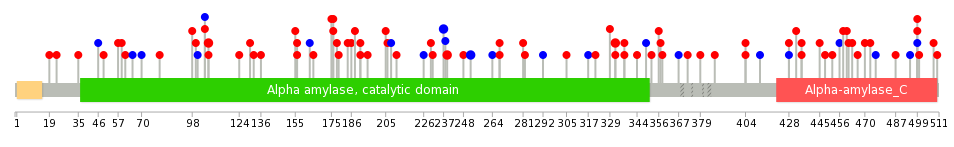
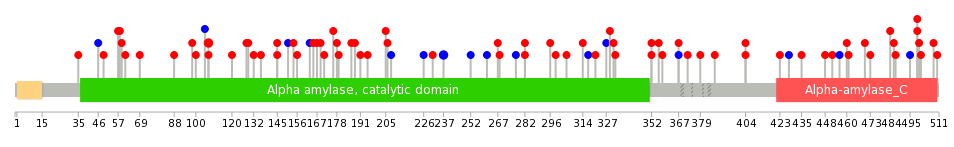
| Stat. for Non-Synonymous SNVs (# total SNVs=63) | (# total SNVs=22) |
 |  |
(# total SNVs=2) | (# total SNVs=0) |
 |
| Top |
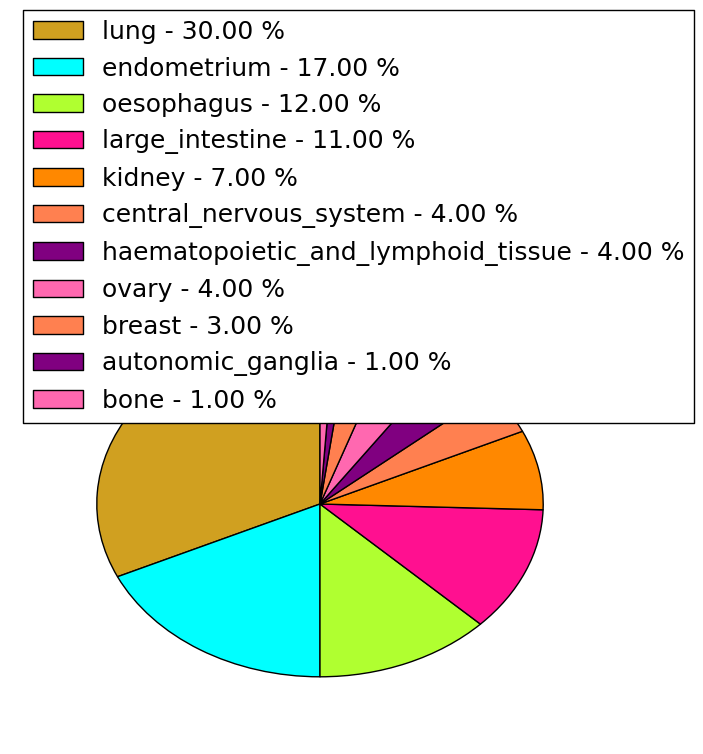
| * When you move the cursor on each content, you can see more deailed mutation information on the Tooltip. Those are primary_site,primary_histology,mutation(aa),pubmedID. |
| GRCh37 position | Mutation(aa) | Unique sampleID count |
| chr1:104114357-104114357 | p.R45* | 5 |
| chr1:104116532-104116532 | p.A239E | 2 |
| chr1:104115689-104115689 | p.R107H | 2 |
| chr1:104117961-104117961 | p.D332A | 2 |
| chr1:104122083-104122083 | p.E499D | 2 |
| chr1:104116527-104116527 | p.F237F | 2 |
| chr1:104116399-104116399 | p.A195S | 1 |
| chr1:104118108-104118108 | p.G349G | 1 |
| chr1:104121994-104121994 | p.G470R | 1 |
| chr1:104114732-104114732 | p.V57F | 1 |
| Top |
|
 |
| Point Mutation/ Tissue ID | 1 | 2 | 3 | 4 | 5 | 6 | 7 | 8 | 9 | 10 | 11 | 12 | 13 | 14 | 15 | 16 | 17 | 18 | 19 | 20 |
| # sample | 2 | 3 | 1 | 3 | 2 | 6 | 4 | 1 | 10 | 7 | 1 | 10 | 11 | 2 | 13 | |||||
| # mutation | 2 | 3 | 1 | 3 | 2 | 7 | 4 | 1 | 21 | 7 | 1 | 10 | 13 | 2 | 13 | |||||
| nonsynonymous SNV | 1 | 1 | 3 | 2 | 6 | 4 | 1 | 16 | 6 | 1 | 9 | 12 | 2 | 9 | ||||||
| synonymous SNV | 1 | 3 | 1 | 5 | 1 | 1 | 1 | 4 |
| cf) Tissue ID; Tissue type (1; BLCA[Bladder Urothelial Carcinoma], 2; BRCA[Breast invasive carcinoma], 3; CESC[Cervical squamous cell carcinoma and endocervical adenocarcinoma], 4; COAD[Colon adenocarcinoma], 5; GBM[Glioblastoma multiforme], 6; Glioma Low Grade, 7; HNSC[Head and Neck squamous cell carcinoma], 8; KICH[Kidney Chromophobe], 9; KIRC[Kidney renal clear cell carcinoma], 10; KIRP[Kidney renal papillary cell carcinoma], 11; LAML[Acute Myeloid Leukemia], 12; LUAD[Lung adenocarcinoma], 13; LUSC[Lung squamous cell carcinoma], 14; OV[Ovarian serous cystadenocarcinoma ], 15; PAAD[Pancreatic adenocarcinoma], 16; PRAD[Prostate adenocarcinoma], 17; SKCM[Skin Cutaneous Melanoma], 18:STAD[Stomach adenocarcinoma], 19:THCA[Thyroid carcinoma], 20:UCEC[Uterine Corpus Endometrial Carcinoma]) |
| Top |
| * We represented just top 10 SNVs. When you move the cursor on each content, you can see more deailed mutation information on the Tooltip. Those are primary_site, primary_histology, mutation(aa), pubmedID. |
| Genomic Position | Mutation(aa) | Unique sampleID count |
| chr1:104116527 | p.F237F | 2 |
| chr1:104115689 | p.R352L | 2 |
| chr1:104116981 | p.R107H | 2 |
| chr1:104118116 | p.R282S | 2 |
| chr1:104116440 | p.N165K | 1 |
| chr1:104120424 | p.D332Y | 1 |
| chr1:104114744 | p.Q456Q | 1 |
| chr1:104117863 | p.V98L | 1 |
| chr1:104122071 | p.N167S | 1 |
| chr1:104115765 | p.L252L | 1 |
| * Copy number data were extracted from TCGA using R package TCGA-Assembler. The URLs of all public data files on TCGA DCC data server were gathered on Jan-05-2015. Function ProcessCNAData in TCGA-Assembler package was used to obtain gene-level copy number value which is calculated as the average copy number of the genomic region of a gene. |
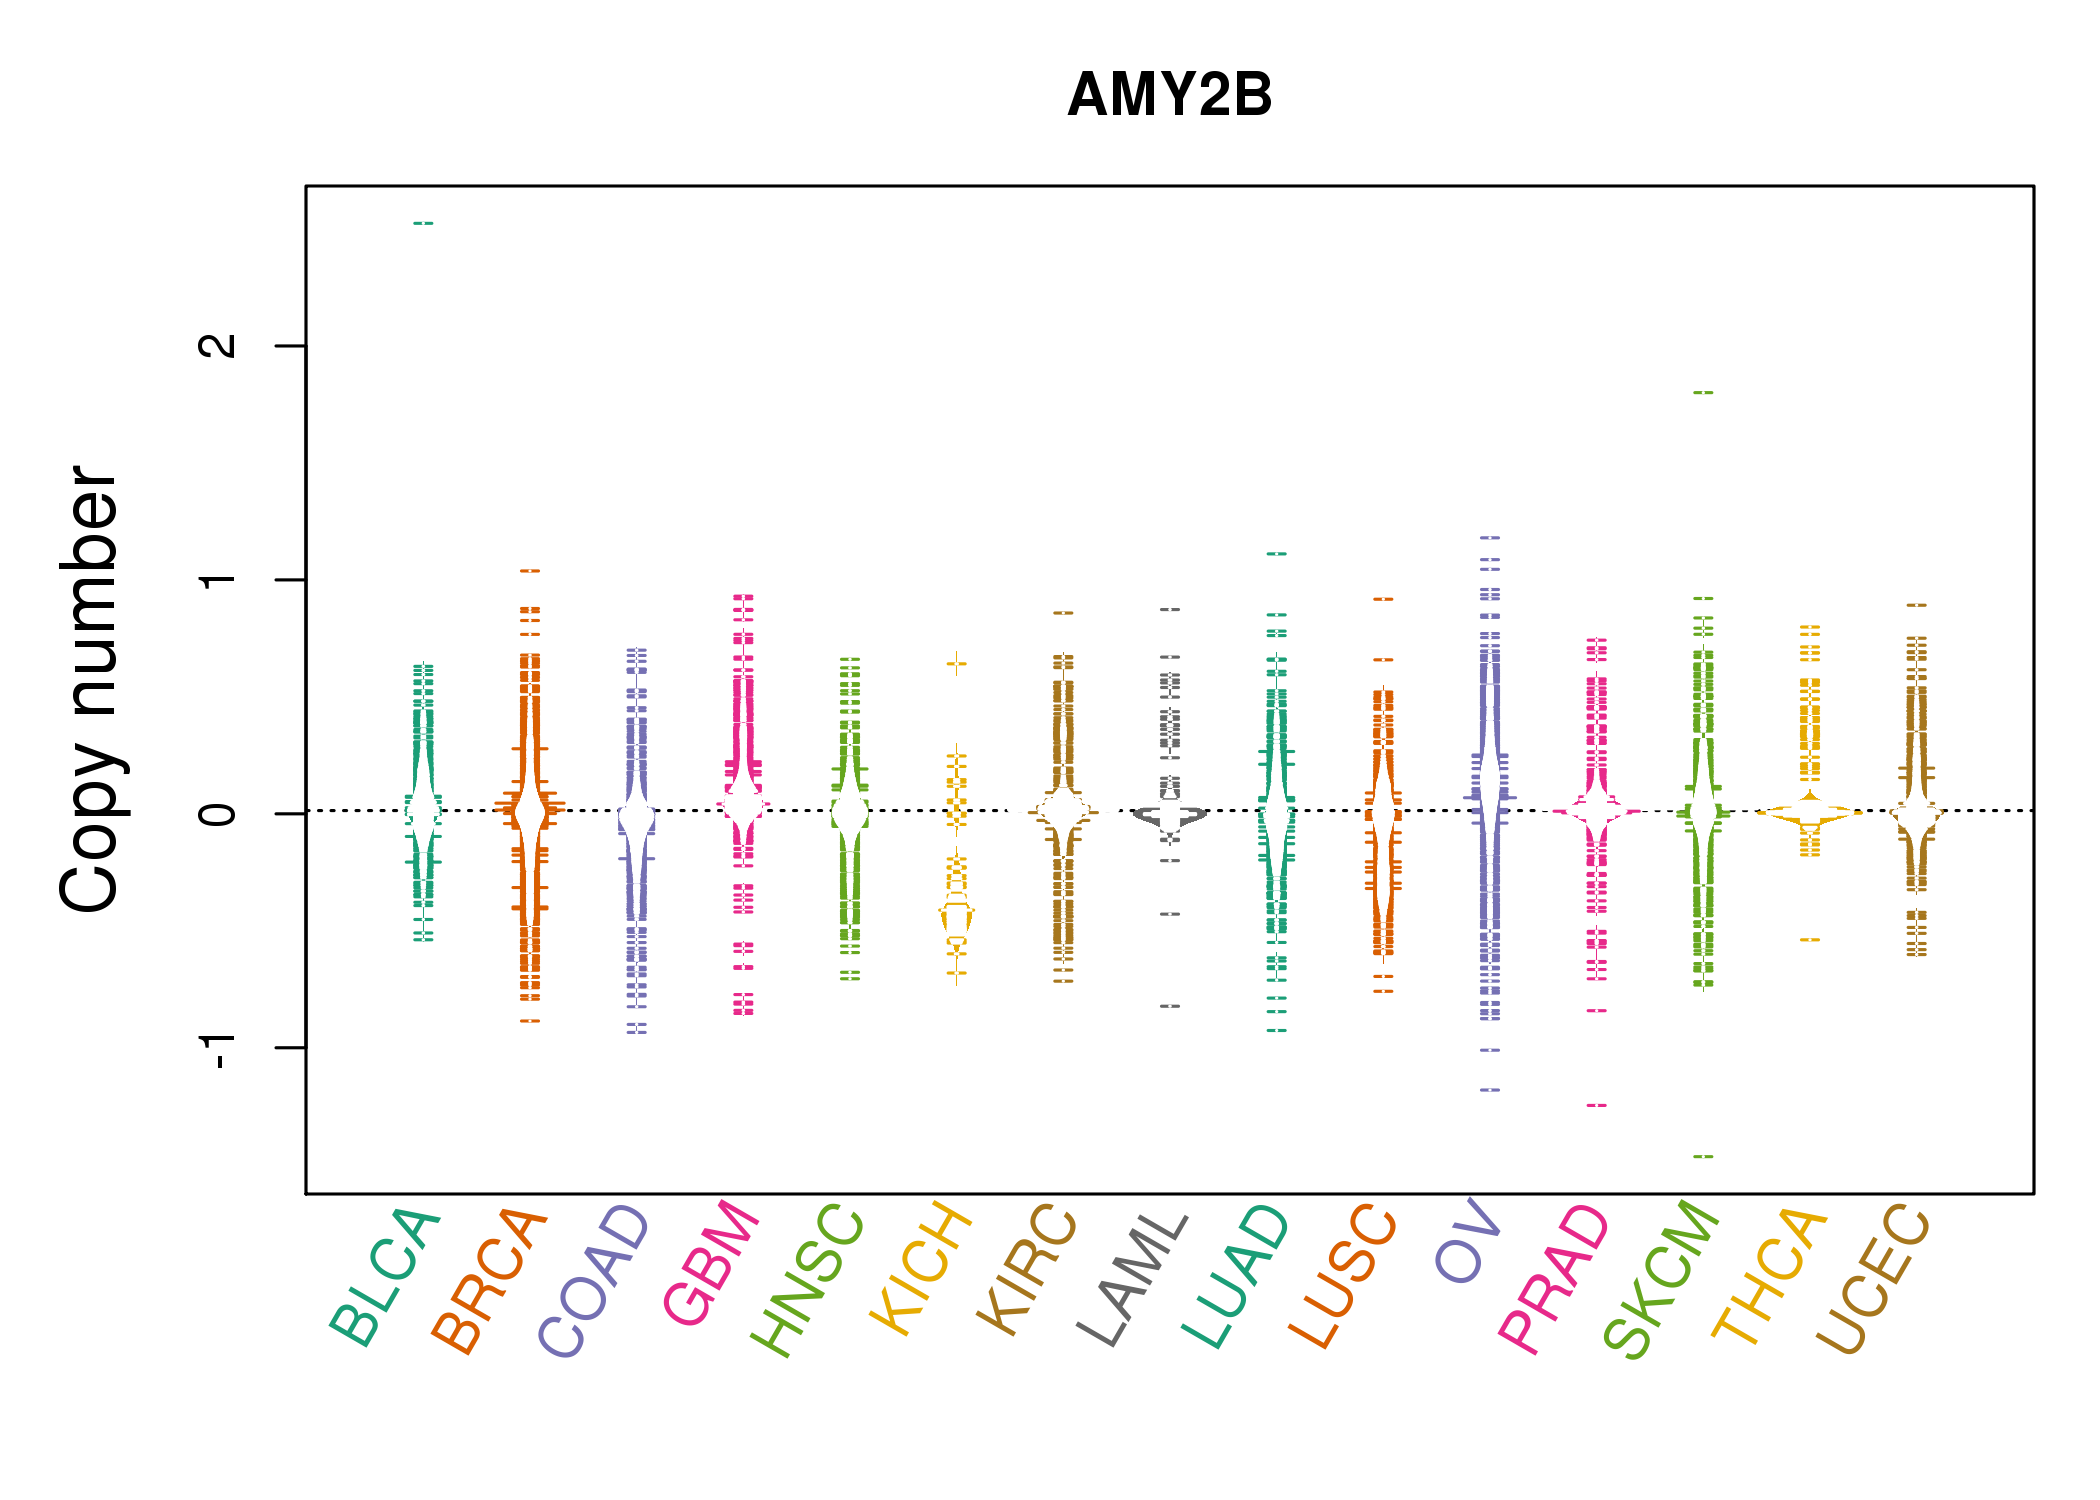 |
| cf) Tissue ID[Tissue type]: BLCA[Bladder Urothelial Carcinoma], BRCA[Breast invasive carcinoma], CESC[Cervical squamous cell carcinoma and endocervical adenocarcinoma], COAD[Colon adenocarcinoma], GBM[Glioblastoma multiforme], Glioma Low Grade, HNSC[Head and Neck squamous cell carcinoma], KICH[Kidney Chromophobe], KIRC[Kidney renal clear cell carcinoma], KIRP[Kidney renal papillary cell carcinoma], LAML[Acute Myeloid Leukemia], LUAD[Lung adenocarcinoma], LUSC[Lung squamous cell carcinoma], OV[Ovarian serous cystadenocarcinoma ], PAAD[Pancreatic adenocarcinoma], PRAD[Prostate adenocarcinoma], SKCM[Skin Cutaneous Melanoma], STAD[Stomach adenocarcinoma], THCA[Thyroid carcinoma], UCEC[Uterine Corpus Endometrial Carcinoma] |
| Top |
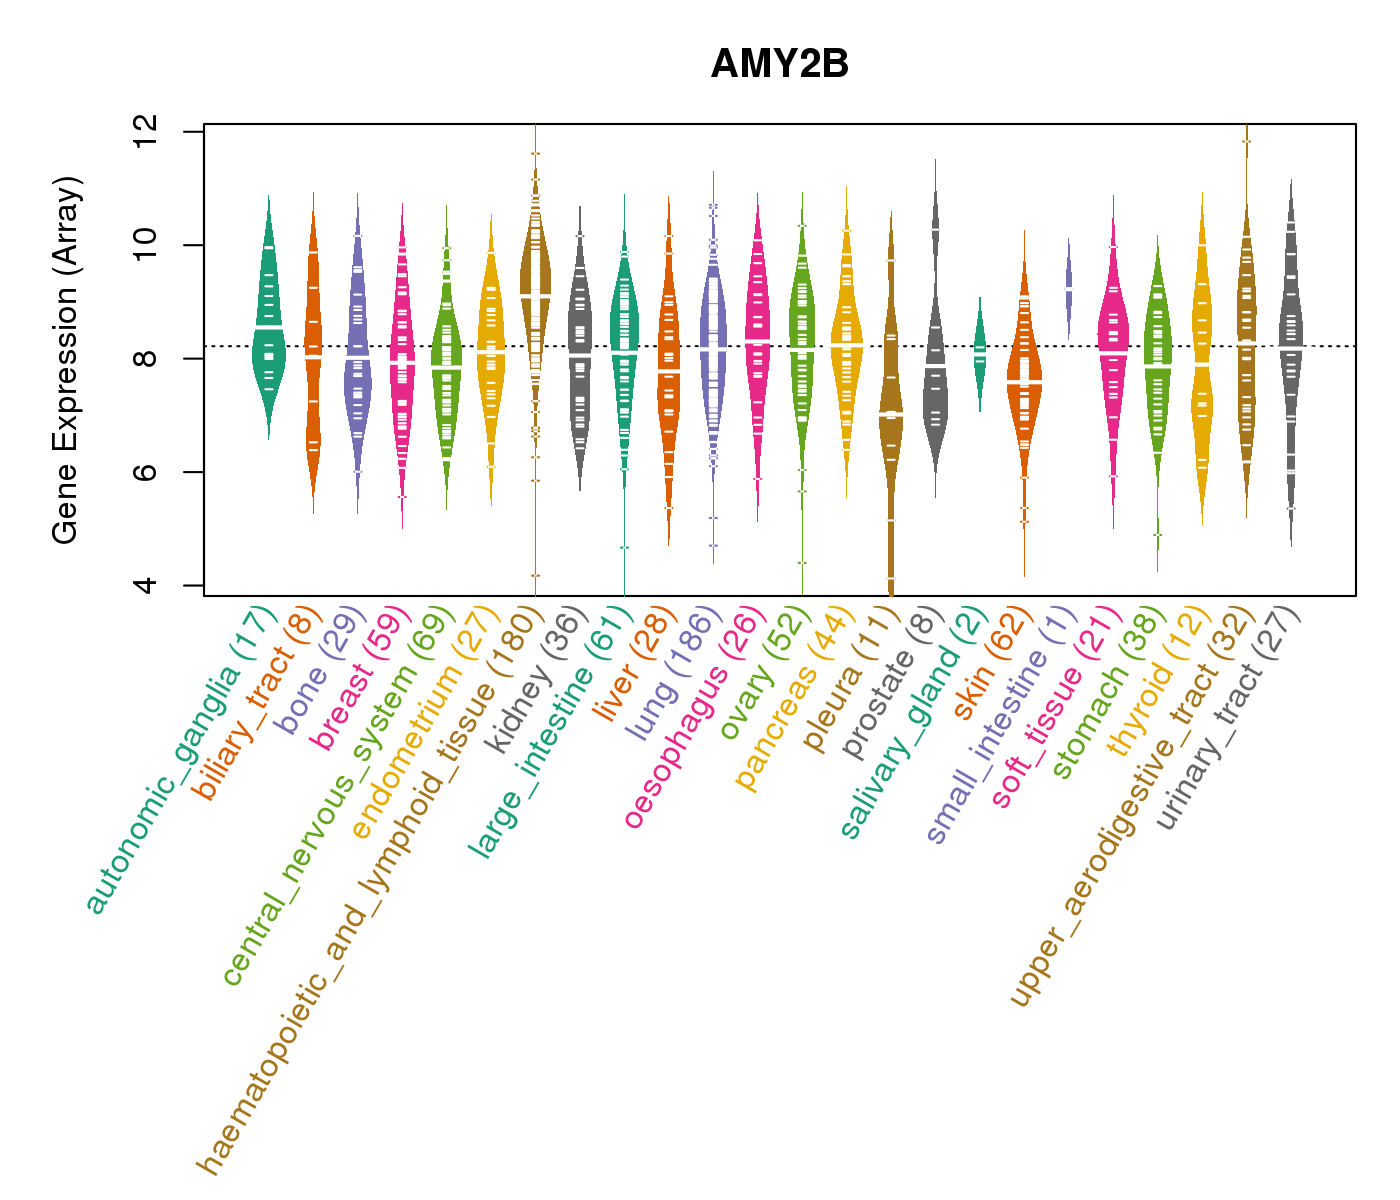
| Gene Expression for AMY2B |
| * CCLE gene expression data were extracted from CCLE_Expression_Entrez_2012-10-18.res: Gene-centric RMA-normalized mRNA expression data. |
 |
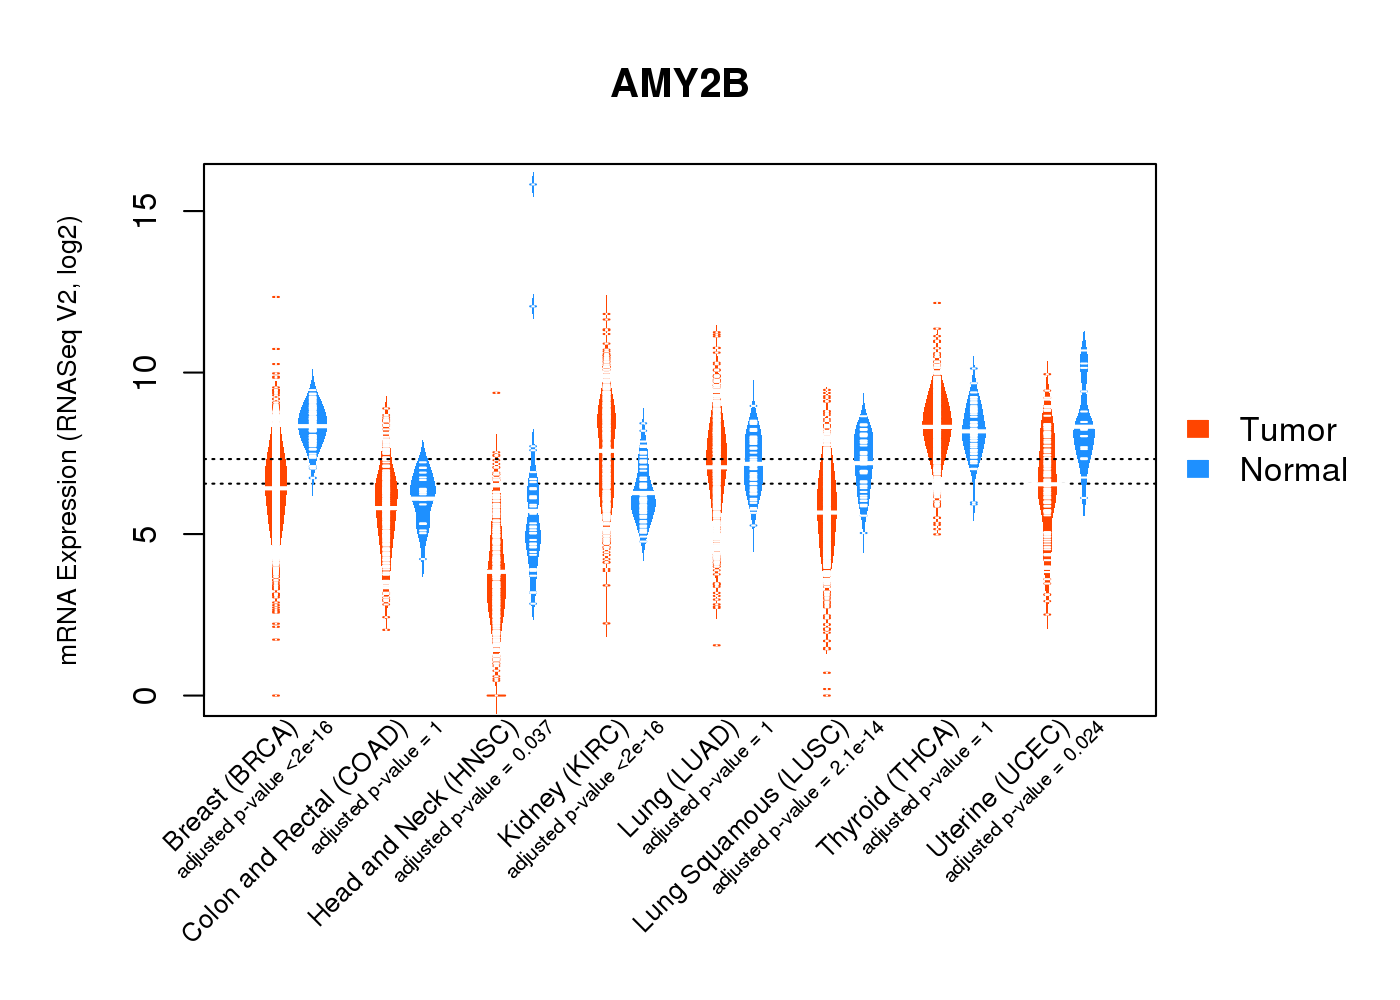
| * Normalized gene expression data of RNASeqV2 was extracted from TCGA using R package TCGA-Assembler. The URLs of all public data files on TCGA DCC data server were gathered at Jan-05-2015. Only eight cancer types have enough normal control samples for differential expression analysis. (t test, adjusted p<0.05 (using Benjamini-Hochberg FDR)) |
 |
| Top |
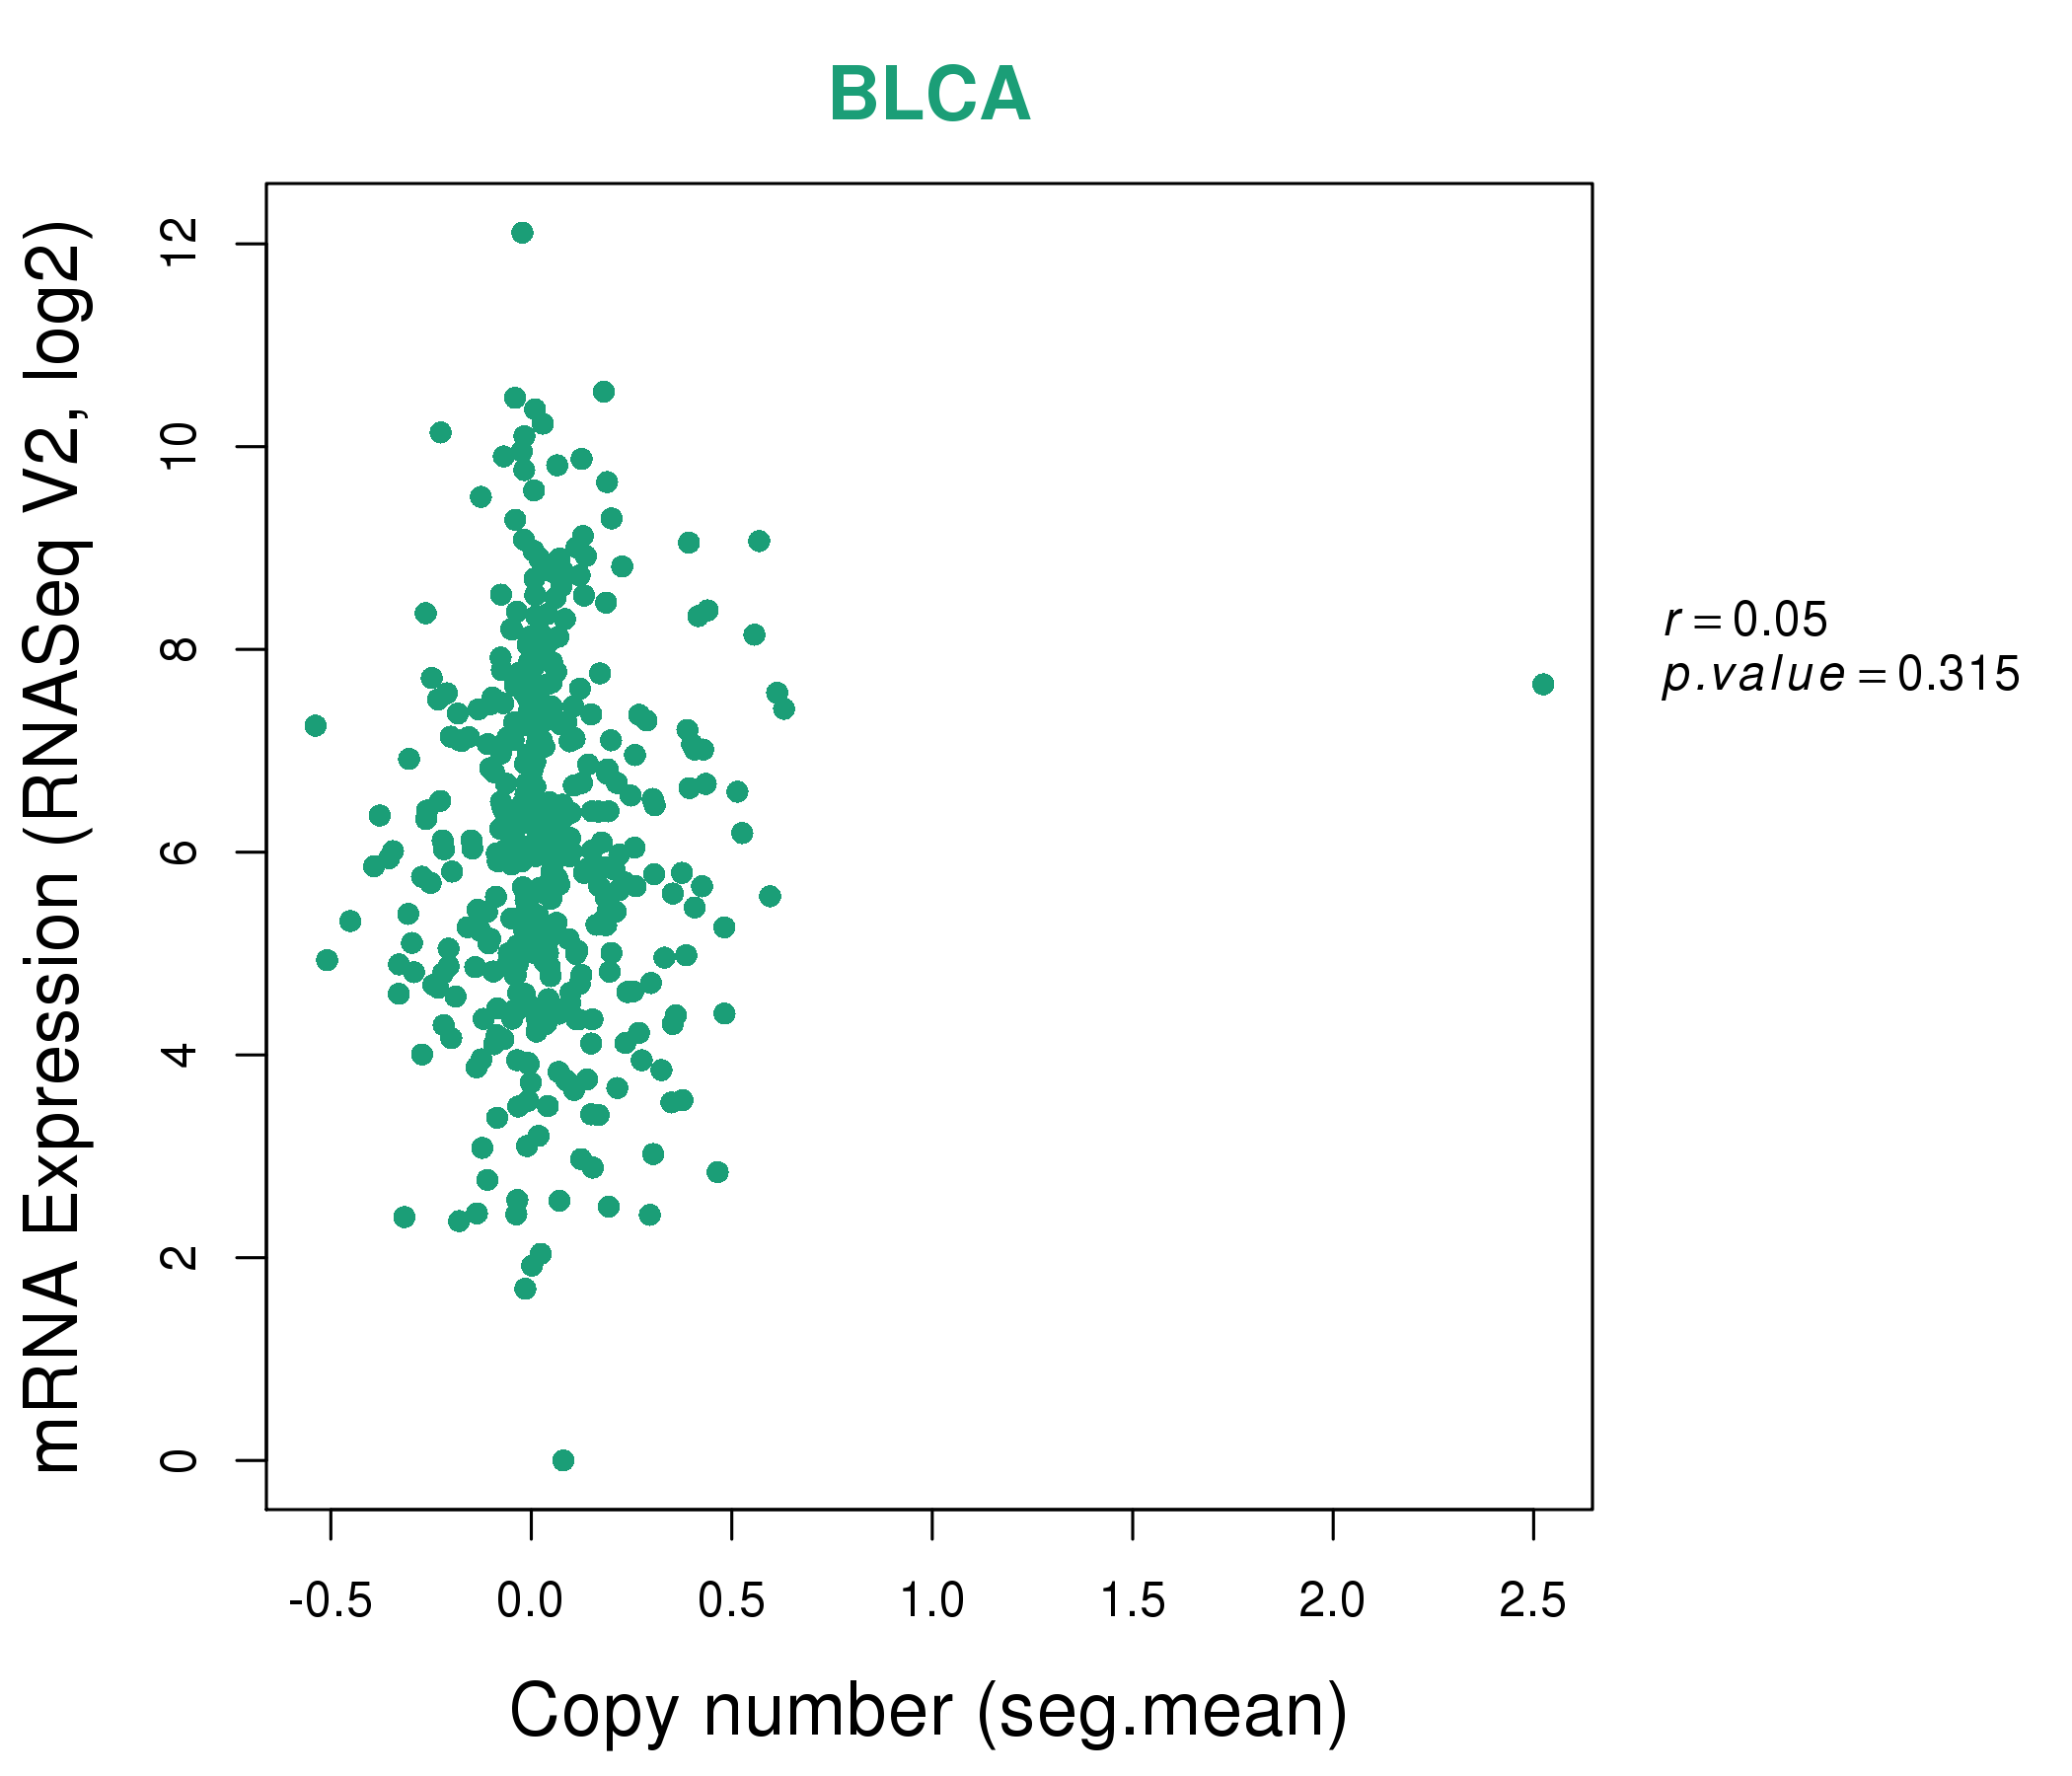
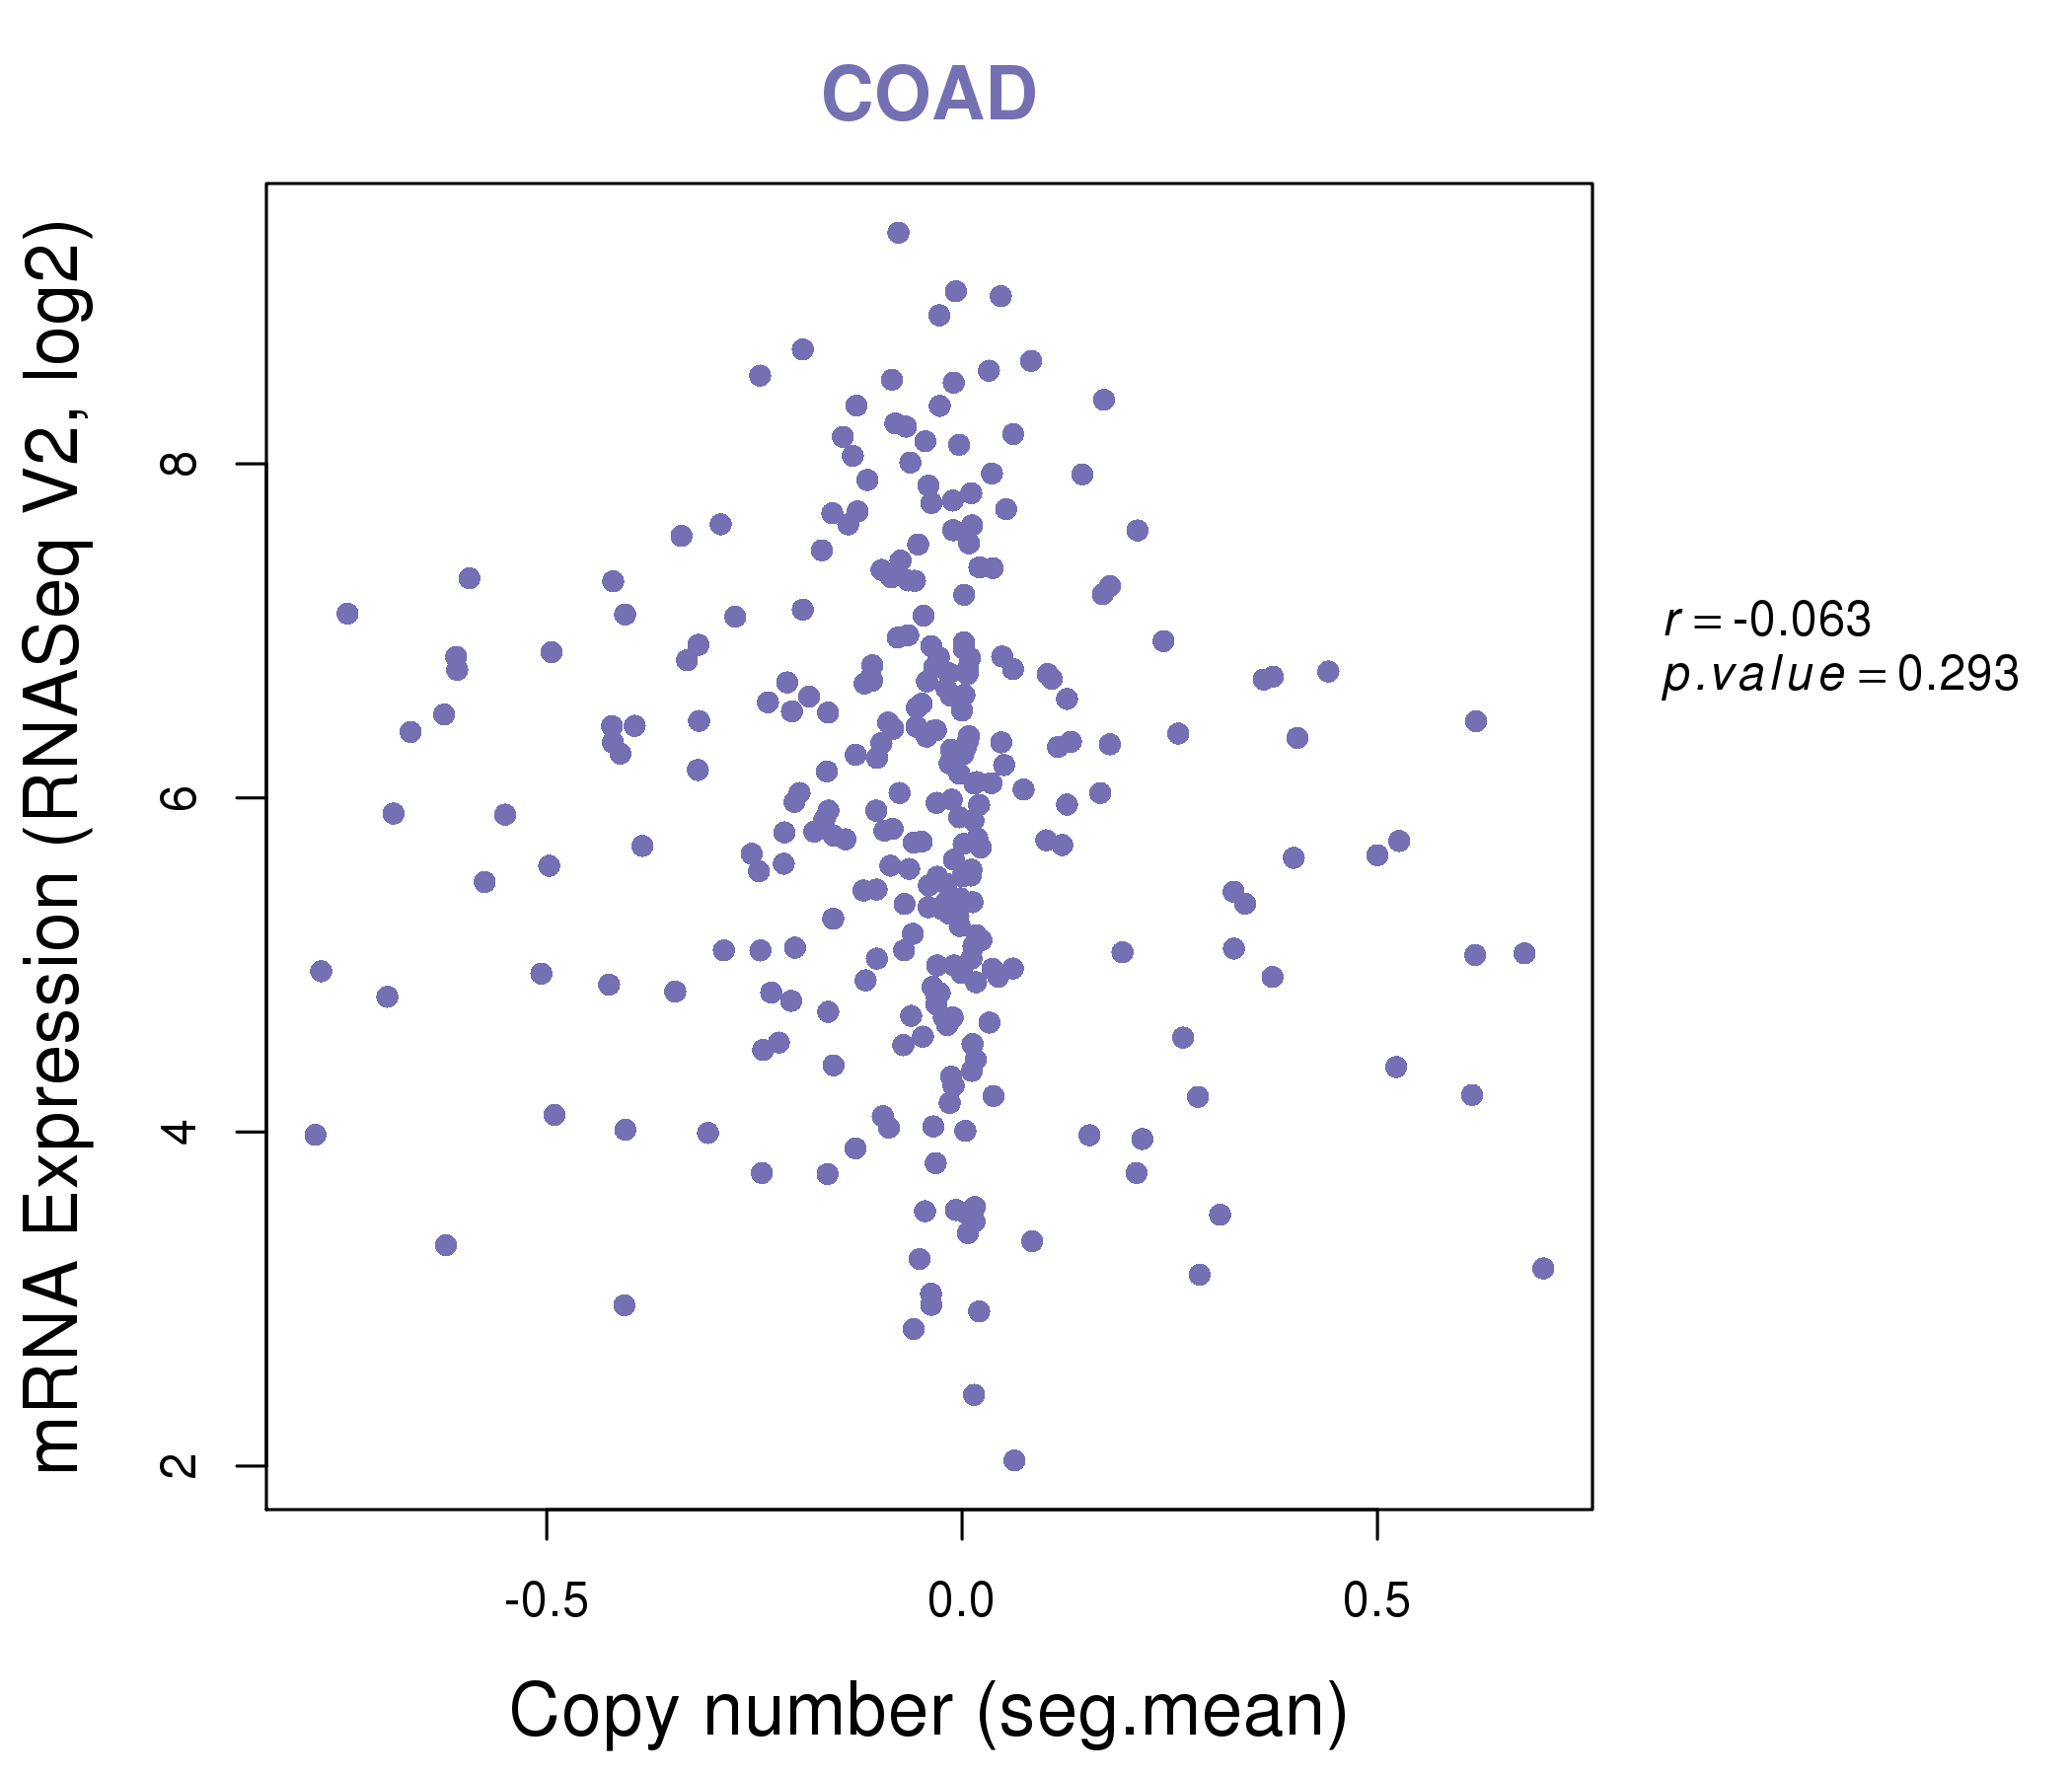
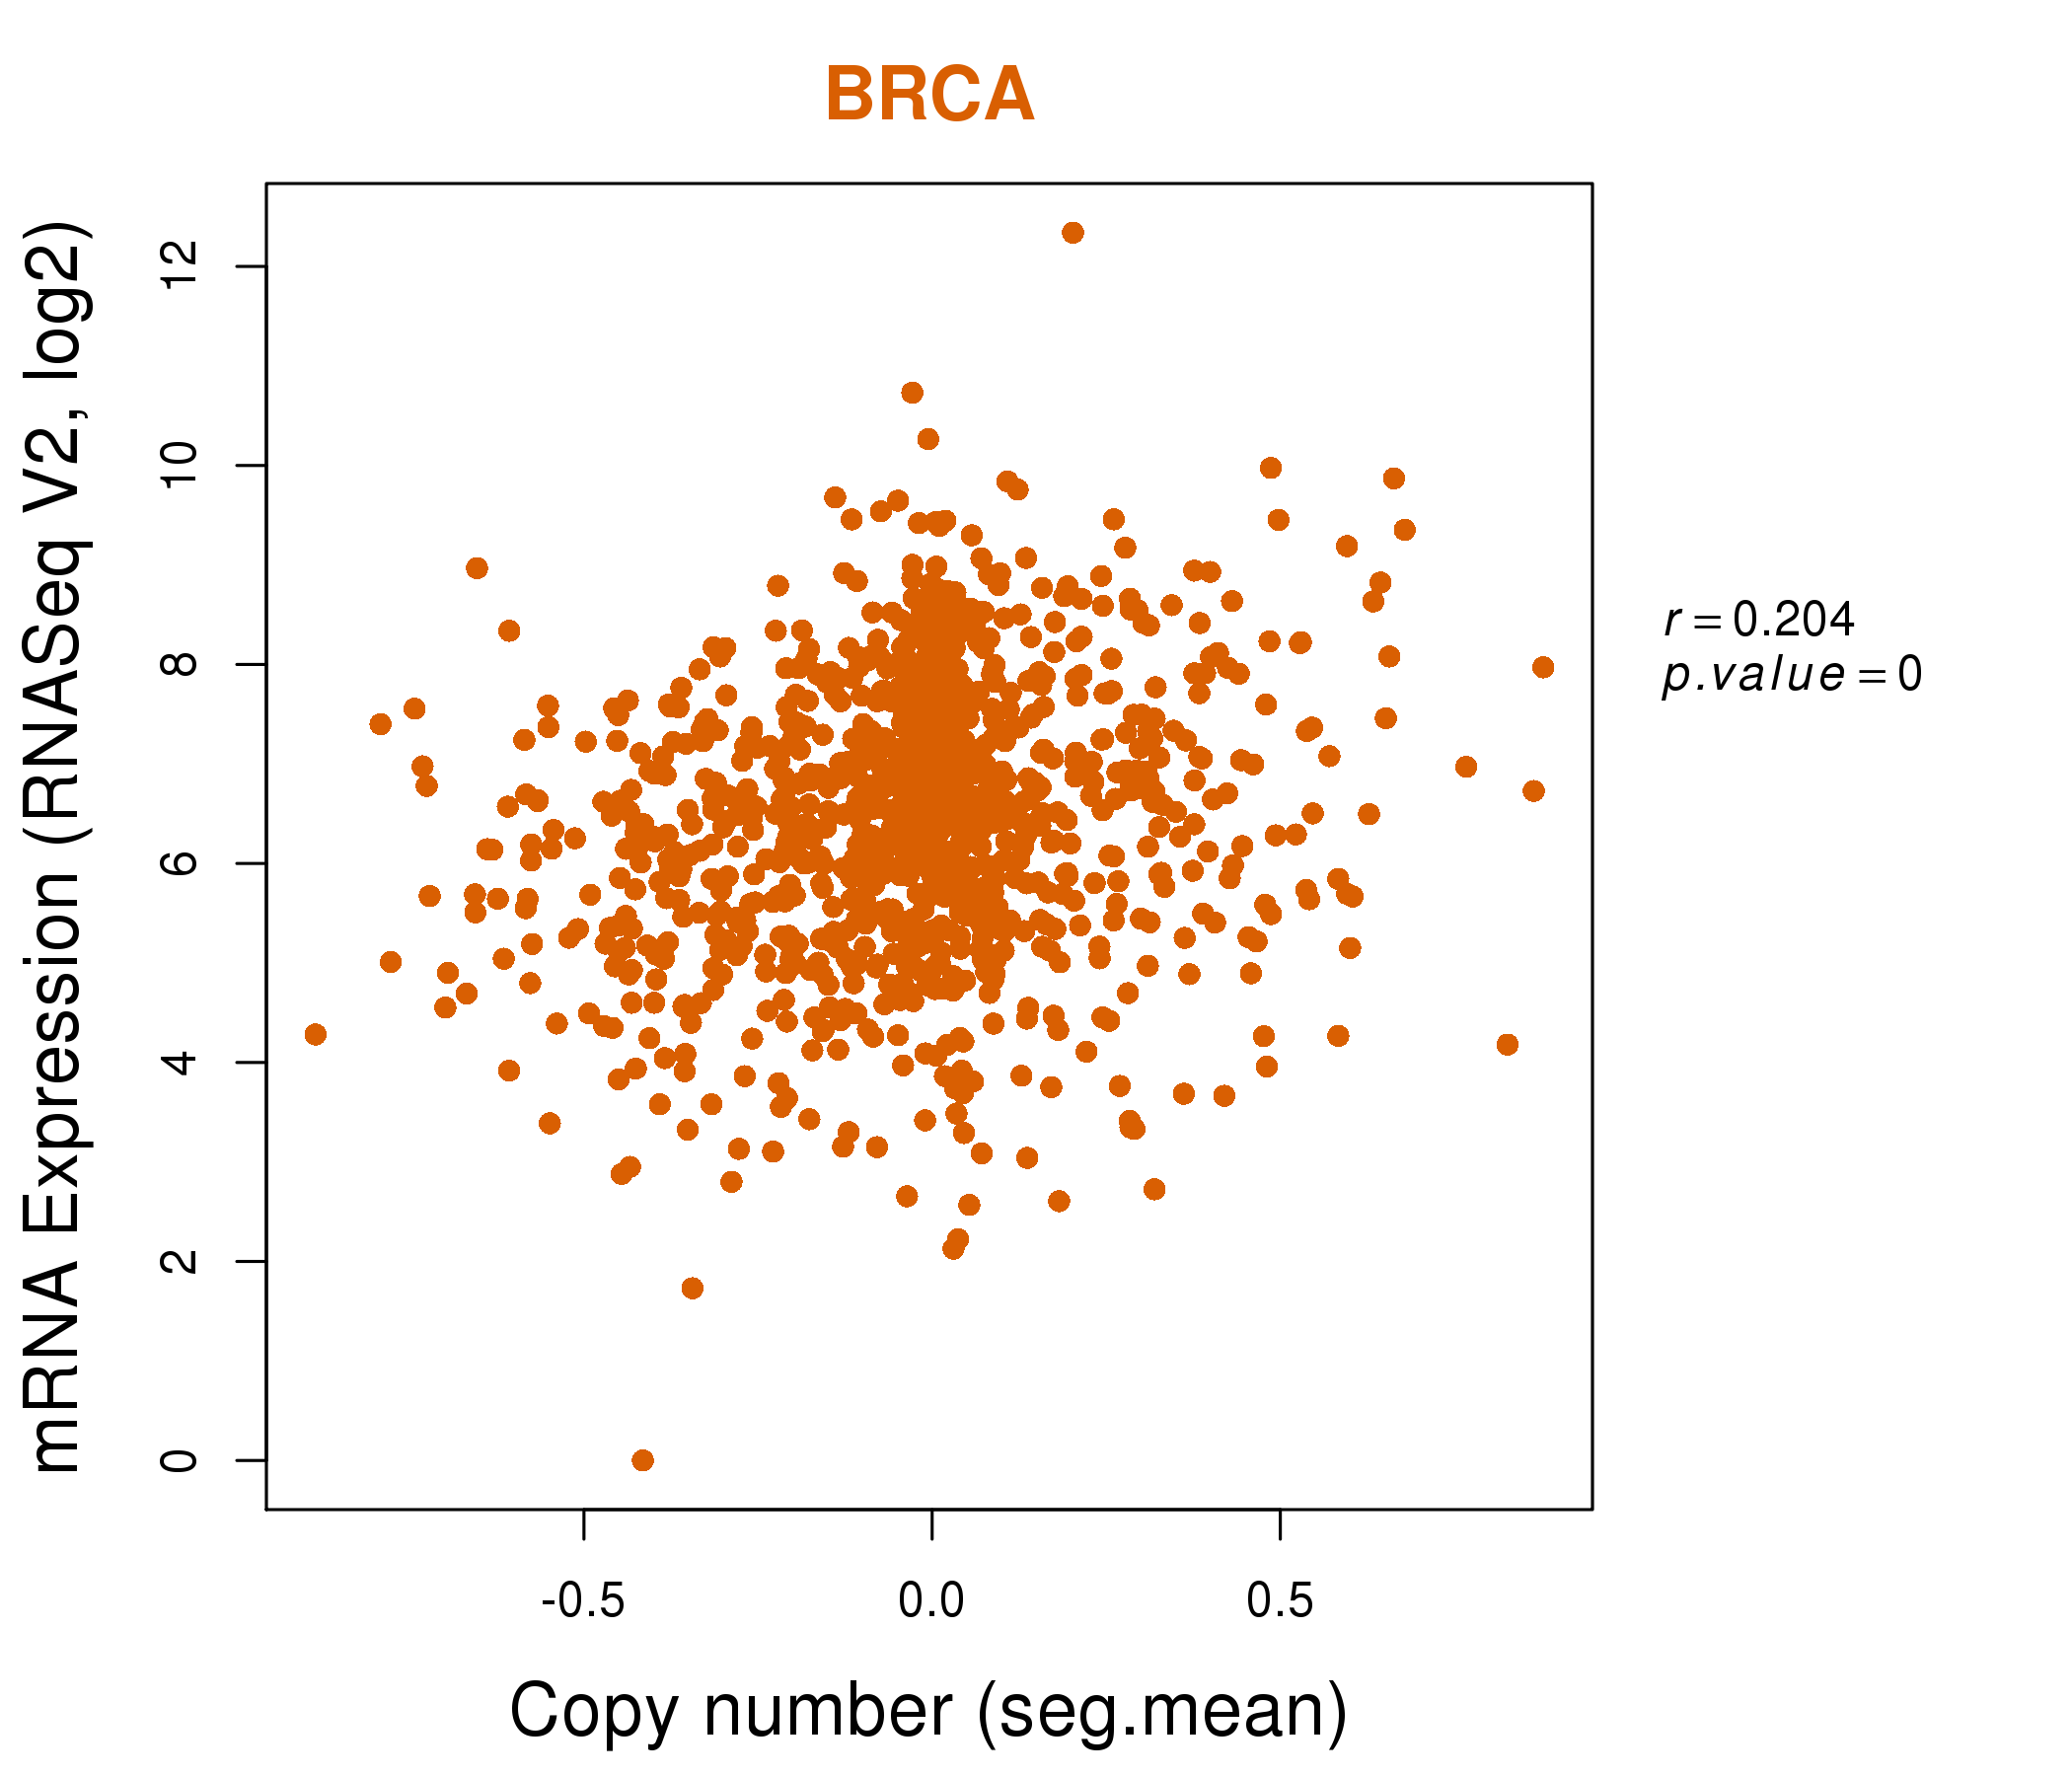
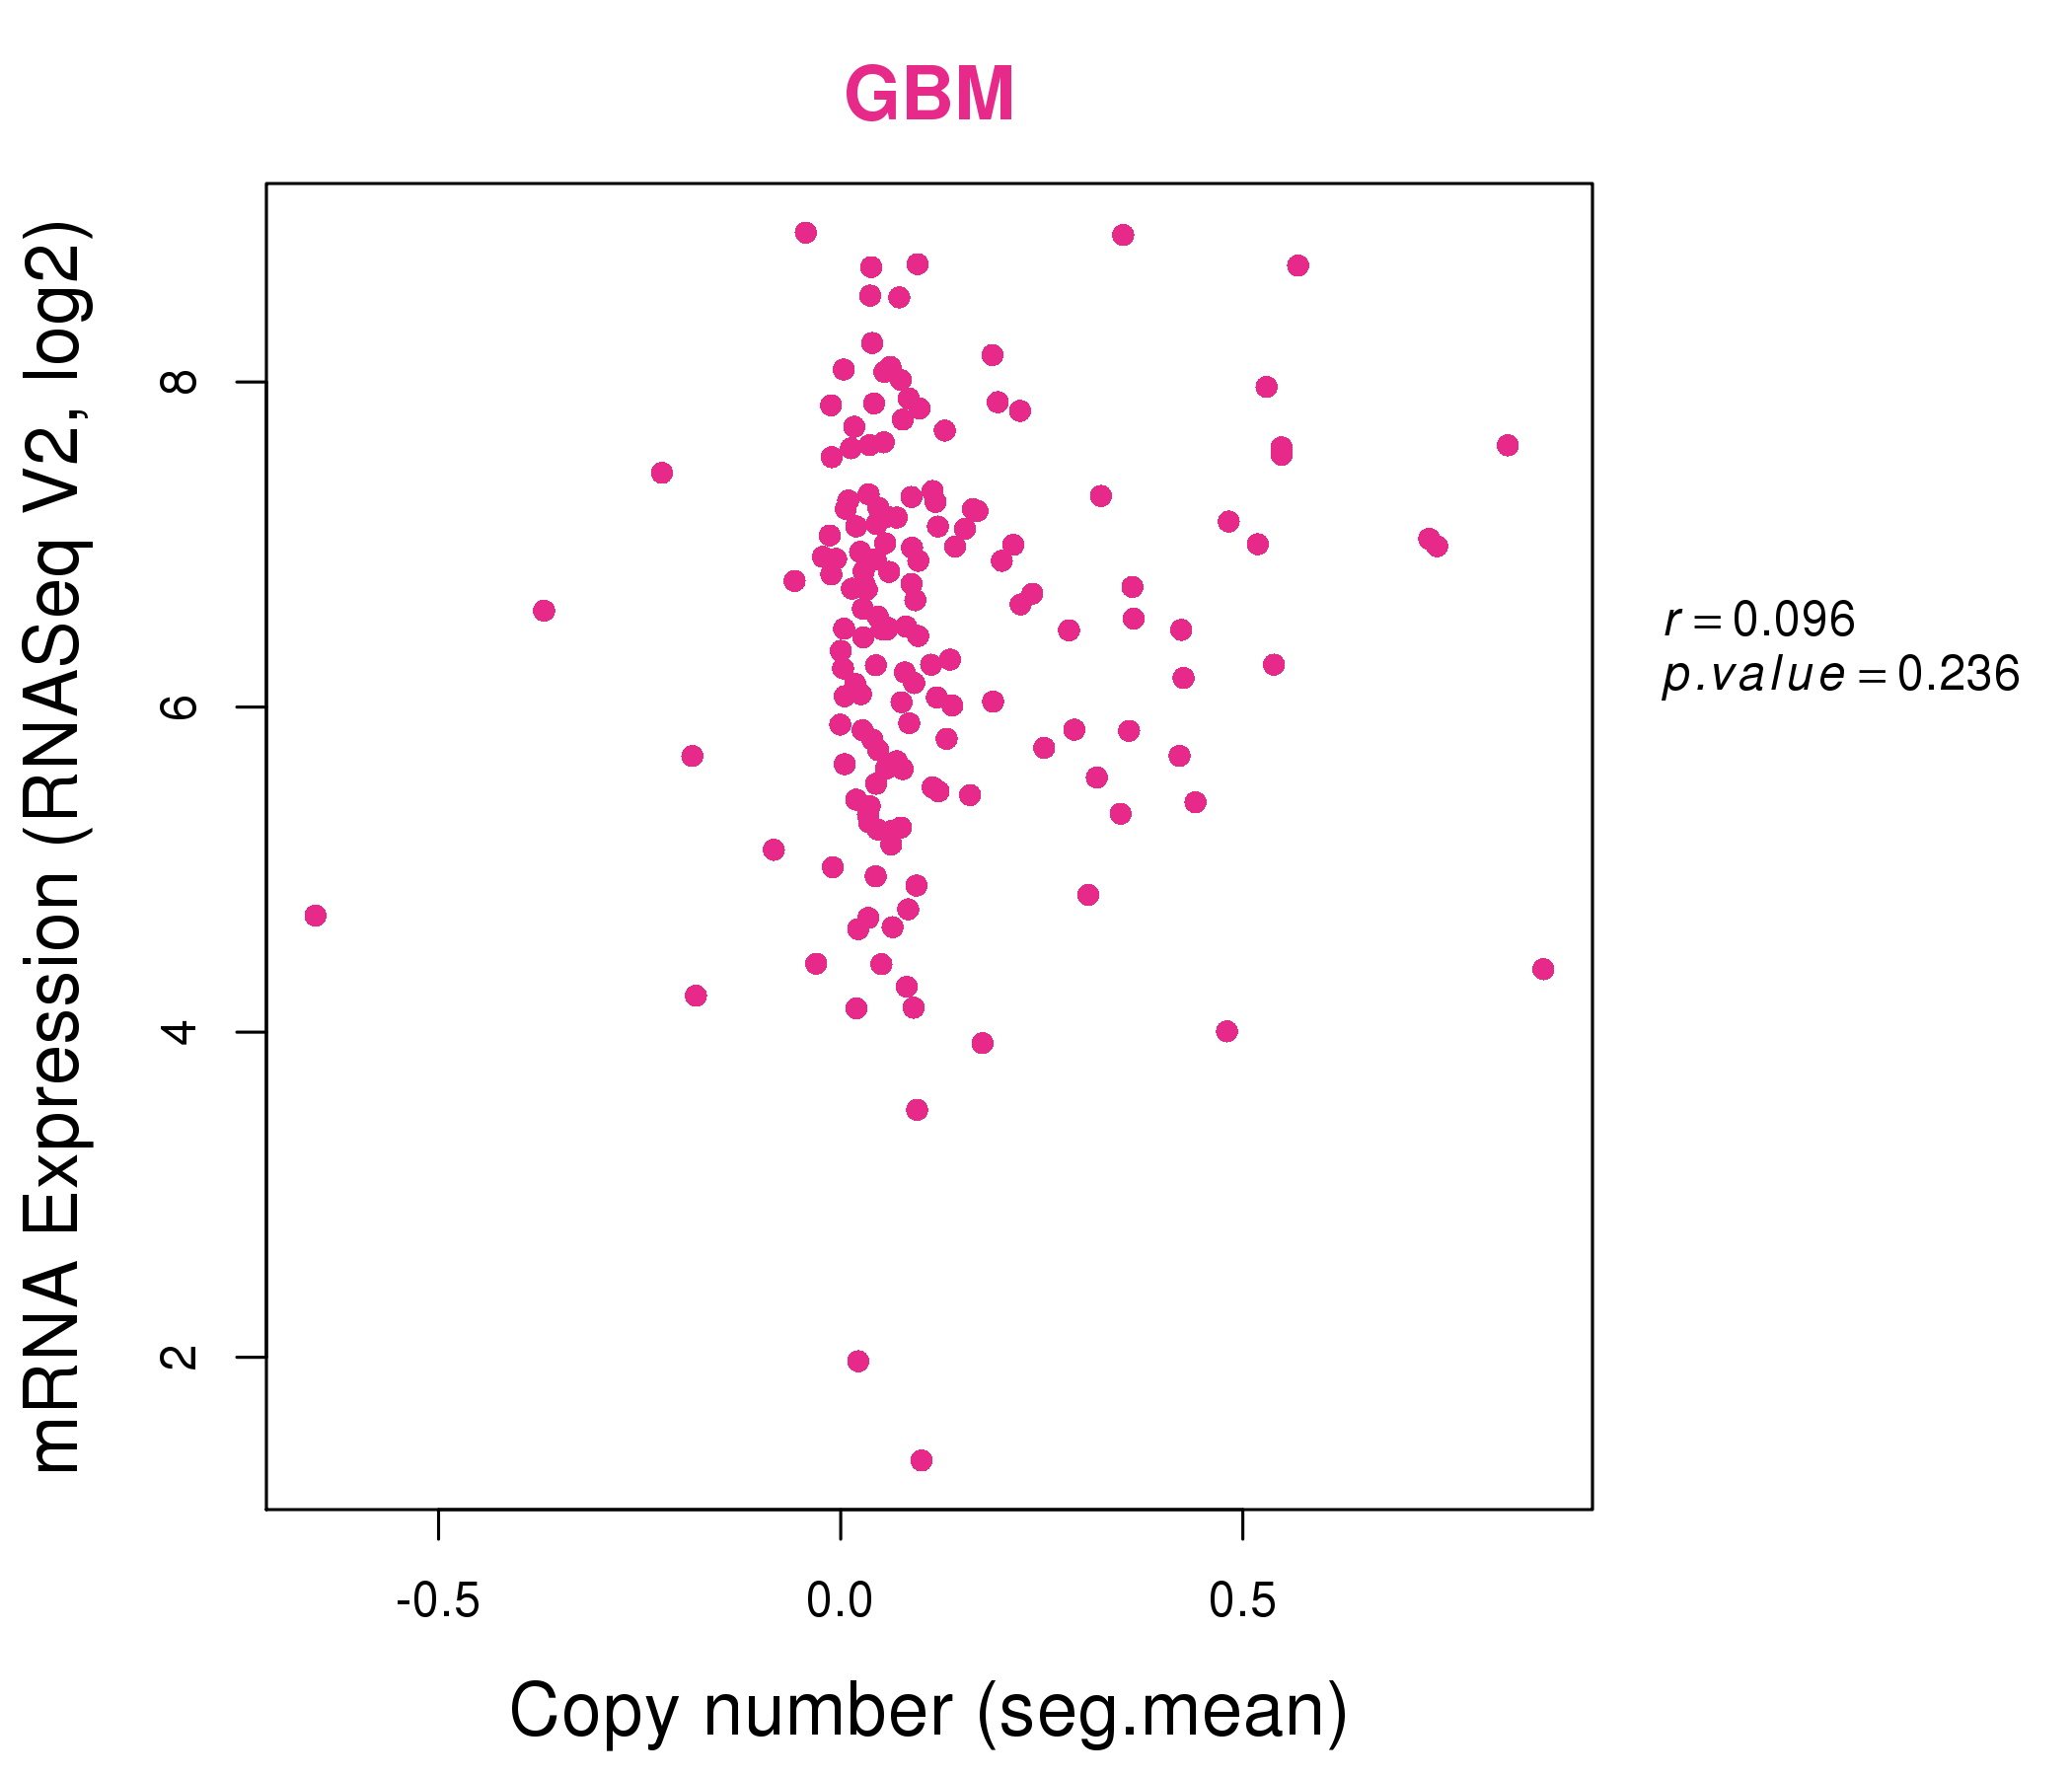
| * This plots show the correlation between CNV and gene expression. |
: Open all plots for all cancer types
 |
|
 |
|
| Top |
| Gene-Gene Network Information |
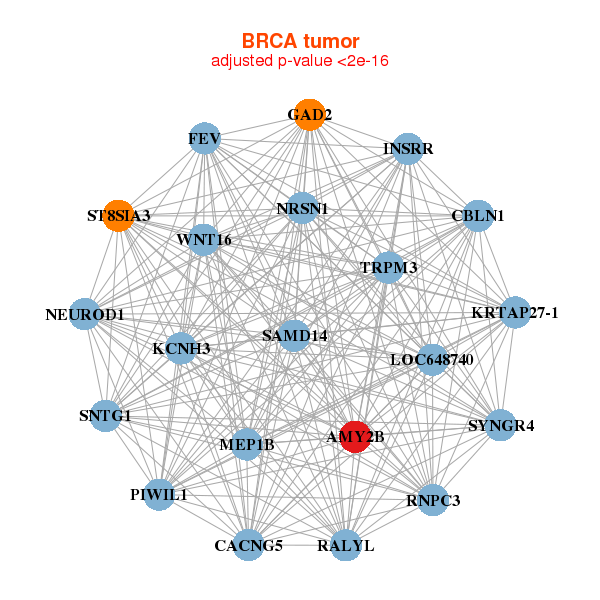
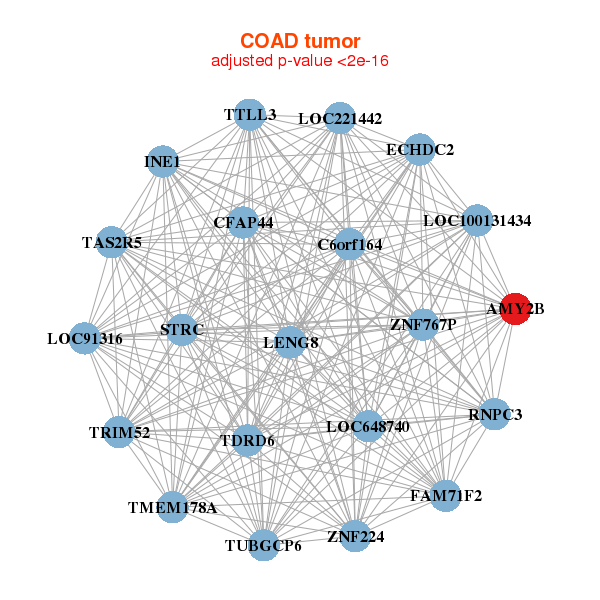
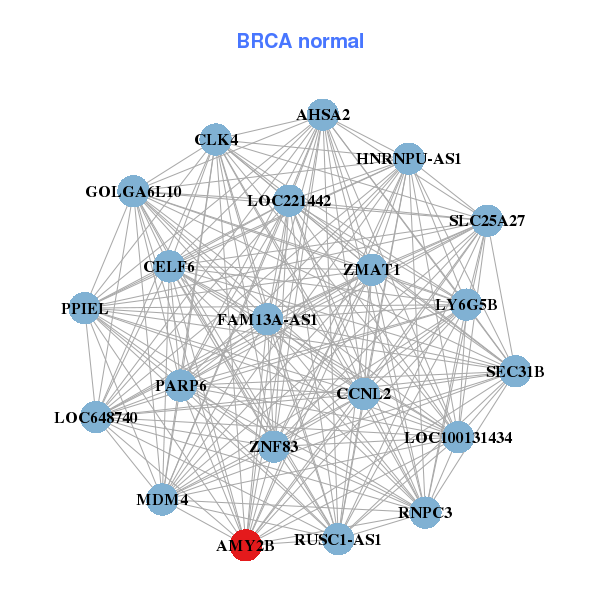
| * Co-Expression network figures were drawn using R package igraph. Only the top 20 genes with the highest correlations were shown. Red circle: input gene, orange circle: cell metabolism gene, sky circle: other gene |
: Open all plots for all cancer types
 |
|
| AMY2B,CACNG5,CBLN1,FEV,GAD2,INSRR,KCNH3, KRTAP27-1,LOC648740,MEP1B,NEUROD1,NRSN1,PIWIL1,RALYL, RNPC3,SAMD14,SNTG1,ST8SIA3,SYNGR4,TRPM3,WNT16 | AHSA2,AMY2B,RUSC1-AS1,CCNL2,CELF6,CLK4,FAM13A-AS1, GOLGA6L10,LOC100131434,LOC221442,LOC648740,LY6G5B,MDM4,HNRNPU-AS1, PARP6,PPIEL,RNPC3,SEC31B,SLC25A27,ZMAT1,ZNF83 |
 |
|
| AMY2B,C6orf164,ECHDC2,FAM71F2,INE1,LENG8,LOC100131434, LOC221442,LOC648740,LOC91316,RNPC3,STRC,TAS2R5,TDRD6, TMEM178A,TRIM52,TTLL3,TUBGCP6,CFAP44,ZNF224,ZNF767P | AGAP4,AHSA2,AMY2B,BMS1P5,MROH7,CCDC39,CCNL2, CHKB-CPT1B,DNAH1,LINC01000,LOC100132247,LOC91316,RBM6,SEC31B, STX16,TBC1D3,TRIM66,TUBGCP6,UCKL1-AS1,VPS13A,ZC3H11A |
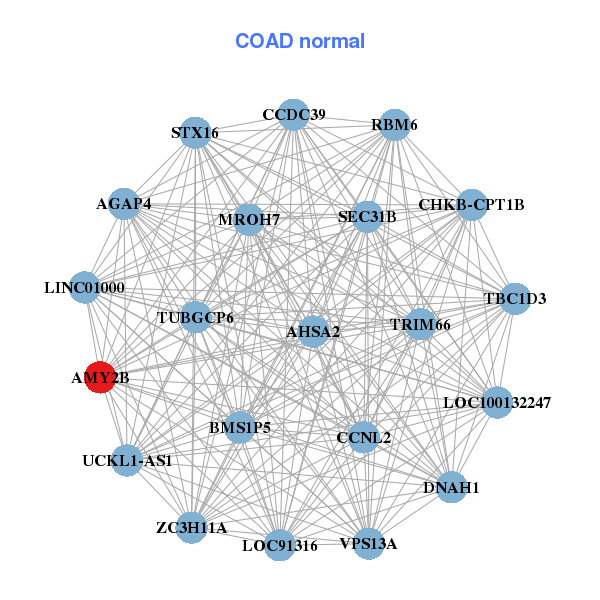
| * Co-Expression network figures were drawn using R package igraph. Only the top 20 genes with the highest correlations were shown. Red circle: input gene, orange circle: cell metabolism gene, sky circle: other gene |
: Open all plots for all cancer types
| Top |
: Open all interacting genes' information including KEGG pathway for all interacting genes from DAVID
| Top |
| Pharmacological Information for AMY2B |
| There's no related Drug. |
| Top |
| Cross referenced IDs for AMY2B |
| * We obtained these cross-references from Uniprot database. It covers 150 different DBs, 18 categories. http://www.uniprot.org/help/cross_references_section |
: Open all cross reference information
|
Copyright © 2016-Present - The Univsersity of Texas Health Science Center at Houston @ |