|
||||||||||||||||||||
| |
| Phenotypic Information (metabolism pathway, cancer, disease, phenome) |
| |
| |
| Gene-Gene Network Information: Co-Expression Network, Interacting Genes & KEGG |
| |
|


| Gene Summary for GOT1 |
| Basic gene info. | Gene symbol | GOT1 |
| Gene name | glutamic-oxaloacetic transaminase 1, soluble | |
| Synonyms | ASTQTL1|GIG18|cAspAT|cCAT | |
| Cytomap | UCSC genome browser: 10q24.1-q25.1 | |
| Genomic location | chr10 :101156626-101190530 | |
| Type of gene | protein-coding | |
| RefGenes | NM_002079.2, | |
| Ensembl id | ENSG00000120053 | |
| Description | aspartate aminotransferase 1aspartate aminotransferase, cytoplasmicaspartate transaminase 1cysteine aminotransferase, cytoplasmiccysteine transaminase, cytoplasmicglutamate oxaloacetate transaminase 1growth-inhibiting protein 18transaminase A | |
| Modification date | 20141207 | |
| dbXrefs | MIM : 138180 | |
| HGNC : HGNC | ||
| Ensembl : ENSG00000120053 | ||
| HPRD : 00687 | ||
| Vega : OTTHUMG00000018882 | ||
| Protein | UniProt: P17174 go to UniProt's Cross Reference DB Table | |
| Expression | CleanEX: HS_GOT1 | |
| BioGPS: 2805 | ||
| Gene Expression Atlas: ENSG00000120053 | ||
| The Human Protein Atlas: ENSG00000120053 | ||
| Pathway | NCI Pathway Interaction Database: GOT1 | |
| KEGG: GOT1 | ||
| REACTOME: GOT1 | ||
| ConsensusPathDB | ||
| Pathway Commons: GOT1 | ||
| Metabolism | MetaCyc: GOT1 | |
| HUMANCyc: GOT1 | ||
| Regulation | Ensembl's Regulation: ENSG00000120053 | |
| miRBase: chr10 :101,156,626-101,190,530 | ||
| TargetScan: NM_002079 | ||
| cisRED: ENSG00000120053 | ||
| Context | iHOP: GOT1 | |
| cancer metabolism search in PubMed: GOT1 | ||
| UCL Cancer Institute: GOT1 | ||
| Assigned class in ccmGDB | A - This gene has a literature evidence and it belongs to cancer gene. | |
| References showing role of GOT1 in cancer cell metabolism | 1. Jiang X, Chang H, Zhou Y (2015) Expression, purification and preliminary crystallographic studies of human glutamate oxaloacetate transaminase 1 (GOT1). Protein Expr Purif 113: 102-106. doi: 10.1016/j.pep.2015.05.010. go to article 2. Chakrabarti G (2015) Mutant KRAS associated malic enzyme 1 expression is a predictive marker for radiation therapy response in non-small cell lung cancer. Radiat Oncol 10: 145. doi: 10.1186/s13014-015-0457-x. pmid: 4502640. go to article | |
| Top |
| Phenotypic Information for GOT1(metabolism pathway, cancer, disease, phenome) |
| Cancer | CGAP: GOT1 |
| Familial Cancer Database: GOT1 | |
| * This gene is included in those cancer gene databases. |
|
|
|
|
|
|
| ||||||||||||||
Oncogene 1 | Significant driver gene in CRC 6, | |||||||||||||||||||
| cf) number; DB name 1 Oncogene; http://nar.oxfordjournals.org/content/35/suppl_1/D721.long, 2 Tumor Suppressor gene; https://bioinfo.uth.edu/TSGene/, 3 Cancer Gene Census; http://www.nature.com/nrc/journal/v4/n3/abs/nrc1299.html, 4 CancerGenes; http://nar.oxfordjournals.org/content/35/suppl_1/D721.long, 5 Network of Cancer Gene; http://ncg.kcl.ac.uk/index.php, 6 http://www.nature.com/nature/journal/v505/n7484/full/nature12912.html, 7Therapeutic Vulnerabilities in Cancer; http://cbio.mskcc.org/cancergenomics/statius/ |
| KEGG_ALANINE_ASPARTATE_AND_GLUTAMATE_METABOLISM KEGG_CYSTEINE_AND_METHIONINE_METABOLISM KEGG_ARGININE_AND_PROLINE_METABOLISM KEGG_TYROSINE_METABOLISM KEGG_PHENYLALANINE_METABOLISM REACTOME_SULFUR_AMINO_ACID_METABOLISM REACTOME_METABOLISM_OF_AMINO_ACIDS_AND_DERIVATIVES REACTOME_METABOLISM_OF_POLYAMINES REACTOME_METABOLISM_OF_CARBOHYDRATES REACTOME_GLUCOSE_METABOLISM | |
| OMIM | 138180; gene. 614419; phenotype. |
| Orphanet | |
| Disease | KEGG Disease: GOT1 |
| MedGen: GOT1 (Human Medical Genetics with Condition) | |
| ClinVar: GOT1 | |
| Phenotype | MGI: GOT1 (International Mouse Phenotyping Consortium) |
| PhenomicDB: GOT1 | |
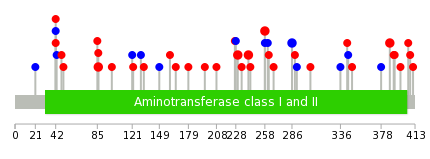
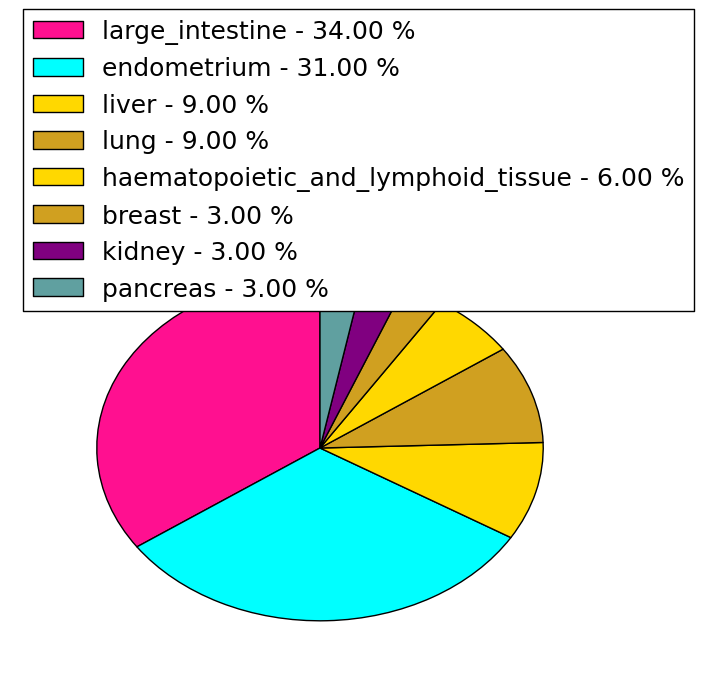
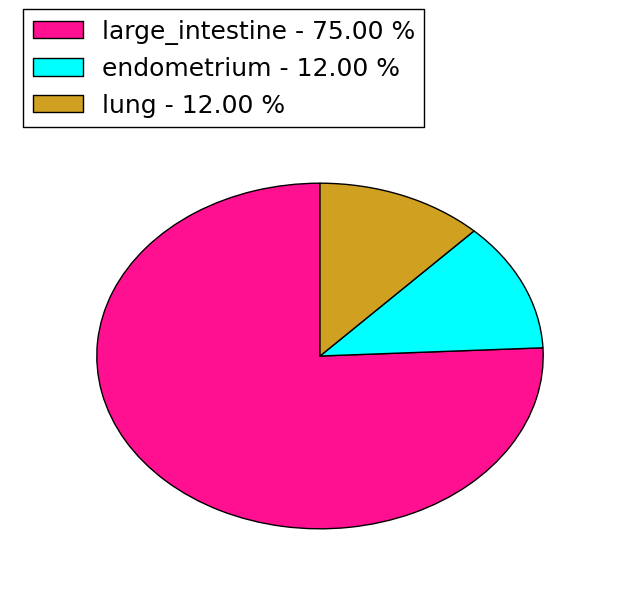
| Mutations for GOT1 |
| * Under tables are showing count per each tissue to give us broad intuition about tissue specific mutation patterns.You can go to the detailed page for each mutation database's web site. |
| There's no structural variation information in COSMIC data for this gene. |
| * From mRNA Sanger sequences, Chitars2.0 arranged chimeric transcripts. This table shows GOT1 related fusion information. |
| ID | Head Gene | Tail Gene | Accession | Gene_a | qStart_a | qEnd_a | Chromosome_a | tStart_a | tEnd_a | Gene_a | qStart_a | qEnd_a | Chromosome_a | tStart_a | tEnd_a |
| AI114691 | GOT1 | 30 | 319 | 10 | 101180445 | 101190377 | FABP1 | 304 | 643 | 2 | 88424050 | 88427579 | |
| Top |
| There's no copy number variation information in COSMIC data for this gene. |
| Top |
|
 |
| Top |
| Stat. for Non-Synonymous SNVs (# total SNVs=32) | (# total SNVs=8) |
 |  |
(# total SNVs=1) | (# total SNVs=0) |
 |
| Top |
| * When you move the cursor on each content, you can see more deailed mutation information on the Tooltip. Those are primary_site,primary_histology,mutation(aa),pubmedID. |
| GRCh37 position | Mutation(aa) | Unique sampleID count |
| chr10:101163327-101163327 | p.S286S | 2 |
| chr10:101163586-101163586 | p.A230T | 2 |
| chr10:101157386-101157386 | p.R387Q | 2 |
| chr10:101163356-101163356 | p.E277* | 2 |
| chr10:101163595-101163595 | p.Q227* | 2 |
| chr10:101180424-101180424 | p.R86H | 2 |
| chr10:101163500-101163501 | p.S258F | 2 |
| chr10:101163552-101163552 | p.I241S | 2 |
| chr10:101180555-101180555 | p.R42R | 1 |
| chr10:101166543-101166543 | p.R122C | 1 |
| Top |
|
 |
| Point Mutation/ Tissue ID | 1 | 2 | 3 | 4 | 5 | 6 | 7 | 8 | 9 | 10 | 11 | 12 | 13 | 14 | 15 | 16 | 17 | 18 | 19 | 20 |
| # sample | 8 | 3 | 3 | 2 | 1 | 6 | 4 | 6 | ||||||||||||
| # mutation | 9 | 3 | 4 | 2 | 1 | 6 | 4 | 10 | ||||||||||||
| nonsynonymous SNV | 5 | 1 | 3 | 1 | 1 | 4 | 3 | 9 | ||||||||||||
| synonymous SNV | 4 | 2 | 1 | 1 | 2 | 1 | 1 |
| cf) Tissue ID; Tissue type (1; BLCA[Bladder Urothelial Carcinoma], 2; BRCA[Breast invasive carcinoma], 3; CESC[Cervical squamous cell carcinoma and endocervical adenocarcinoma], 4; COAD[Colon adenocarcinoma], 5; GBM[Glioblastoma multiforme], 6; Glioma Low Grade, 7; HNSC[Head and Neck squamous cell carcinoma], 8; KICH[Kidney Chromophobe], 9; KIRC[Kidney renal clear cell carcinoma], 10; KIRP[Kidney renal papillary cell carcinoma], 11; LAML[Acute Myeloid Leukemia], 12; LUAD[Lung adenocarcinoma], 13; LUSC[Lung squamous cell carcinoma], 14; OV[Ovarian serous cystadenocarcinoma ], 15; PAAD[Pancreatic adenocarcinoma], 16; PRAD[Prostate adenocarcinoma], 17; SKCM[Skin Cutaneous Melanoma], 18:STAD[Stomach adenocarcinoma], 19:THCA[Thyroid carcinoma], 20:UCEC[Uterine Corpus Endometrial Carcinoma]) |
| Top |
| * We represented just top 10 SNVs. When you move the cursor on each content, you can see more deailed mutation information on the Tooltip. Those are primary_site, primary_histology, mutation(aa), pubmedID. |
| Genomic Position | Mutation(aa) | Unique sampleID count |
| chr10:101180424 | p.R86H | 2 |
| chr10:101163586 | p.G262W | 2 |
| chr10:101163490 | p.A230T | 2 |
| chr10:101163491 | p.S336S | 1 |
| chr10:101165933 | p.K214T | 1 |
| chr10:101157412 | p.I291I | 1 |
| chr10:101163500 | p.Q208H | 1 |
| chr10:101166509 | p.E289K | 1 |
| chr10:101162407 | p.E179K | 1 |
| chr10:101163503 | p.Q287Q | 1 |
| * Copy number data were extracted from TCGA using R package TCGA-Assembler. The URLs of all public data files on TCGA DCC data server were gathered on Jan-05-2015. Function ProcessCNAData in TCGA-Assembler package was used to obtain gene-level copy number value which is calculated as the average copy number of the genomic region of a gene. |
 |
| cf) Tissue ID[Tissue type]: BLCA[Bladder Urothelial Carcinoma], BRCA[Breast invasive carcinoma], CESC[Cervical squamous cell carcinoma and endocervical adenocarcinoma], COAD[Colon adenocarcinoma], GBM[Glioblastoma multiforme], Glioma Low Grade, HNSC[Head and Neck squamous cell carcinoma], KICH[Kidney Chromophobe], KIRC[Kidney renal clear cell carcinoma], KIRP[Kidney renal papillary cell carcinoma], LAML[Acute Myeloid Leukemia], LUAD[Lung adenocarcinoma], LUSC[Lung squamous cell carcinoma], OV[Ovarian serous cystadenocarcinoma ], PAAD[Pancreatic adenocarcinoma], PRAD[Prostate adenocarcinoma], SKCM[Skin Cutaneous Melanoma], STAD[Stomach adenocarcinoma], THCA[Thyroid carcinoma], UCEC[Uterine Corpus Endometrial Carcinoma] |
| Top |
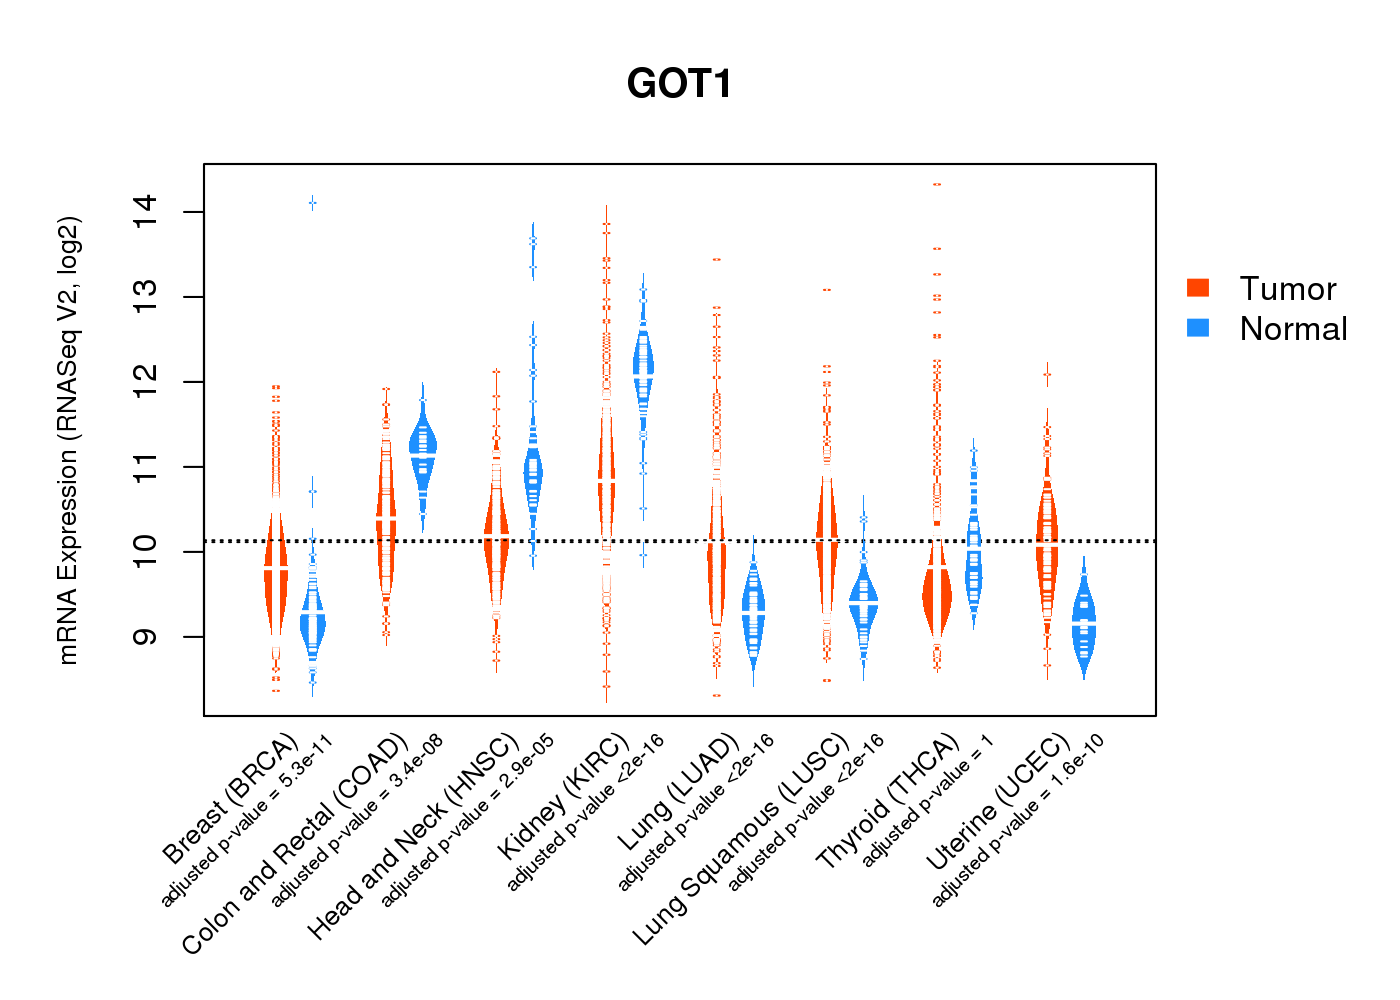
| Gene Expression for GOT1 |
| * CCLE gene expression data were extracted from CCLE_Expression_Entrez_2012-10-18.res: Gene-centric RMA-normalized mRNA expression data. |
 |
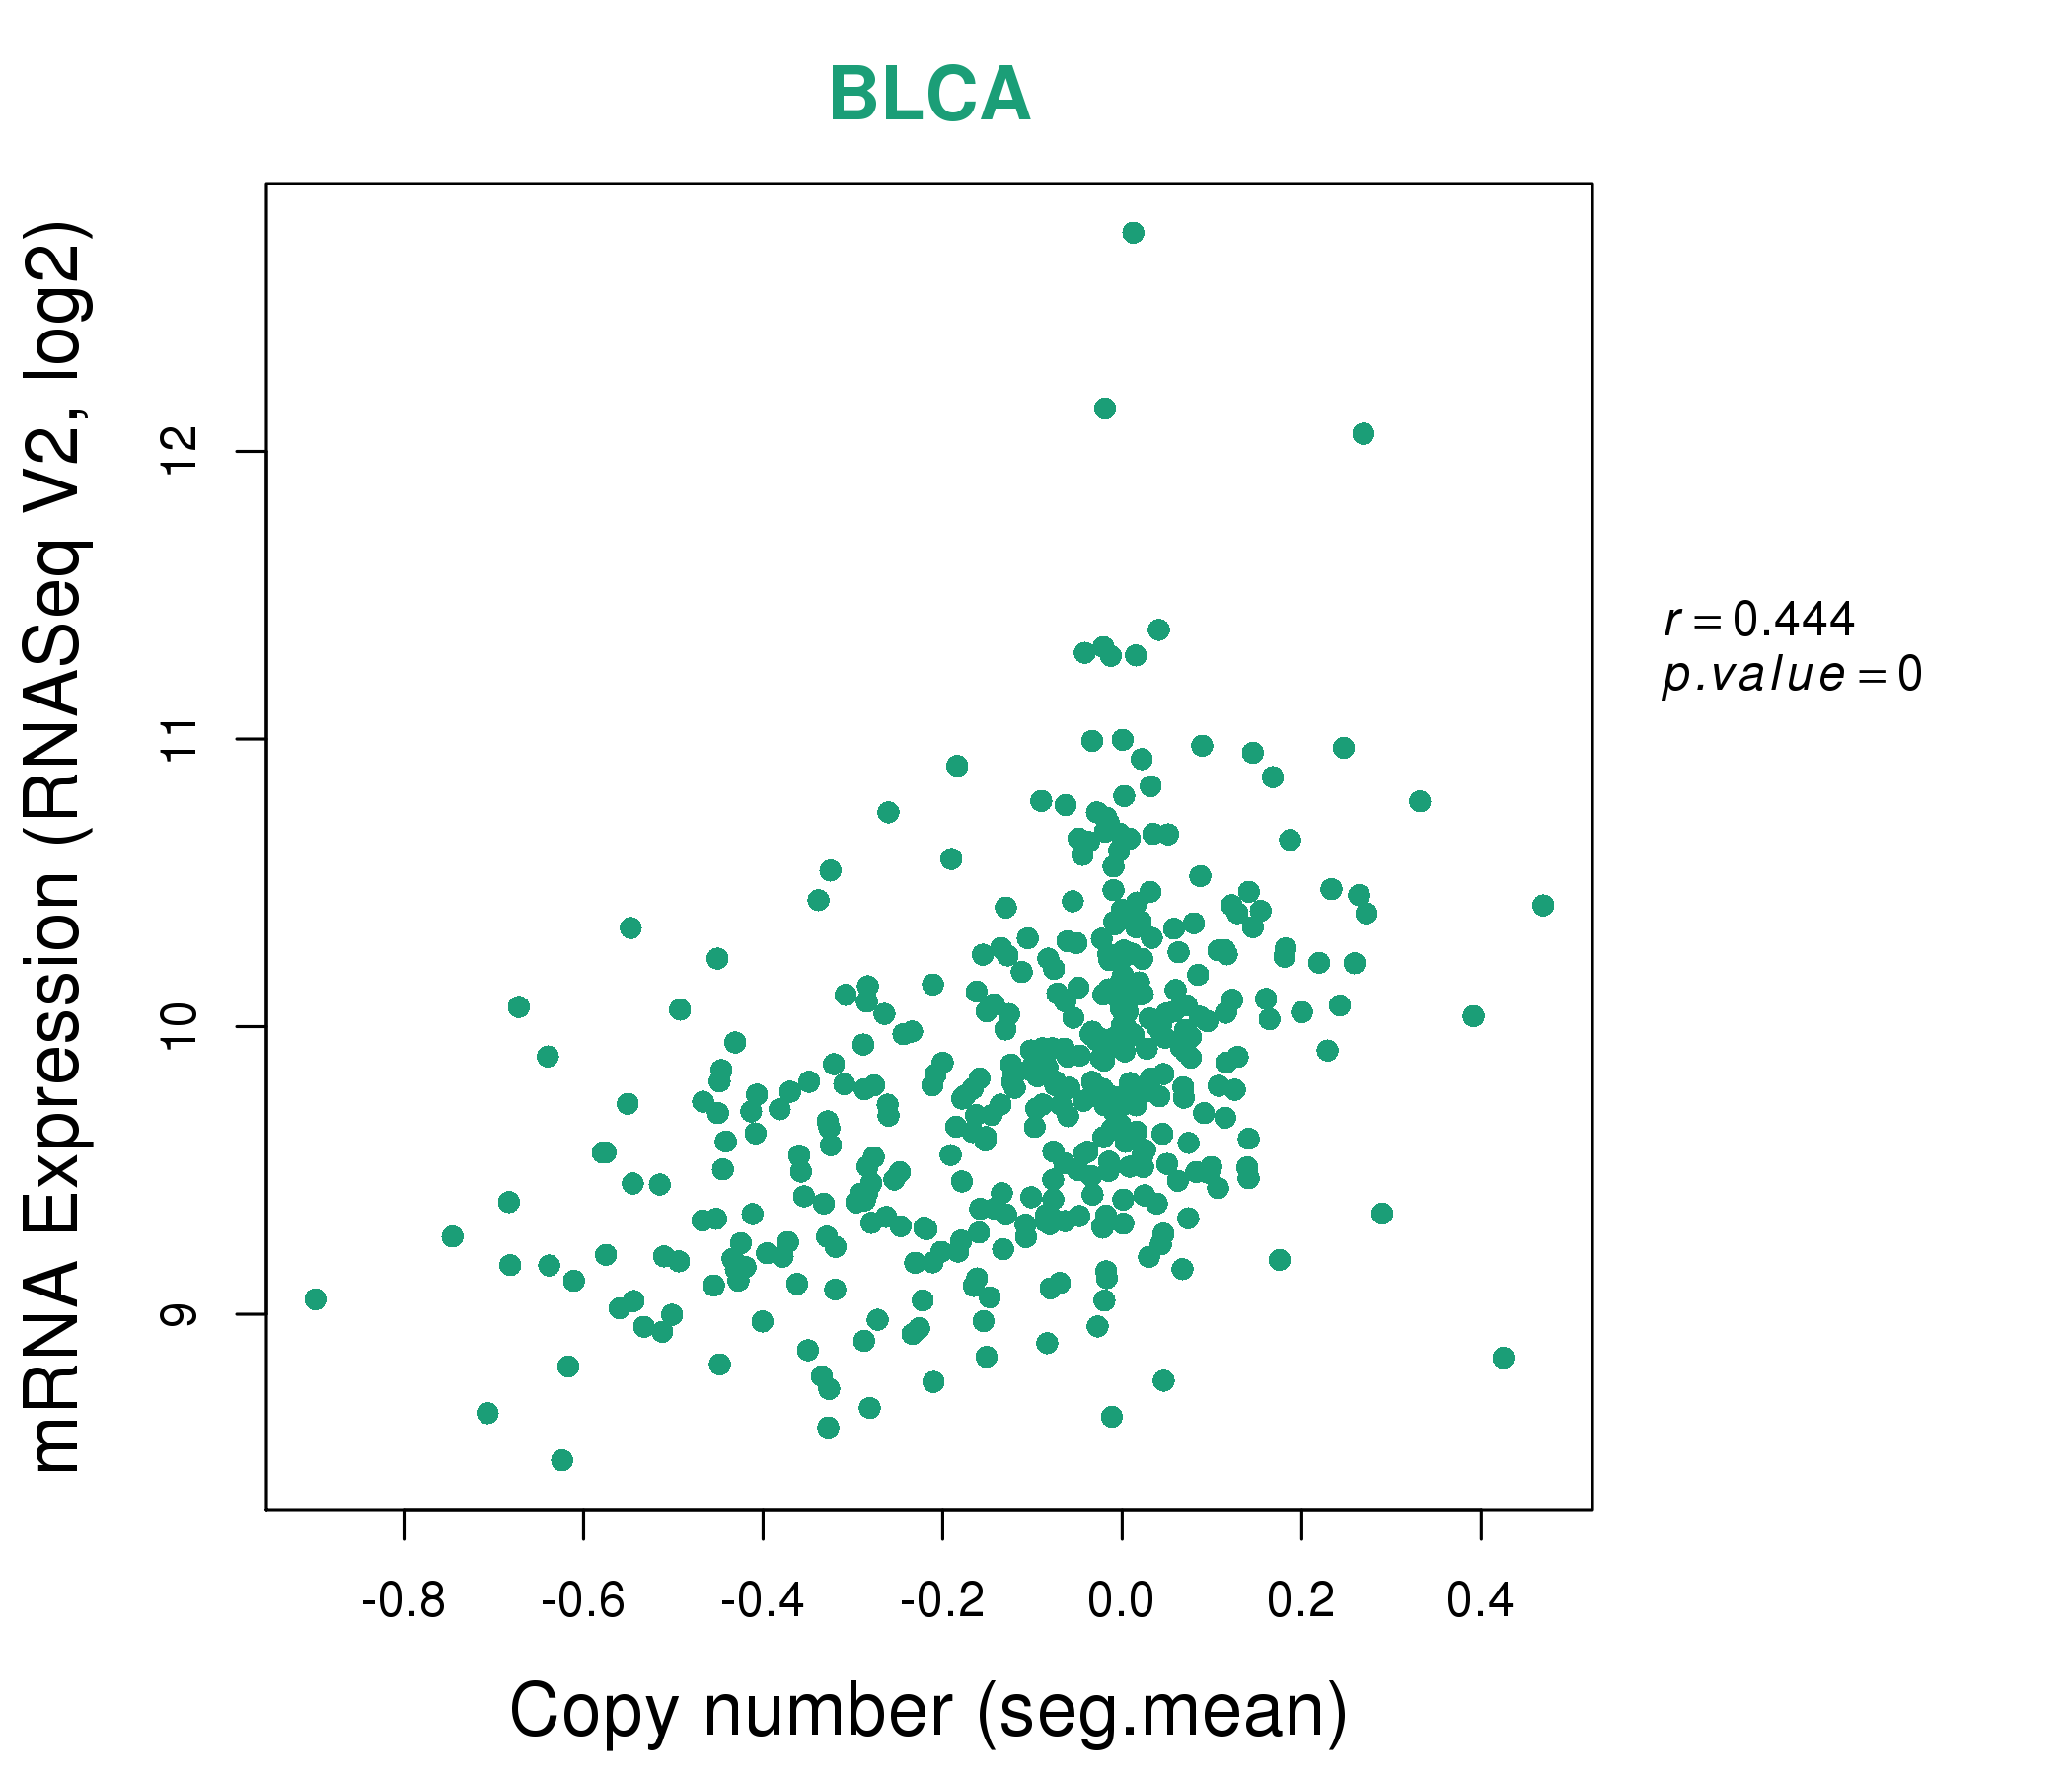
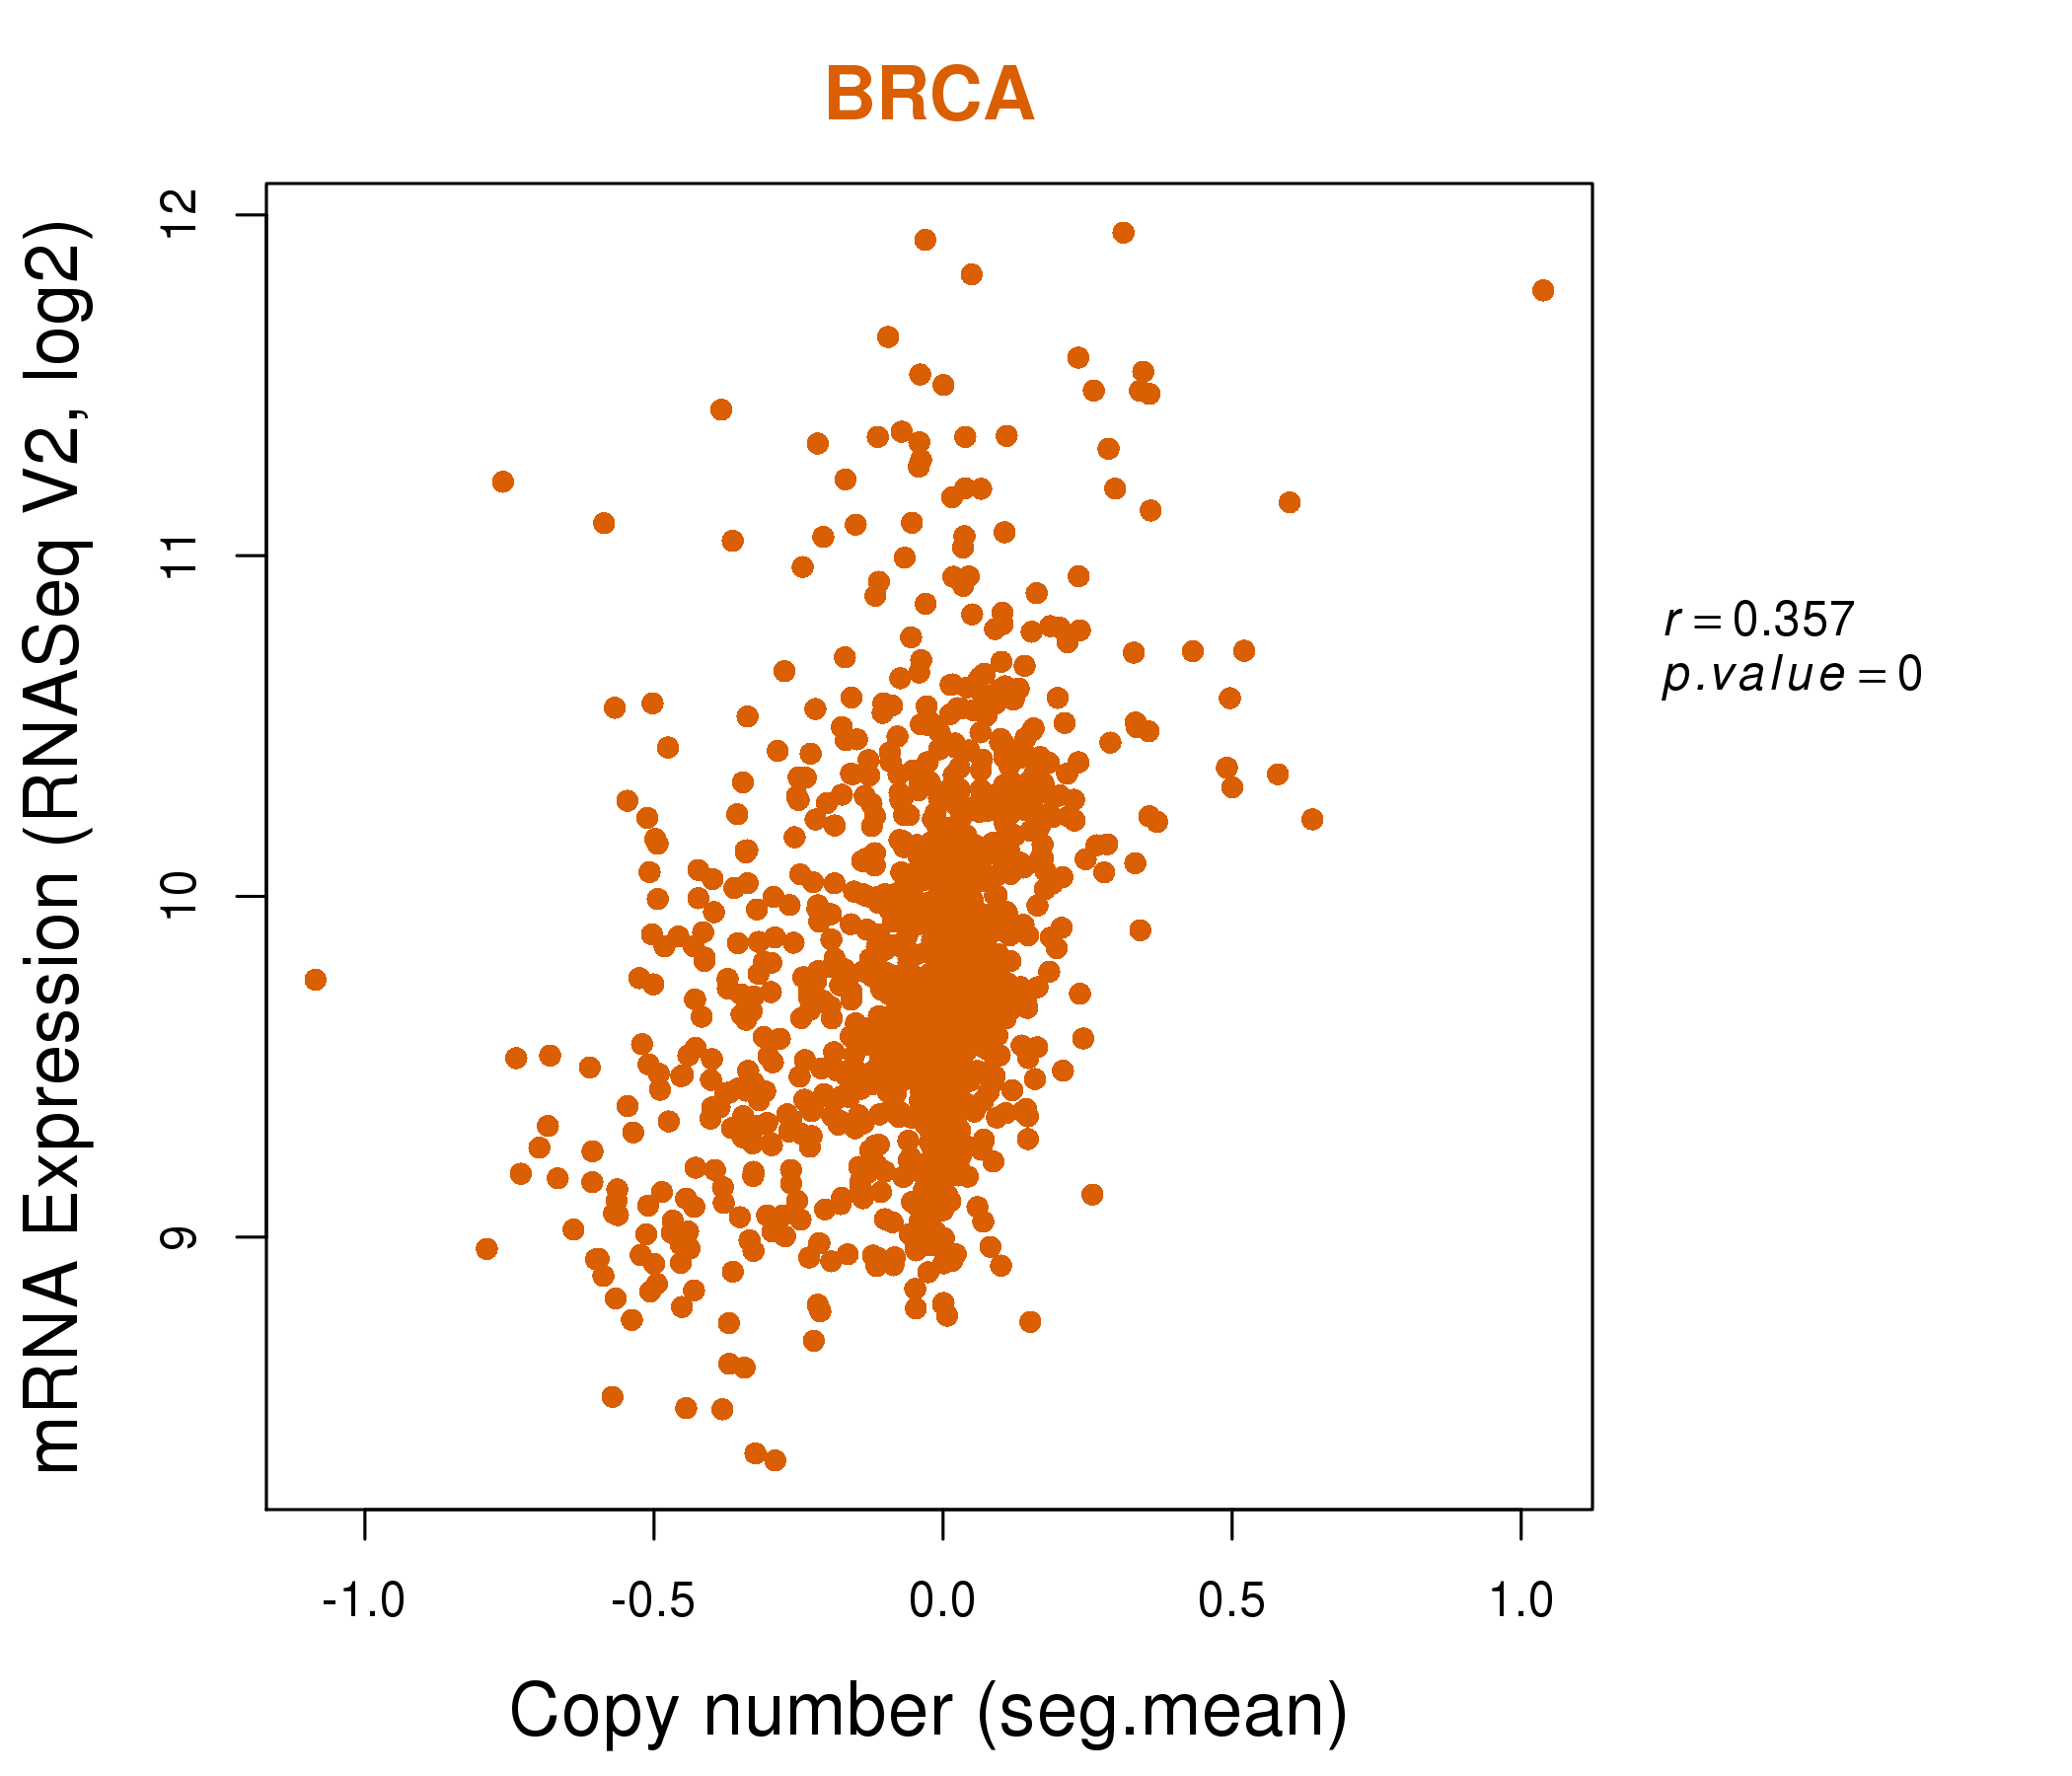
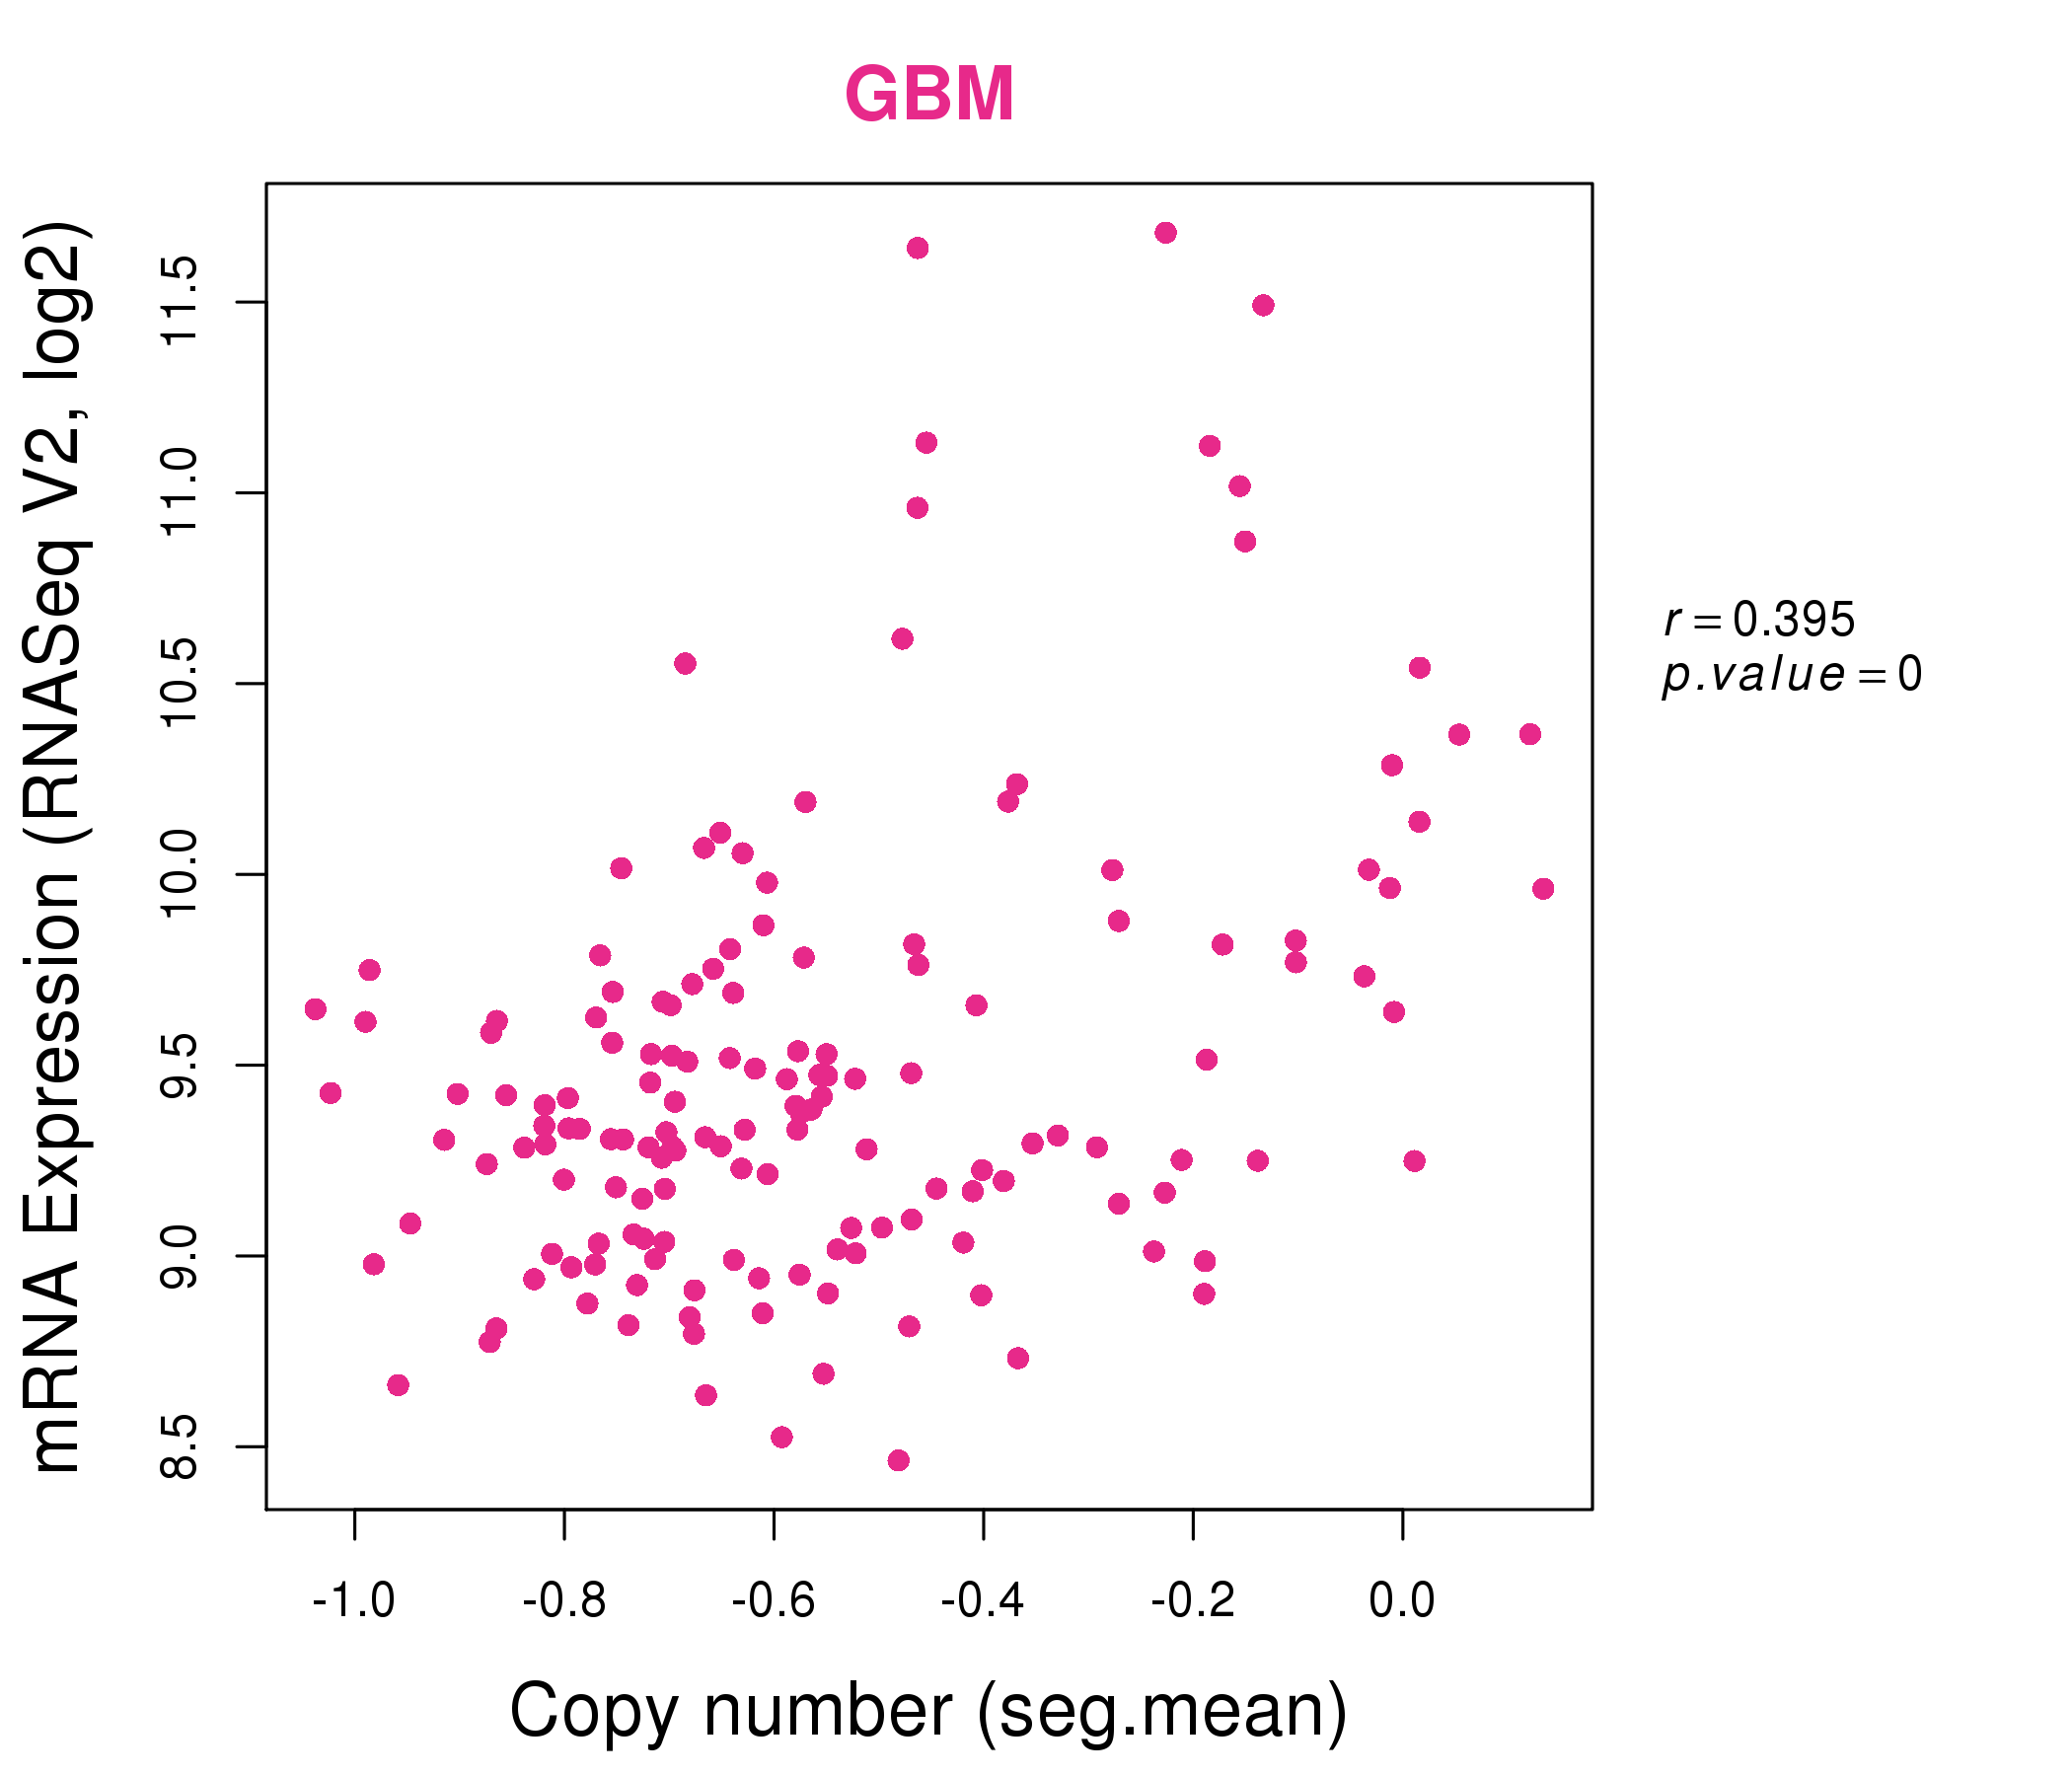
| * Normalized gene expression data of RNASeqV2 was extracted from TCGA using R package TCGA-Assembler. The URLs of all public data files on TCGA DCC data server were gathered at Jan-05-2015. Only eight cancer types have enough normal control samples for differential expression analysis. (t test, adjusted p<0.05 (using Benjamini-Hochberg FDR)) |
 |
| Top |
| * This plots show the correlation between CNV and gene expression. |
: Open all plots for all cancer types
 |
|
 |
|
| Top |
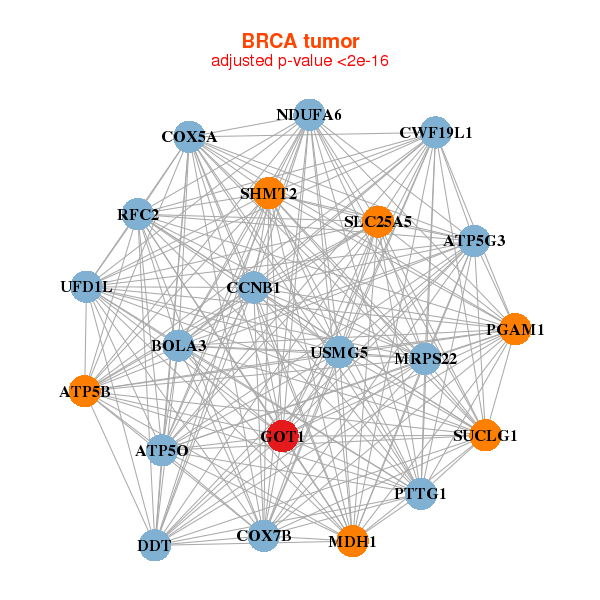
| Gene-Gene Network Information |
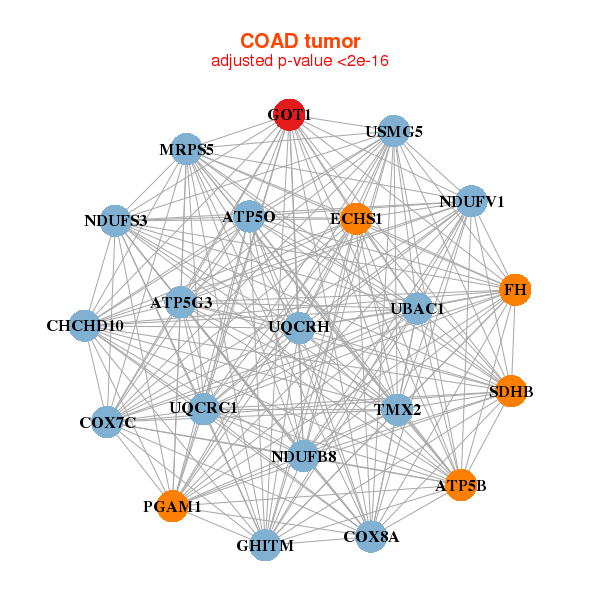
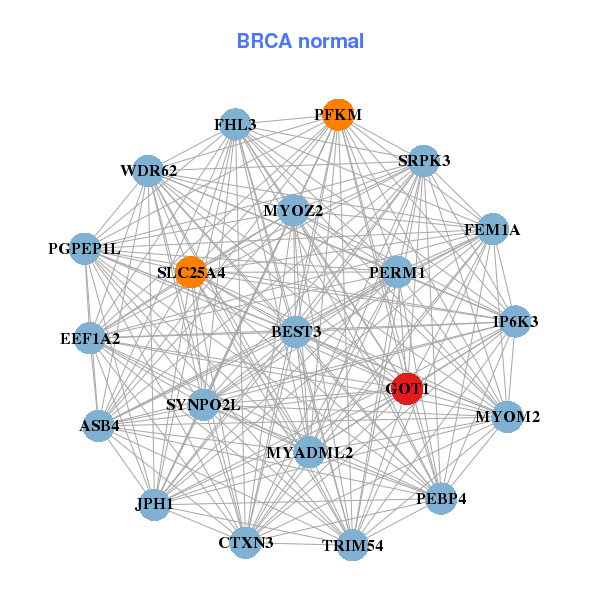
| * Co-Expression network figures were drawn using R package igraph. Only the top 20 genes with the highest correlations were shown. Red circle: input gene, orange circle: cell metabolism gene, sky circle: other gene |
: Open all plots for all cancer types
 |
| ||||
| ATP5B,ATP5G3,ATP5O,BOLA3,CCNB1,COX5A,COX7B, CWF19L1,DDT,GOT1,MDH1,MRPS22,NDUFA6,PGAM1, PTTG1,RFC2,SHMT2,SLC25A5,SUCLG1,UFD1L,USMG5 | ASB4,BEST3,PERM1,CTXN3,EEF1A2,FEM1A,FHL3, GOT1,IP6K3,JPH1,MYADML2,MYOM2,MYOZ2,PEBP4, PFKM,PGPEP1L,SLC25A4,SRPK3,SYNPO2L,TRIM54,WDR62 | ||||
 |
| ||||
| ATP5B,ATP5G3,ATP5O,CHCHD10,COX7C,COX8A,ECHS1, FH,GHITM,GOT1,MRPS5,NDUFB8,NDUFS3,NDUFV1, PGAM1,SDHB,TMX2,UBAC1,UQCRC1,UQCRH,USMG5 | APEH,ATP5A1,ATP5B,DARS2,DLAT,FAR2,FASTKD1, FH,GOT1,GSS,MIPEP,MRRF,PDHA1,PDSS2, RTN4IP1,SLC25A10,SLC35A4,SUPV3L1,TBRG4,TTLL12,TUFM |
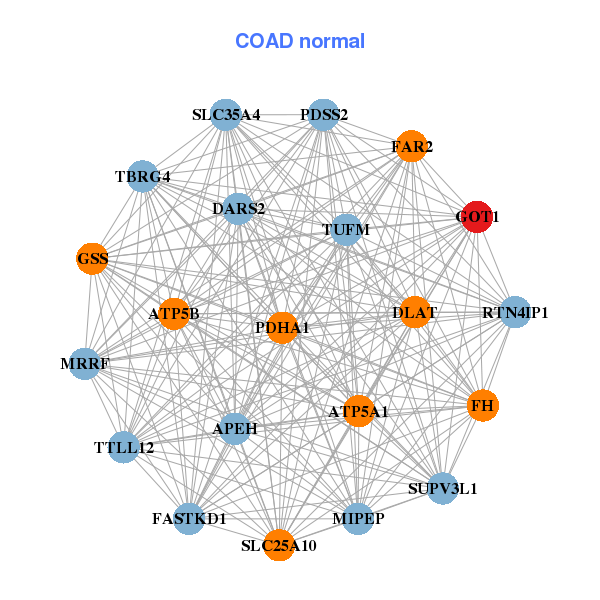
| * Co-Expression network figures were drawn using R package igraph. Only the top 20 genes with the highest correlations were shown. Red circle: input gene, orange circle: cell metabolism gene, sky circle: other gene |
: Open all plots for all cancer types
| Top |
: Open all interacting genes' information including KEGG pathway for all interacting genes from DAVID
| Top |
| Pharmacological Information for GOT1 |
| DB Category | DB Name | DB's ID and Url link |
| Chemistry | ChEMBL | CHEMBL2189139; -. |
| Organism-specific databases | PharmGKB | PA28817; -. |
| Organism-specific databases | CTD | 2805; -. |
| * Gene Centered Interaction Network. |
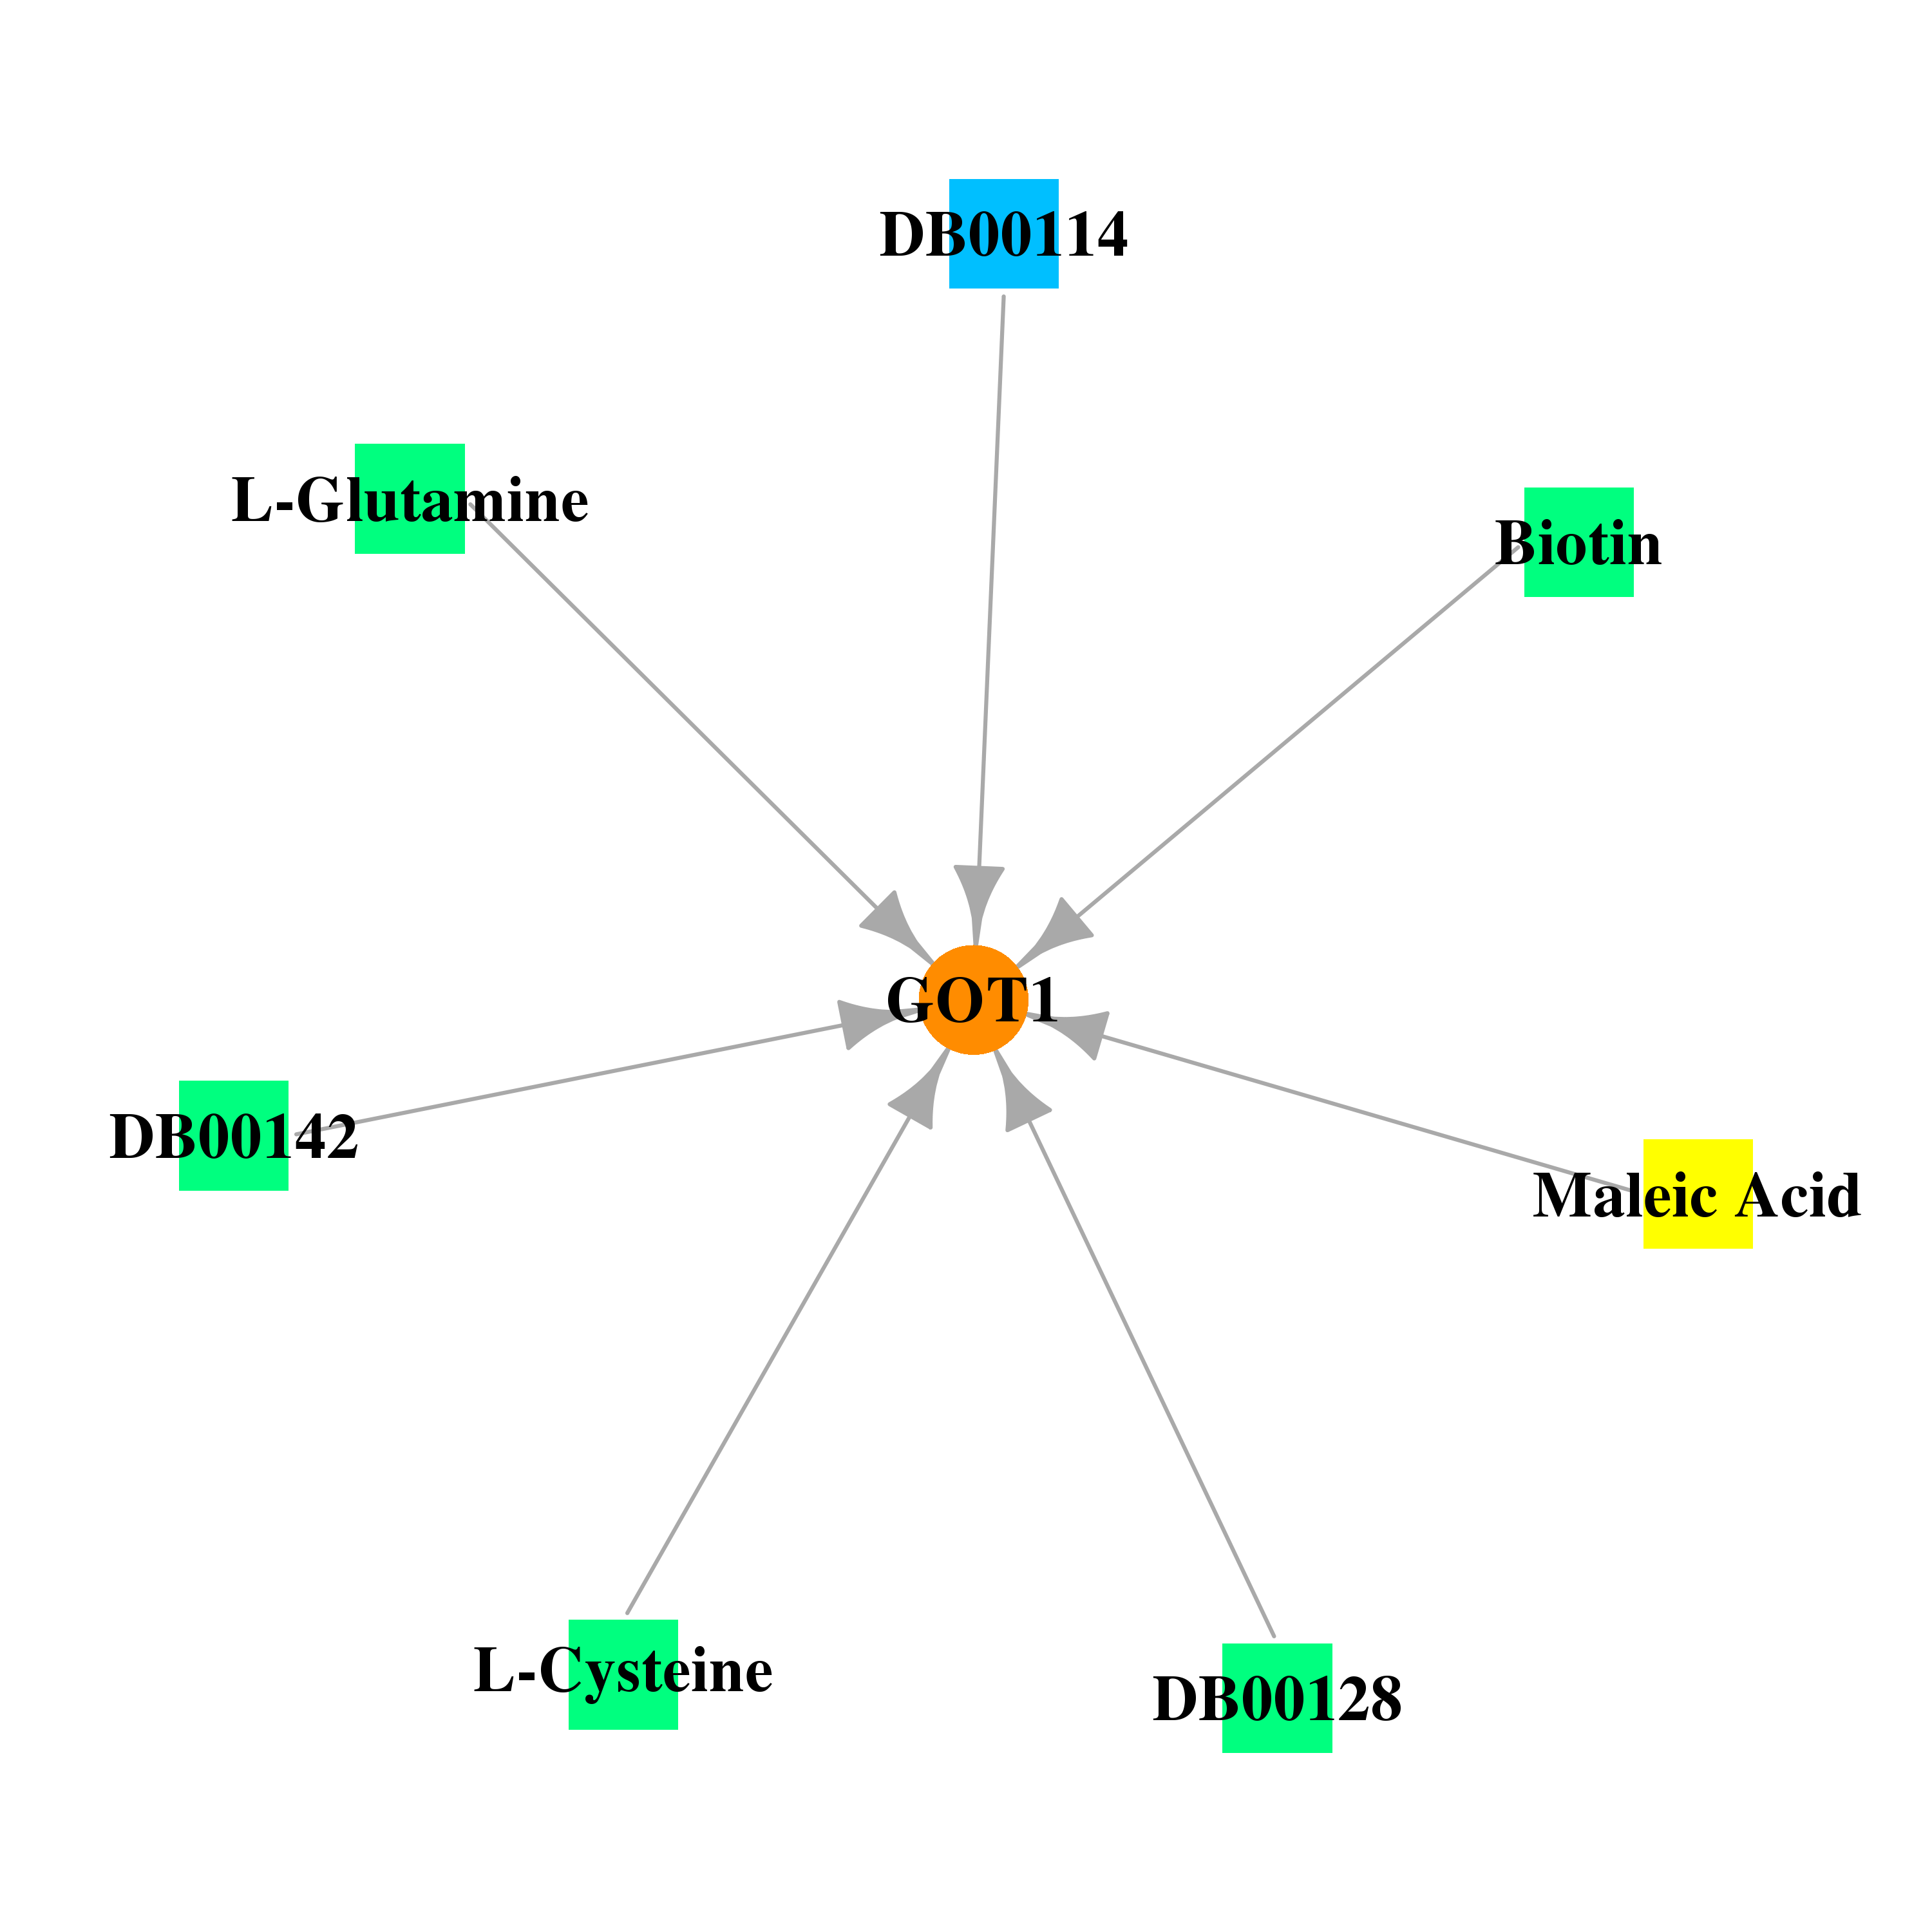 |
| * Drug Centered Interaction Network. |
| DrugBank ID | Target Name | Drug Groups | Generic Name | Drug Centered Network | Drug Structure |
| DB00114 | glutamic-oxaloacetic transaminase 1, soluble | nutraceutical | Pyridoxal Phosphate |  |  |
| DB00128 | glutamic-oxaloacetic transaminase 1, soluble | approved; nutraceutical | L-Aspartic Acid | 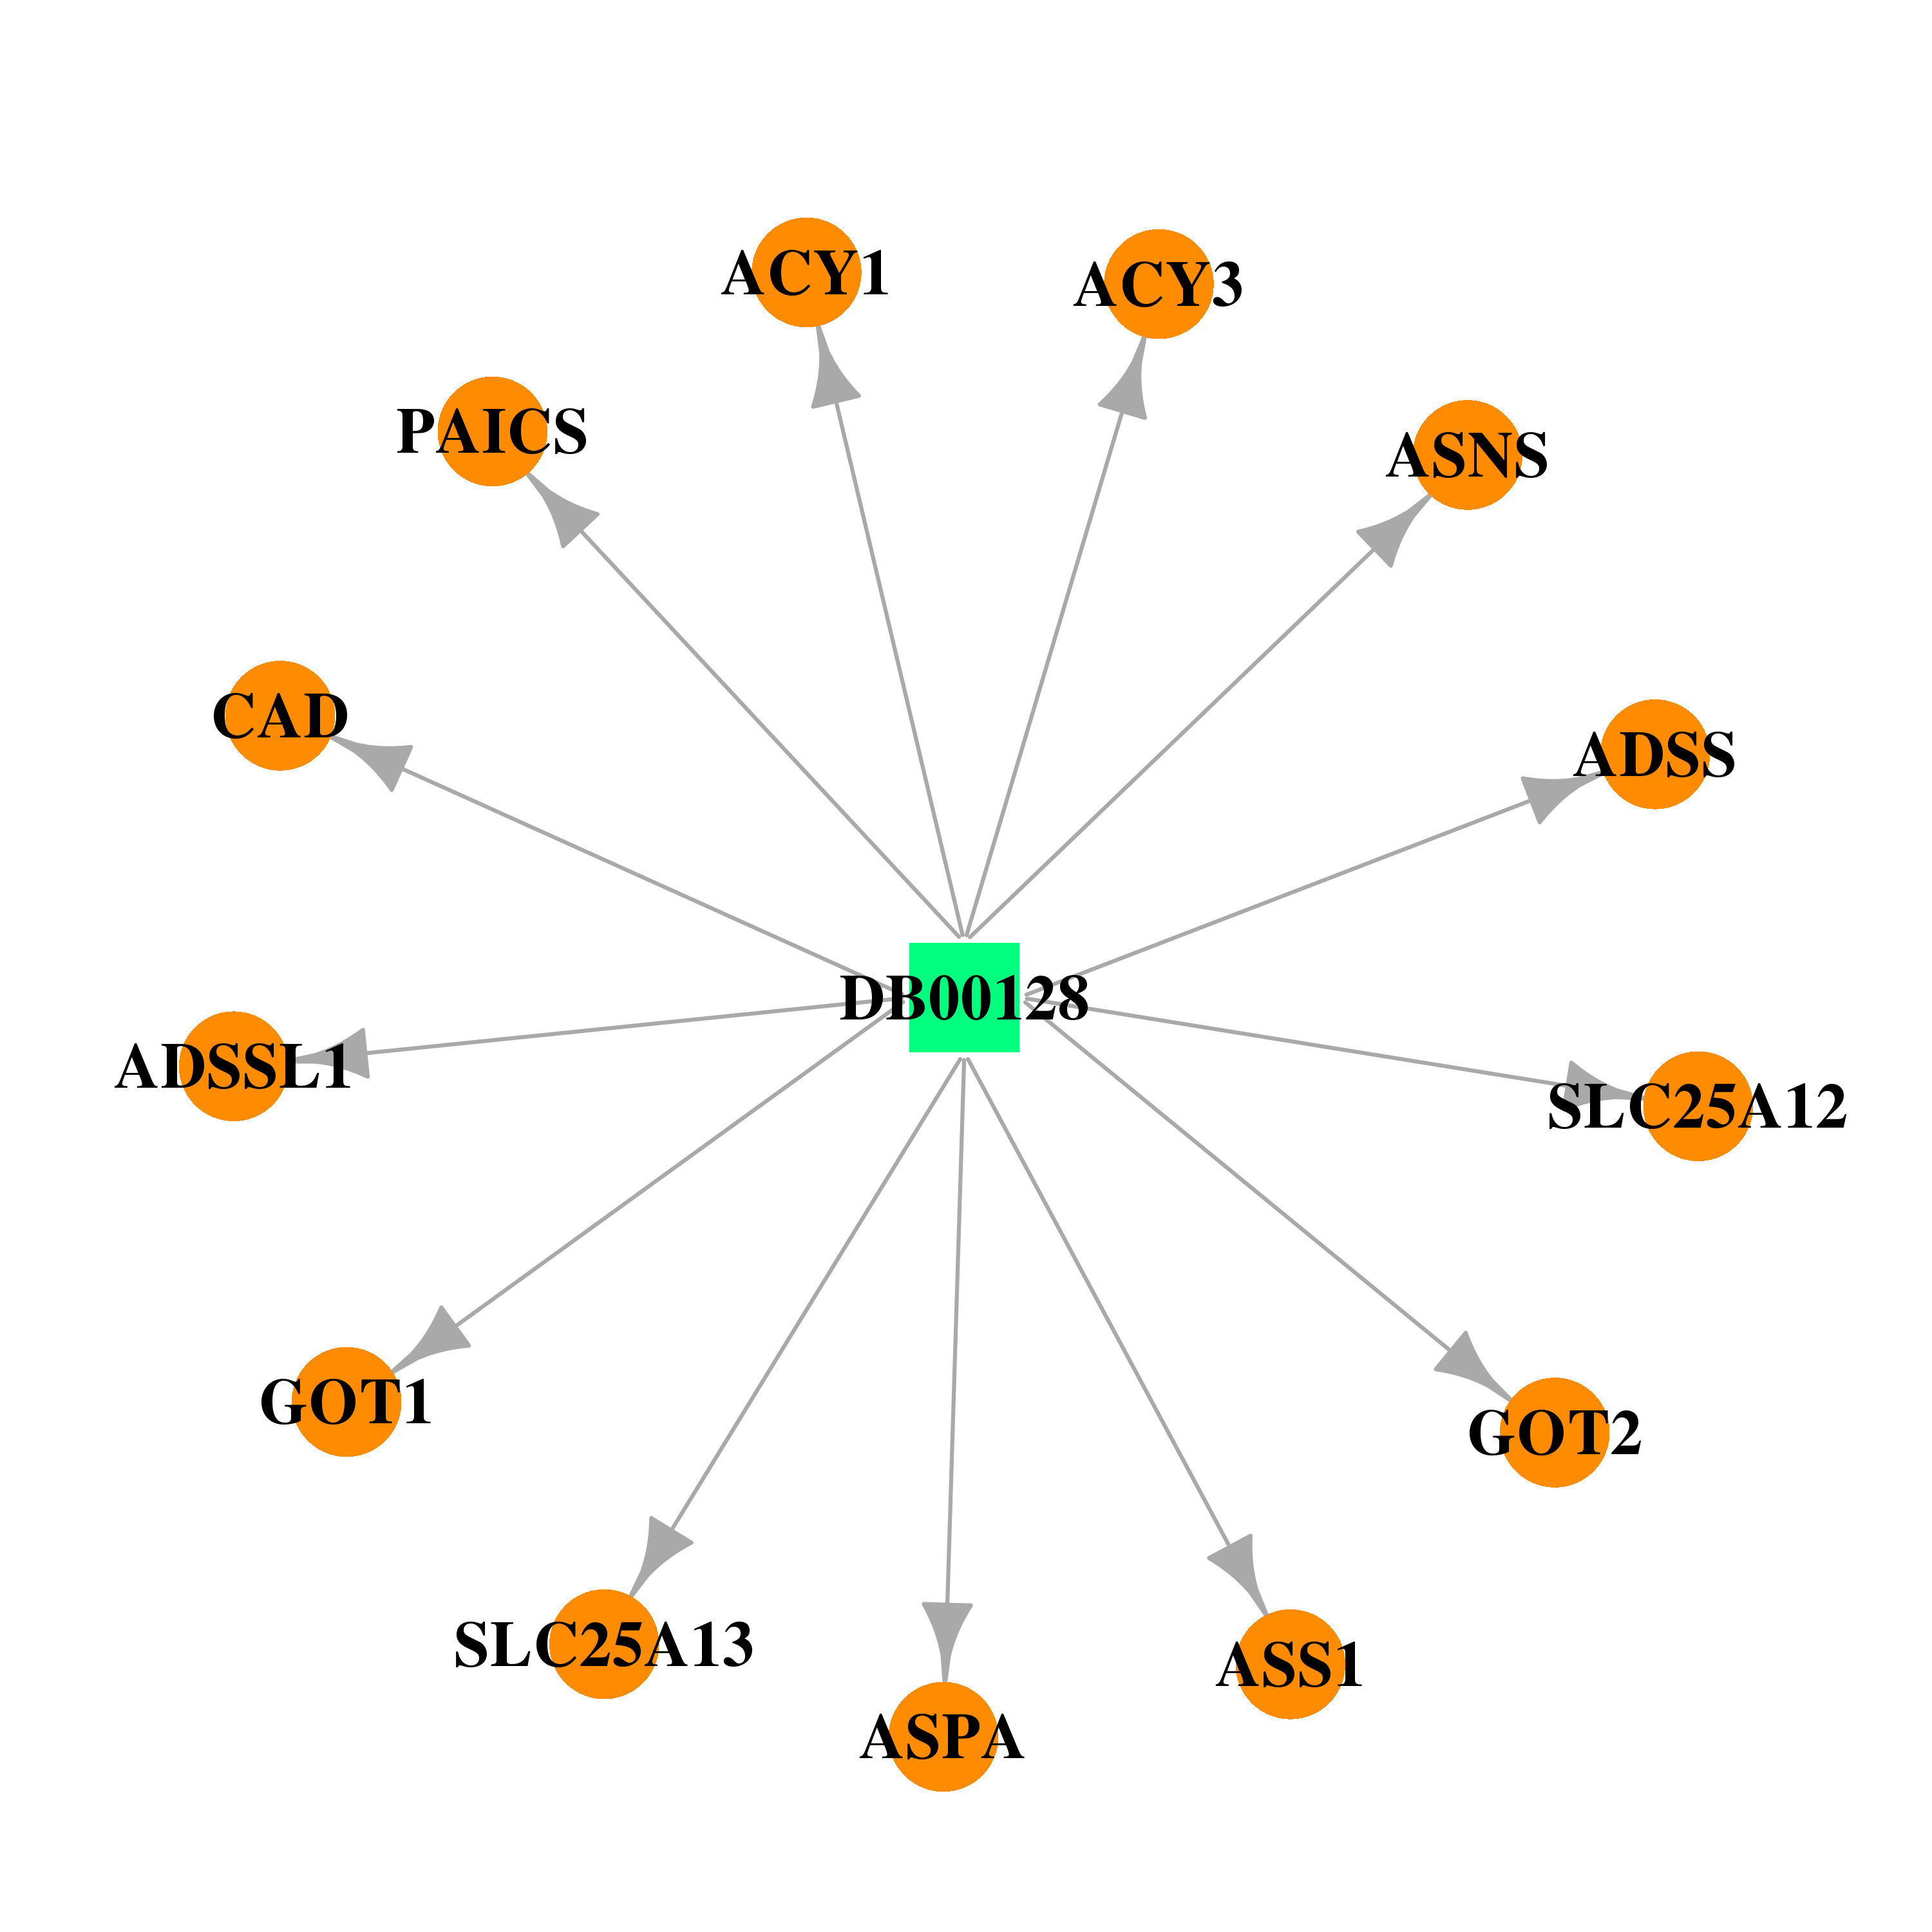 | 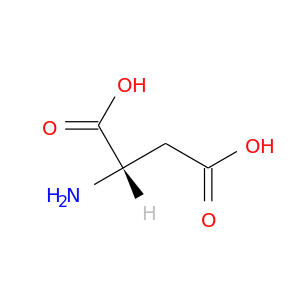 |
| DB00142 | glutamic-oxaloacetic transaminase 1, soluble | approved; nutraceutical | L-Glutamic Acid | 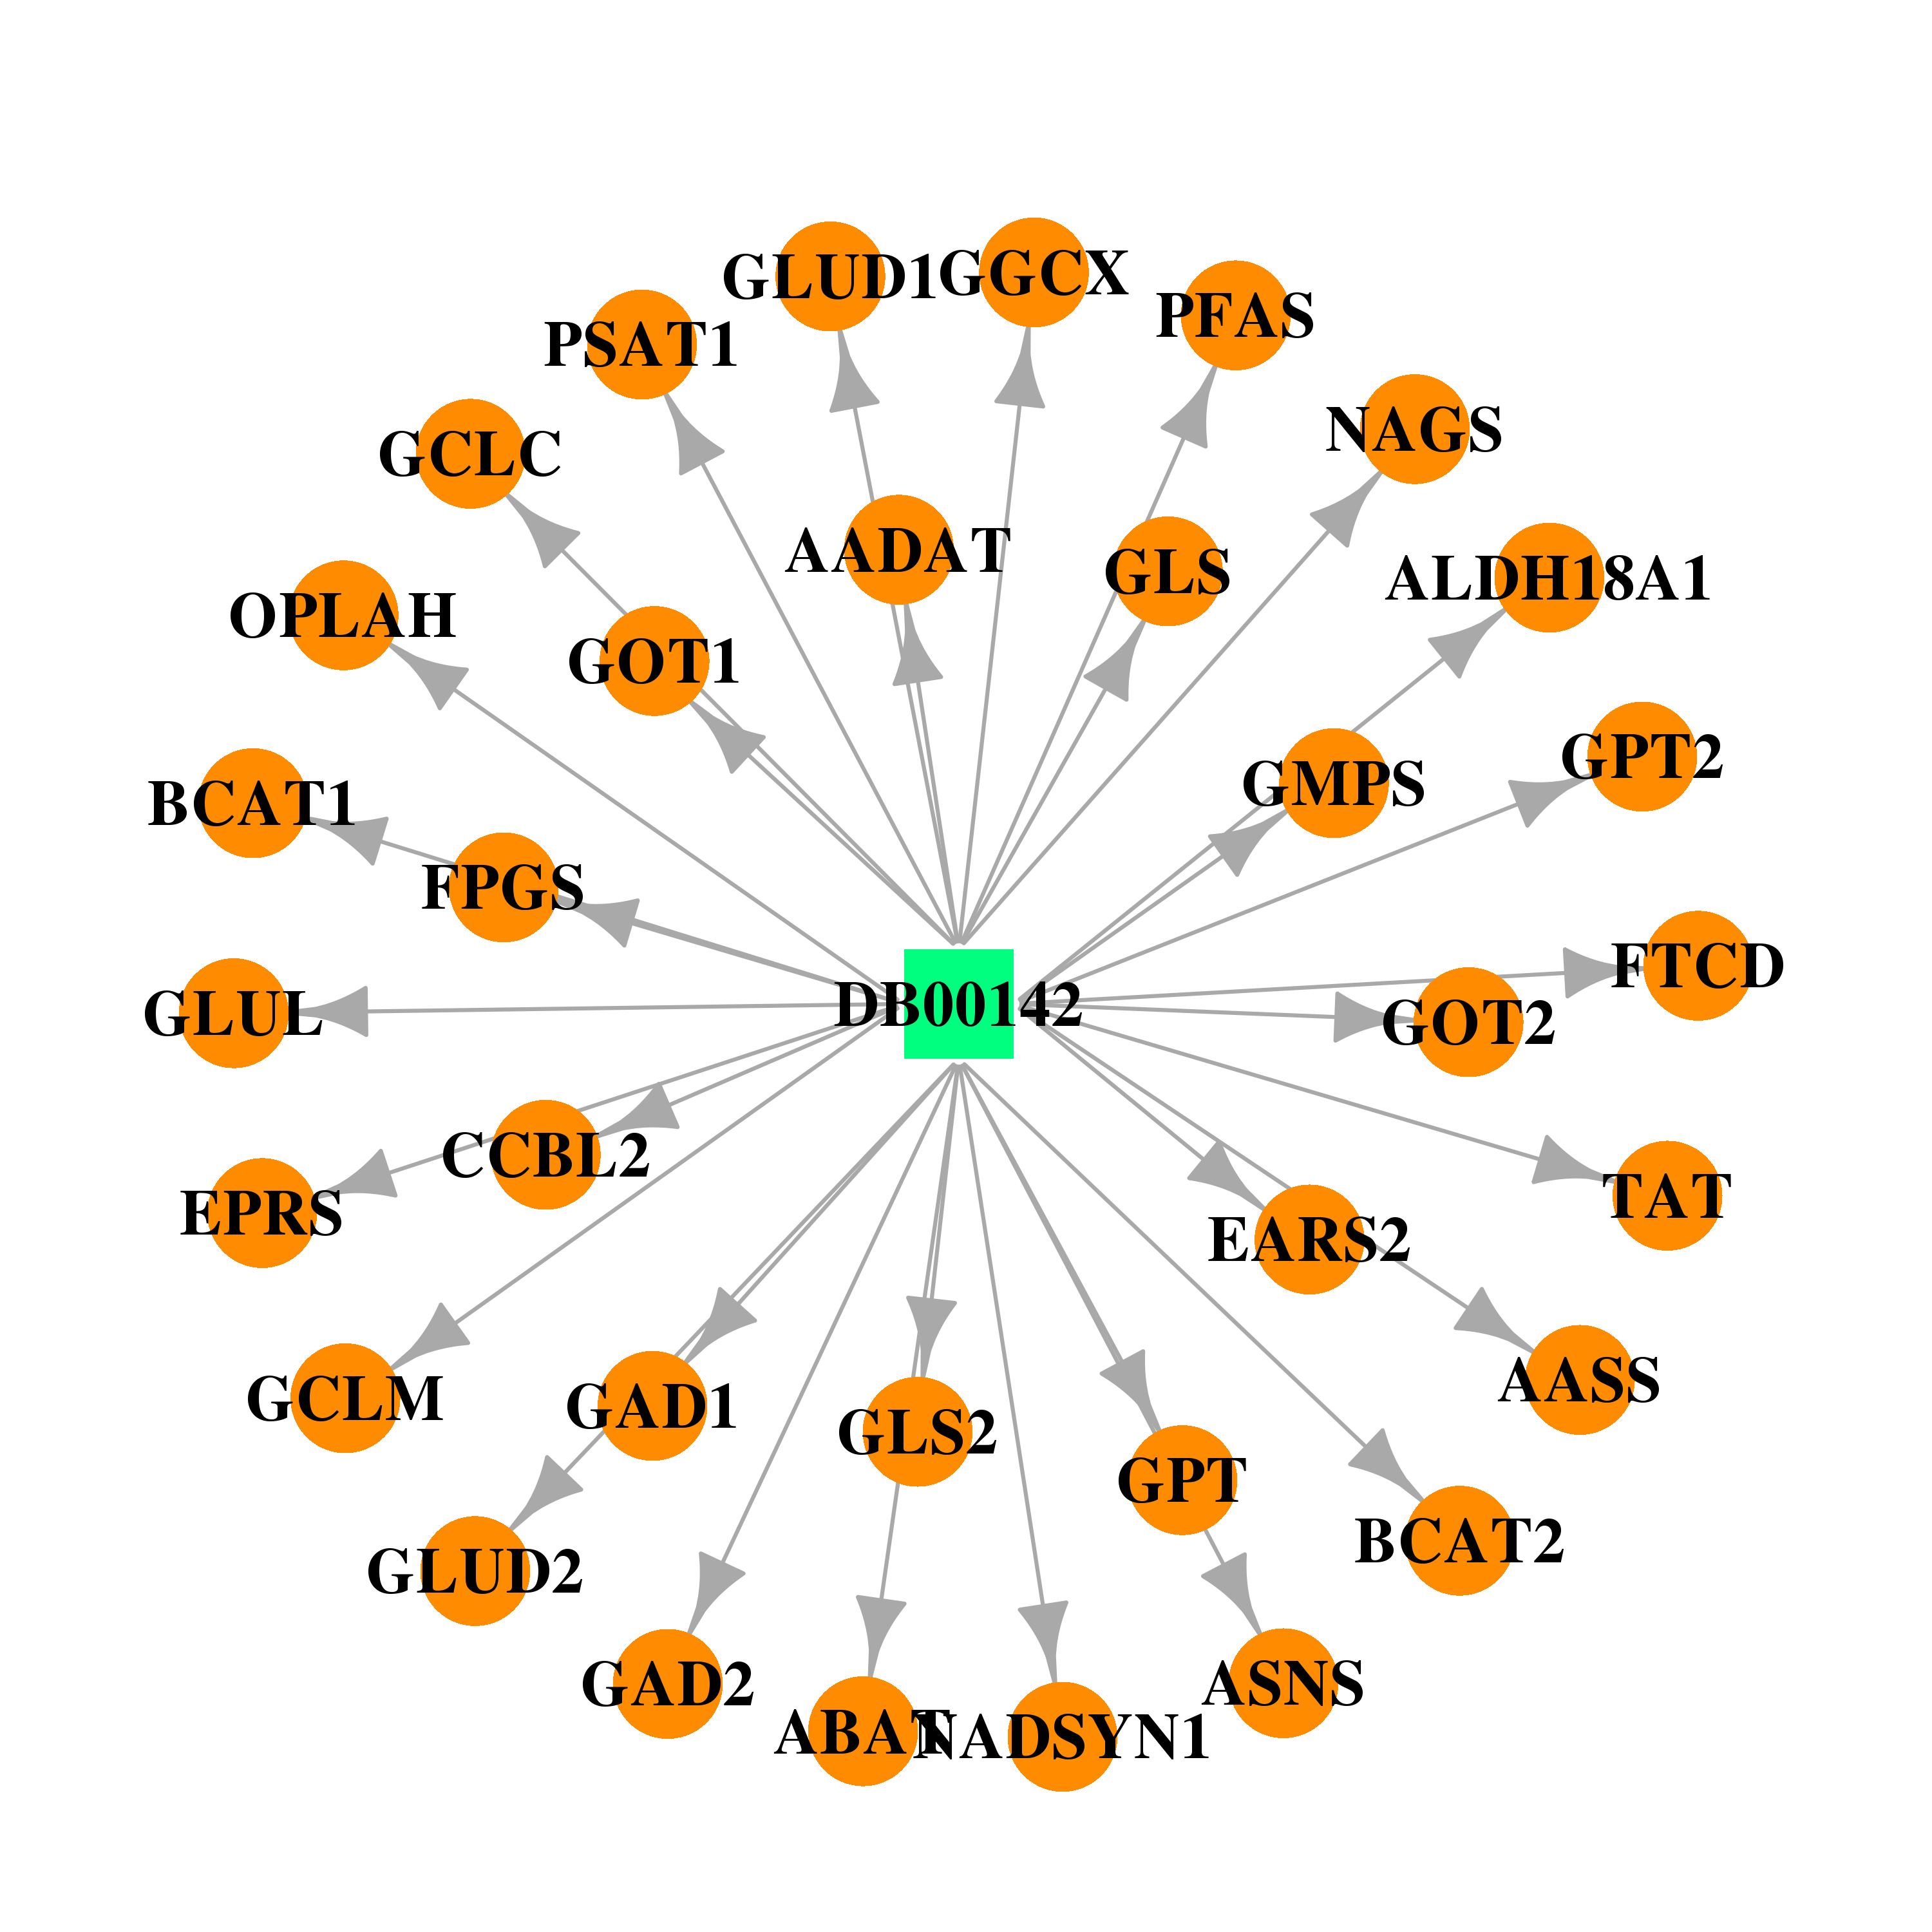 | 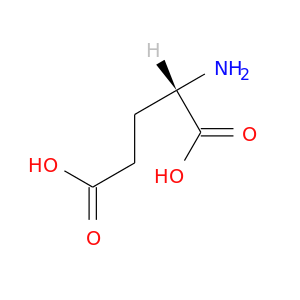 |
| DB00151 | glutamic-oxaloacetic transaminase 1, soluble | approved; nutraceutical | L-Cysteine | 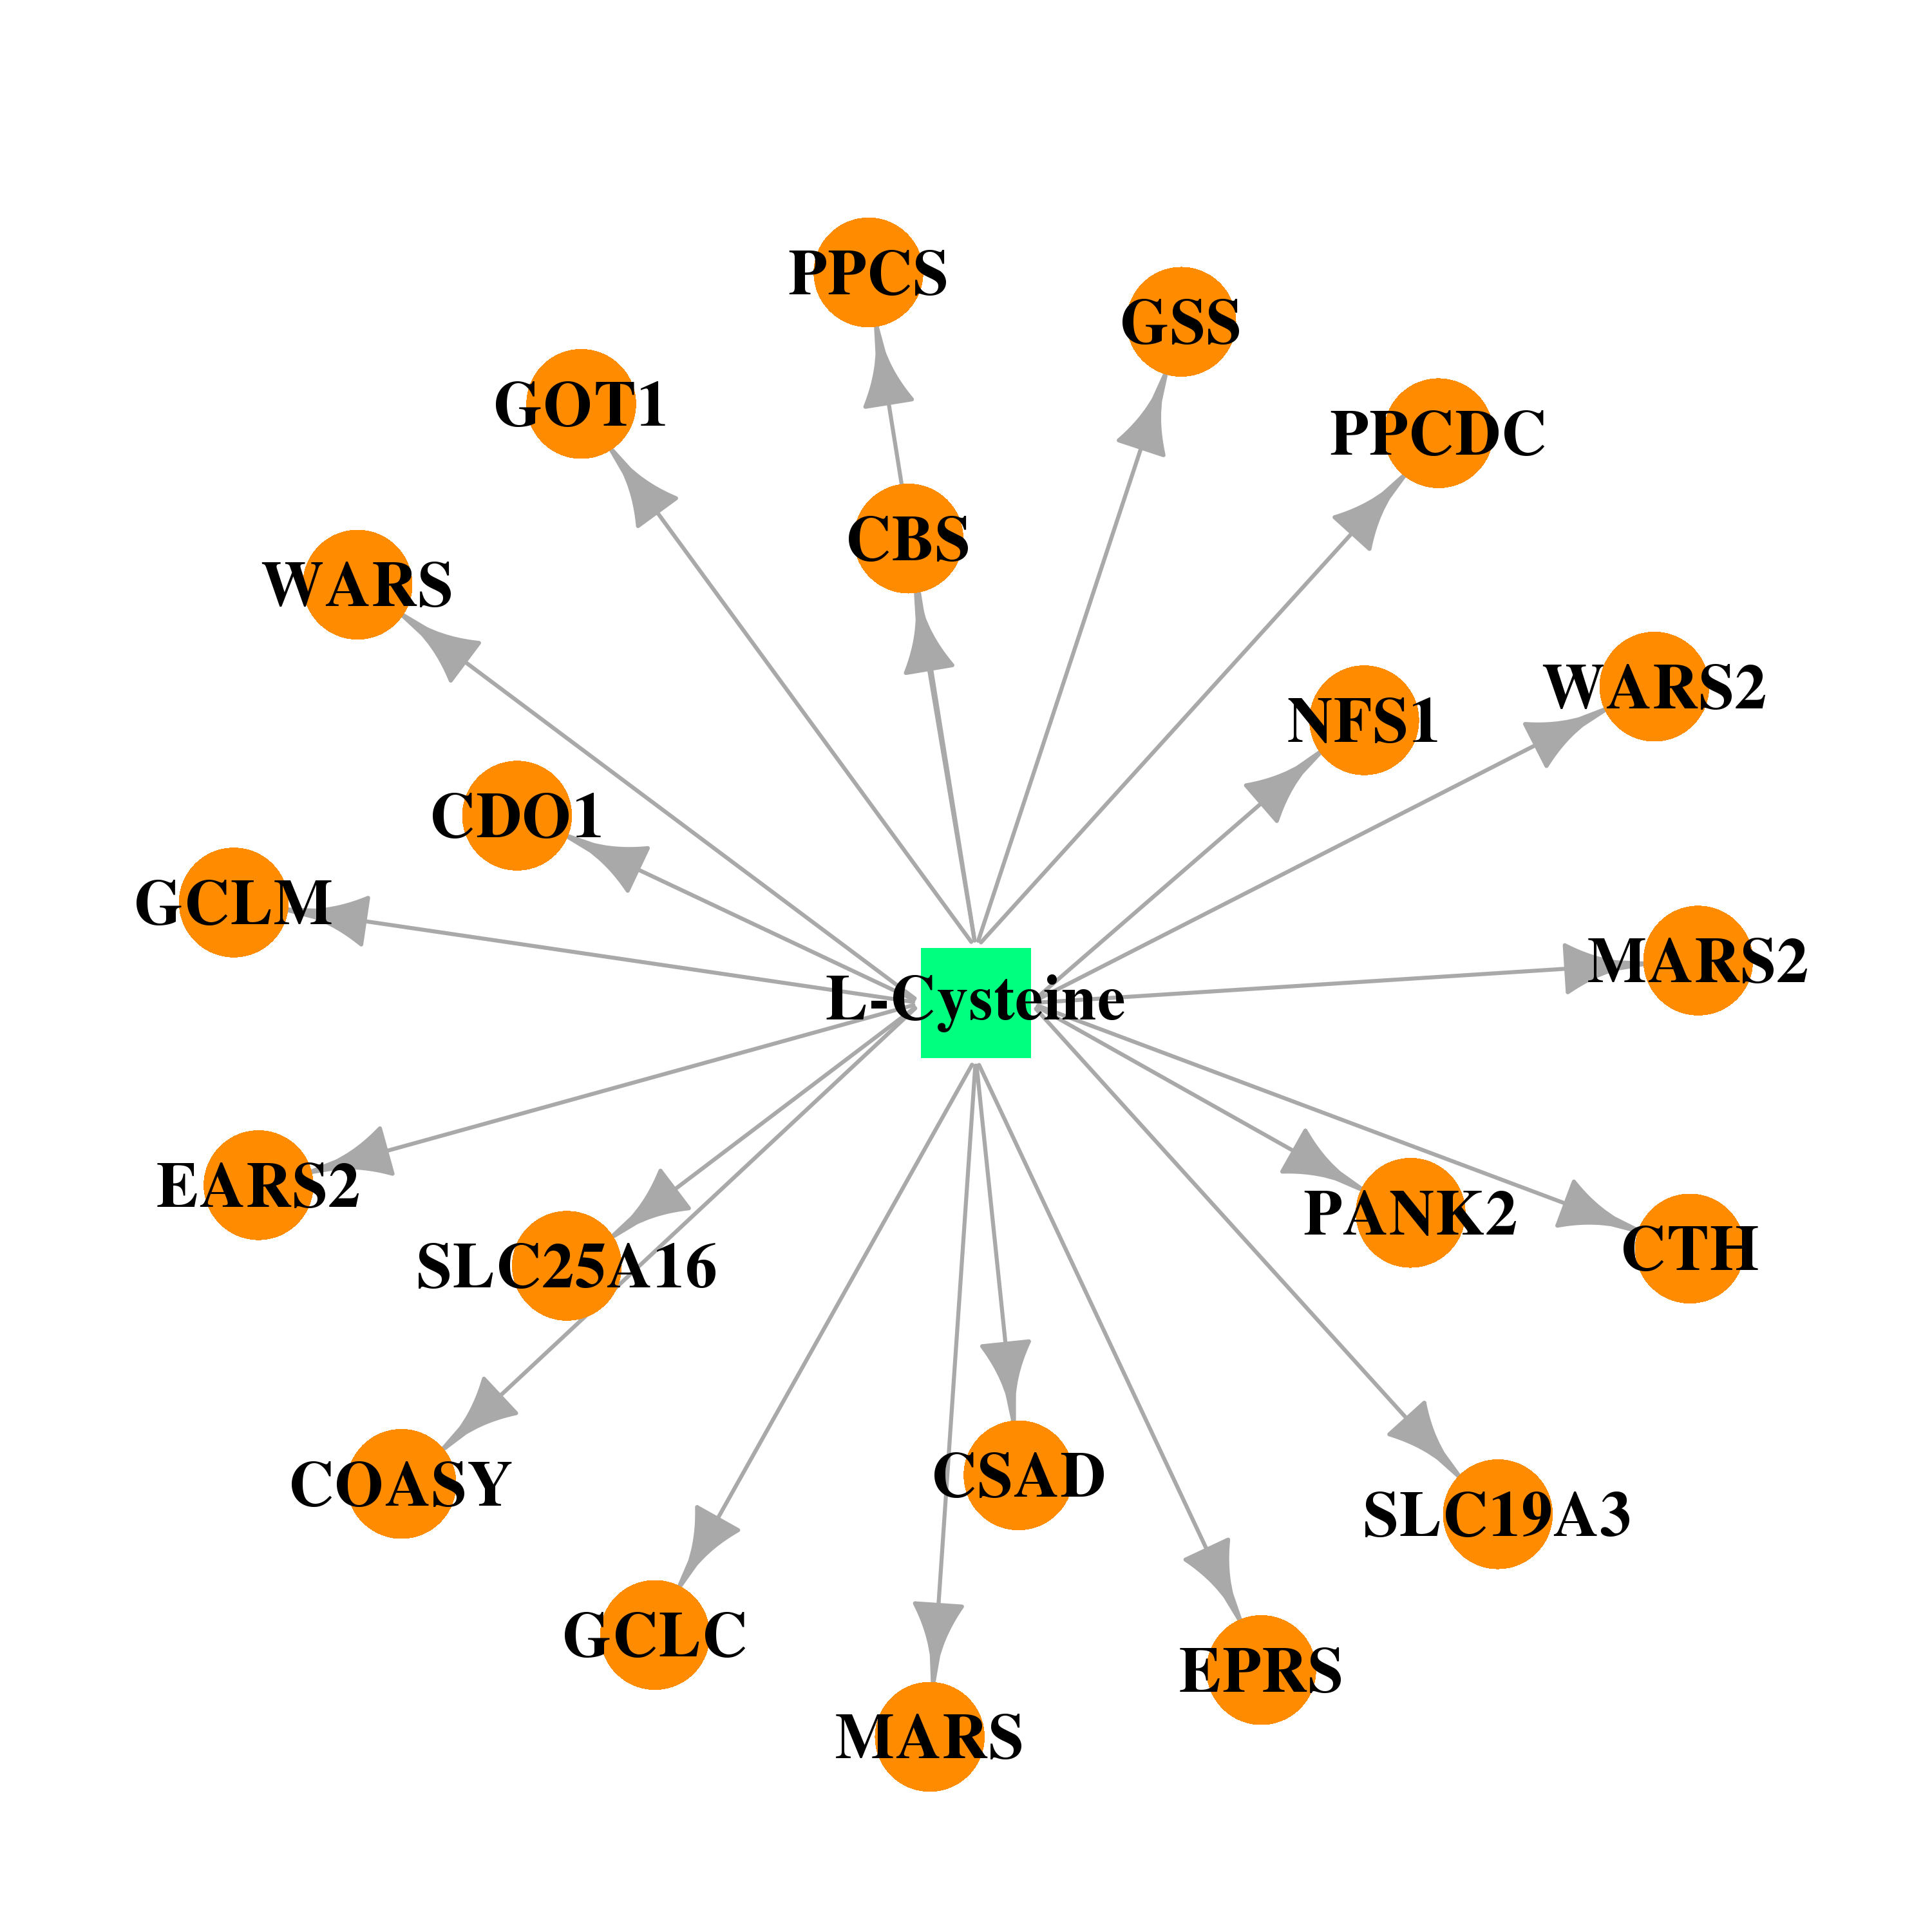 | 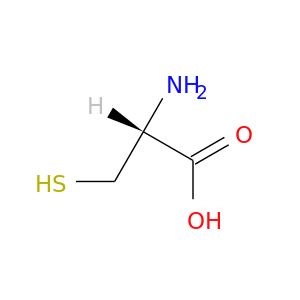 |
| DB04299 | glutamic-oxaloacetic transaminase 1, soluble | experimental | Maleic Acid | 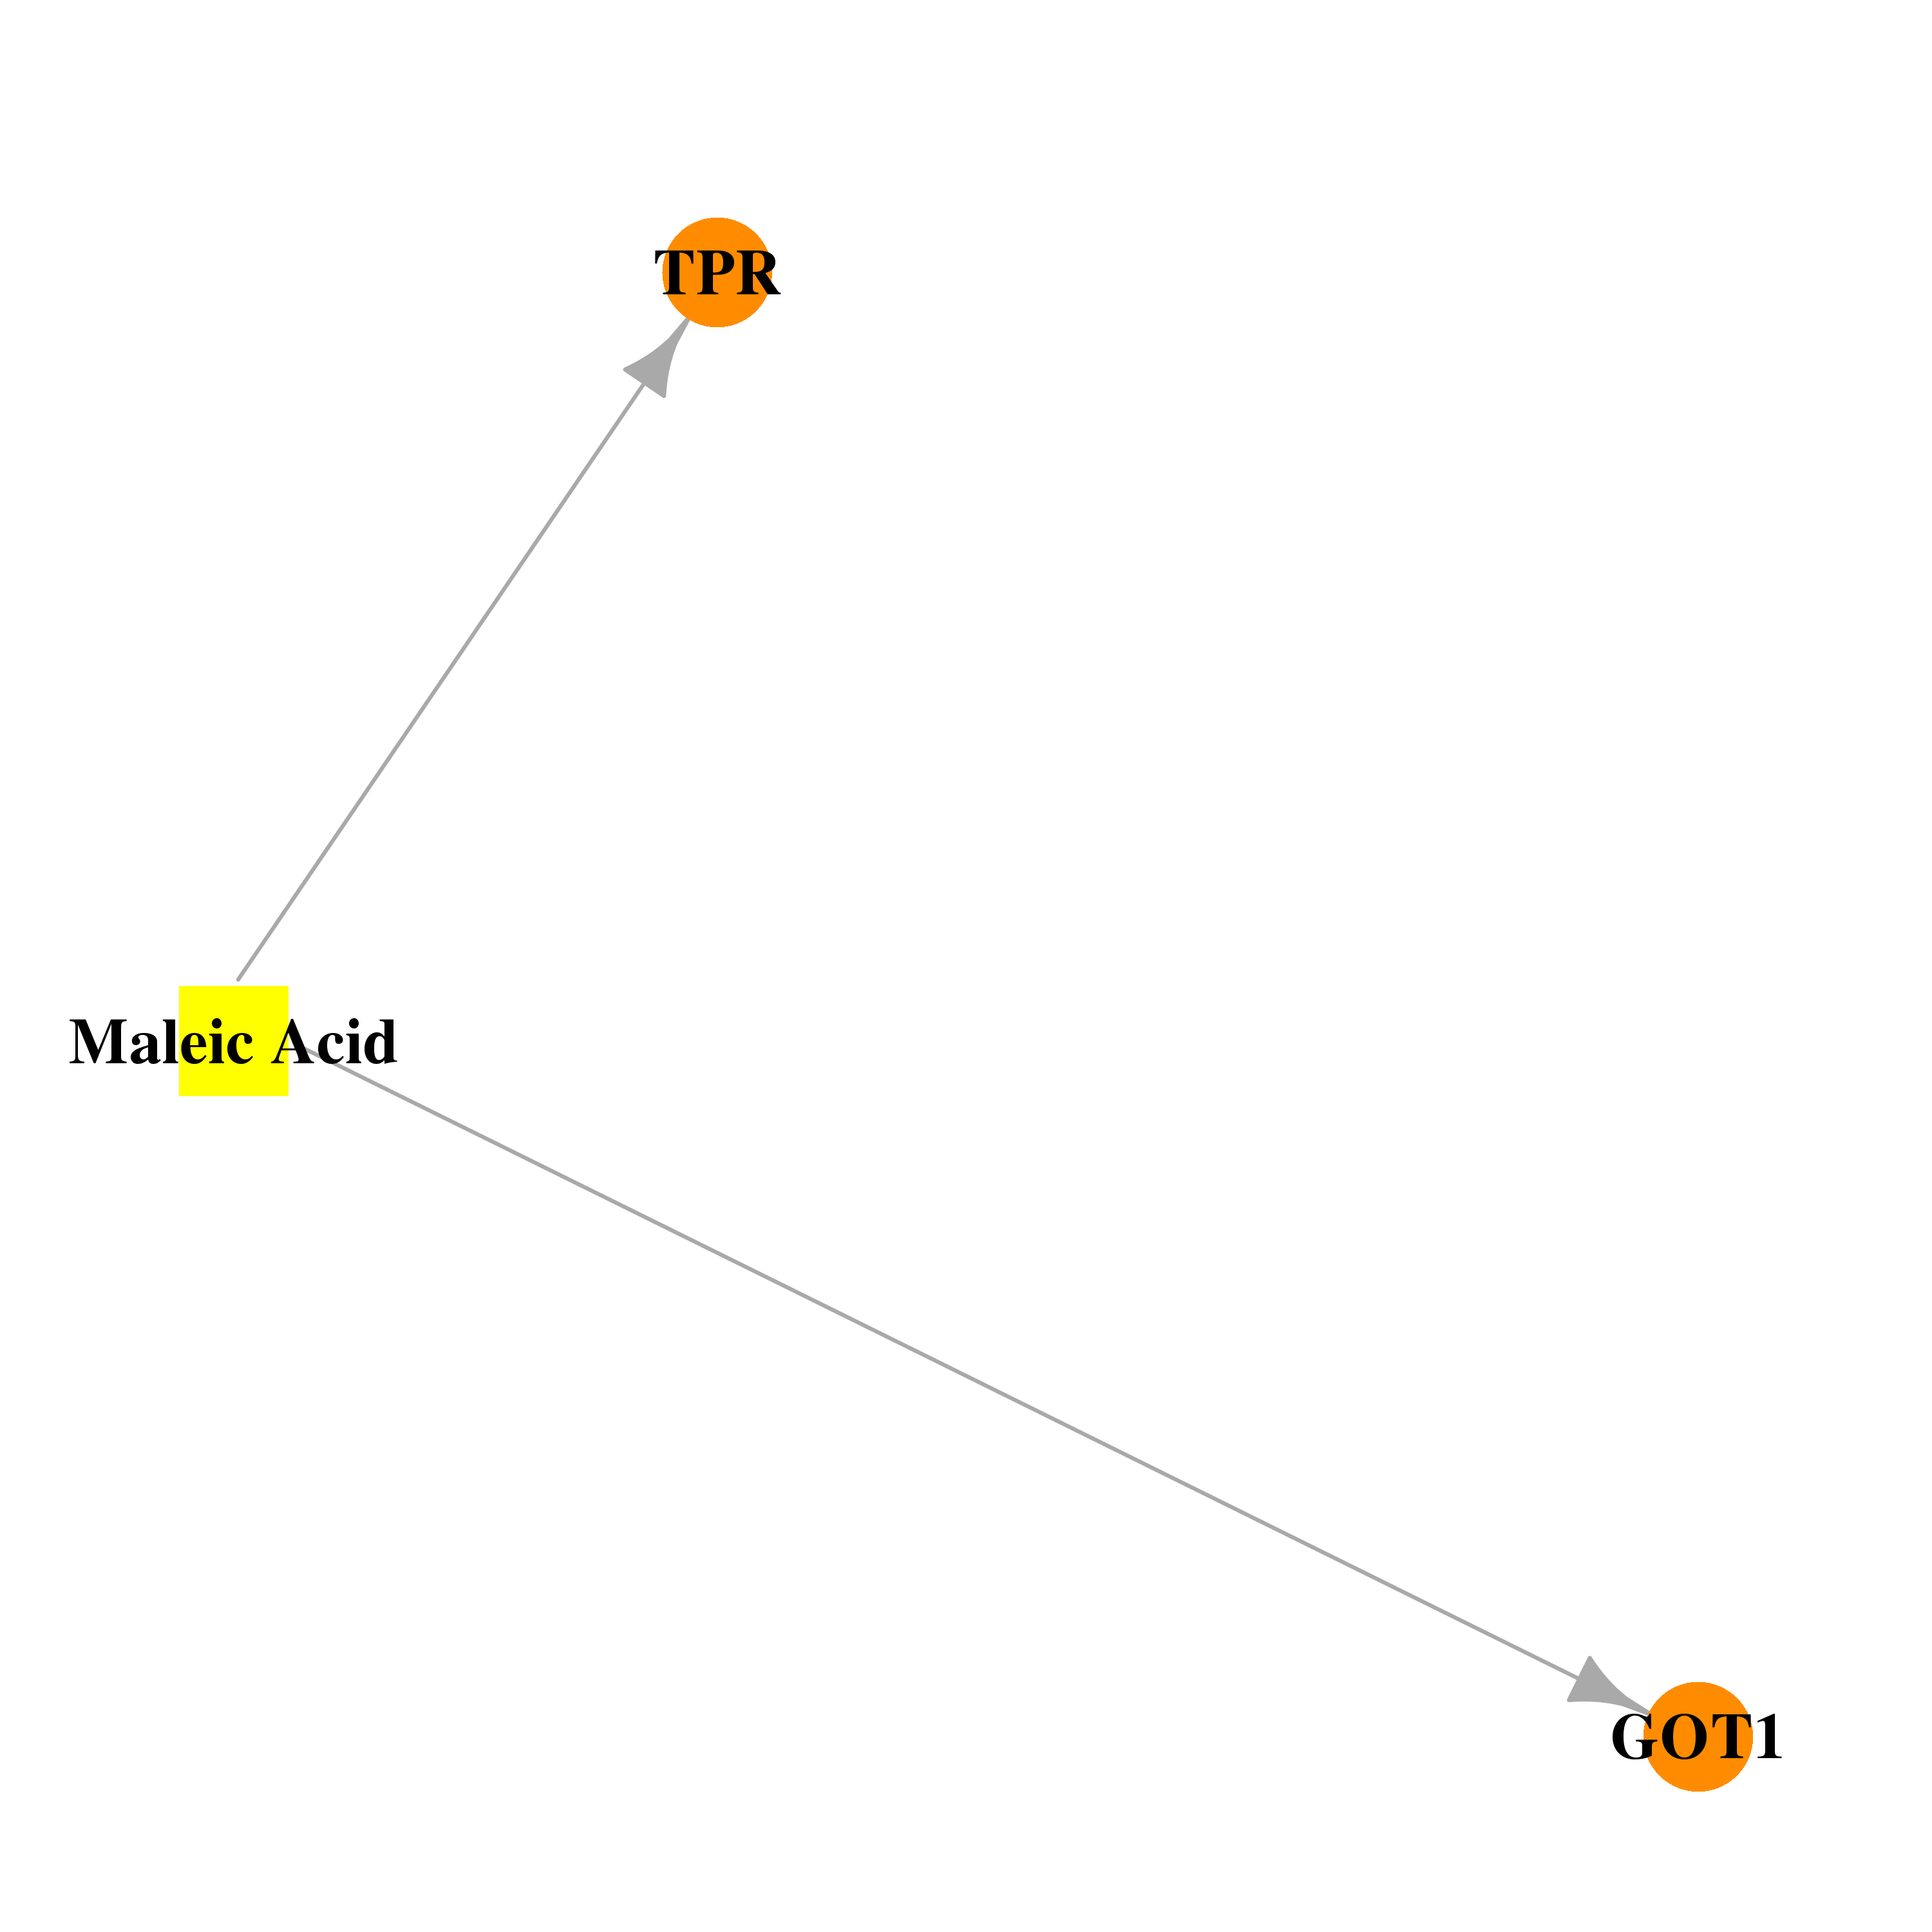 | 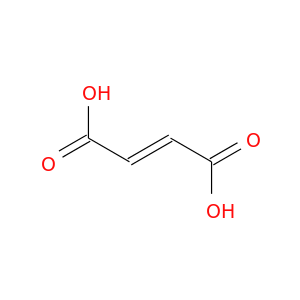 |
| DB00121 | glutamic-oxaloacetic transaminase 1, soluble | approved; nutraceutical | Biotin | 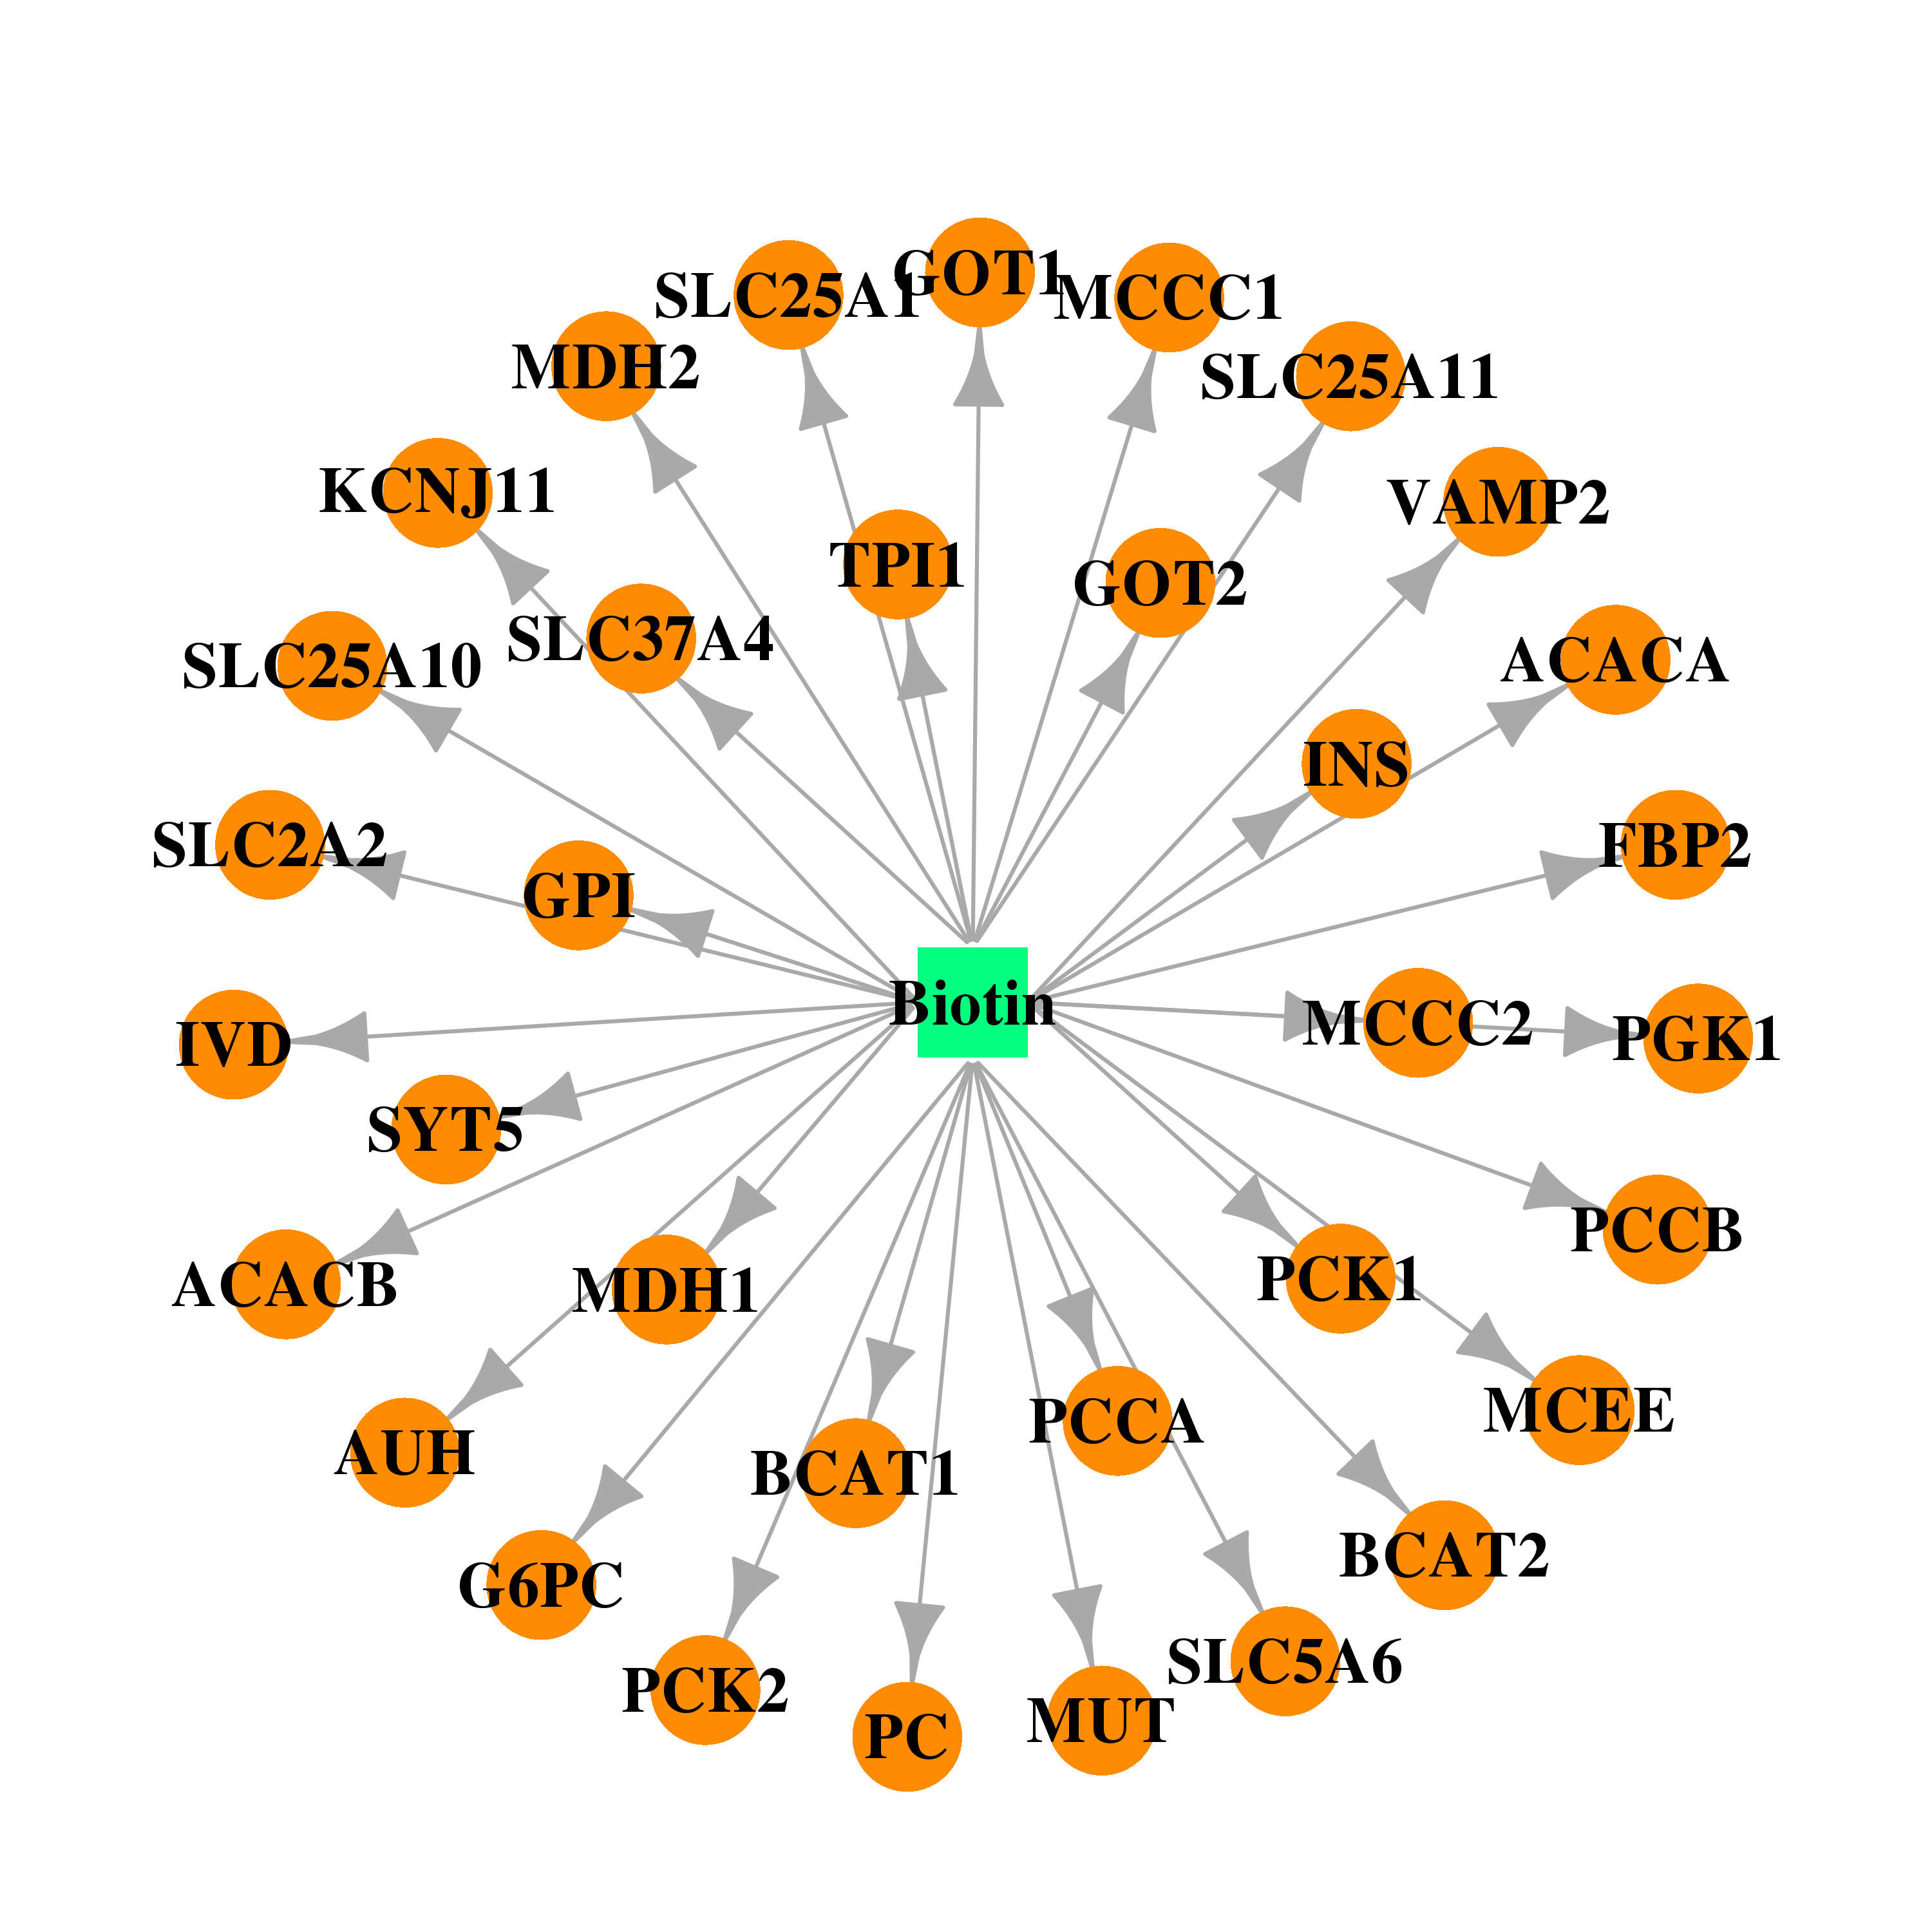 | 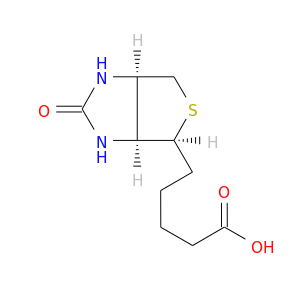 |
| DB00130 | glutamic-oxaloacetic transaminase 1, soluble | approved; nutraceutical; investigational | L-Glutamine |  |  |
| Top |
| Cross referenced IDs for GOT1 |
| * We obtained these cross-references from Uniprot database. It covers 150 different DBs, 18 categories. http://www.uniprot.org/help/cross_references_section |
: Open all cross reference information
|
Copyright © 2016-Present - The Univsersity of Texas Health Science Center at Houston @ |