|
||||||||||||||||||||
| |
| Phenotypic Information (metabolism pathway, cancer, disease, phenome) |
| |
| |
| Gene-Gene Network Information: Co-Expression Network, Interacting Genes & KEGG |
| |
|


| Gene Summary for GPC1 |
| Basic gene info. | Gene symbol | GPC1 |
| Gene name | glypican 1 | |
| Synonyms | glypican | |
| Cytomap | UCSC genome browser: 2q35-q37 | |
| Genomic location | chr2 :241375114-241407495 | |
| Type of gene | protein-coding | |
| RefGenes | NM_002081.2, | |
| Ensembl id | ENSG00000063660 | |
| Description | glypican proteoglycan 1glypican-1 | |
| Modification date | 20141207 | |
| dbXrefs | MIM : 600395 | |
| HGNC : HGNC | ||
| Ensembl : ENSG00000063660 | ||
| HPRD : 02671 | ||
| Vega : OTTHUMG00000133349 | ||
| Protein | UniProt: go to UniProt's Cross Reference DB Table | |
| Expression | CleanEX: HS_GPC1 | |
| BioGPS: 2817 | ||
| Gene Expression Atlas: ENSG00000063660 | ||
| The Human Protein Atlas: ENSG00000063660 | ||
| Pathway | NCI Pathway Interaction Database: GPC1 | |
| KEGG: GPC1 | ||
| REACTOME: GPC1 | ||
| ConsensusPathDB | ||
| Pathway Commons: GPC1 | ||
| Metabolism | MetaCyc: GPC1 | |
| HUMANCyc: GPC1 | ||
| Regulation | Ensembl's Regulation: ENSG00000063660 | |
| miRBase: chr2 :241,375,114-241,407,495 | ||
| TargetScan: NM_002081 | ||
| cisRED: ENSG00000063660 | ||
| Context | iHOP: GPC1 | |
| cancer metabolism search in PubMed: GPC1 | ||
| UCL Cancer Institute: GPC1 | ||
| Assigned class in ccmGDB | C | |
| Top |
| Phenotypic Information for GPC1(metabolism pathway, cancer, disease, phenome) |
| Cancer | CGAP: GPC1 |
| Familial Cancer Database: GPC1 | |
| * This gene is included in those cancer gene databases. |
|
|
|
|
|
| . | ||||||||||||||
Oncogene 1 | Significant driver gene in | |||||||||||||||||||
| cf) number; DB name 1 Oncogene; http://nar.oxfordjournals.org/content/35/suppl_1/D721.long, 2 Tumor Suppressor gene; https://bioinfo.uth.edu/TSGene/, 3 Cancer Gene Census; http://www.nature.com/nrc/journal/v4/n3/abs/nrc1299.html, 4 CancerGenes; http://nar.oxfordjournals.org/content/35/suppl_1/D721.long, 5 Network of Cancer Gene; http://ncg.kcl.ac.uk/index.php, 1Therapeutic Vulnerabilities in Cancer; http://cbio.mskcc.org/cancergenomics/statius/ |
| REACTOME_METABOLISM_OF_CARBOHYDRATES | |
| OMIM | |
| Orphanet | |
| Disease | KEGG Disease: GPC1 |
| MedGen: GPC1 (Human Medical Genetics with Condition) | |
| ClinVar: GPC1 | |
| Phenotype | MGI: GPC1 (International Mouse Phenotyping Consortium) |
| PhenomicDB: GPC1 | |
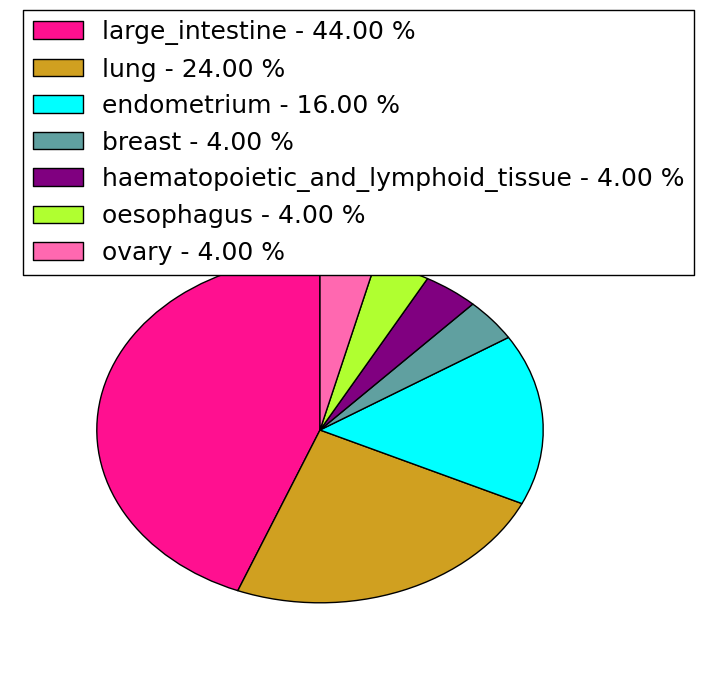
| Mutations for GPC1 |
| * Under tables are showing count per each tissue to give us broad intuition about tissue specific mutation patterns.You can go to the detailed page for each mutation database's web site. |
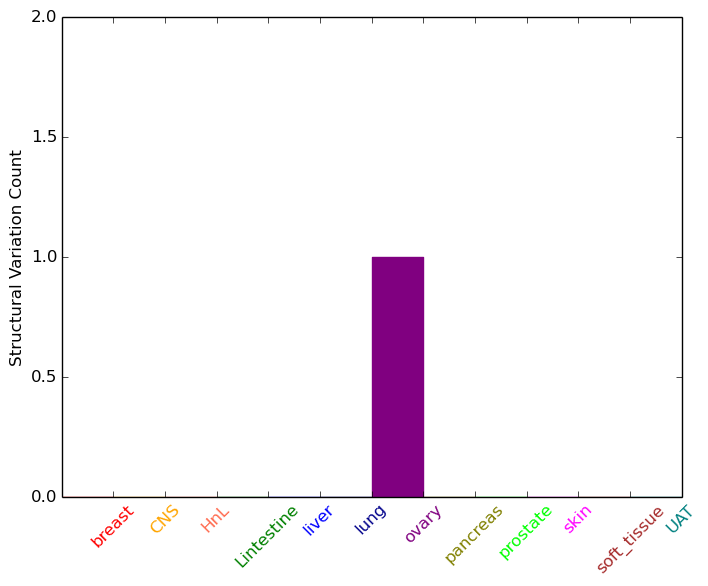
| - Statistics for Tissue and Mutation type | Top |
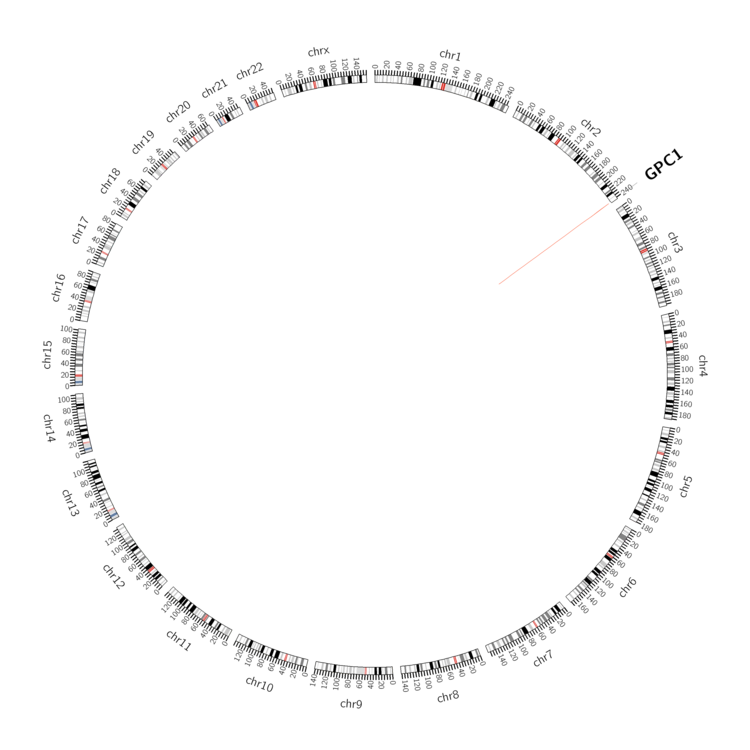 |
| - For Inter-chromosomal Variations |
| There's no inter-chromosomal structural variation. |
| - For Intra-chromosomal Variations |
| * Intra-chromosomal variantions includes 'intrachromosomal amplicon to amplicon', 'intrachromosomal amplicon to non-amplified dna', 'intrachromosomal deletion', 'intrachromosomal fold-back inversion', 'intrachromosomal inversion', 'intrachromosomal tandem duplication', 'Intrachromosomal unknown type', 'intrachromosomal with inverted orientation', 'intrachromosomal with non-inverted orientation'. |
 |
| Sample | Symbol_a | Chr_a | Start_a | End_a | Symbol_b | Chr_b | Start_b | End_b |
| ovary | GPC1 | chr2 | 241397607 | 241397627 | GPC1 | chr2 | 241405457 | 241405477 |
| cf) Tissue number; Tissue name (1;Breast, 2;Central_nervous_system, 3;Haematopoietic_and_lymphoid_tissue, 4;Large_intestine, 5;Liver, 6;Lung, 7;Ovary, 8;Pancreas, 9;Prostate, 10;Skin, 11;Soft_tissue, 12;Upper_aerodigestive_tract) |
| * From mRNA Sanger sequences, Chitars2.0 arranged chimeric transcripts. This table shows GPC1 related fusion information. |
| ID | Head Gene | Tail Gene | Accession | Gene_a | qStart_a | qEnd_a | Chromosome_a | tStart_a | tEnd_a | Gene_a | qStart_a | qEnd_a | Chromosome_a | tStart_a | tEnd_a |
| BG012329 | GPC1 | 8 | 189 | 2 | 241391203 | 241391387 | GPC1 | 190 | 316 | 2 | 241391341 | 241391467 | |
| Top |
| There's no copy number variation information in COSMIC data for this gene. |
| Top |
|
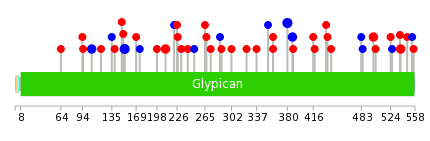 |
| Top |
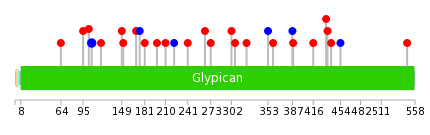
| Stat. for Non-Synonymous SNVs (# total SNVs=25) | (# total SNVs=11) |
 |  |
(# total SNVs=0) | (# total SNVs=0) |
| Top |
| * When you move the cursor on each content, you can see more deailed mutation information on the Tooltip. Those are primary_site,primary_histology,mutation(aa),pubmedID. |
| GRCh37 position | Mutation(aa) | Unique sampleID count |
| chr2:241404499-241404499 | p.S380S | 3 |
| chr2:241401741-241401741 | p.R153R | 3 |
| chr2:241404337-241404337 | p.R360H | 2 |
| chr2:241405528-241405528 | p.S500G | 2 |
| chr2:241404520-241404520 | p.R387R | 2 |
| chr2:241398601-241398601 | p.F107F | 2 |
| chr2:241405643-241405643 | p.P538L | 2 |
| chr2:241401910-241401910 | p.R210C | 2 |
| chr2:241404117-241404117 | p.E323G | 1 |
| chr2:241401687-241401687 | p.T135T | 1 |
| Top |
|
 |
| Point Mutation/ Tissue ID | 1 | 2 | 3 | 4 | 5 | 6 | 7 | 8 | 9 | 10 | 11 | 12 | 13 | 14 | 15 | 16 | 17 | 18 | 19 | 20 |
| # sample | 2 | 1 | 6 | 2 | 1 | 1 | 3 | 6 | 5 | |||||||||||
| # mutation | 2 | 1 | 6 | 2 | 1 | 1 | 4 | 6 | 6 | |||||||||||
| nonsynonymous SNV | 1 | 6 | 2 | 1 | 3 | 5 | 4 | |||||||||||||
| synonymous SNV | 1 | 1 | 1 | 1 | 1 | 2 |
| cf) Tissue ID; Tissue type (1; BLCA[Bladder Urothelial Carcinoma], 2; BRCA[Breast invasive carcinoma], 3; CESC[Cervical squamous cell carcinoma and endocervical adenocarcinoma], 4; COAD[Colon adenocarcinoma], 5; GBM[Glioblastoma multiforme], 6; Glioma Low Grade, 7; HNSC[Head and Neck squamous cell carcinoma], 8; KICH[Kidney Chromophobe], 9; KIRC[Kidney renal clear cell carcinoma], 10; KIRP[Kidney renal papillary cell carcinoma], 11; LAML[Acute Myeloid Leukemia], 12; LUAD[Lung adenocarcinoma], 13; LUSC[Lung squamous cell carcinoma], 14; OV[Ovarian serous cystadenocarcinoma ], 15; PAAD[Pancreatic adenocarcinoma], 16; PRAD[Prostate adenocarcinoma], 17; SKCM[Skin Cutaneous Melanoma], 18:STAD[Stomach adenocarcinoma], 19:THCA[Thyroid carcinoma], 20:UCEC[Uterine Corpus Endometrial Carcinoma]) |
| Top |
| * We represented just top 10 SNVs. When you move the cursor on each content, you can see more deailed mutation information on the Tooltip. Those are primary_site, primary_histology, mutation(aa), pubmedID. |
| Genomic Position | Mutation(aa) | Unique sampleID count |
| chr2:241398601 | p.F107F | 2 |
| chr2:241405670 | p.A198V | 1 |
| chr2:241401788 | p.E441K | 1 |
| chr2:241404117 | p.R210C | 1 |
| chr2:241401804 | p.R454R | 1 |
| chr2:241404317 | p.F547Y | 1 |
| chr2:241401823 | p.S222S | 1 |
| chr2:241404337 | p.P241S | 1 |
| chr2:241401875 | p.A265T | 1 |
| chr2:241404520 | p.R273Q | 1 |
| * Copy number data were extracted from TCGA using R package TCGA-Assembler. The URLs of all public data files on TCGA DCC data server were gathered on Jan-05-2015. Function ProcessCNAData in TCGA-Assembler package was used to obtain gene-level copy number value which is calculated as the average copy number of the genomic region of a gene. |
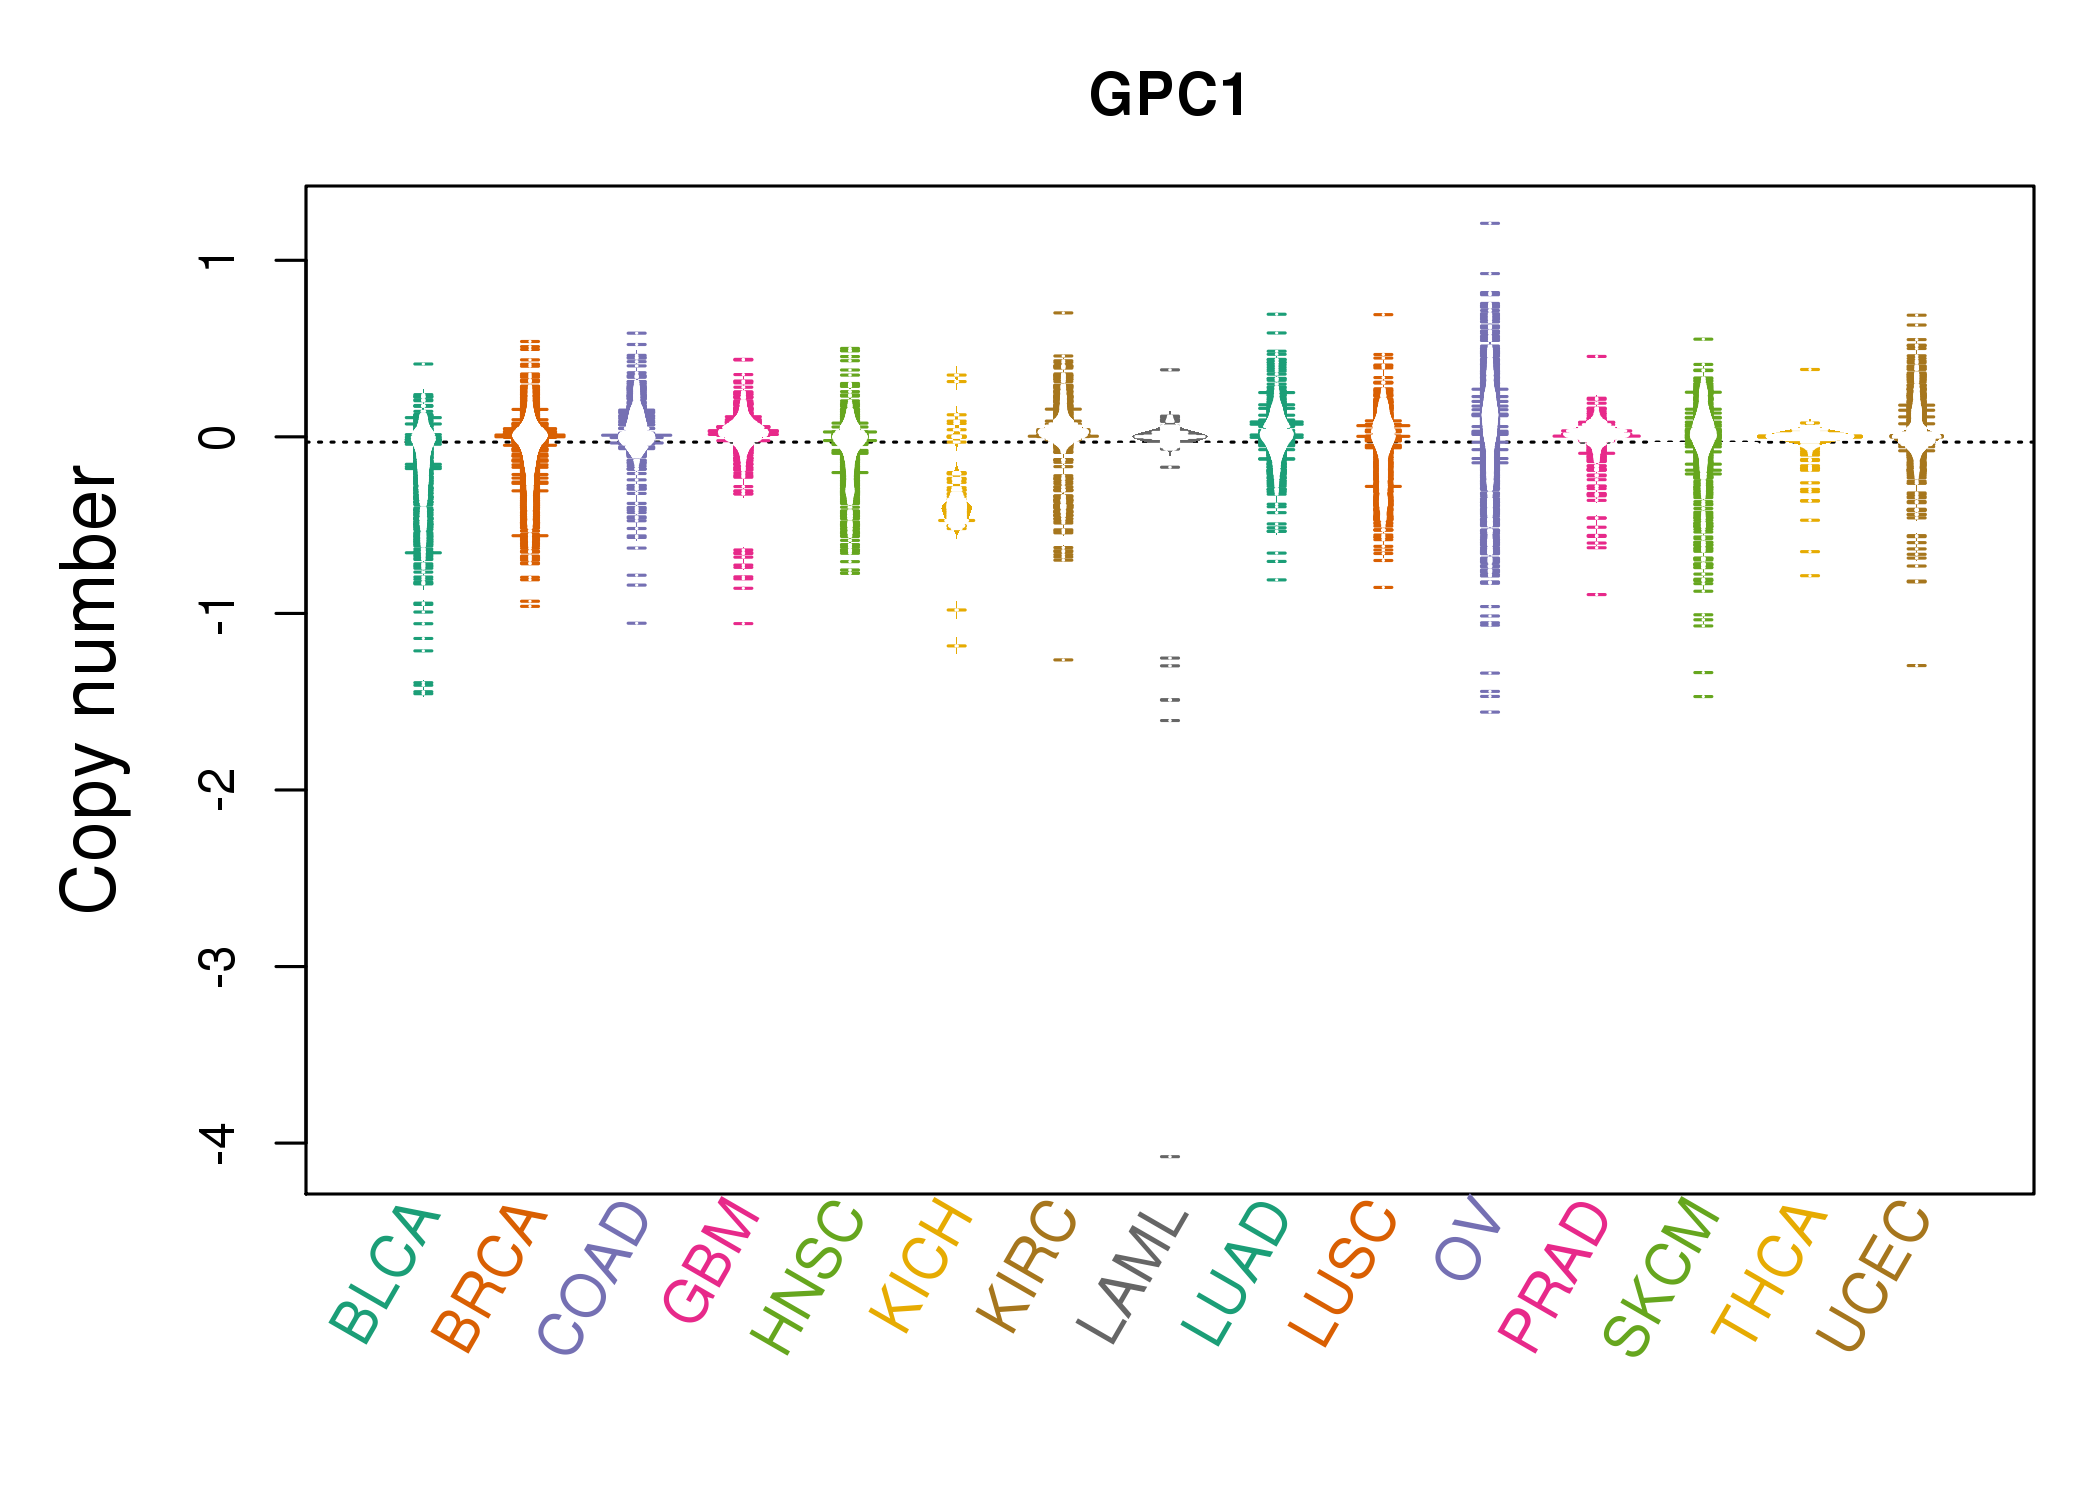 |
| cf) Tissue ID[Tissue type]: BLCA[Bladder Urothelial Carcinoma], BRCA[Breast invasive carcinoma], CESC[Cervical squamous cell carcinoma and endocervical adenocarcinoma], COAD[Colon adenocarcinoma], GBM[Glioblastoma multiforme], Glioma Low Grade, HNSC[Head and Neck squamous cell carcinoma], KICH[Kidney Chromophobe], KIRC[Kidney renal clear cell carcinoma], KIRP[Kidney renal papillary cell carcinoma], LAML[Acute Myeloid Leukemia], LUAD[Lung adenocarcinoma], LUSC[Lung squamous cell carcinoma], OV[Ovarian serous cystadenocarcinoma ], PAAD[Pancreatic adenocarcinoma], PRAD[Prostate adenocarcinoma], SKCM[Skin Cutaneous Melanoma], STAD[Stomach adenocarcinoma], THCA[Thyroid carcinoma], UCEC[Uterine Corpus Endometrial Carcinoma] |
| Top |
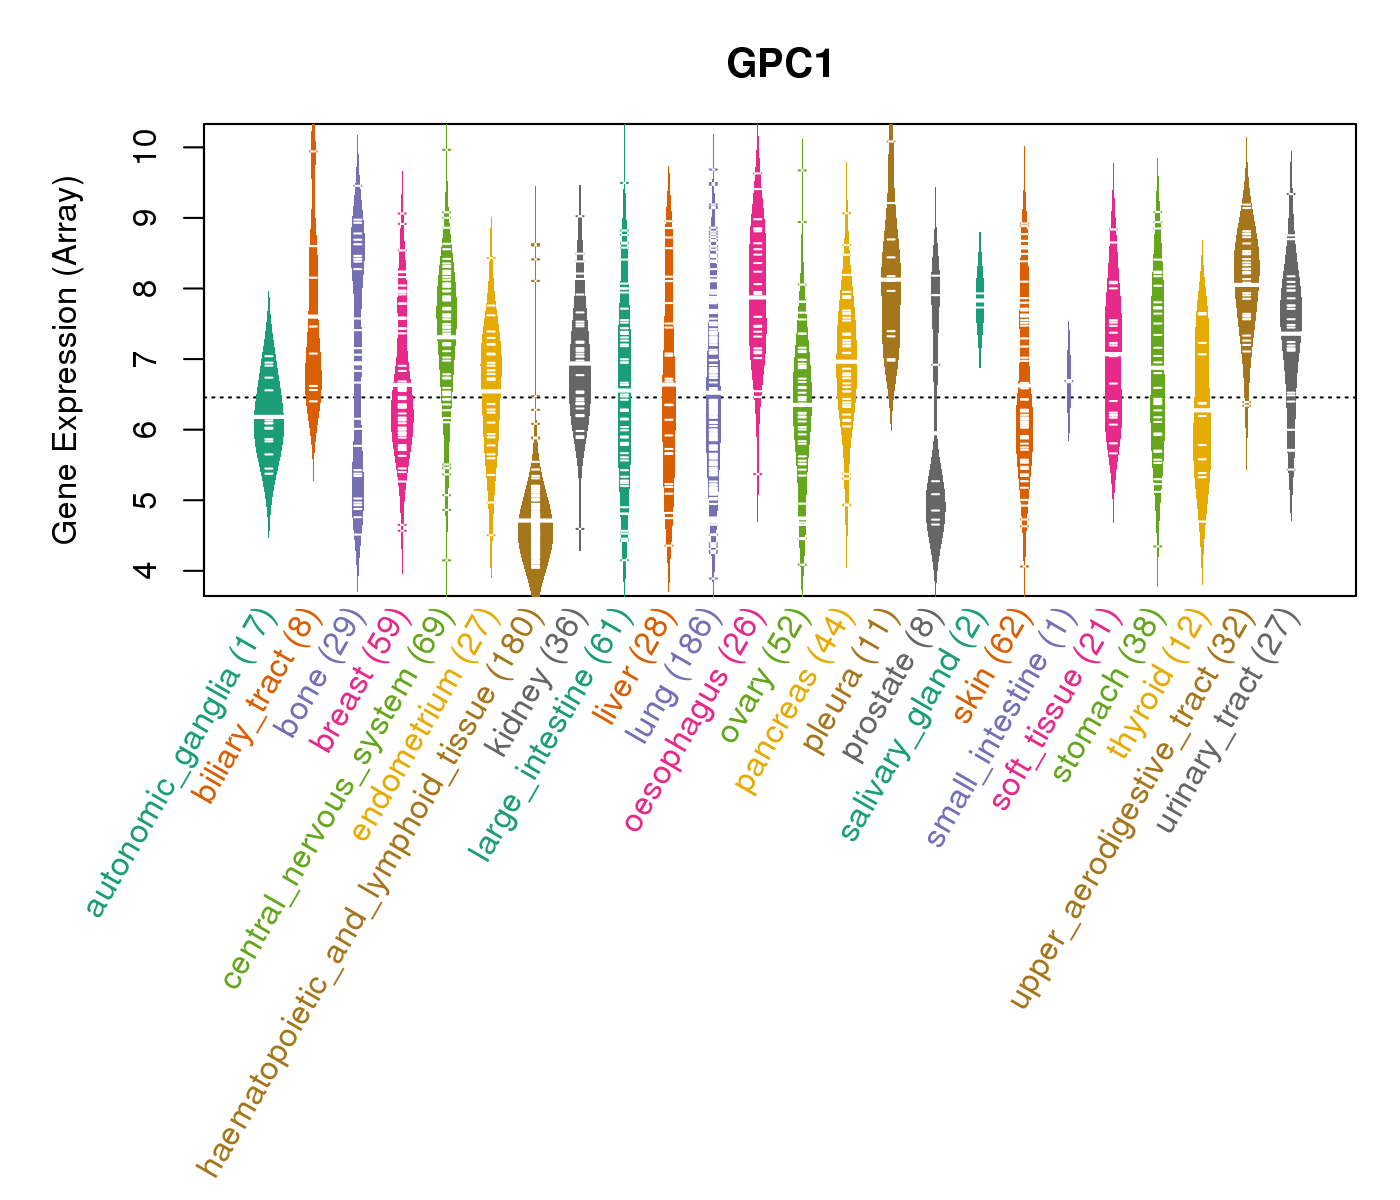
| Gene Expression for GPC1 |
| * CCLE gene expression data were extracted from CCLE_Expression_Entrez_2012-10-18.res: Gene-centric RMA-normalized mRNA expression data. |
 |
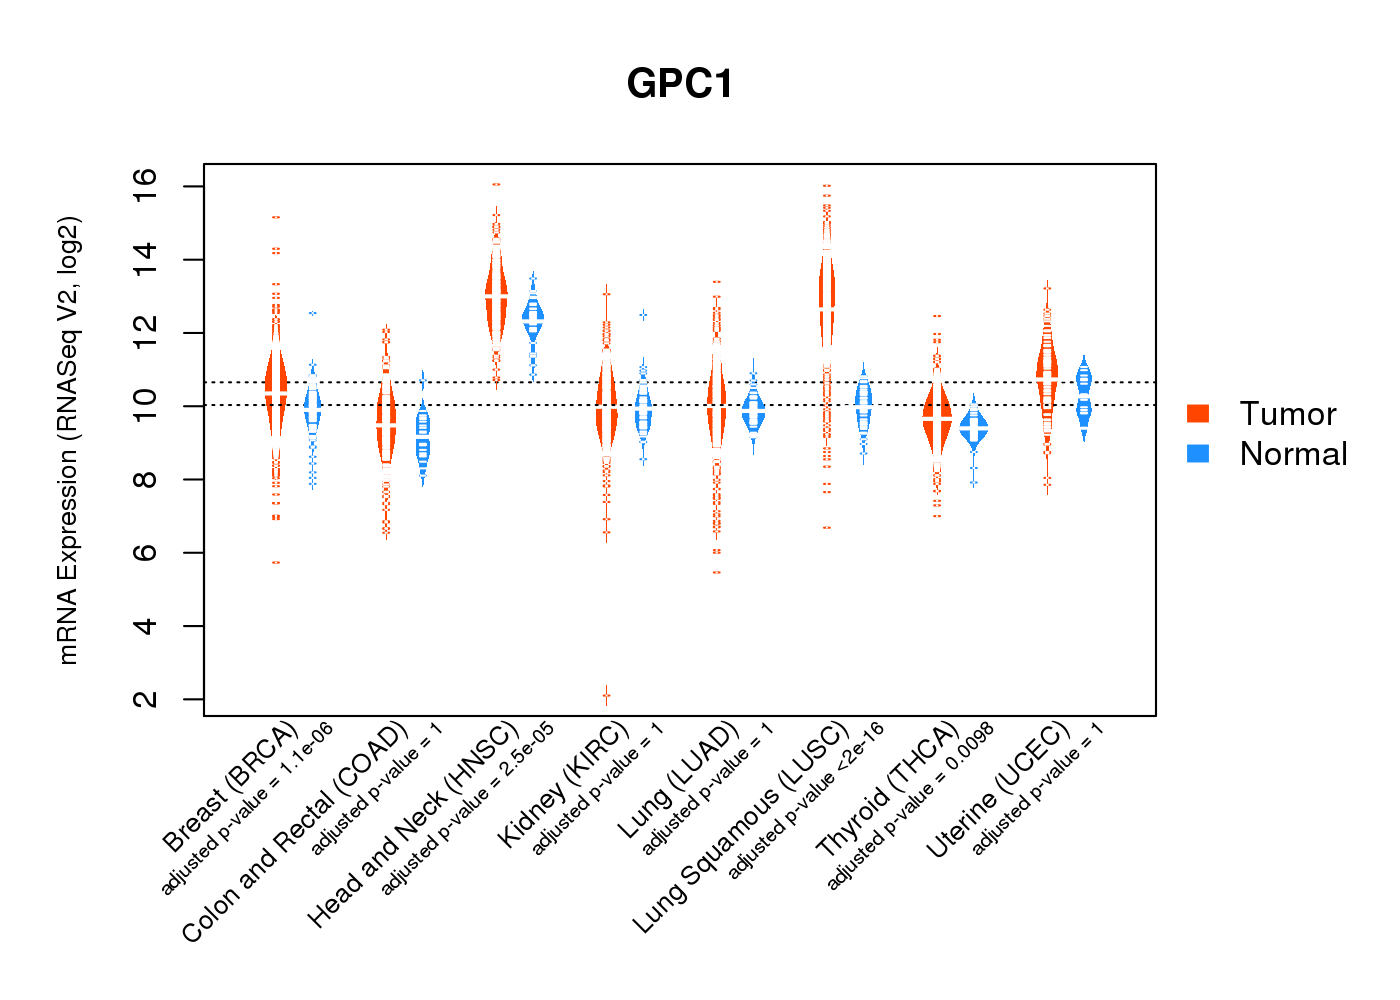
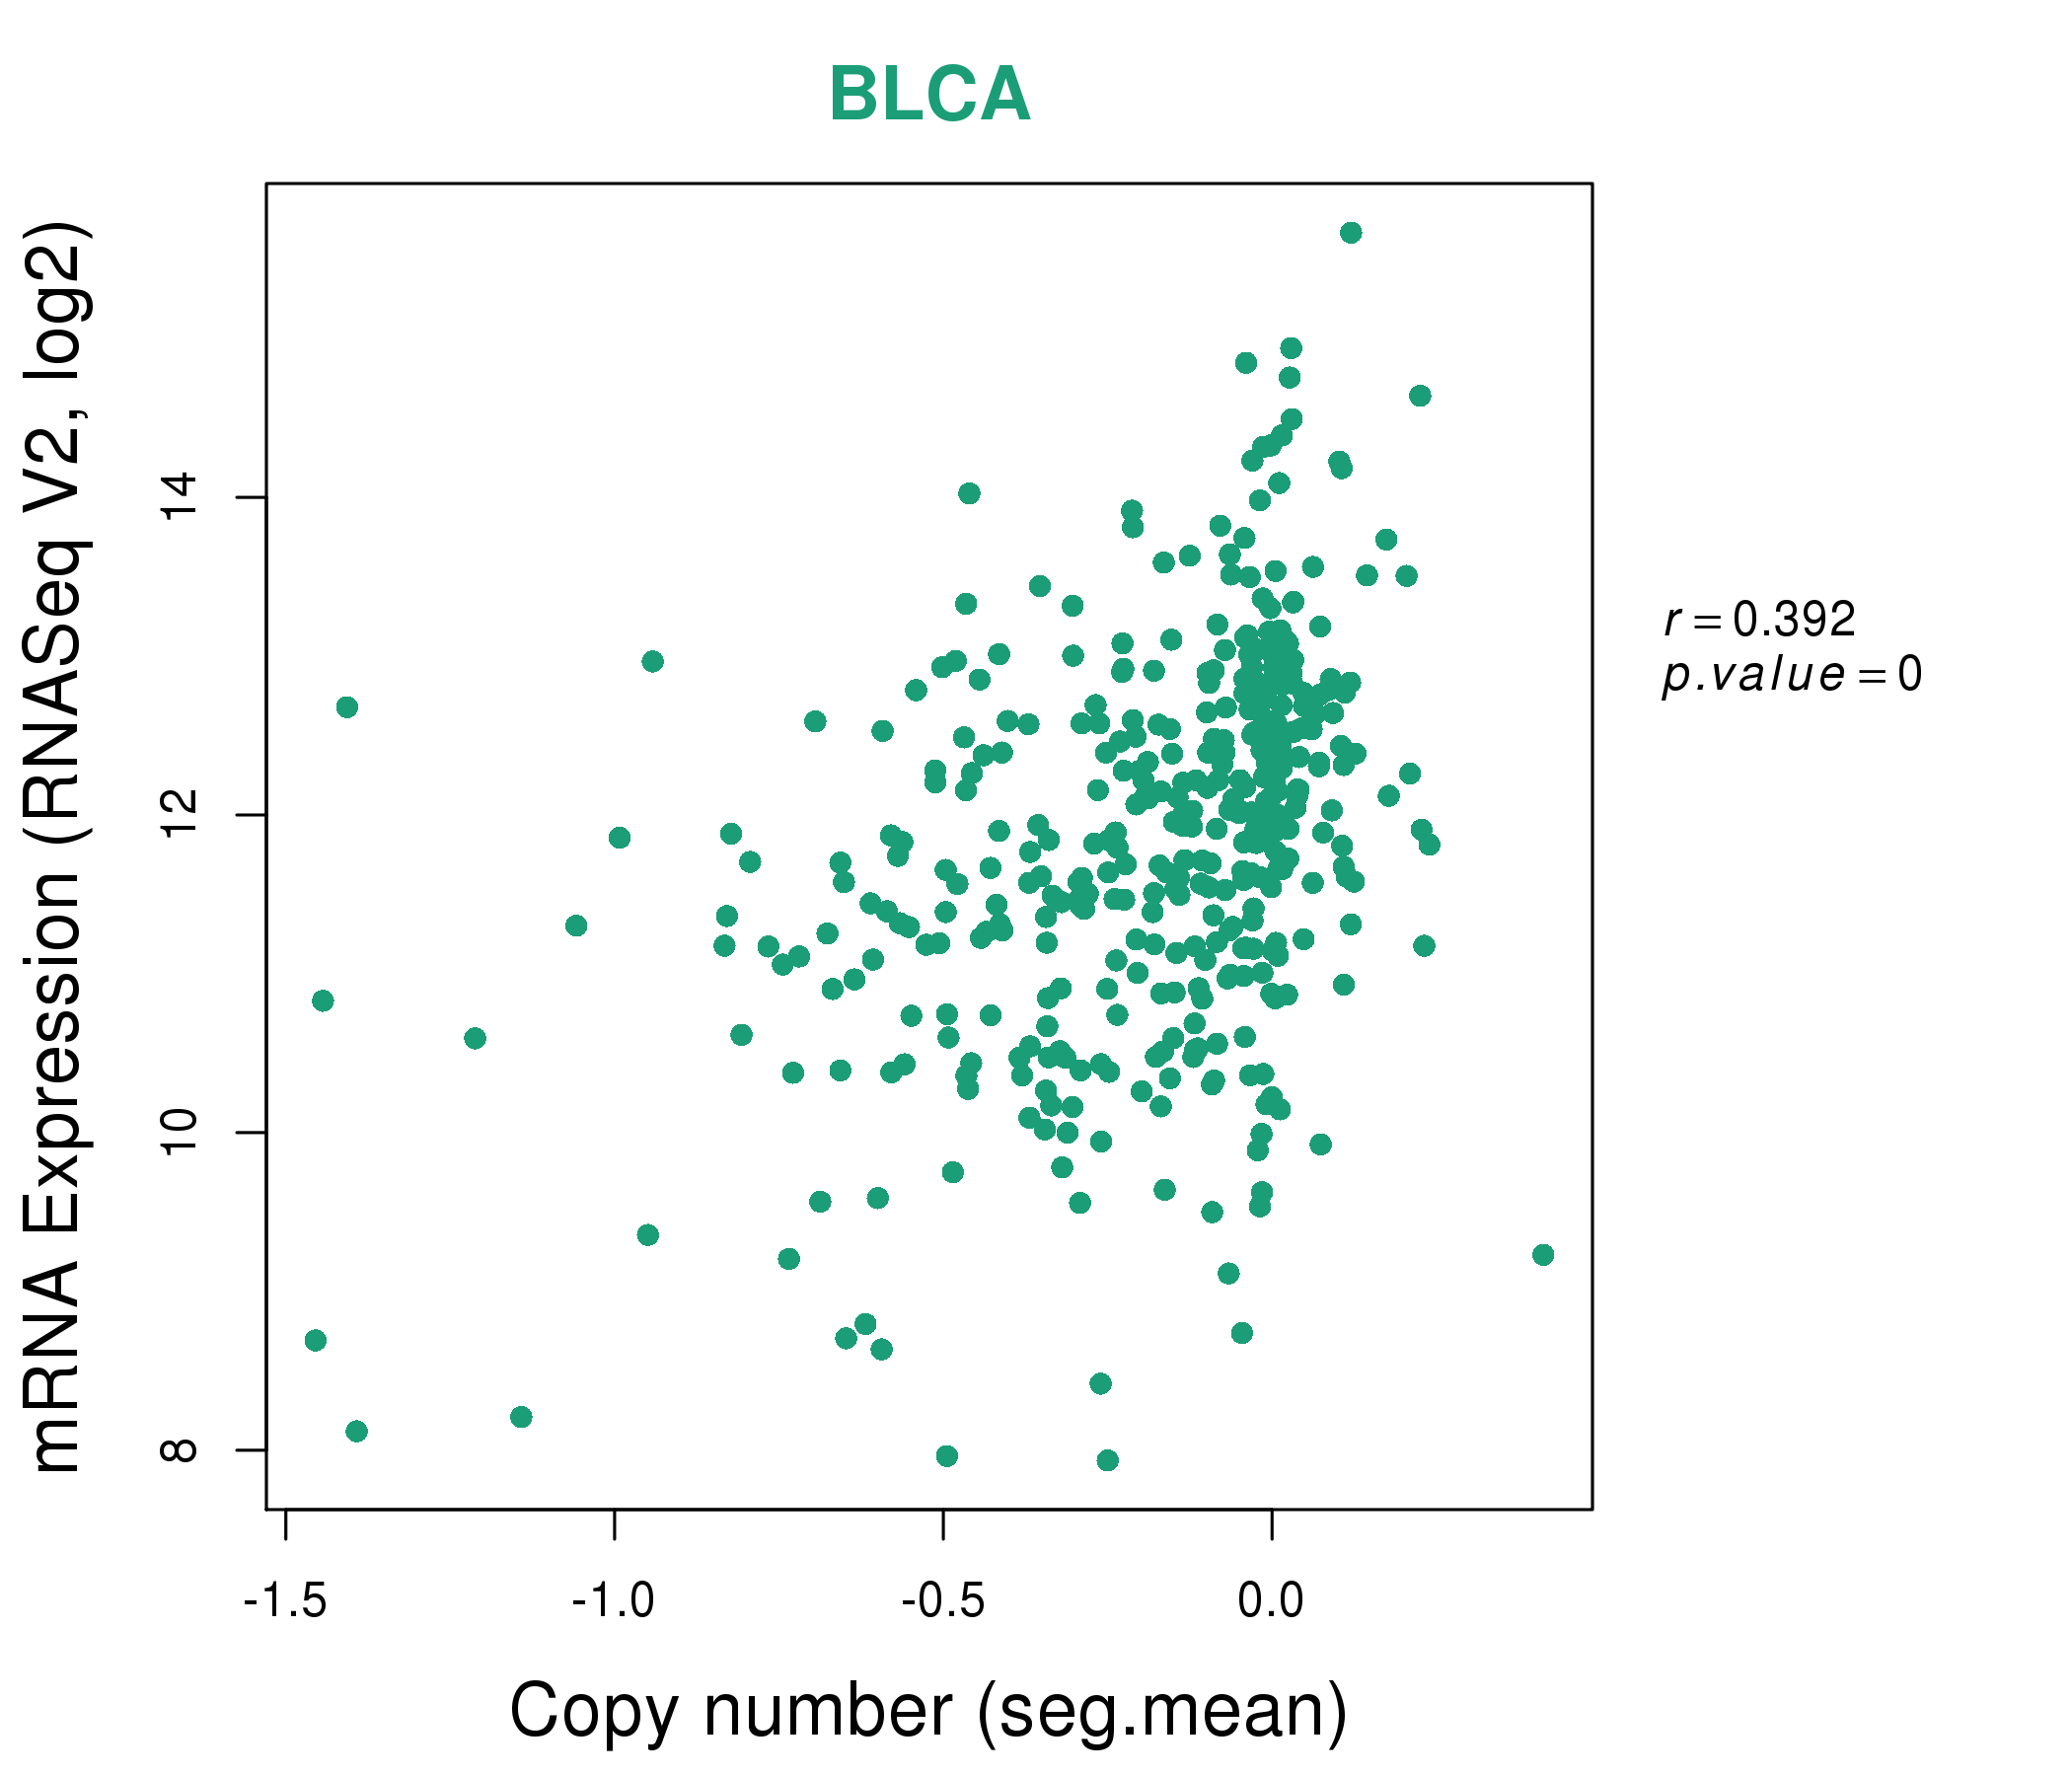
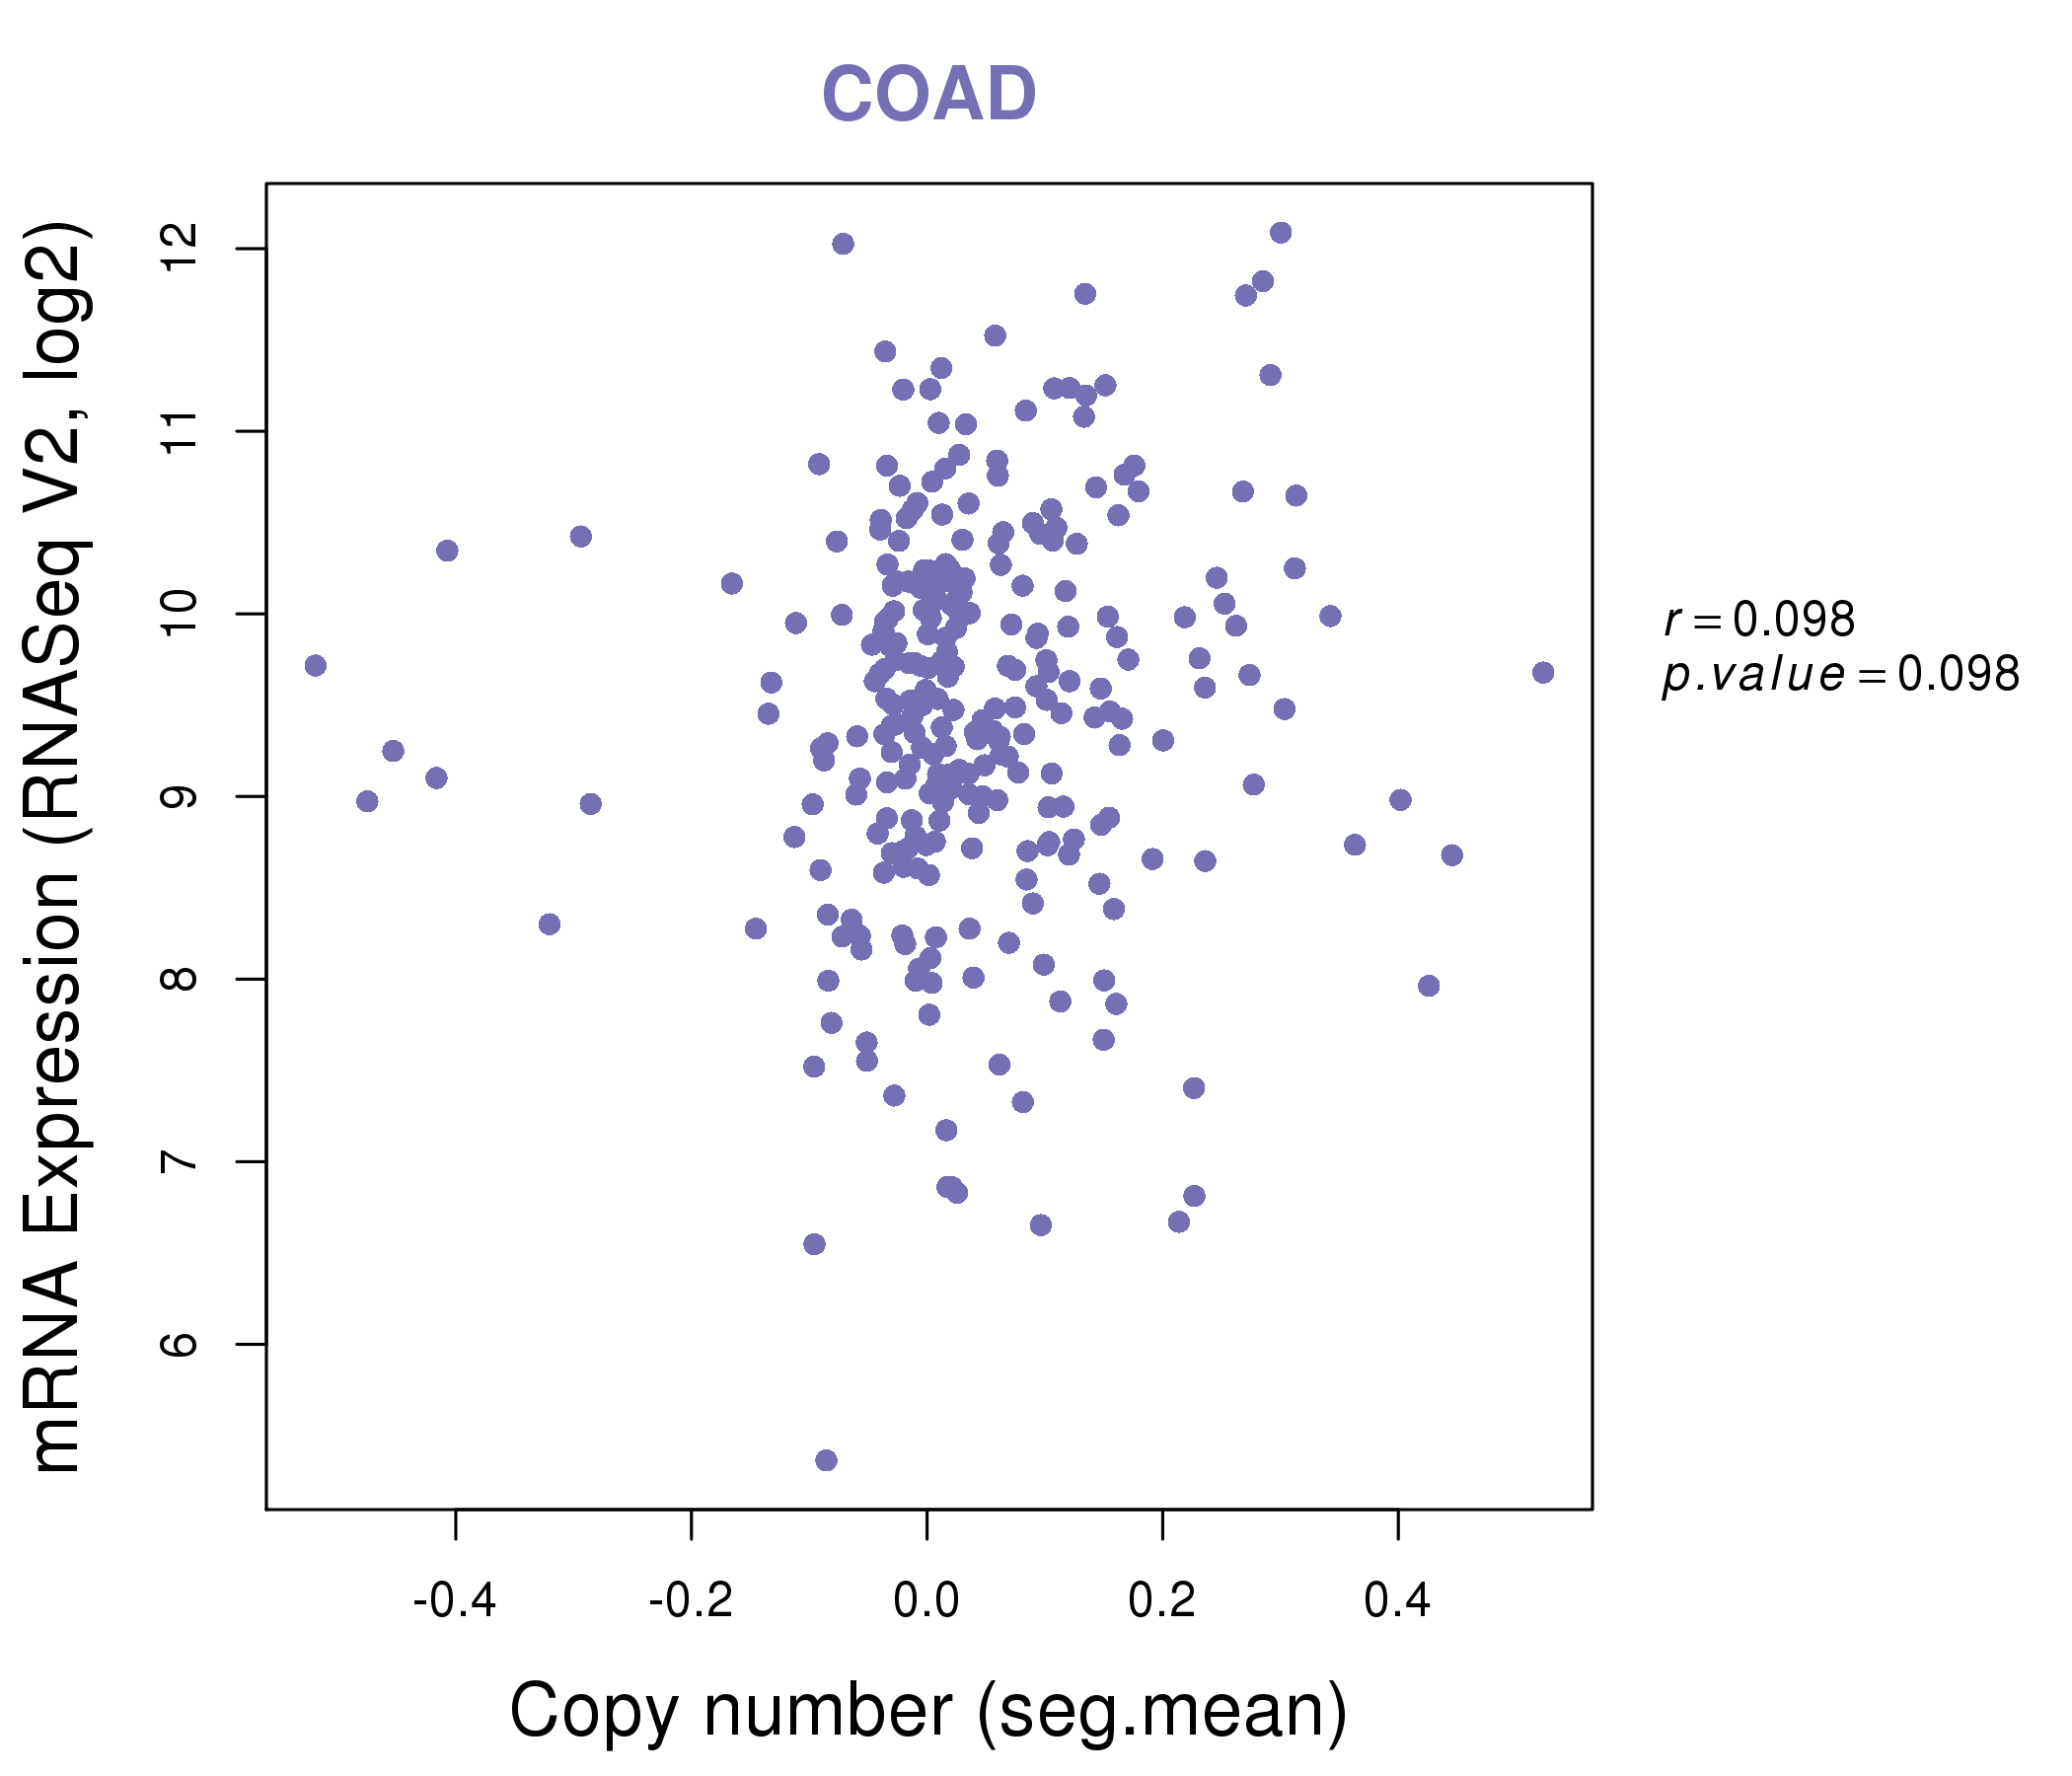
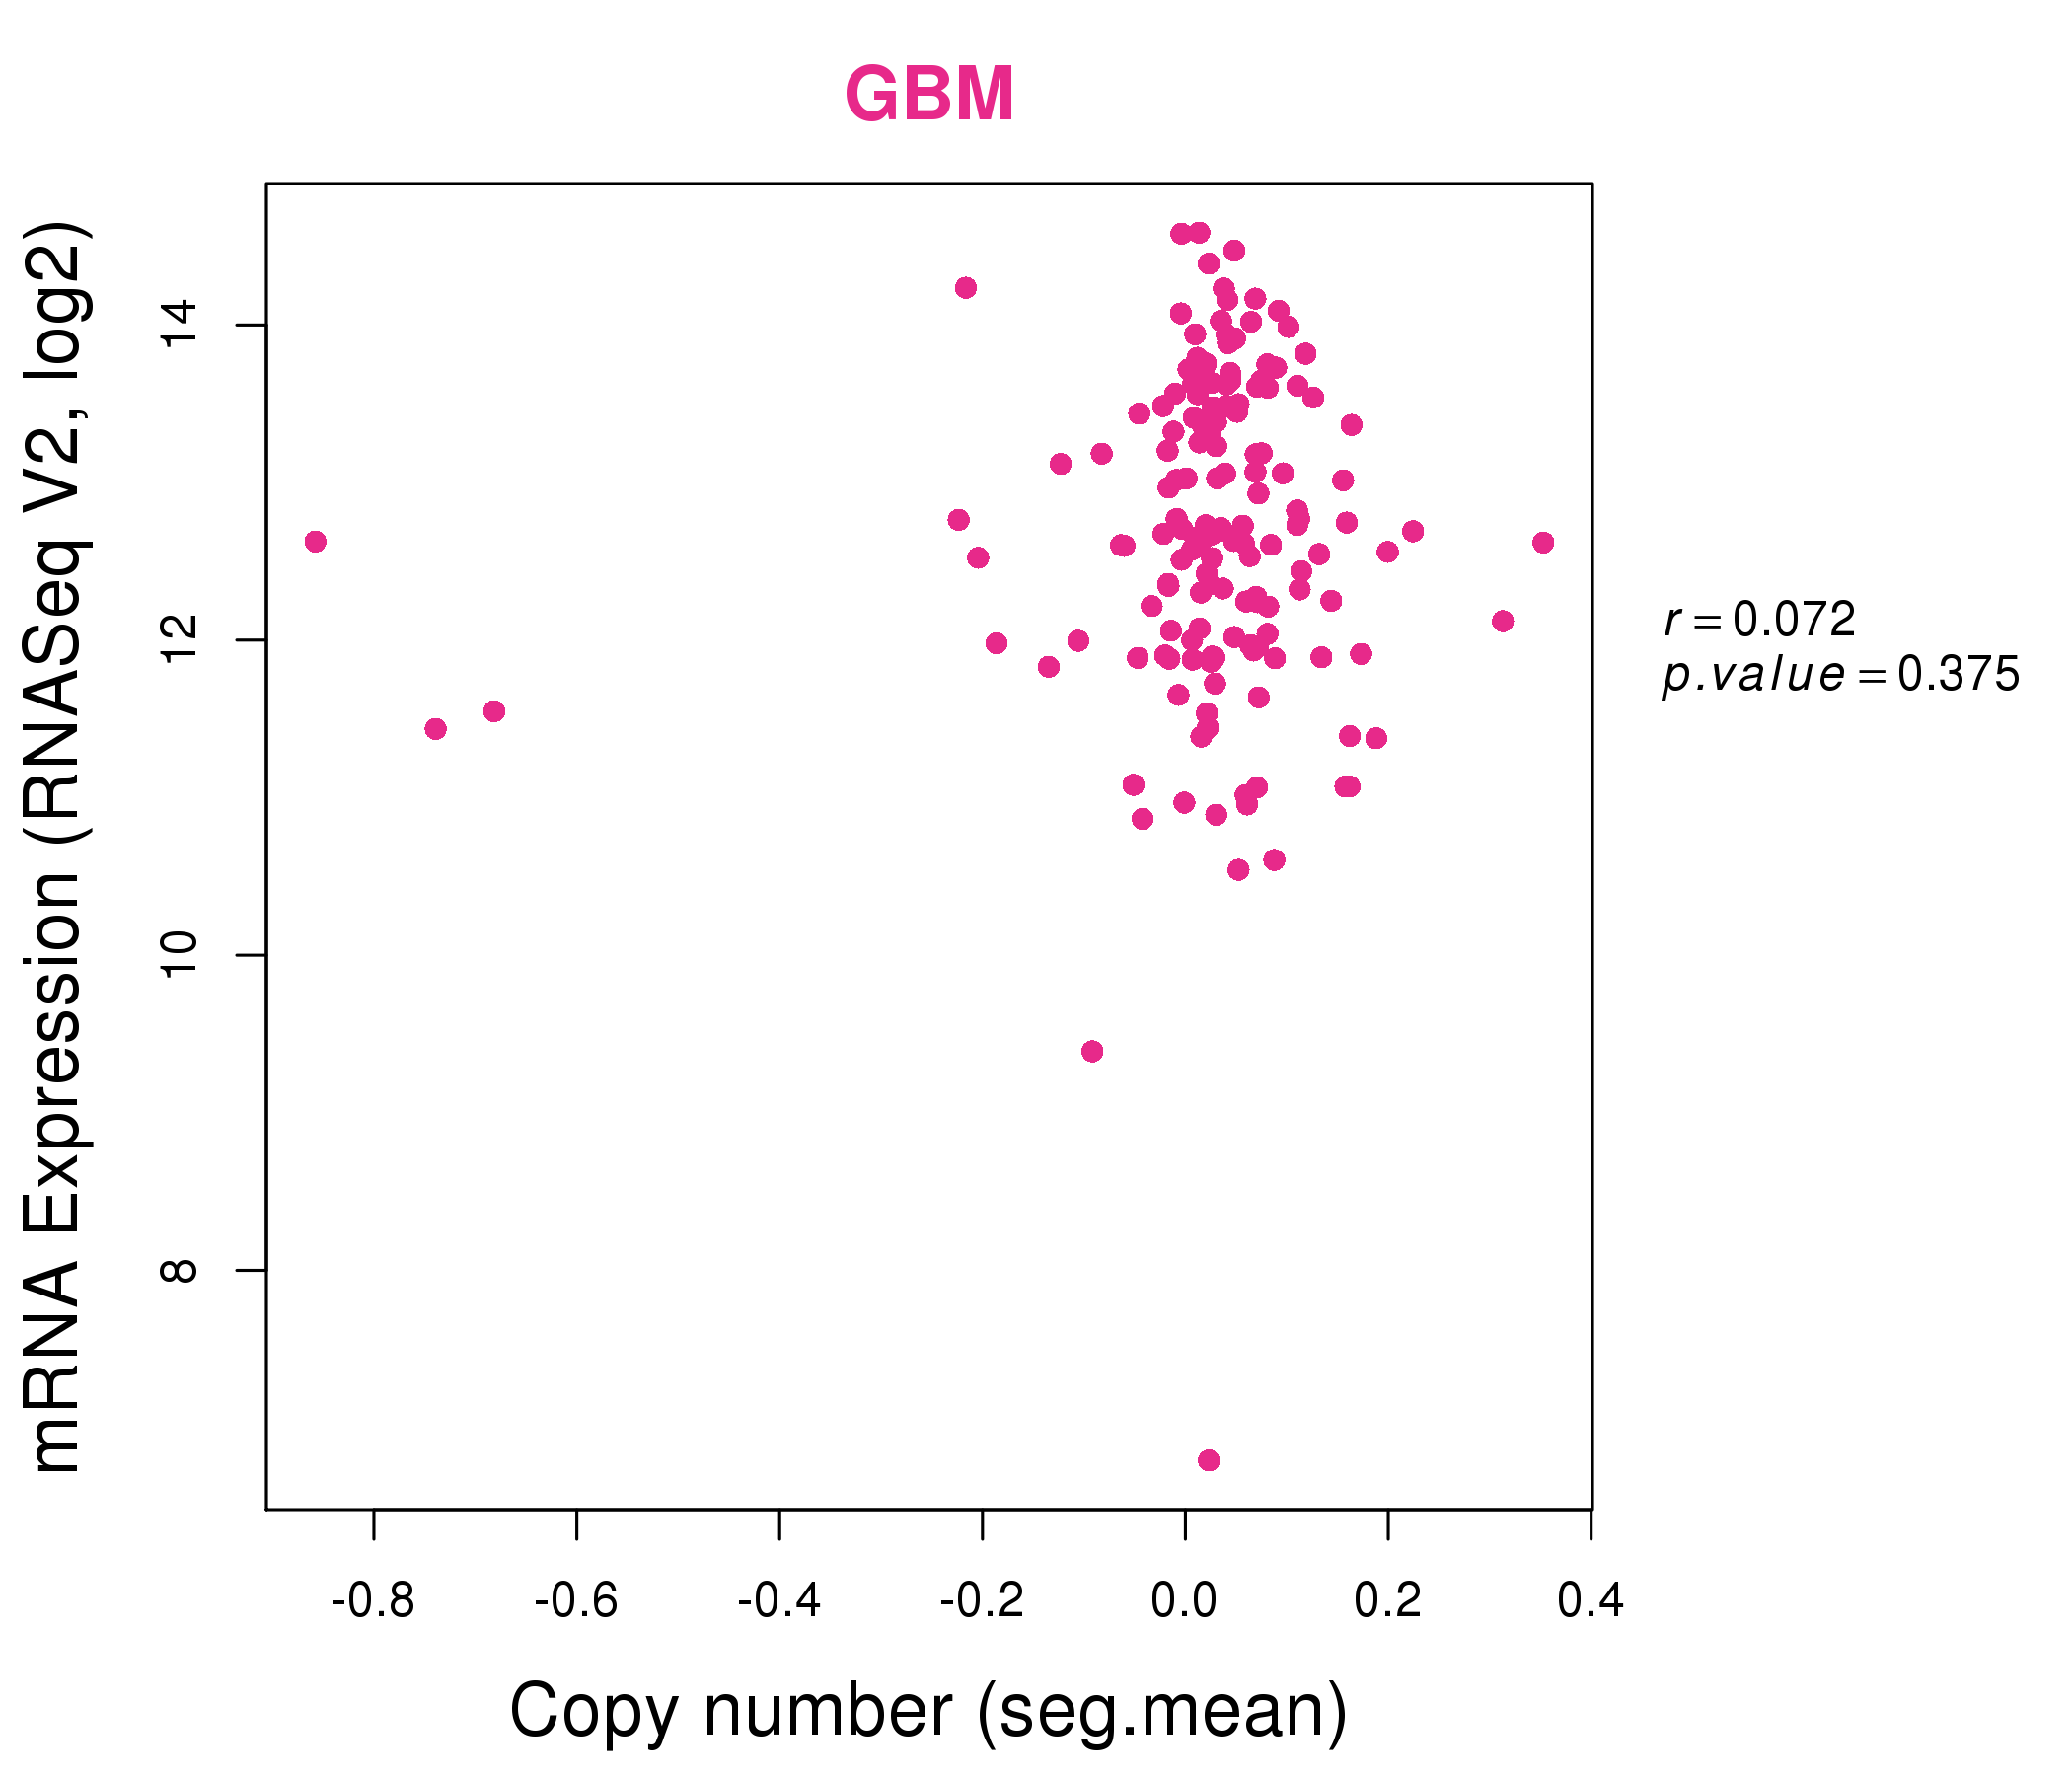
| * Normalized gene expression data of RNASeqV2 was extracted from TCGA using R package TCGA-Assembler. The URLs of all public data files on TCGA DCC data server were gathered at Jan-05-2015. Only eight cancer types have enough normal control samples for differential expression analysis. (t test, adjusted p<0.05 (using Benjamini-Hochberg FDR)) |
 |
| Top |
| * This plots show the correlation between CNV and gene expression. |
: Open all plots for all cancer types
 |
|
 |
|

| Top |
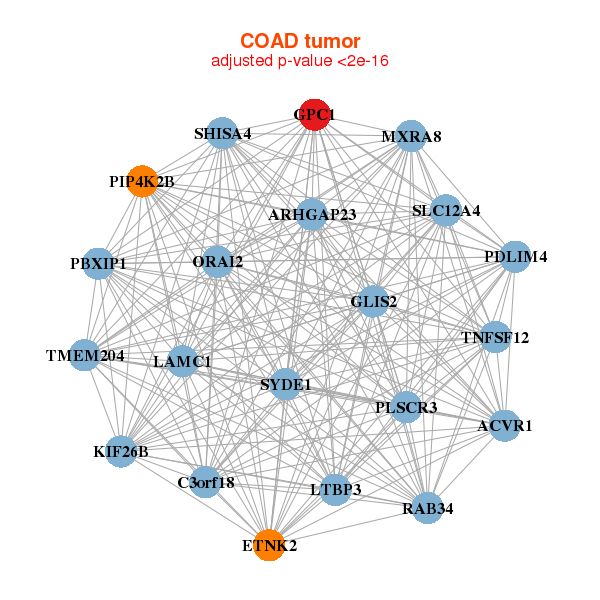
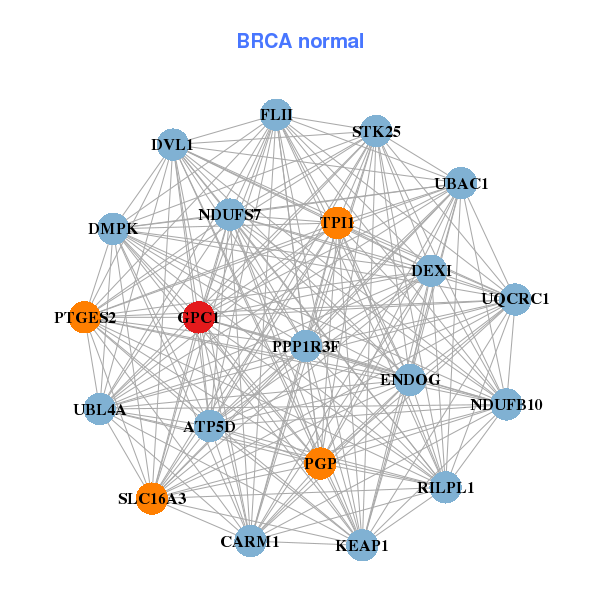
| Gene-Gene Network Information |
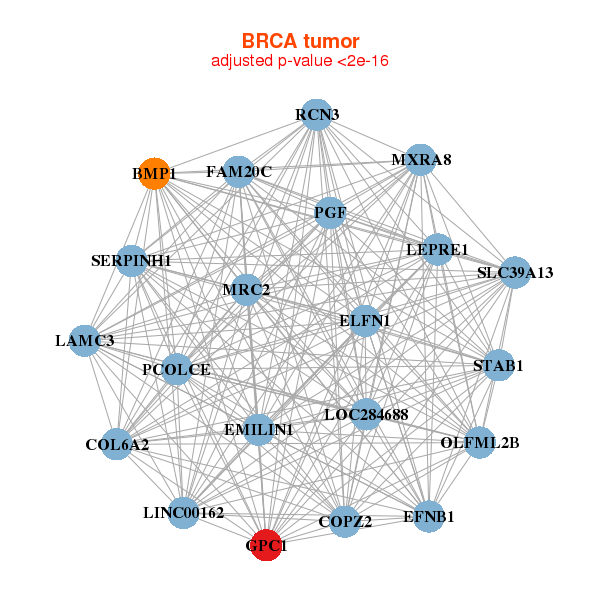
| * Co-Expression network figures were drawn using R package igraph. Only the top 20 genes with the highest correlations were shown. Red circle: input gene, orange circle: cell metabolism gene, sky circle: other gene |
: Open all plots for all cancer types
 |
| ||||
| BMP1,COL6A2,COPZ2,EFNB1,ELFN1,EMILIN1,FAM20C, GPC1,LAMC3,LEPRE1,LOC284688,MRC2,MXRA8,LINC00162, OLFML2B,PCOLCE,PGF,RCN3,SERPINH1,SLC39A13,STAB1 | ATP5D,CARM1,DEXI,DMPK,DVL1,ENDOG,FLII, GPC1,KEAP1,NDUFB10,NDUFS7,PGP,PPP1R3F,PTGES2, RILPL1,SLC16A3,STK25,TPI1,UBAC1,UBL4A,UQCRC1 | ||||
 |
| ||||
| ACVR1,ARHGAP23,C3orf18,ETNK2,GLIS2,GPC1,KIF26B, LAMC1,LTBP3,MXRA8,ORAI2,PBXIP1,PDLIM4,PIP4K2B, PLSCR3,RAB34,SHISA4,SLC12A4,SYDE1,TMEM204,TNFSF12 | ADARB1,ANKRD13B,CHST3,COL4A2,COL5A1,COL6A1,COL6A2, DCHS1,EHD2,EXTL3,GLI2,GLIS2,GPC1,HSPA12A, LAMA5,NACAD,NLGN2,PKD1,PXDN,SLC12A4,THBS3 |
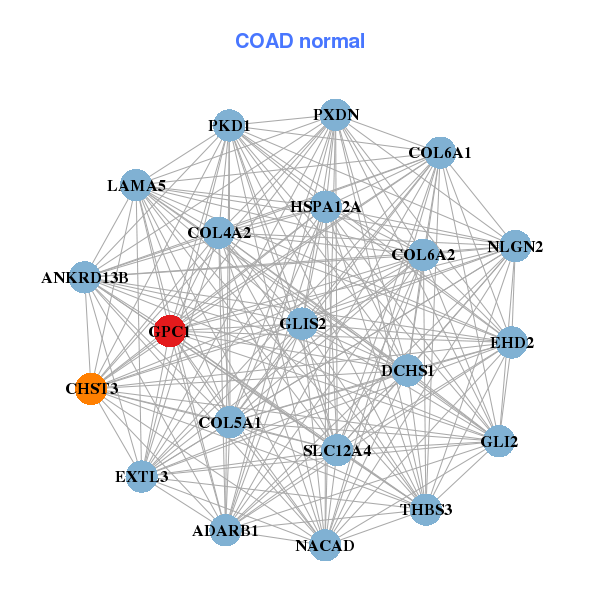
| * Co-Expression network figures were drawn using R package igraph. Only the top 20 genes with the highest correlations were shown. Red circle: input gene, orange circle: cell metabolism gene, sky circle: other gene |
: Open all plots for all cancer types
| Top |
: Open all interacting genes' information including KEGG pathway for all interacting genes from DAVID
| Top |
| Pharmacological Information for GPC1 |
| DB Category | DB Name | DB's ID and Url link |
| * Gene Centered Interaction Network. |
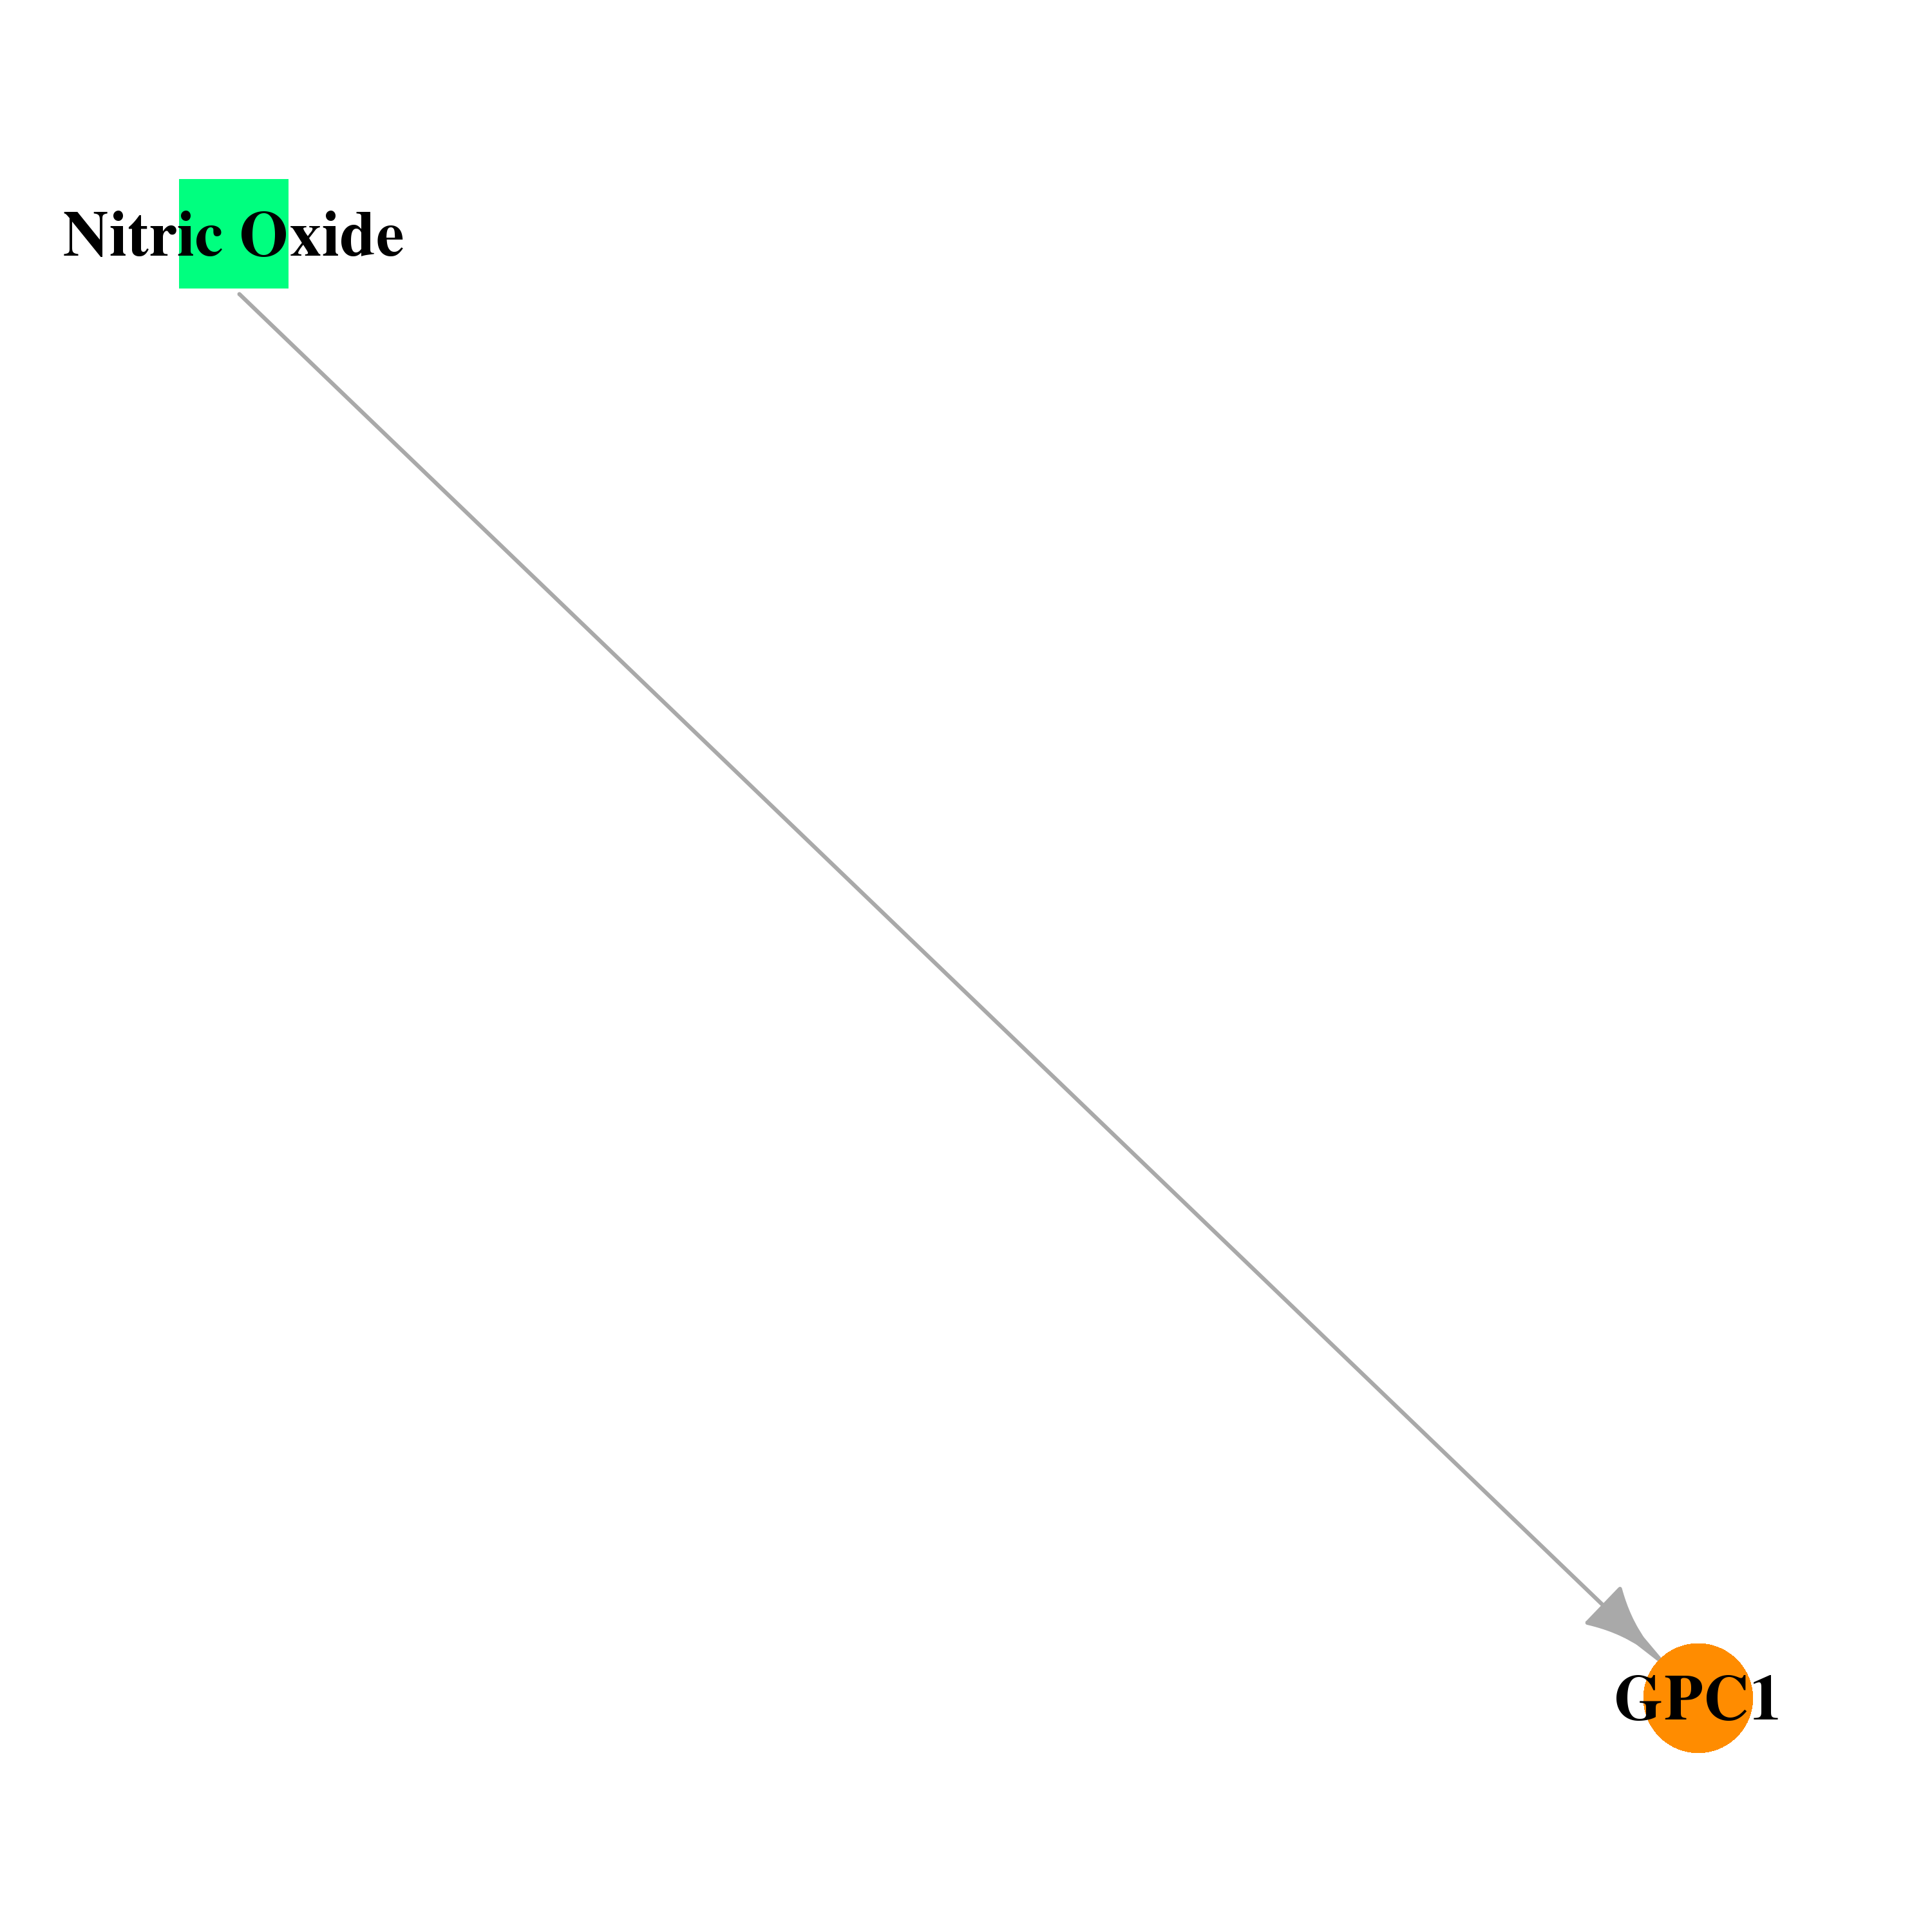 |
| * Drug Centered Interaction Network. |
| DrugBank ID | Target Name | Drug Groups | Generic Name | Drug Centered Network | Drug Structure |
| DB00435 | glypican 1 | approved | Nitric Oxide | 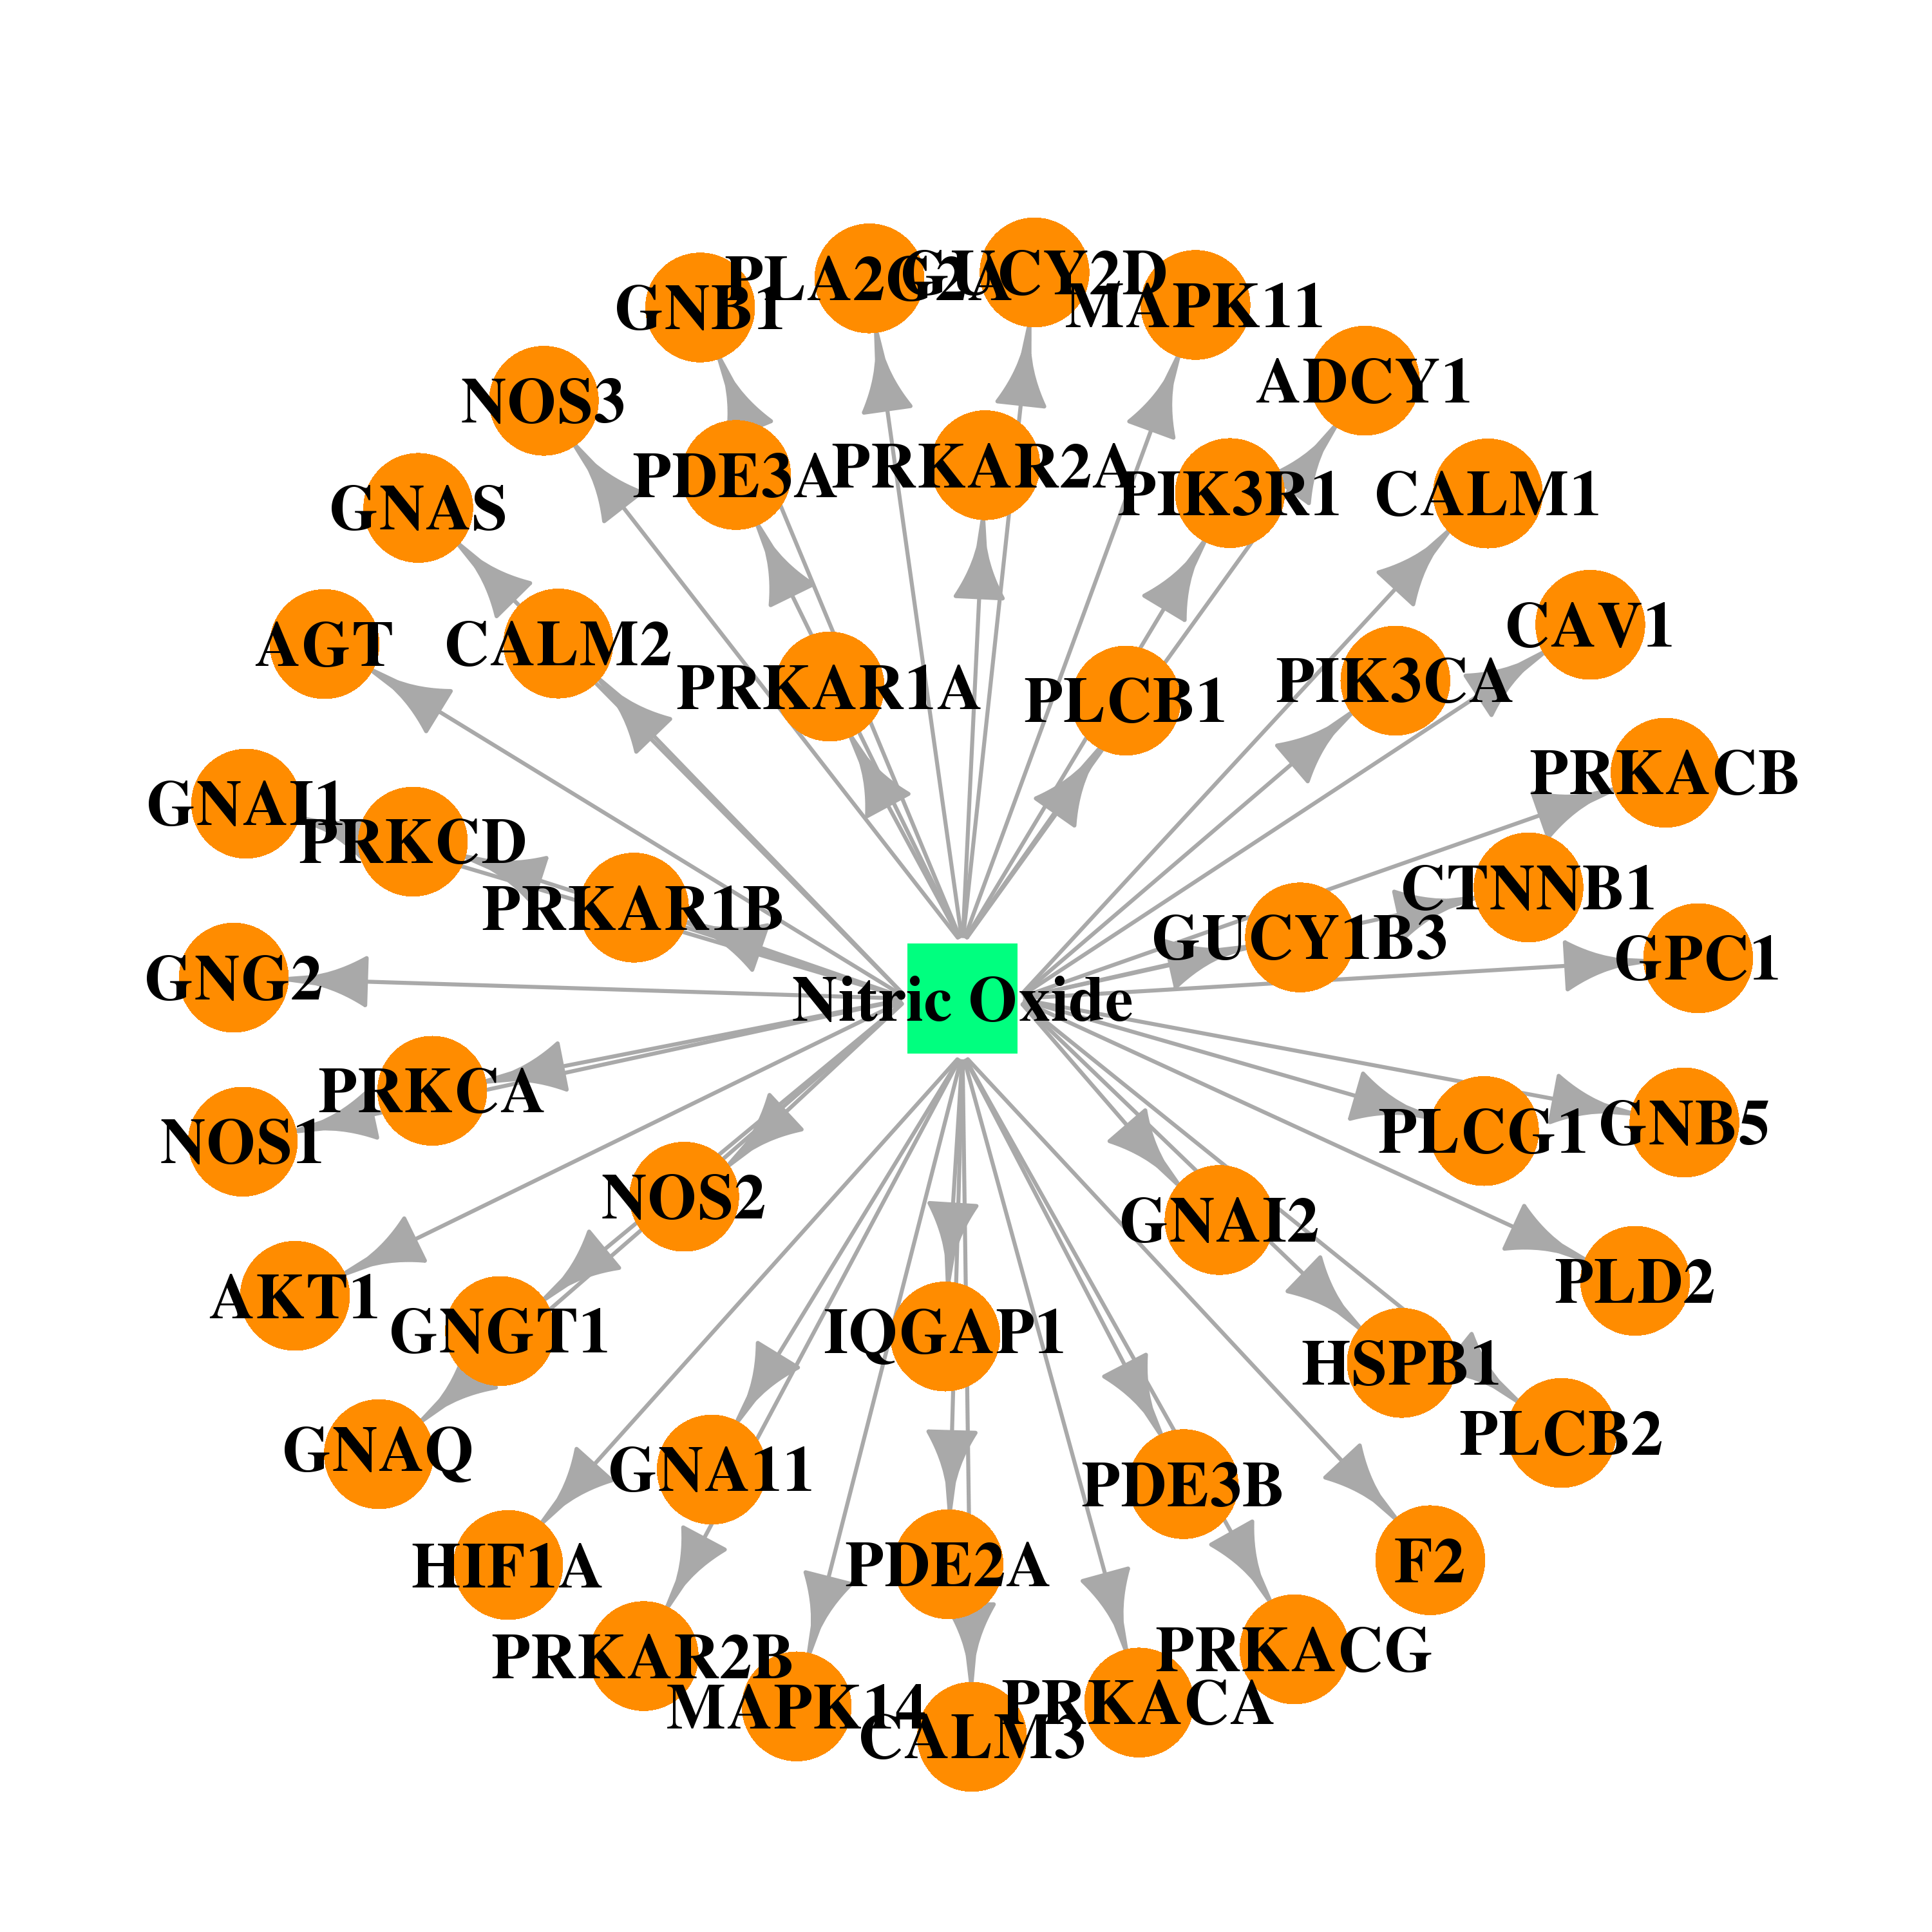 |  |
| Top |
| Cross referenced IDs for GPC1 |
| * We obtained these cross-references from Uniprot database. It covers 150 different DBs, 18 categories. http://www.uniprot.org/help/cross_references_section |
: Open all cross reference information
|
Copyright © 2016-Present - The Univsersity of Texas Health Science Center at Houston @ |