|
||||||||||||||||||||
| |
| Phenotypic Information (metabolism pathway, cancer, disease, phenome) |
| |
| |
| Gene-Gene Network Information: Co-Expression Network, Interacting Genes & KEGG |
| |
|


| Gene Summary for GPD1 |
| Basic gene info. | Gene symbol | GPD1 |
| Gene name | glycerol-3-phosphate dehydrogenase 1 (soluble) | |
| Synonyms | GPD-C|GPDH-C|HTGTI | |
| Cytomap | UCSC genome browser: 12q13.12 | |
| Genomic location | chr12 :50497601-50505103 | |
| Type of gene | protein-coding | |
| RefGenes | NM_001257199.1, NM_005276.3, | |
| Ensembl id | ENSG00000167588 | |
| Description | glycerol-3-phosphate dehydrogenase [NAD(+)], cytoplasmicglycerol-3-phosphate dehydrogenase [NAD+], cytoplasmicglycerophosphate dehydrogenase | |
| Modification date | 20141207 | |
| dbXrefs | MIM : 138420 | |
| HGNC : HGNC | ||
| Ensembl : ENSG00000167588 | ||
| HPRD : 00714 | ||
| Vega : OTTHUMG00000169813 | ||
| Protein | UniProt: go to UniProt's Cross Reference DB Table | |
| Expression | CleanEX: HS_GPD1 | |
| BioGPS: 2819 | ||
| Gene Expression Atlas: ENSG00000167588 | ||
| The Human Protein Atlas: ENSG00000167588 | ||
| Pathway | NCI Pathway Interaction Database: GPD1 | |
| KEGG: GPD1 | ||
| REACTOME: GPD1 | ||
| ConsensusPathDB | ||
| Pathway Commons: GPD1 | ||
| Metabolism | MetaCyc: GPD1 | |
| HUMANCyc: GPD1 | ||
| Regulation | Ensembl's Regulation: ENSG00000167588 | |
| miRBase: chr12 :50,497,601-50,505,103 | ||
| TargetScan: NM_001257199 | ||
| cisRED: ENSG00000167588 | ||
| Context | iHOP: GPD1 | |
| cancer metabolism search in PubMed: GPD1 | ||
| UCL Cancer Institute: GPD1 | ||
| Assigned class in ccmGDB | C | |
| Top |
| Phenotypic Information for GPD1(metabolism pathway, cancer, disease, phenome) |
| Cancer | CGAP: GPD1 |
| Familial Cancer Database: GPD1 | |
| * This gene is included in those cancer gene databases. |
|
|
|
|
|
|
| ||||||||||||||
Oncogene 1 | Significant driver gene in | |||||||||||||||||||
| cf) number; DB name 1 Oncogene; http://nar.oxfordjournals.org/content/35/suppl_1/D721.long, 2 Tumor Suppressor gene; https://bioinfo.uth.edu/TSGene/, 3 Cancer Gene Census; http://www.nature.com/nrc/journal/v4/n3/abs/nrc1299.html, 4 CancerGenes; http://nar.oxfordjournals.org/content/35/suppl_1/D721.long, 5 Network of Cancer Gene; http://ncg.kcl.ac.uk/index.php, 1Therapeutic Vulnerabilities in Cancer; http://cbio.mskcc.org/cancergenomics/statius/ |
| KEGG_GLYCEROPHOSPHOLIPID_METABOLISM REACTOME_PHOSPHOLIPID_METABOLISM REACTOME_METABOLISM_OF_LIPIDS_AND_LIPOPROTEINS | |
| OMIM | |
| Orphanet | |
| Disease | KEGG Disease: GPD1 |
| MedGen: GPD1 (Human Medical Genetics with Condition) | |
| ClinVar: GPD1 | |
| Phenotype | MGI: GPD1 (International Mouse Phenotyping Consortium) |
| PhenomicDB: GPD1 | |
| Mutations for GPD1 |
| * Under tables are showing count per each tissue to give us broad intuition about tissue specific mutation patterns.You can go to the detailed page for each mutation database's web site. |
| There's no structural variation information in COSMIC data for this gene. |
| * From mRNA Sanger sequences, Chitars2.0 arranged chimeric transcripts. This table shows GPD1 related fusion information. |
| ID | Head Gene | Tail Gene | Accession | Gene_a | qStart_a | qEnd_a | Chromosome_a | tStart_a | tEnd_a | Gene_a | qStart_a | qEnd_a | Chromosome_a | tStart_a | tEnd_a |
| U22961 | GPD1 | 1 | 1714 | 12 | 50500051 | 50501765 | GPD1 | 1712 | 1850 | 12 | 50502347 | 50502485 | |
| Top |
| There's no copy number variation information in COSMIC data for this gene. |
| Top |
|
 |
| Top |
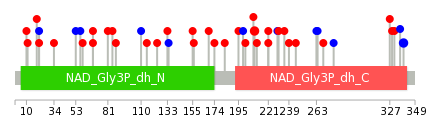
| Stat. for Non-Synonymous SNVs (# total SNVs=21) | (# total SNVs=7) |
 |  |
(# total SNVs=0) | (# total SNVs=0) |
| Top |
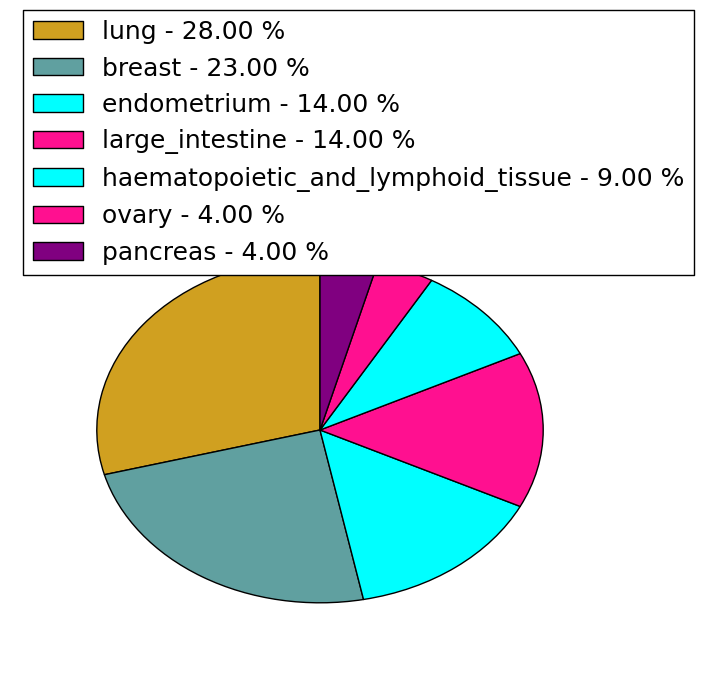
| * When you move the cursor on each content, you can see more deailed mutation information on the Tooltip. Those are primary_site,primary_histology,mutation(aa),pubmedID. |
| GRCh37 position | Mutation(aa) | Unique sampleID count |
| chr12:50501363-50501363 | p.V209G | 2 |
| chr12:50498517-50498517 | p.K68E | 2 |
| chr12:50501398-50501398 | p.D221H | 2 |
| chr12:50503269-50503269 | p.I339I | 2 |
| chr12:50501542-50501542 | p.R269W | 1 |
| chr12:50498486-50498486 | p.Q57Q | 1 |
| chr12:50500108-50500108 | p.S133L | 1 |
| chr12:50501571-50501571 | p.A278A | 1 |
| chr12:50498490-50498490 | p.E59K | 1 |
| chr12:50500112-50500112 | p.E134E | 1 |
| Top |
|
 |
| Point Mutation/ Tissue ID | 1 | 2 | 3 | 4 | 5 | 6 | 7 | 8 | 9 | 10 | 11 | 12 | 13 | 14 | 15 | 16 | 17 | 18 | 19 | 20 |
| # sample | 2 | 3 | 1 | 3 | 2 | 1 | 1 | 6 | 6 | 5 | ||||||||||
| # mutation | 2 | 3 | 1 | 3 | 2 | 1 | 1 | 8 | 6 | 5 | ||||||||||
| nonsynonymous SNV | 2 | 2 | 3 | 2 | 7 | 5 | 3 | |||||||||||||
| synonymous SNV | 1 | 1 | 1 | 1 | 1 | 1 | 2 |
| cf) Tissue ID; Tissue type (1; BLCA[Bladder Urothelial Carcinoma], 2; BRCA[Breast invasive carcinoma], 3; CESC[Cervical squamous cell carcinoma and endocervical adenocarcinoma], 4; COAD[Colon adenocarcinoma], 5; GBM[Glioblastoma multiforme], 6; Glioma Low Grade, 7; HNSC[Head and Neck squamous cell carcinoma], 8; KICH[Kidney Chromophobe], 9; KIRC[Kidney renal clear cell carcinoma], 10; KIRP[Kidney renal papillary cell carcinoma], 11; LAML[Acute Myeloid Leukemia], 12; LUAD[Lung adenocarcinoma], 13; LUSC[Lung squamous cell carcinoma], 14; OV[Ovarian serous cystadenocarcinoma ], 15; PAAD[Pancreatic adenocarcinoma], 16; PRAD[Prostate adenocarcinoma], 17; SKCM[Skin Cutaneous Melanoma], 18:STAD[Stomach adenocarcinoma], 19:THCA[Thyroid carcinoma], 20:UCEC[Uterine Corpus Endometrial Carcinoma]) |
| Top |
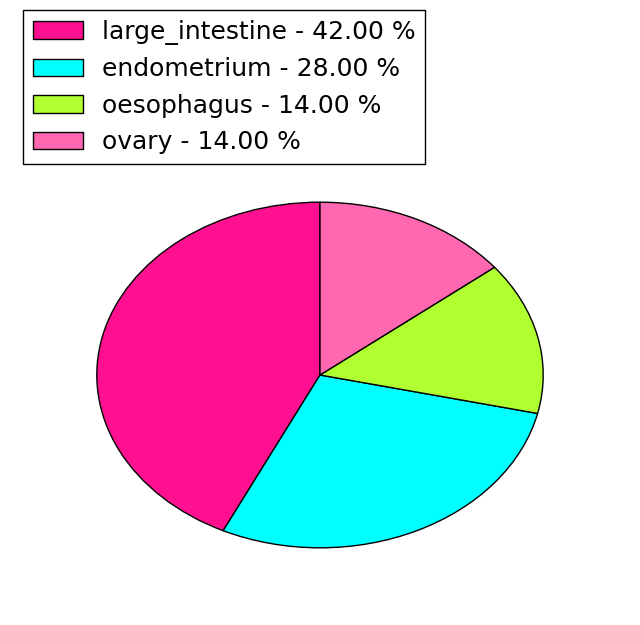
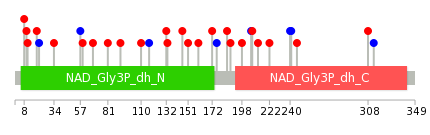
| * We represented just top 10 SNVs. When you move the cursor on each content, you can see more deailed mutation information on the Tooltip. Those are primary_site, primary_histology, mutation(aa), pubmedID. |
| Genomic Position | Mutation(aa) | Unique sampleID count |
| chr12:50498517 | p.T240T,GPD1 | 1 |
| chr12:50500685 | p.S110L,GPD1 | 1 |
| chr12:50503243 | p.T241T,GPD1 | 1 |
| chr12:50499353 | p.L117L,GPD1 | 1 |
| chr12:50501360 | p.E132K,GPD1 | 1 |
| chr12:50503260 | p.R246W,GPD1 | 1 |
| chr12:50499454 | p.V133M,GPD1 | 1 |
| chr12:50501368 | p.E308K,GPD1 | 1 |
| chr12:50497855 | p.K146N,GPD1 | 1 |
| chr12:50500108 | p.G313G,GPD1 | 1 |
| * Copy number data were extracted from TCGA using R package TCGA-Assembler. The URLs of all public data files on TCGA DCC data server were gathered on Jan-05-2015. Function ProcessCNAData in TCGA-Assembler package was used to obtain gene-level copy number value which is calculated as the average copy number of the genomic region of a gene. |
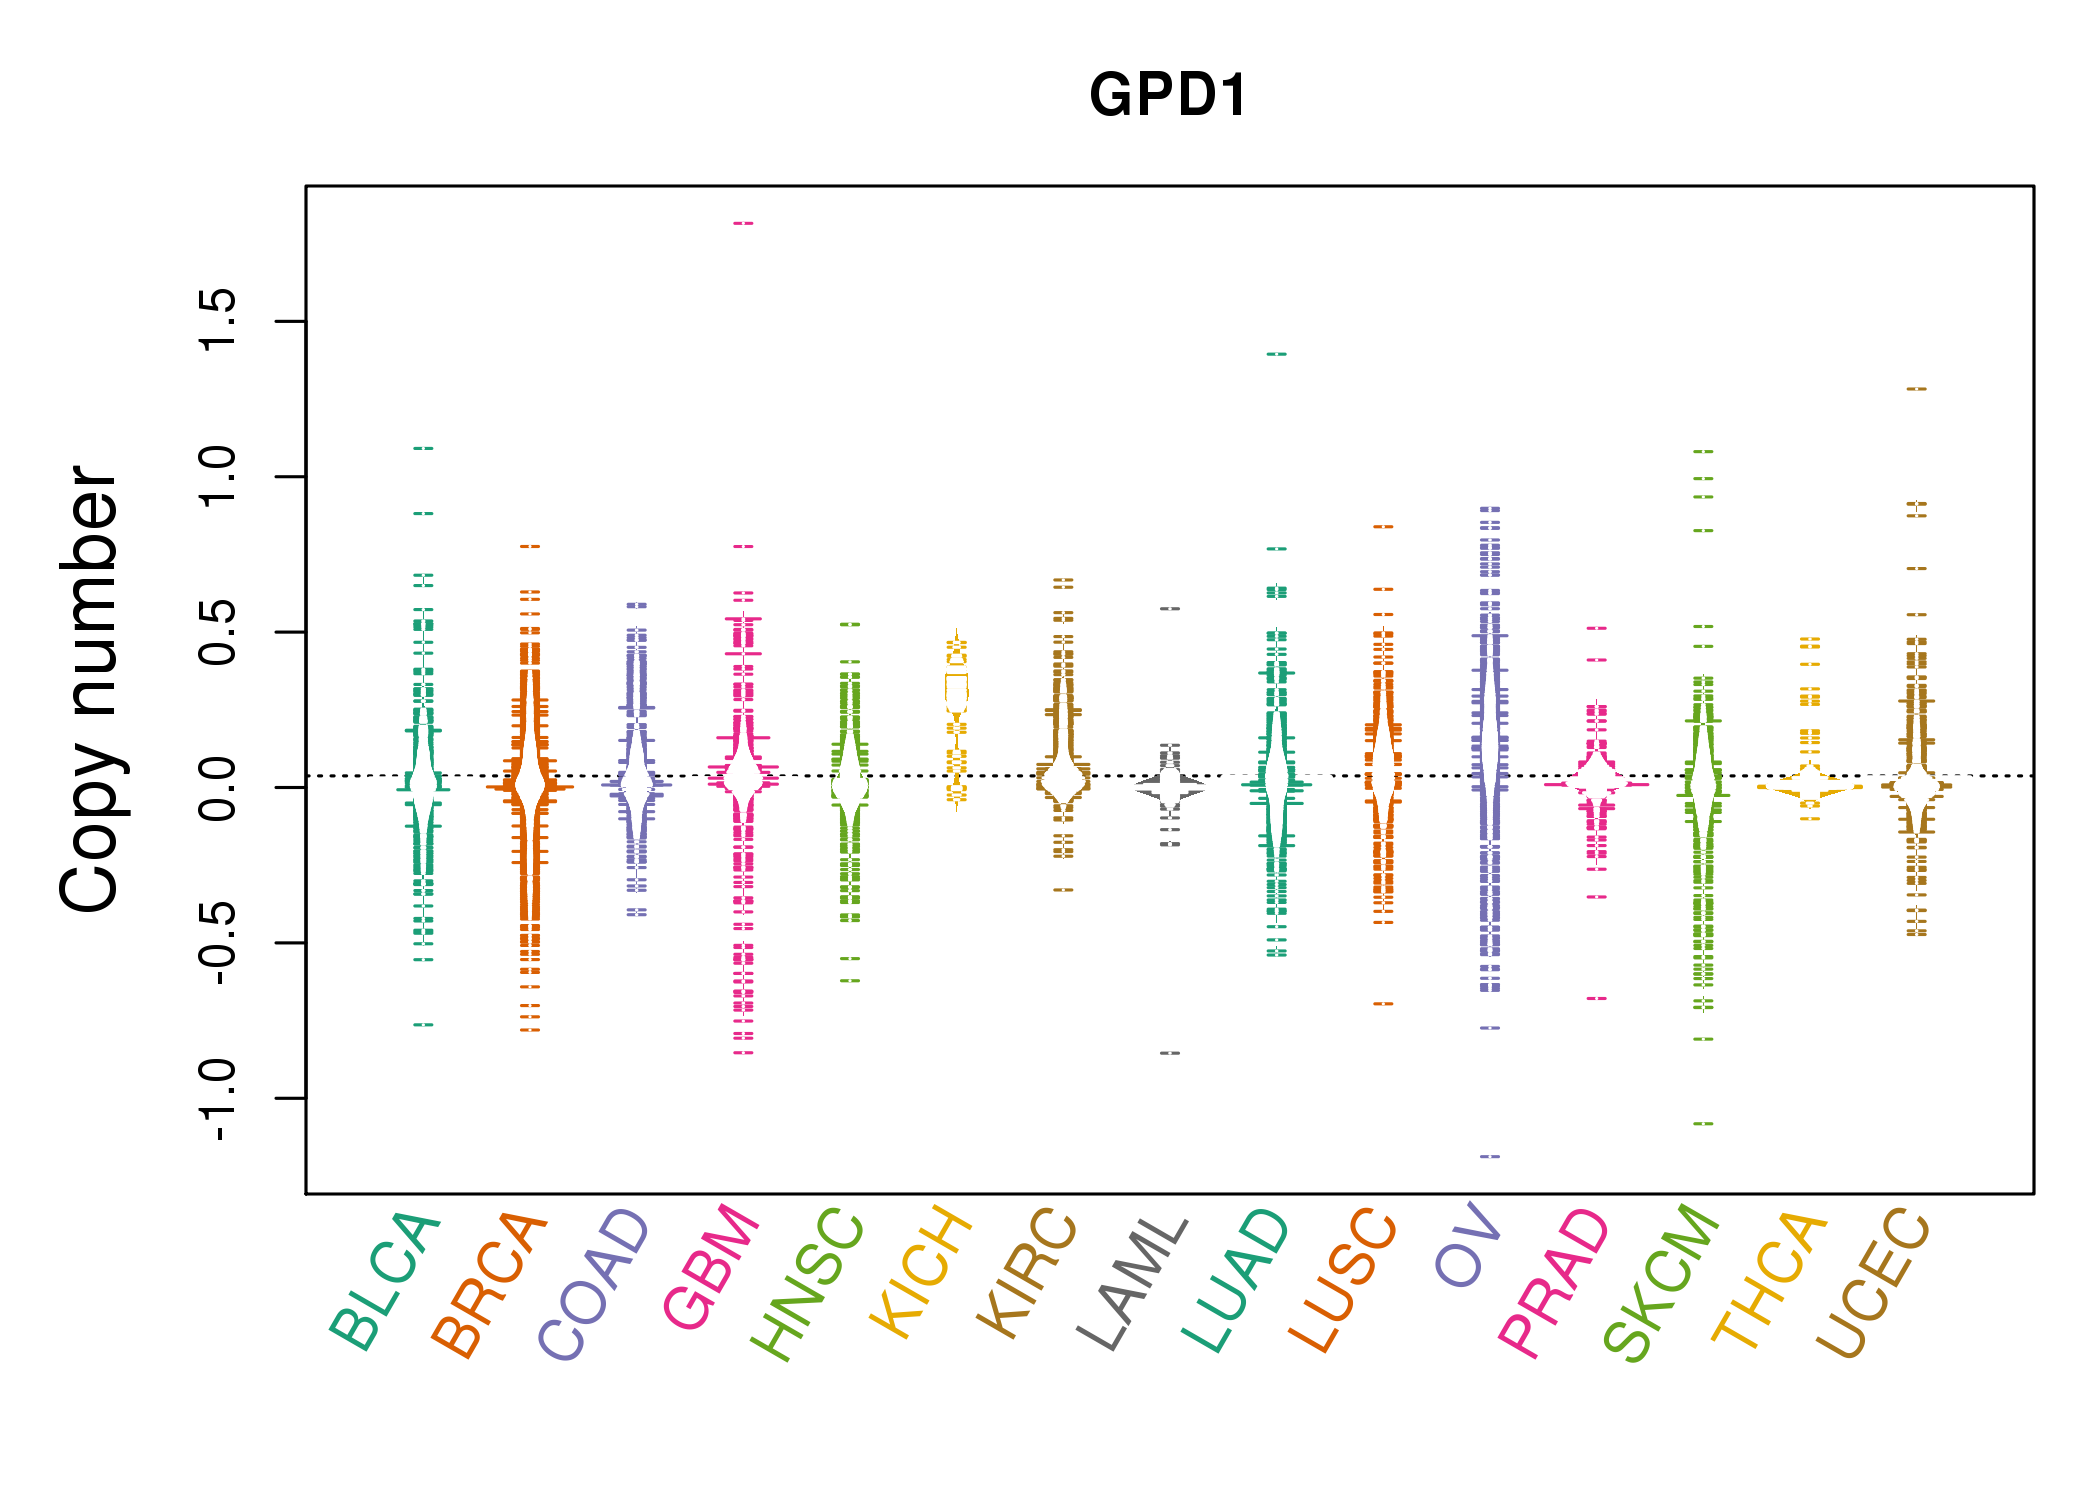 |
| cf) Tissue ID[Tissue type]: BLCA[Bladder Urothelial Carcinoma], BRCA[Breast invasive carcinoma], CESC[Cervical squamous cell carcinoma and endocervical adenocarcinoma], COAD[Colon adenocarcinoma], GBM[Glioblastoma multiforme], Glioma Low Grade, HNSC[Head and Neck squamous cell carcinoma], KICH[Kidney Chromophobe], KIRC[Kidney renal clear cell carcinoma], KIRP[Kidney renal papillary cell carcinoma], LAML[Acute Myeloid Leukemia], LUAD[Lung adenocarcinoma], LUSC[Lung squamous cell carcinoma], OV[Ovarian serous cystadenocarcinoma ], PAAD[Pancreatic adenocarcinoma], PRAD[Prostate adenocarcinoma], SKCM[Skin Cutaneous Melanoma], STAD[Stomach adenocarcinoma], THCA[Thyroid carcinoma], UCEC[Uterine Corpus Endometrial Carcinoma] |
| Top |
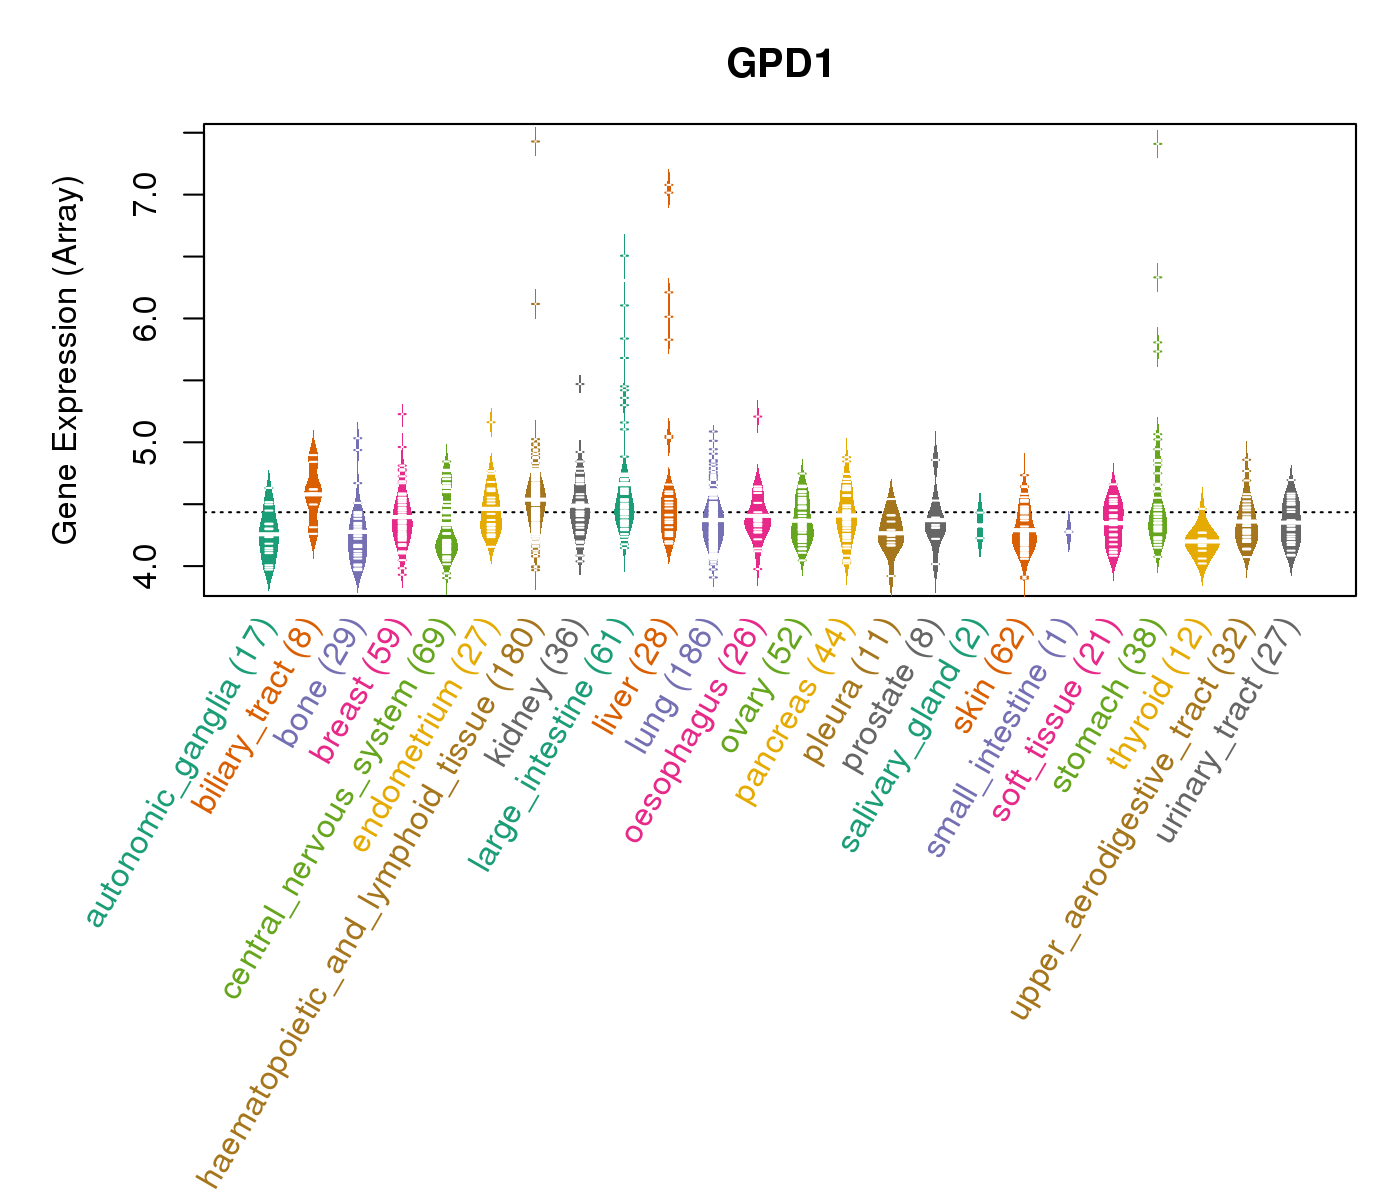
| Gene Expression for GPD1 |
| * CCLE gene expression data were extracted from CCLE_Expression_Entrez_2012-10-18.res: Gene-centric RMA-normalized mRNA expression data. |
 |
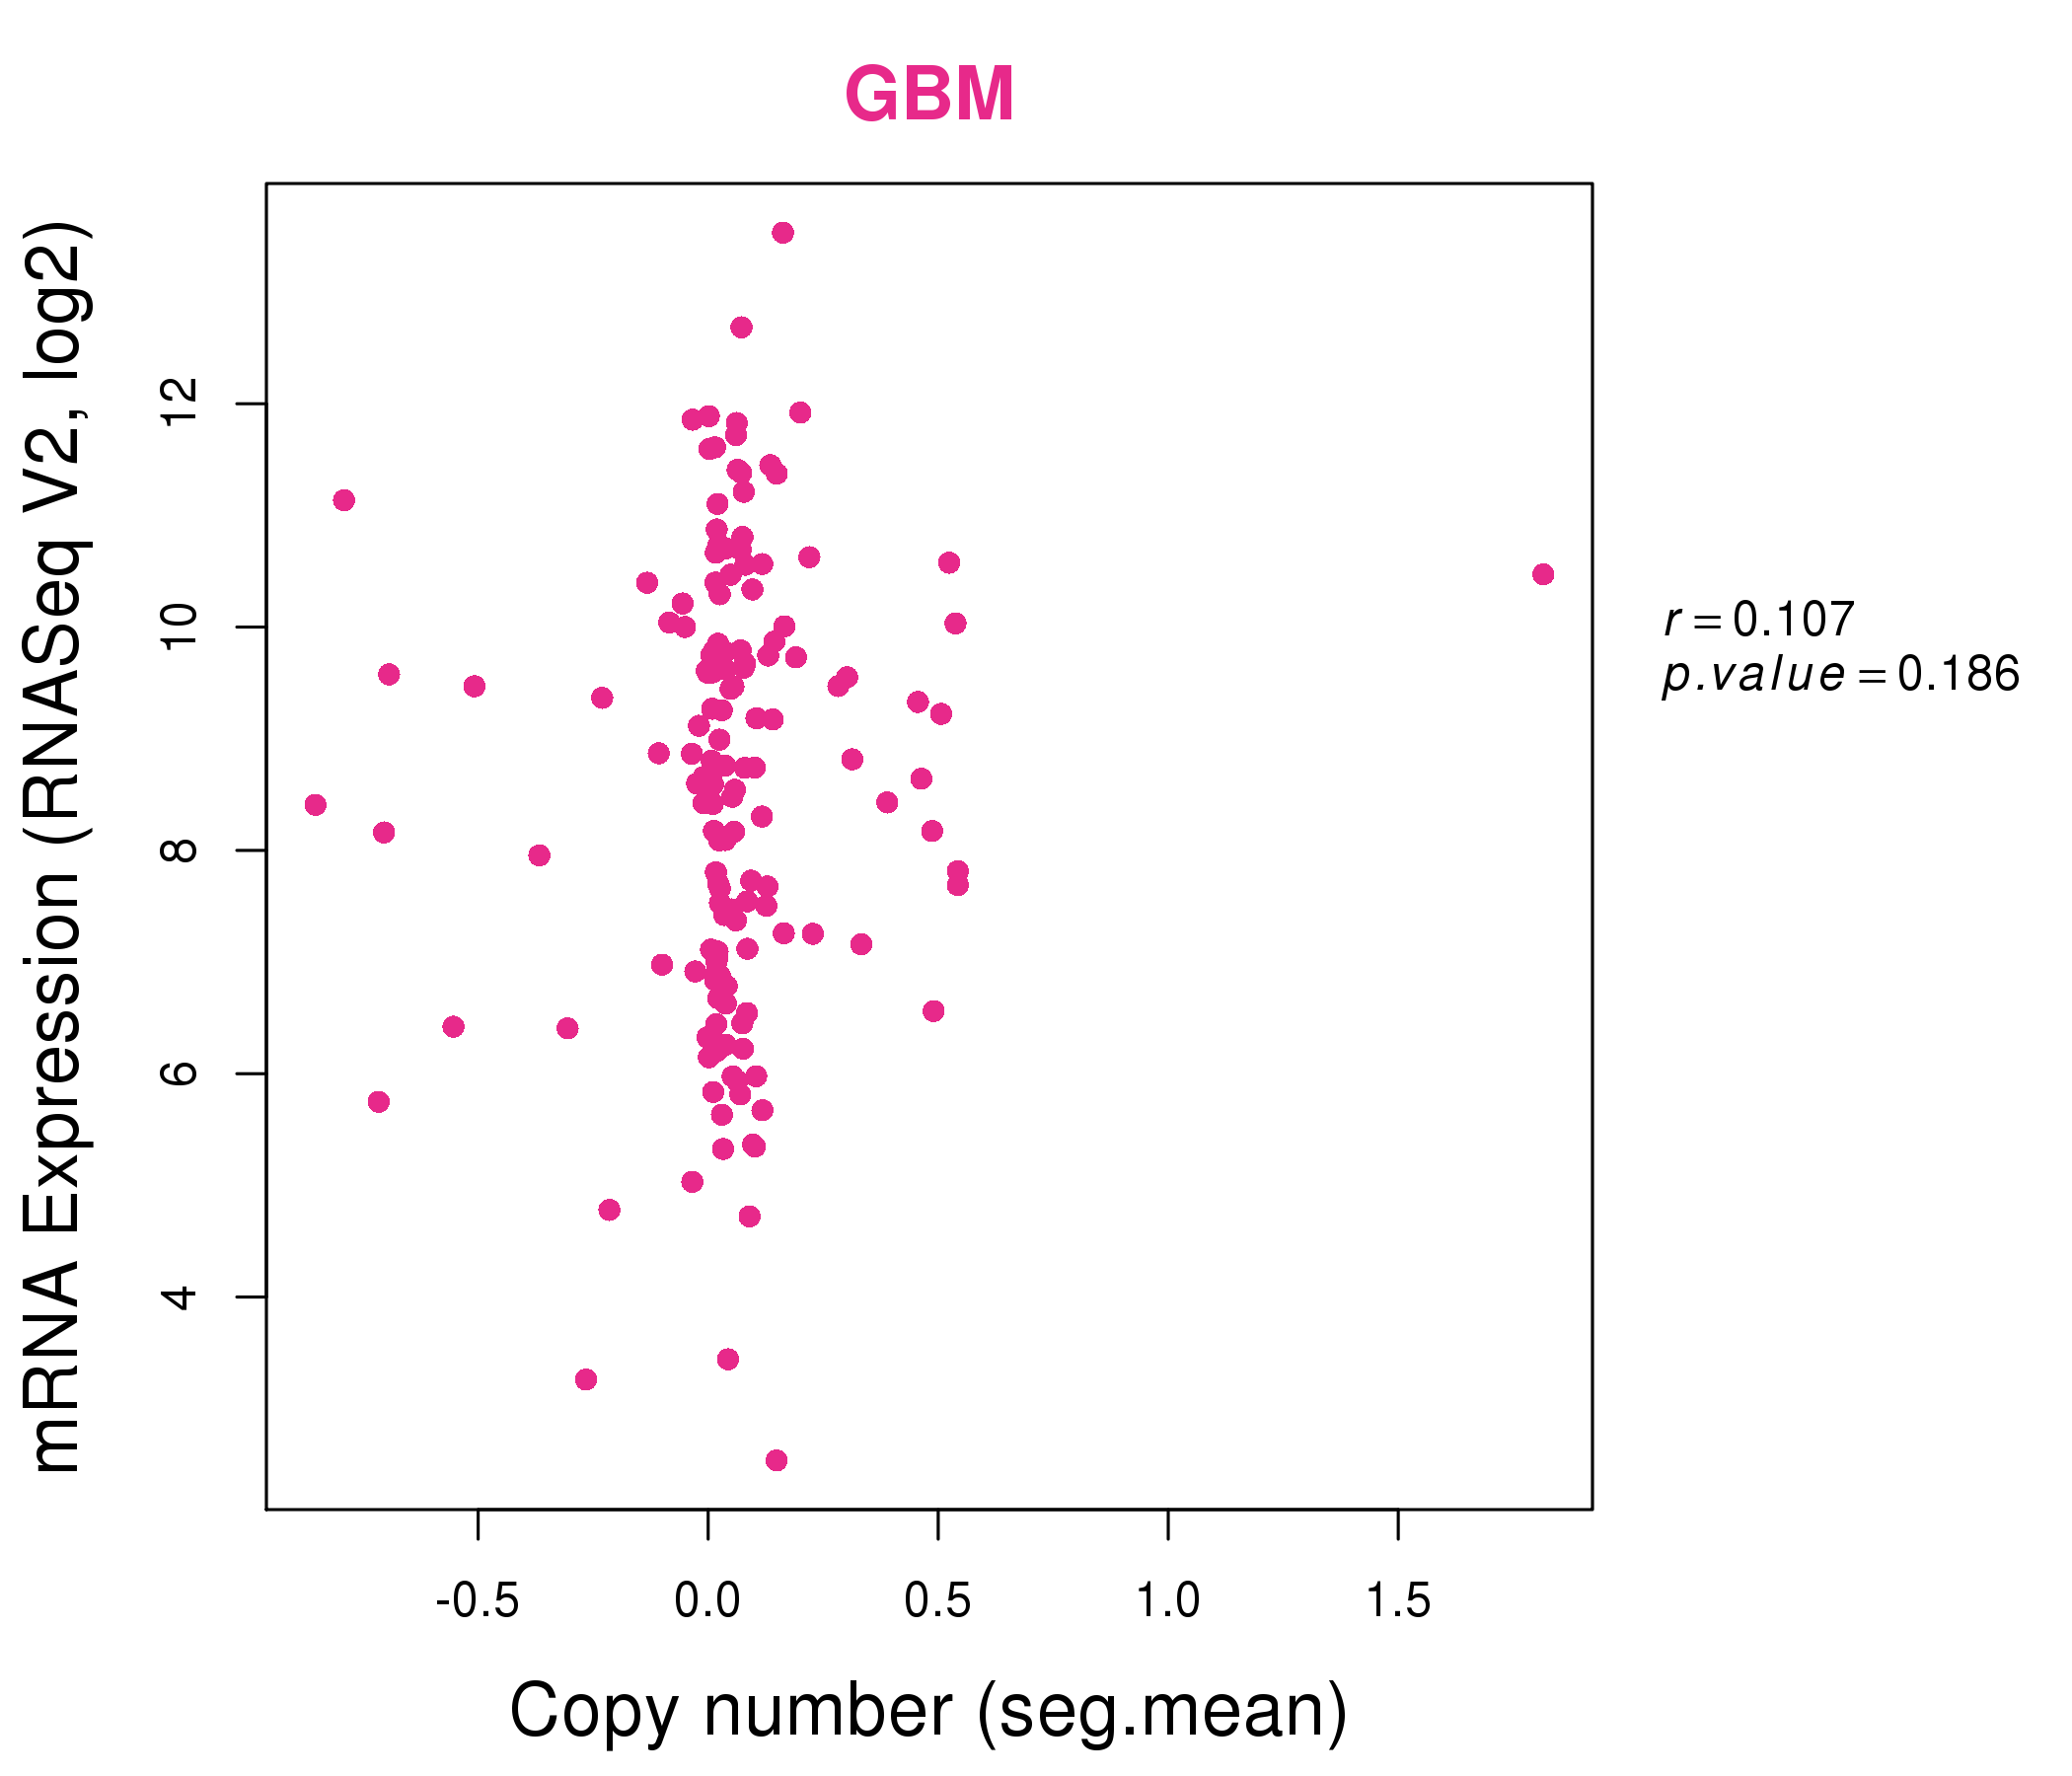
| * Normalized gene expression data of RNASeqV2 was extracted from TCGA using R package TCGA-Assembler. The URLs of all public data files on TCGA DCC data server were gathered at Jan-05-2015. Only eight cancer types have enough normal control samples for differential expression analysis. (t test, adjusted p<0.05 (using Benjamini-Hochberg FDR)) |
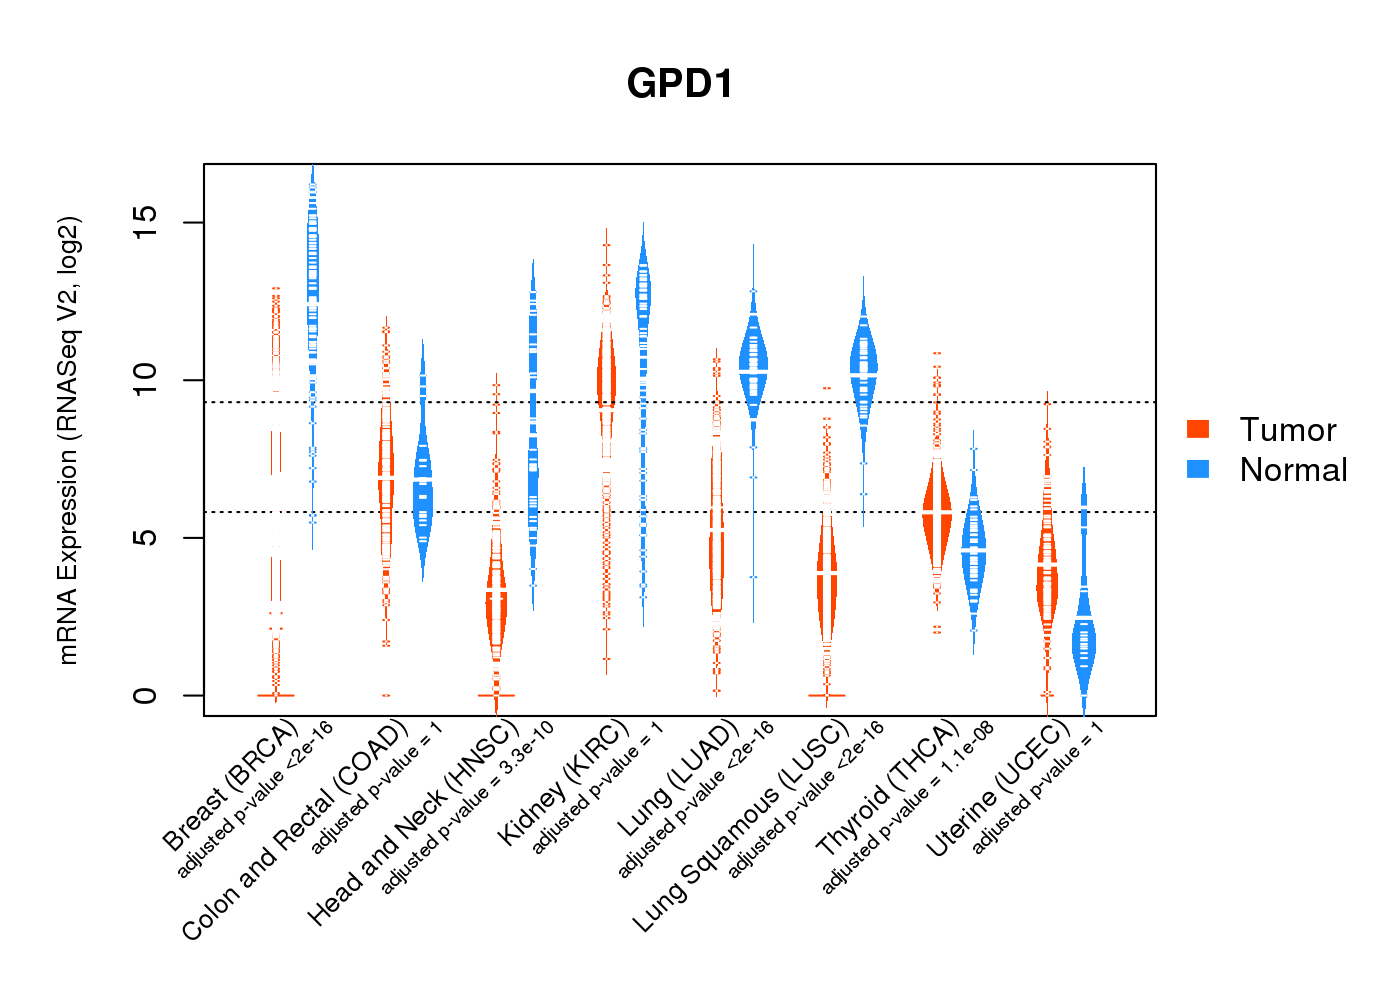 |
| Top |
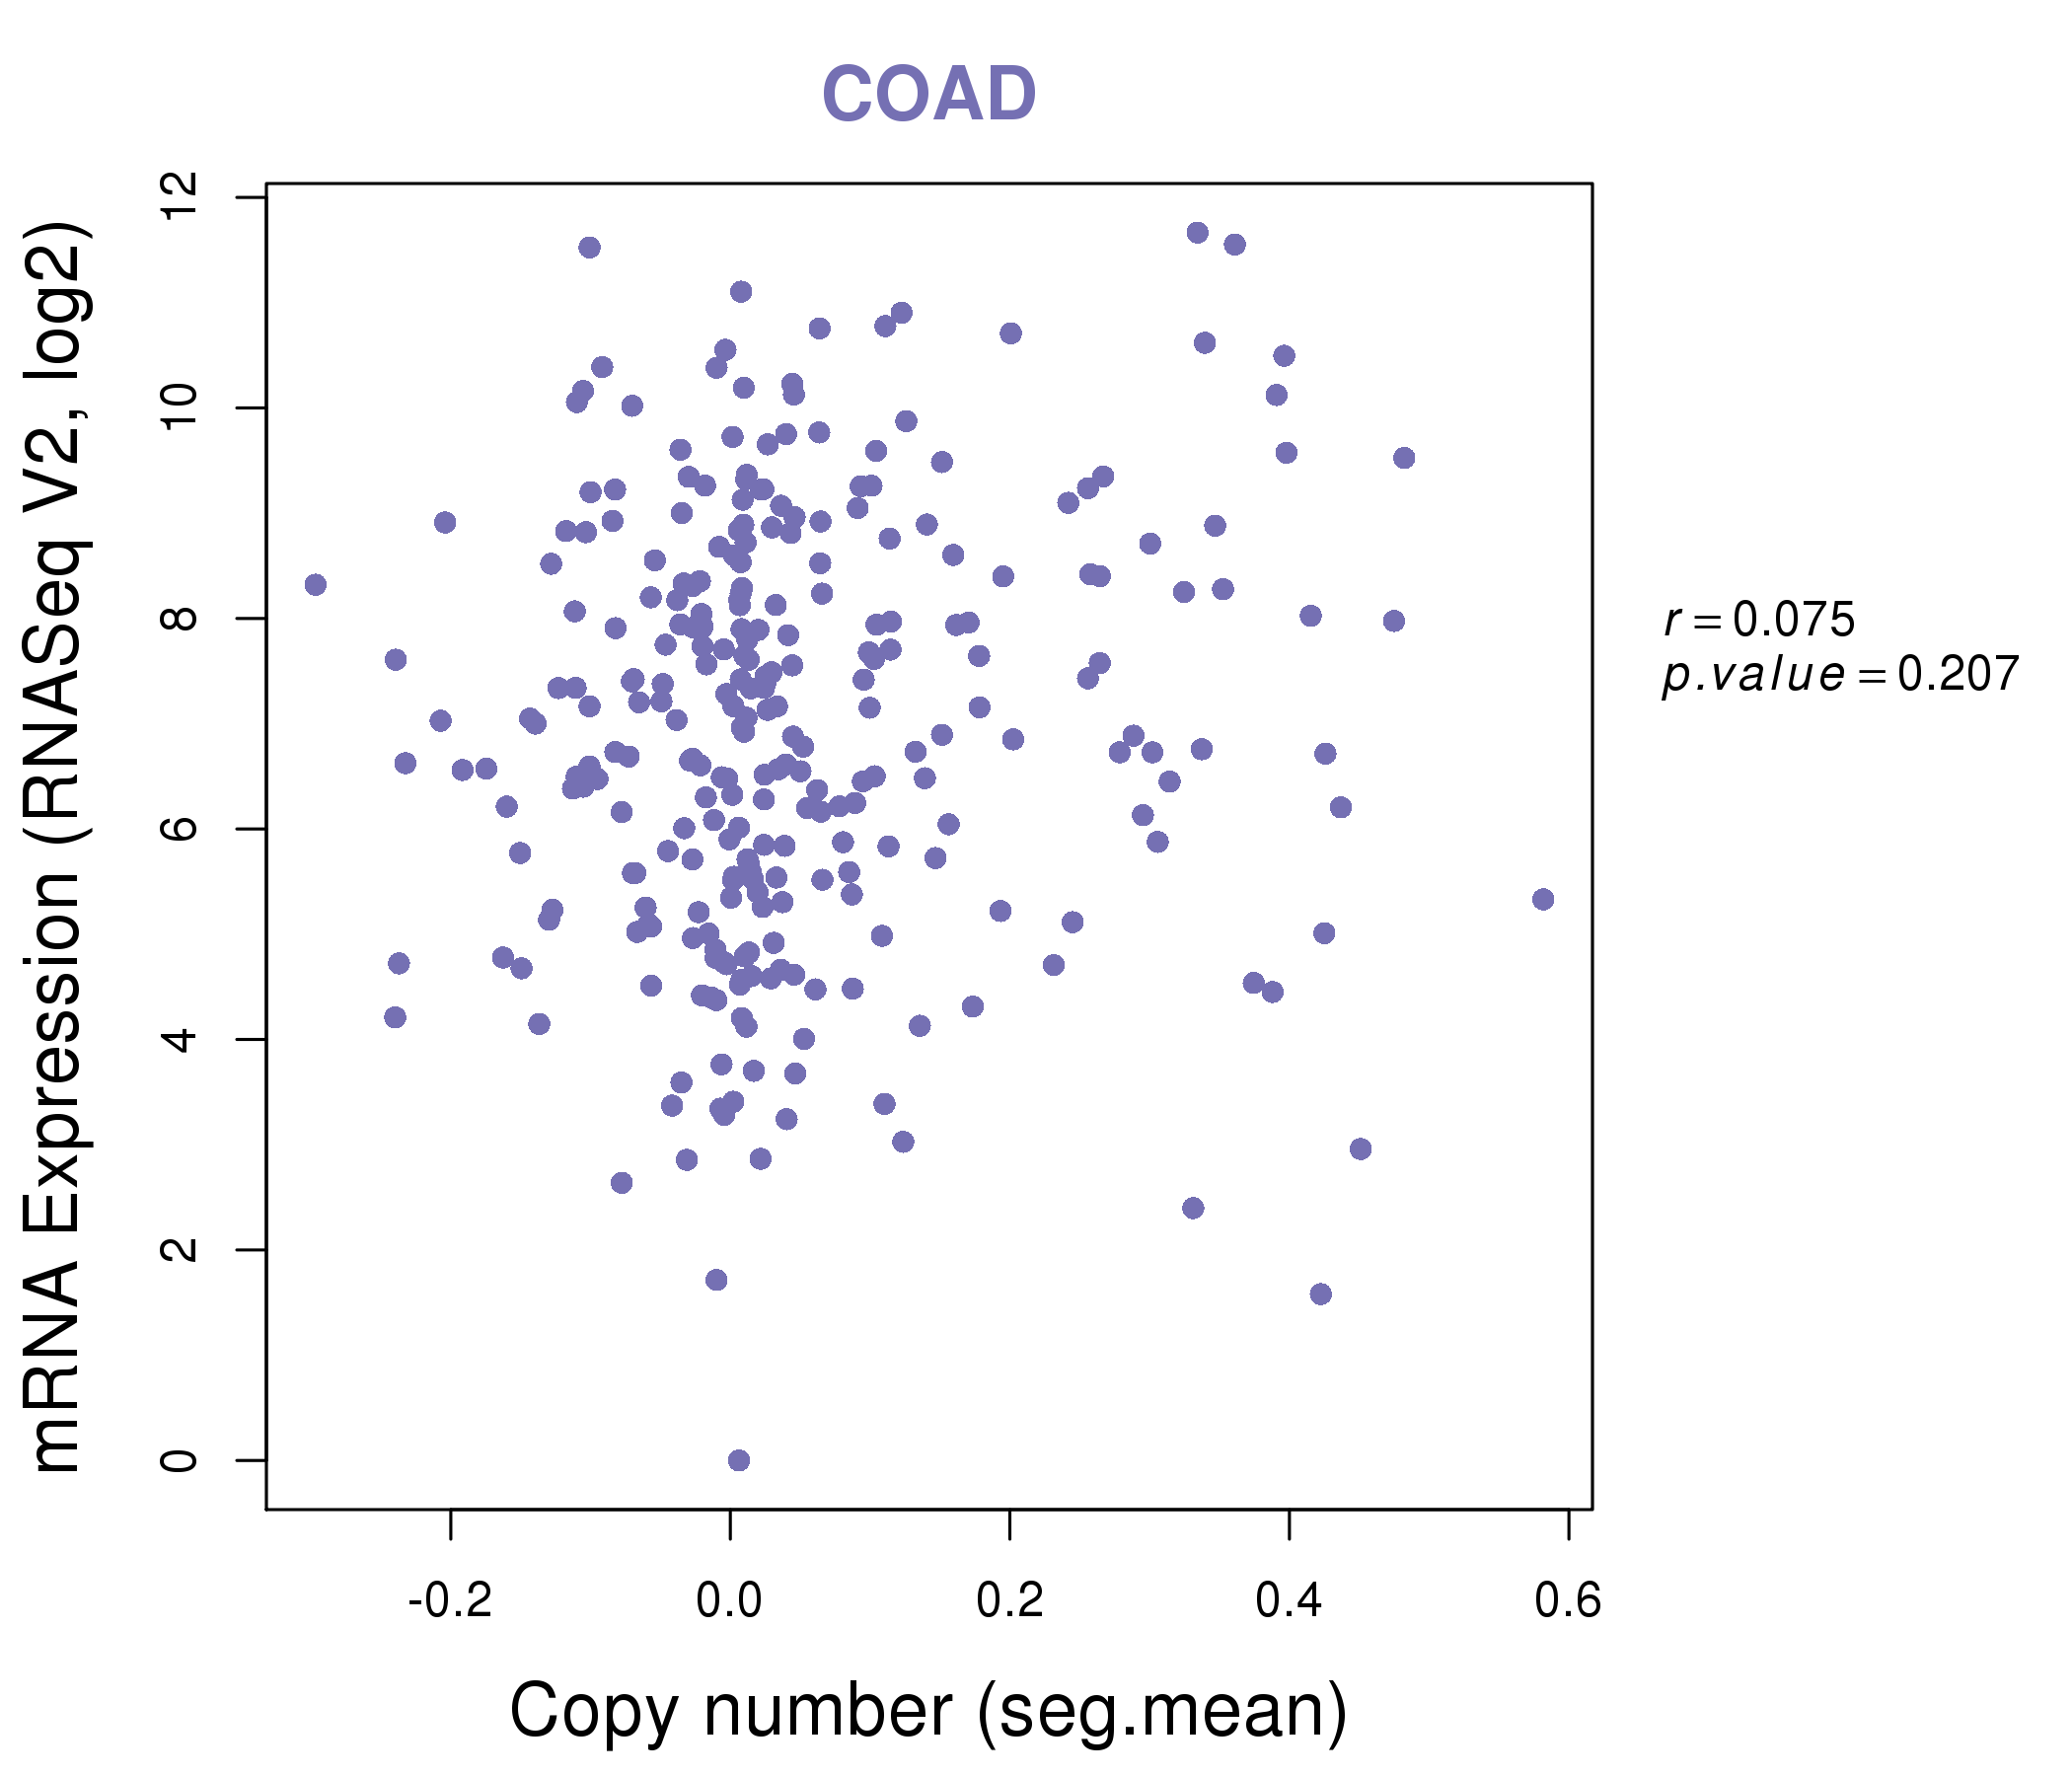
| * This plots show the correlation between CNV and gene expression. |
: Open all plots for all cancer types
 |
|
 |
|

| Top |
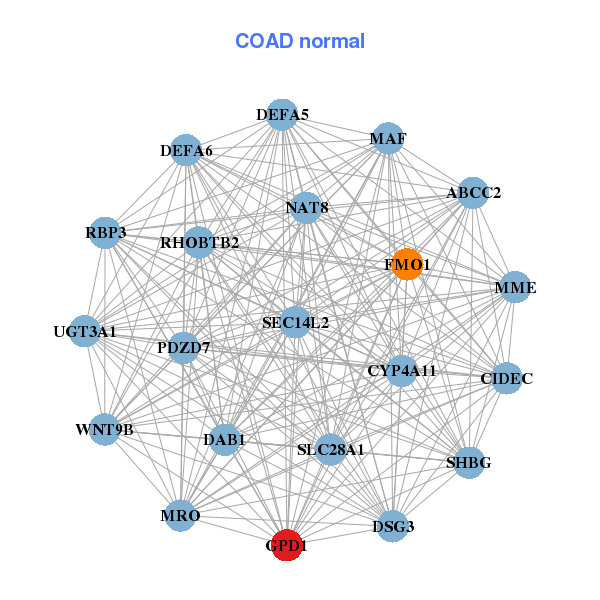
| Gene-Gene Network Information |
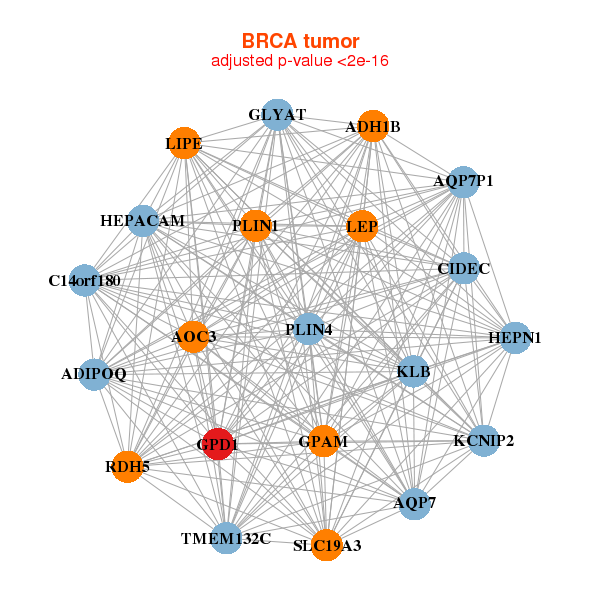
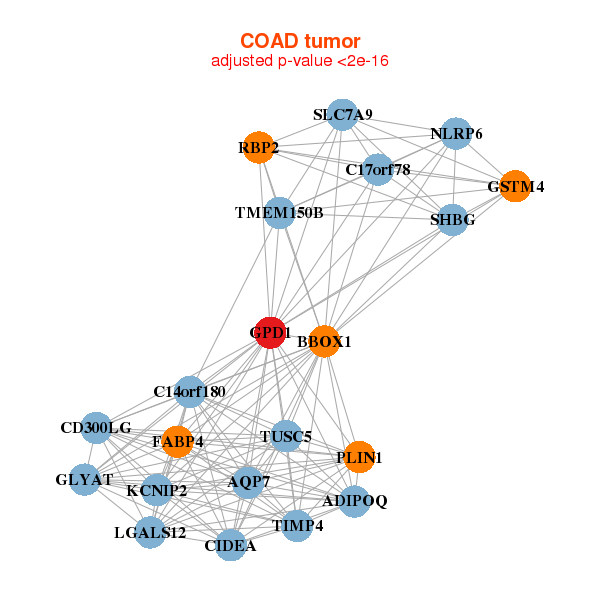
| * Co-Expression network figures were drawn using R package igraph. Only the top 20 genes with the highest correlations were shown. Red circle: input gene, orange circle: cell metabolism gene, sky circle: other gene |
: Open all plots for all cancer types
 |
| ||||
| C4orf32,SMIM14,CPEB3,DNAJC16,ELF1,FAM179B,FBXL5, FOXA1,FYCO1,GPD1L,NUDT12,PDCD6IP,PGGT1B,RALGPS2, RNF103,SPG11,STAM2,TMED7,TMEM87B,UEVLD,ZNF860 | ABCB7,ATP5S,ADCK3,CHCHD10,FAM134B,GKAP1,GPD1L, GPHN,L2HGDH,LRPPRC,MKNK2,OXA1L,PDHX,PDK2, PPARA,SLC2A4,SUCLG2,TARSL2,TMLHE,UQCRC2,VDAC2 | ||||
 |
| ||||
| ANKRD28,SOWAHB,ATP10B,C10orf99,DLD,ENTPD5,EPB41L4B, GPD1L,HOOK1,LARS2,LRRC31,MFN1,NGLY1,OXNAD1, PDCD6IP,SATB2,SGK2,SLC16A9,SLC9A2,SNX4,SUCLG2 | ACSS2,ATP6V1A,CAPN5,MCU,CDH17,RHOV___CHP1,CORO2A, ABHD17C,GLTP,GPD1L,IQGAP2,LNX2,MARVELD2,NIPA2, PAPSS2,PIP5K1B,PPP6C,PRR5L,RBM47,STYK1,TPRN |
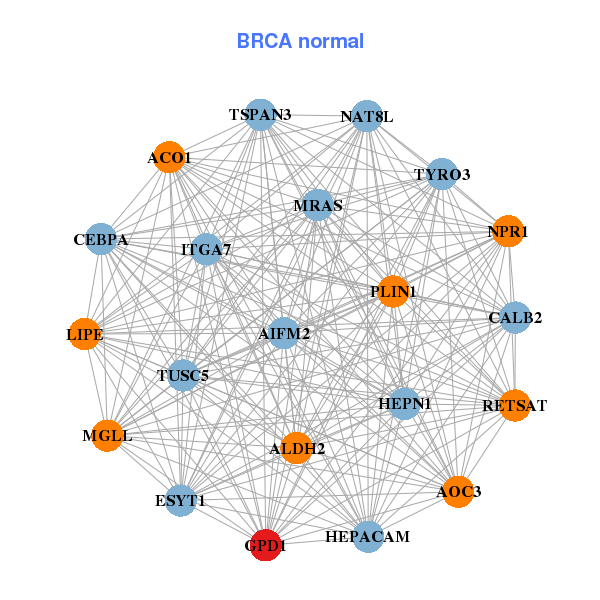
| * Co-Expression network figures were drawn using R package igraph. Only the top 20 genes with the highest correlations were shown. Red circle: input gene, orange circle: cell metabolism gene, sky circle: other gene |
: Open all plots for all cancer types
| Top |
: Open all interacting genes' information including KEGG pathway for all interacting genes from DAVID
| Top |
| Pharmacological Information for GPD1 |
| DB Category | DB Name | DB's ID and Url link |
| * Gene Centered Interaction Network. |
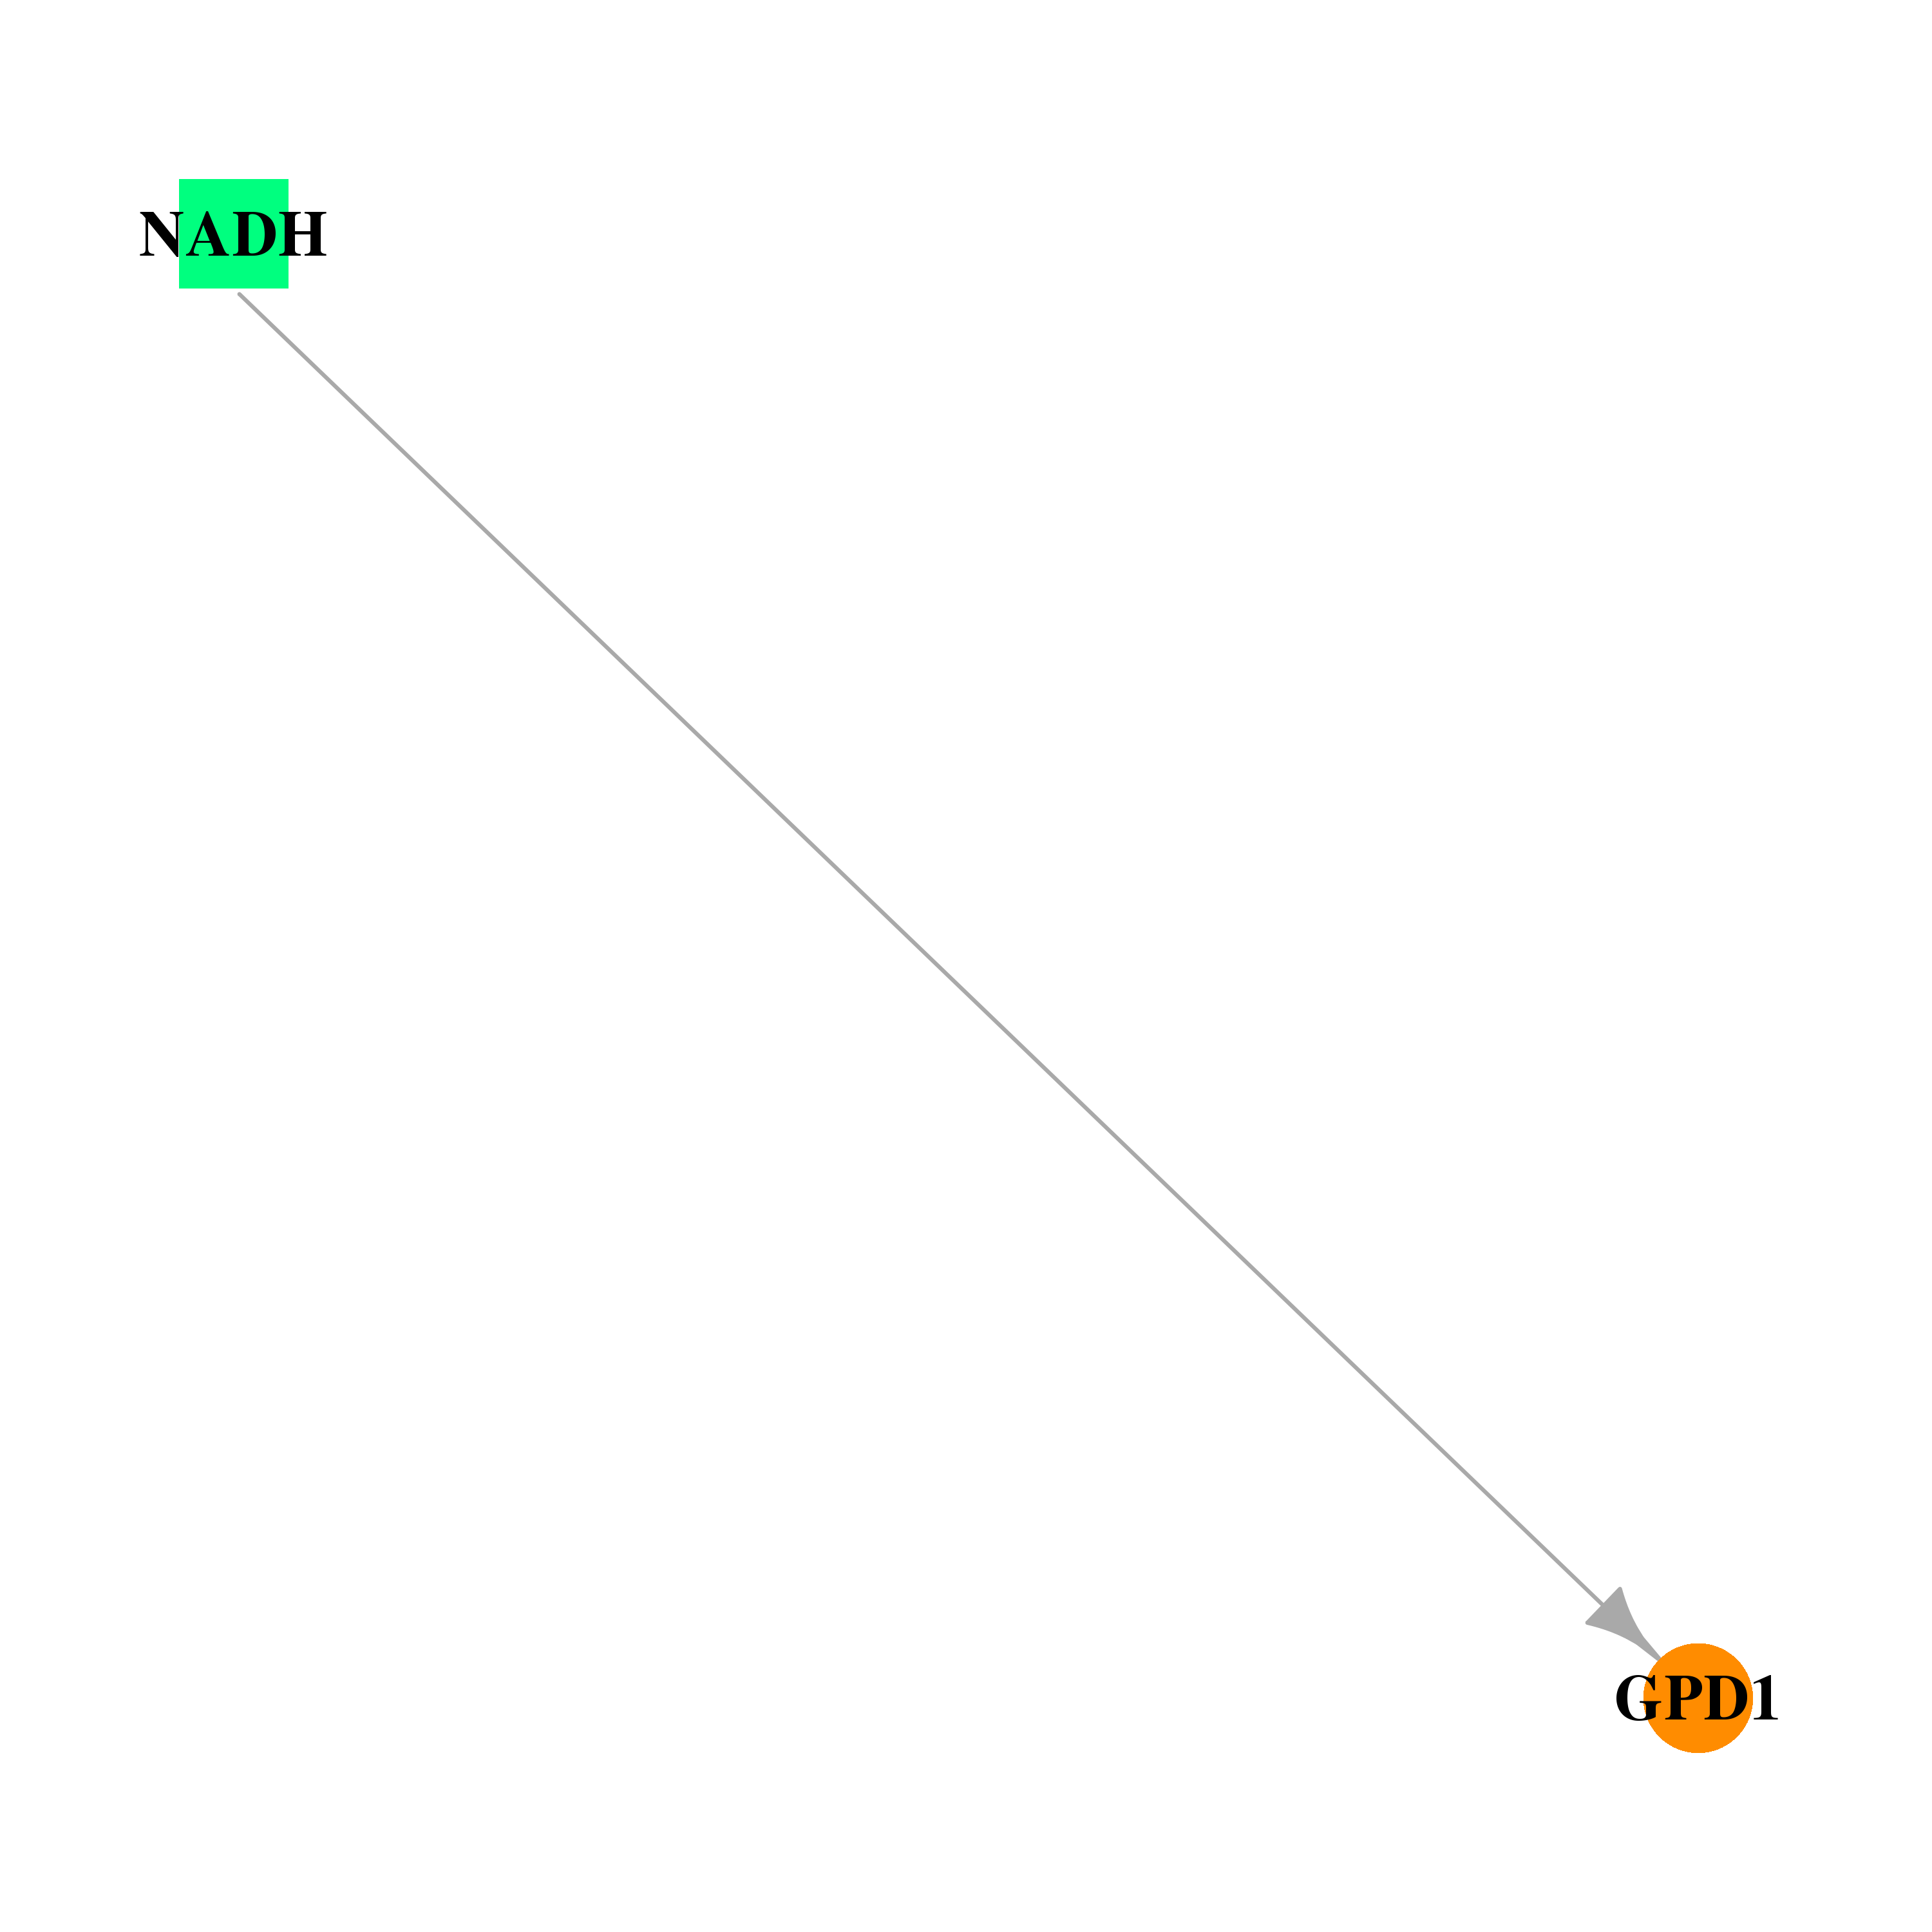 |
| * Drug Centered Interaction Network. |
| DrugBank ID | Target Name | Drug Groups | Generic Name | Drug Centered Network | Drug Structure |
| DB00157 | glycerol-3-phosphate dehydrogenase 1 (soluble) | approved; nutraceutical | NADH |  |  |
| Top |
| Cross referenced IDs for GPD1 |
| * We obtained these cross-references from Uniprot database. It covers 150 different DBs, 18 categories. http://www.uniprot.org/help/cross_references_section |
: Open all cross reference information
|
Copyright © 2016-Present - The Univsersity of Texas Health Science Center at Houston @ |