|
||||||||||||||||||||||||||||||||||||||||||||||||||||||||||||||||||||||||||||||||||||||||||||||||||||||||||||||||||||||||||||||||||||||||||||||||||||||||||||||||||||||||||||||||||||||||||||||||||||||||||||||||||||||||||||||||||||||||||||||||||||||||||||||||||||||||||||||||||||||||||||||||||||||||||||||||||||||||||
| |
| Phenotypic Information (metabolism pathway, cancer, disease, phenome) |
| |
| |
| Gene-Gene Network Information: Co-Expression Network, Interacting Genes & KEGG |
| |
|


| Gene Summary for P4HA3 |
| Basic gene info. | Gene symbol | P4HA3 |
| Gene name | prolyl 4-hydroxylase, alpha polypeptide III | |
| Synonyms | - | |
| Cytomap | UCSC genome browser: 11q13.4 | |
| Genomic location | chr11 :73977701-74022699 | |
| Type of gene | protein-coding | |
| RefGenes | NM_001288748.1, NM_182904.4,NR_110031.1, | |
| Ensembl id | ENSG00000149380 | |
| Description | 4-PH alpha-3C-P4H alpha IIIcollagen prolyl 4-hydroxylase alpha(III)procollagen-proline, 2-oxoglutarate 4-dioxygenase (proline 4-hydroxylase), alpha polypeptide IIIprolyl 4-hydroxylase subunit alpha-3 | |
| Modification date | 20141207 | |
| dbXrefs | MIM : 608987 | |
| HGNC : HGNC | ||
| Ensembl : ENSG00000149380 | ||
| HPRD : 16413 | ||
| Vega : OTTHUMG00000165254 | ||
| Protein | UniProt: go to UniProt's Cross Reference DB Table | |
| Expression | CleanEX: HS_P4HA3 | |
| BioGPS: 283208 | ||
| Gene Expression Atlas: ENSG00000149380 | ||
| The Human Protein Atlas: ENSG00000149380 | ||
| Pathway | NCI Pathway Interaction Database: P4HA3 | |
| KEGG: P4HA3 | ||
| REACTOME: P4HA3 | ||
| ConsensusPathDB | ||
| Pathway Commons: P4HA3 | ||
| Metabolism | MetaCyc: P4HA3 | |
| HUMANCyc: P4HA3 | ||
| Regulation | Ensembl's Regulation: ENSG00000149380 | |
| miRBase: chr11 :73,977,701-74,022,699 | ||
| TargetScan: NM_001288748 | ||
| cisRED: ENSG00000149380 | ||
| Context | iHOP: P4HA3 | |
| cancer metabolism search in PubMed: P4HA3 | ||
| UCL Cancer Institute: P4HA3 | ||
| Assigned class in ccmGDB | C | |
| Top |
| Phenotypic Information for P4HA3(metabolism pathway, cancer, disease, phenome) |
| Cancer | CGAP: P4HA3 |
| Familial Cancer Database: P4HA3 | |
| * This gene is included in those cancer gene databases. |
|
|
|
|
|
|
| ||||||||||||||||||||||||||||||||||||||||||||||||||||||||||||||||||||||||||||||||||||||||||||||||||||||||||||||||||||||||||||||||||||||||||||||||||||||||||||||||||||||||||||||||||||||||||||||||||||||||||||||||||||||||||||||||||||||||||||||||||||||||||||||||||||||||||||||||||||||||||||||||||||||||||||||||||||
Oncogene 1 | Significant driver gene in | |||||||||||||||||||||||||||||||||||||||||||||||||||||||||||||||||||||||||||||||||||||||||||||||||||||||||||||||||||||||||||||||||||||||||||||||||||||||||||||||||||||||||||||||||||||||||||||||||||||||||||||||||||||||||||||||||||||||||||||||||||||||||||||||||||||||||||||||||||||||||||||||||||||||||||||||||||||||||
| cf) number; DB name 1 Oncogene; http://nar.oxfordjournals.org/content/35/suppl_1/D721.long, 2 Tumor Suppressor gene; https://bioinfo.uth.edu/TSGene/, 3 Cancer Gene Census; http://www.nature.com/nrc/journal/v4/n3/abs/nrc1299.html, 4 CancerGenes; http://nar.oxfordjournals.org/content/35/suppl_1/D721.long, 5 Network of Cancer Gene; http://ncg.kcl.ac.uk/index.php, 1Therapeutic Vulnerabilities in Cancer; http://cbio.mskcc.org/cancergenomics/statius/ |
| KEGG_ARGININE_AND_PROLINE_METABOLISM | |
| OMIM | |
| Orphanet | |
| Disease | KEGG Disease: P4HA3 |
| MedGen: P4HA3 (Human Medical Genetics with Condition) | |
| ClinVar: P4HA3 | |
| Phenotype | MGI: P4HA3 (International Mouse Phenotyping Consortium) |
| PhenomicDB: P4HA3 | |
| Mutations for P4HA3 |
| * Under tables are showing count per each tissue to give us broad intuition about tissue specific mutation patterns.You can go to the detailed page for each mutation database's web site. |
| There's no structural variation information in COSMIC data for this gene. |
| * From mRNA Sanger sequences, Chitars2.0 arranged chimeric transcripts. This table shows P4HA3 related fusion information. |
| ID | Head Gene | Tail Gene | Accession | Gene_a | qStart_a | qEnd_a | Chromosome_a | tStart_a | tEnd_a | Gene_a | qStart_a | qEnd_a | Chromosome_a | tStart_a | tEnd_a |
| BE702520 | ASAP1 | 41 | 111 | 8 | 131164982 | 131165052 | P4HA3 | 104 | 231 | 11 | 73998187 | 73998315 | |
| Top |
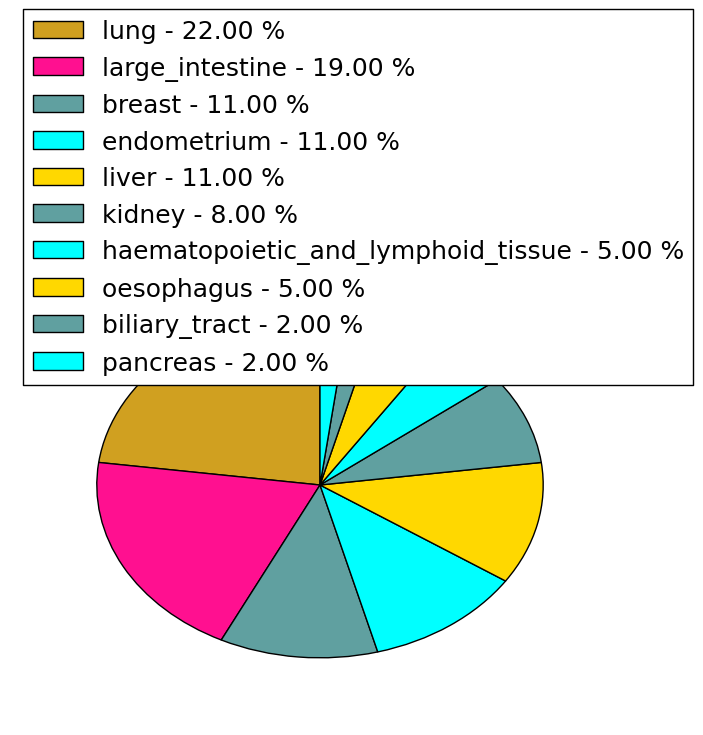
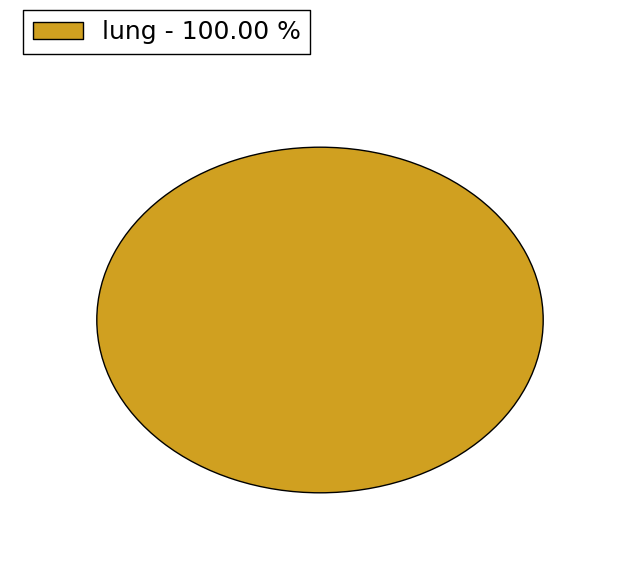
| Mutation type/ Tissue ID | brca | cns | cerv | endome | haematopo | kidn | Lintest | liver | lung | ns | ovary | pancre | prost | skin | stoma | thyro | urina | |||
| Total # sample | 3 | 2 | 4 | 1 | 1 | |||||||||||||||
| GAIN (# sample) | 3 | 1 | 1 | 1 | 1 | |||||||||||||||
| LOSS (# sample) | 1 | 3 |
| cf) Tissue ID; Tissue type (1; Breast, 2; Central_nervous_system, 3; Cervix, 4; Endometrium, 5; Haematopoietic_and_lymphoid_tissue, 6; Kidney, 7; Large_intestine, 8; Liver, 9; Lung, 10; NS, 11; Ovary, 12; Pancreas, 13; Prostate, 14; Skin, 15; Stomach, 16; Thyroid, 17; Urinary_tract) |
| Top |
|
 |
| Top |
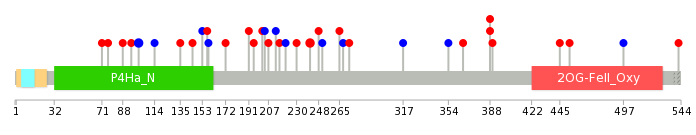
| Stat. for Non-Synonymous SNVs (# total SNVs=36) | (# total SNVs=10) |
 |  |
(# total SNVs=1) | (# total SNVs=0) |
 |
| Top |
| * When you move the cursor on each content, you can see more deailed mutation information on the Tooltip. Those are primary_site,primary_histology,mutation(aa),pubmedID. |
| GRCh37 position | Mutation(aa) | Unique sampleID count |
| chr11:74000171-74000171 | p.G241E | 3 |
| chr11:73996902-73996902 | p.F354F | 2 |
| chr11:73996950-73996950 | p.R338R | 2 |
| chr11:73980719-73980719 | p.N482S | 2 |
| chr11:73988187-73988187 | p.A393D | 2 |
| chr11:74015355-74015355 | p.R101R | 2 |
| chr11:73988031-73988031 | p.T445M | 2 |
| chr11:73978334-73978334 | p.Q532K | 2 |
| chr11:73979244-73979244 | p.G504R | 1 |
| chr11:73997311-73997311 | p.D299N | 1 |
| Top |
|
 |
| Point Mutation/ Tissue ID | 1 | 2 | 3 | 4 | 5 | 6 | 7 | 8 | 9 | 10 | 11 | 12 | 13 | 14 | 15 | 16 | 17 | 18 | 19 | 20 |
| # sample | 2 | 3 | 1 | 1 | 2 | 3 | 1 | 1 | 13 | 5 | 5 | |||||||||
| # mutation | 2 | 3 | 1 | 1 | 3 | 3 | 1 | 1 | 14 | 5 | 5 | |||||||||
| nonsynonymous SNV | 2 | 2 | 1 | 1 | 2 | 2 | 1 | 8 | 5 | 3 | ||||||||||
| synonymous SNV | 1 | 1 | 1 | 1 | 6 | 2 |
| cf) Tissue ID; Tissue type (1; BLCA[Bladder Urothelial Carcinoma], 2; BRCA[Breast invasive carcinoma], 3; CESC[Cervical squamous cell carcinoma and endocervical adenocarcinoma], 4; COAD[Colon adenocarcinoma], 5; GBM[Glioblastoma multiforme], 6; Glioma Low Grade, 7; HNSC[Head and Neck squamous cell carcinoma], 8; KICH[Kidney Chromophobe], 9; KIRC[Kidney renal clear cell carcinoma], 10; KIRP[Kidney renal papillary cell carcinoma], 11; LAML[Acute Myeloid Leukemia], 12; LUAD[Lung adenocarcinoma], 13; LUSC[Lung squamous cell carcinoma], 14; OV[Ovarian serous cystadenocarcinoma ], 15; PAAD[Pancreatic adenocarcinoma], 16; PRAD[Prostate adenocarcinoma], 17; SKCM[Skin Cutaneous Melanoma], 18:STAD[Stomach adenocarcinoma], 19:THCA[Thyroid carcinoma], 20:UCEC[Uterine Corpus Endometrial Carcinoma]) |
| Top |
| * We represented just top 10 SNVs. When you move the cursor on each content, you can see more deailed mutation information on the Tooltip. Those are primary_site, primary_histology, mutation(aa), pubmedID. |
| Genomic Position | Mutation(aa) | Unique sampleID count |
| chr11:74000171 | p.G241E,P4HA3 | 2 |
| chr11:74015355 | p.R101R,P4HA3 | 2 |
| chr11:73988031 | p.R388H,P4HA3 | 1 |
| chr11:74015430 | p.L204L,P4HA3 | 1 |
| chr11:74000151 | p.R388S,P4HA3 | 1 |
| chr11:74013466 | p.P202A,P4HA3 | 1 |
| chr11:73990439 | p.L366R,P4HA3 | 1 |
| chr11:74015447 | p.G195V,P4HA3 | 1 |
| chr11:74013507 | p.F354F,P4HA3 | 1 |
| chr11:73990445 | p.A191T,P4HA3 | 1 |
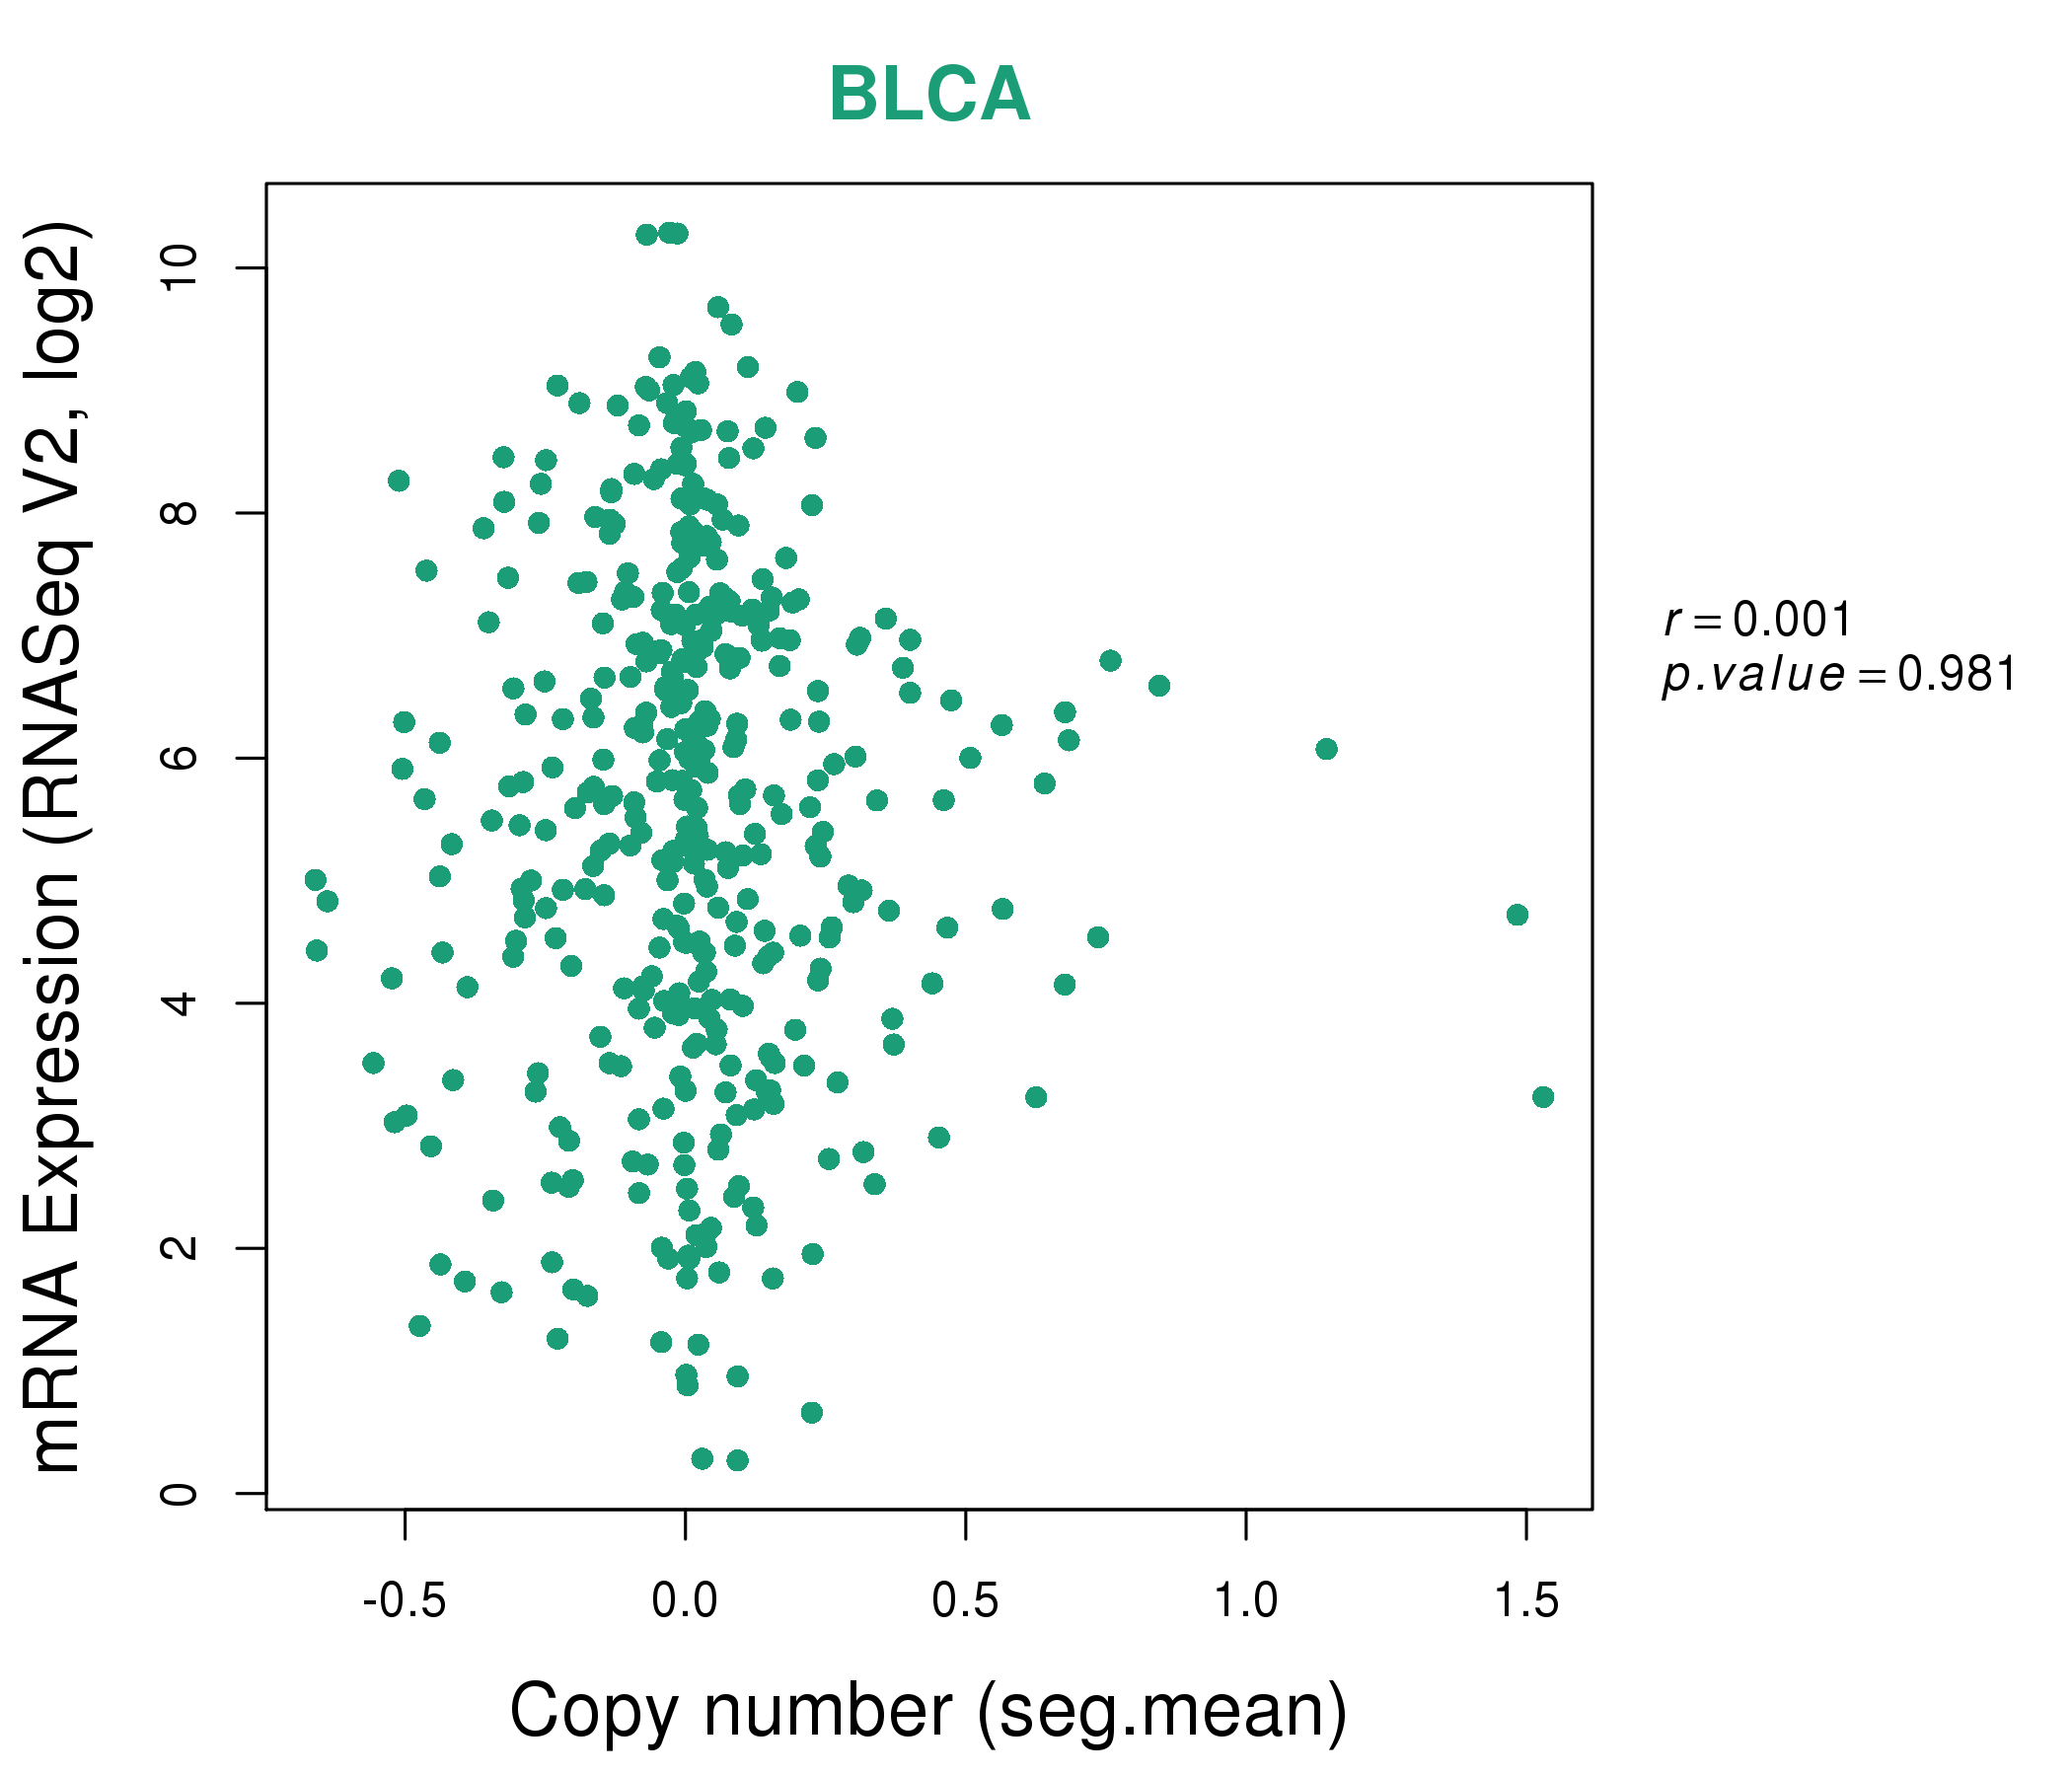
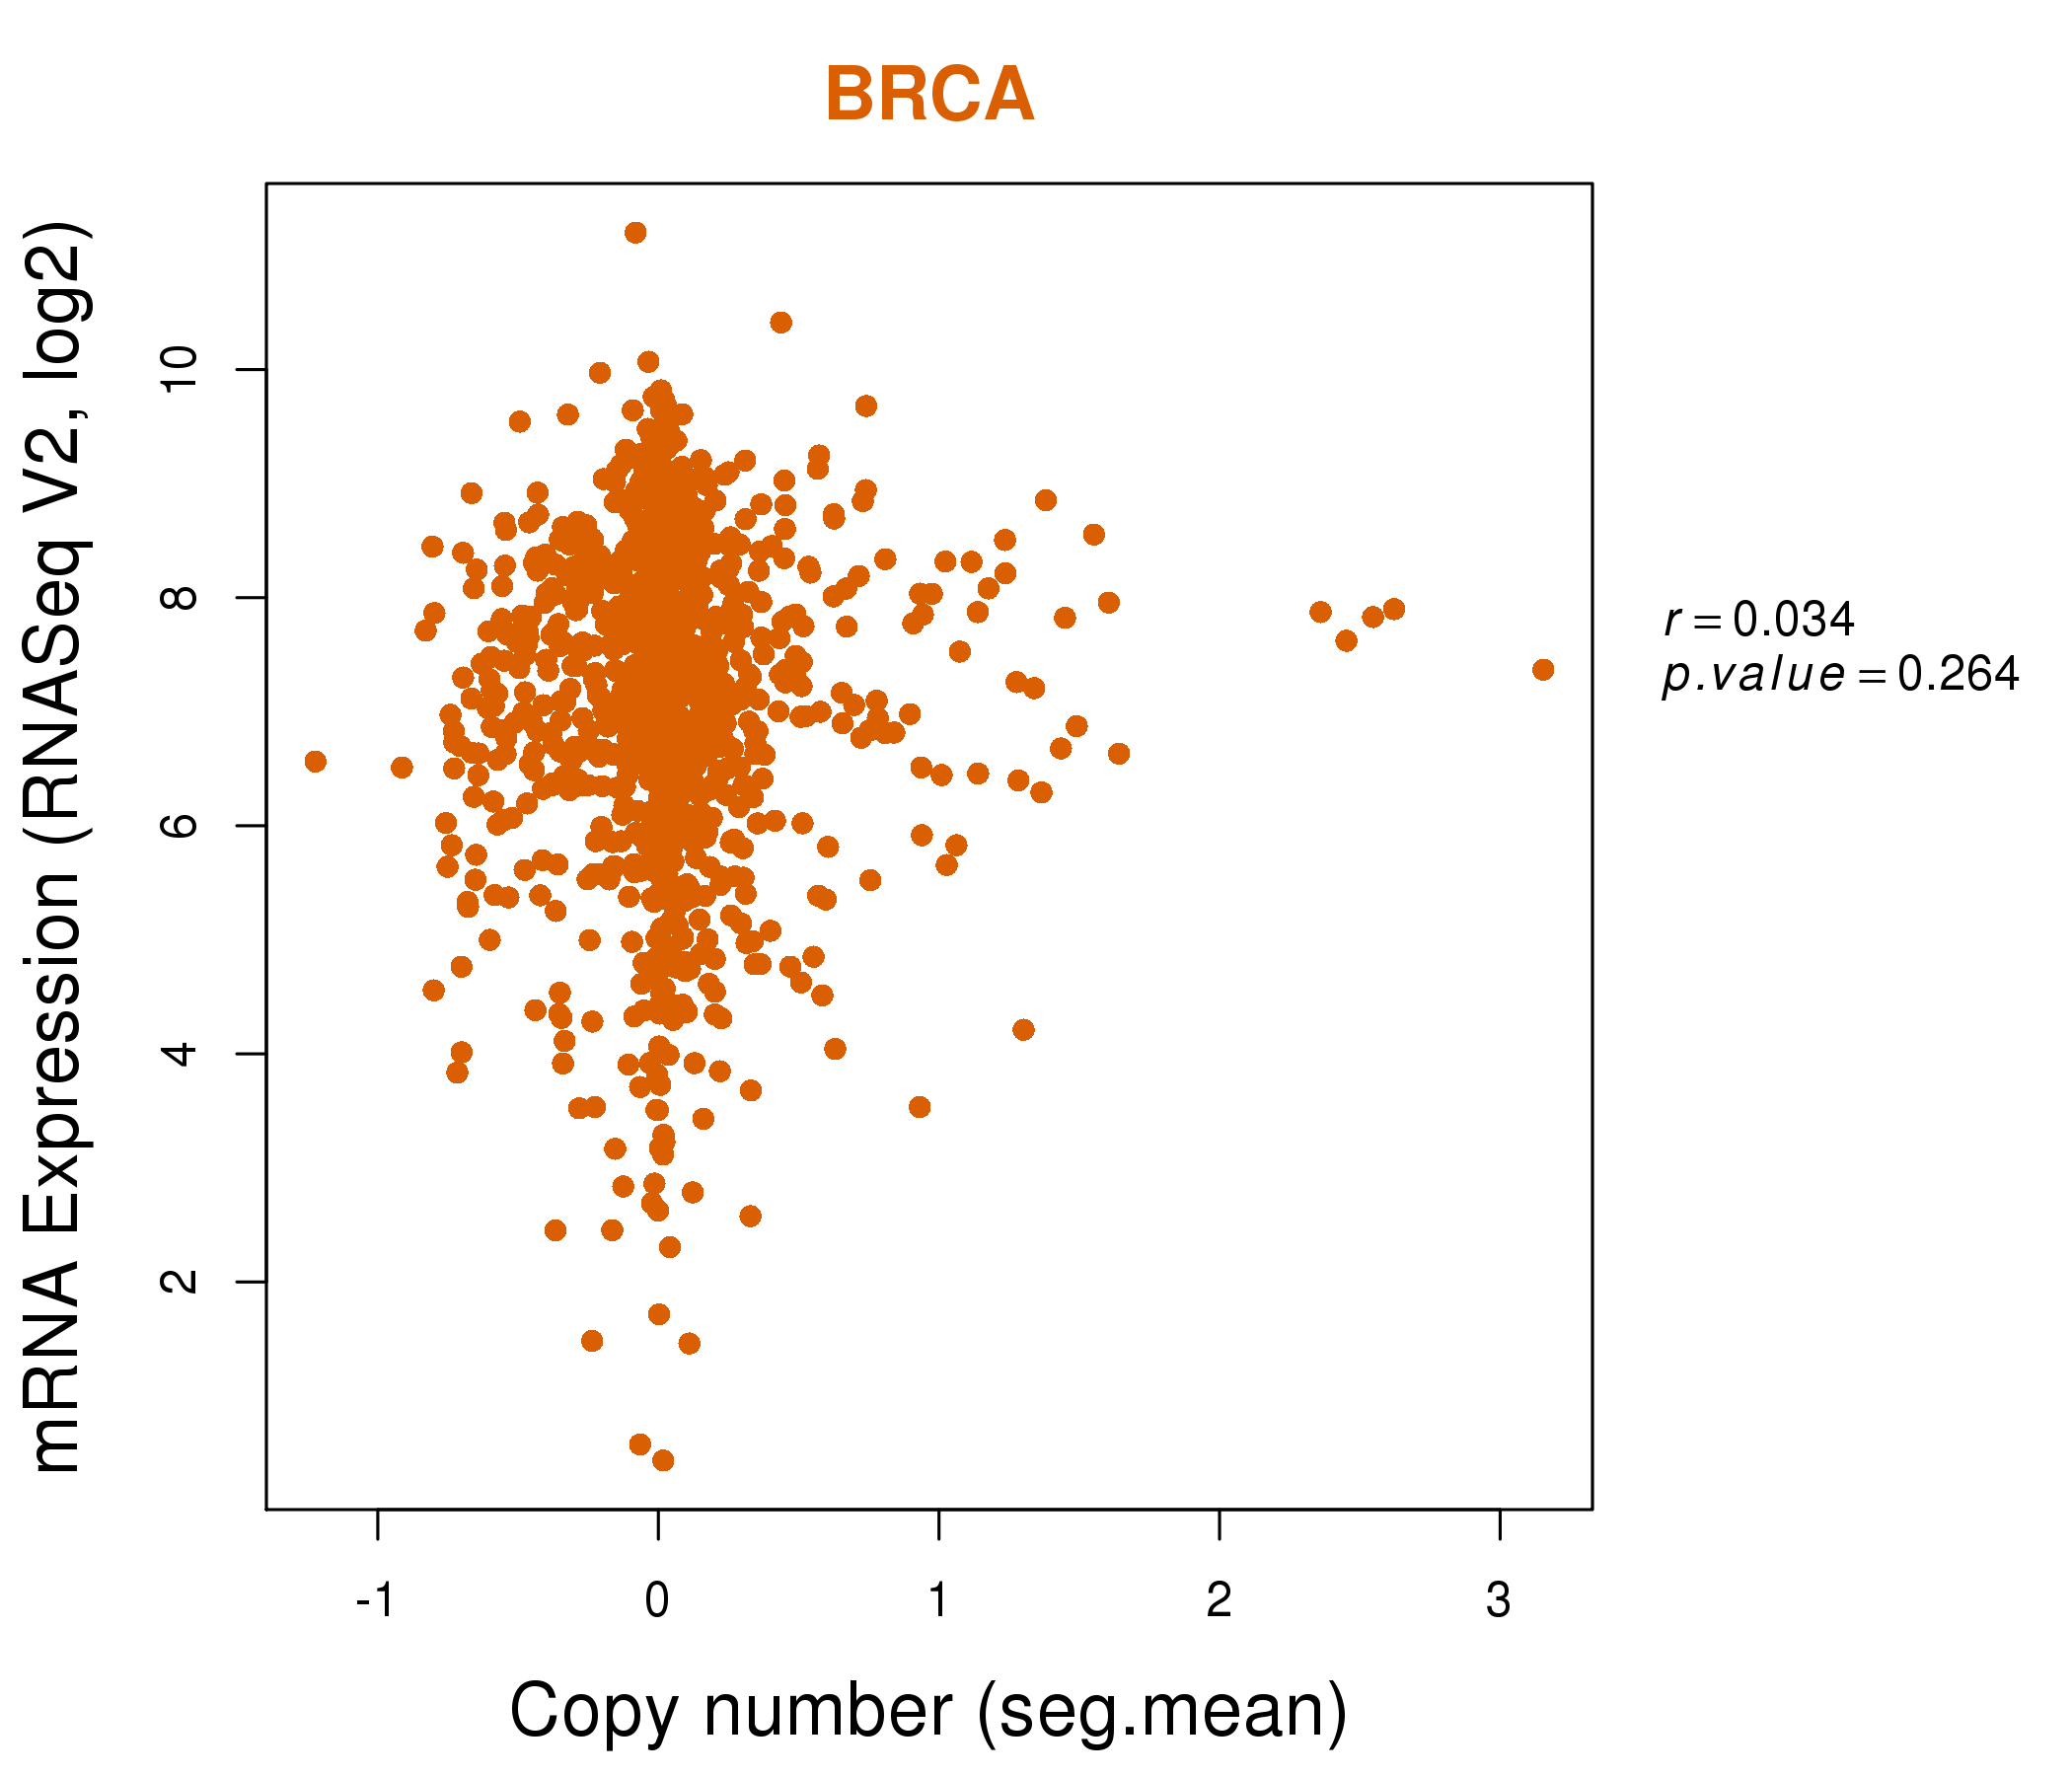
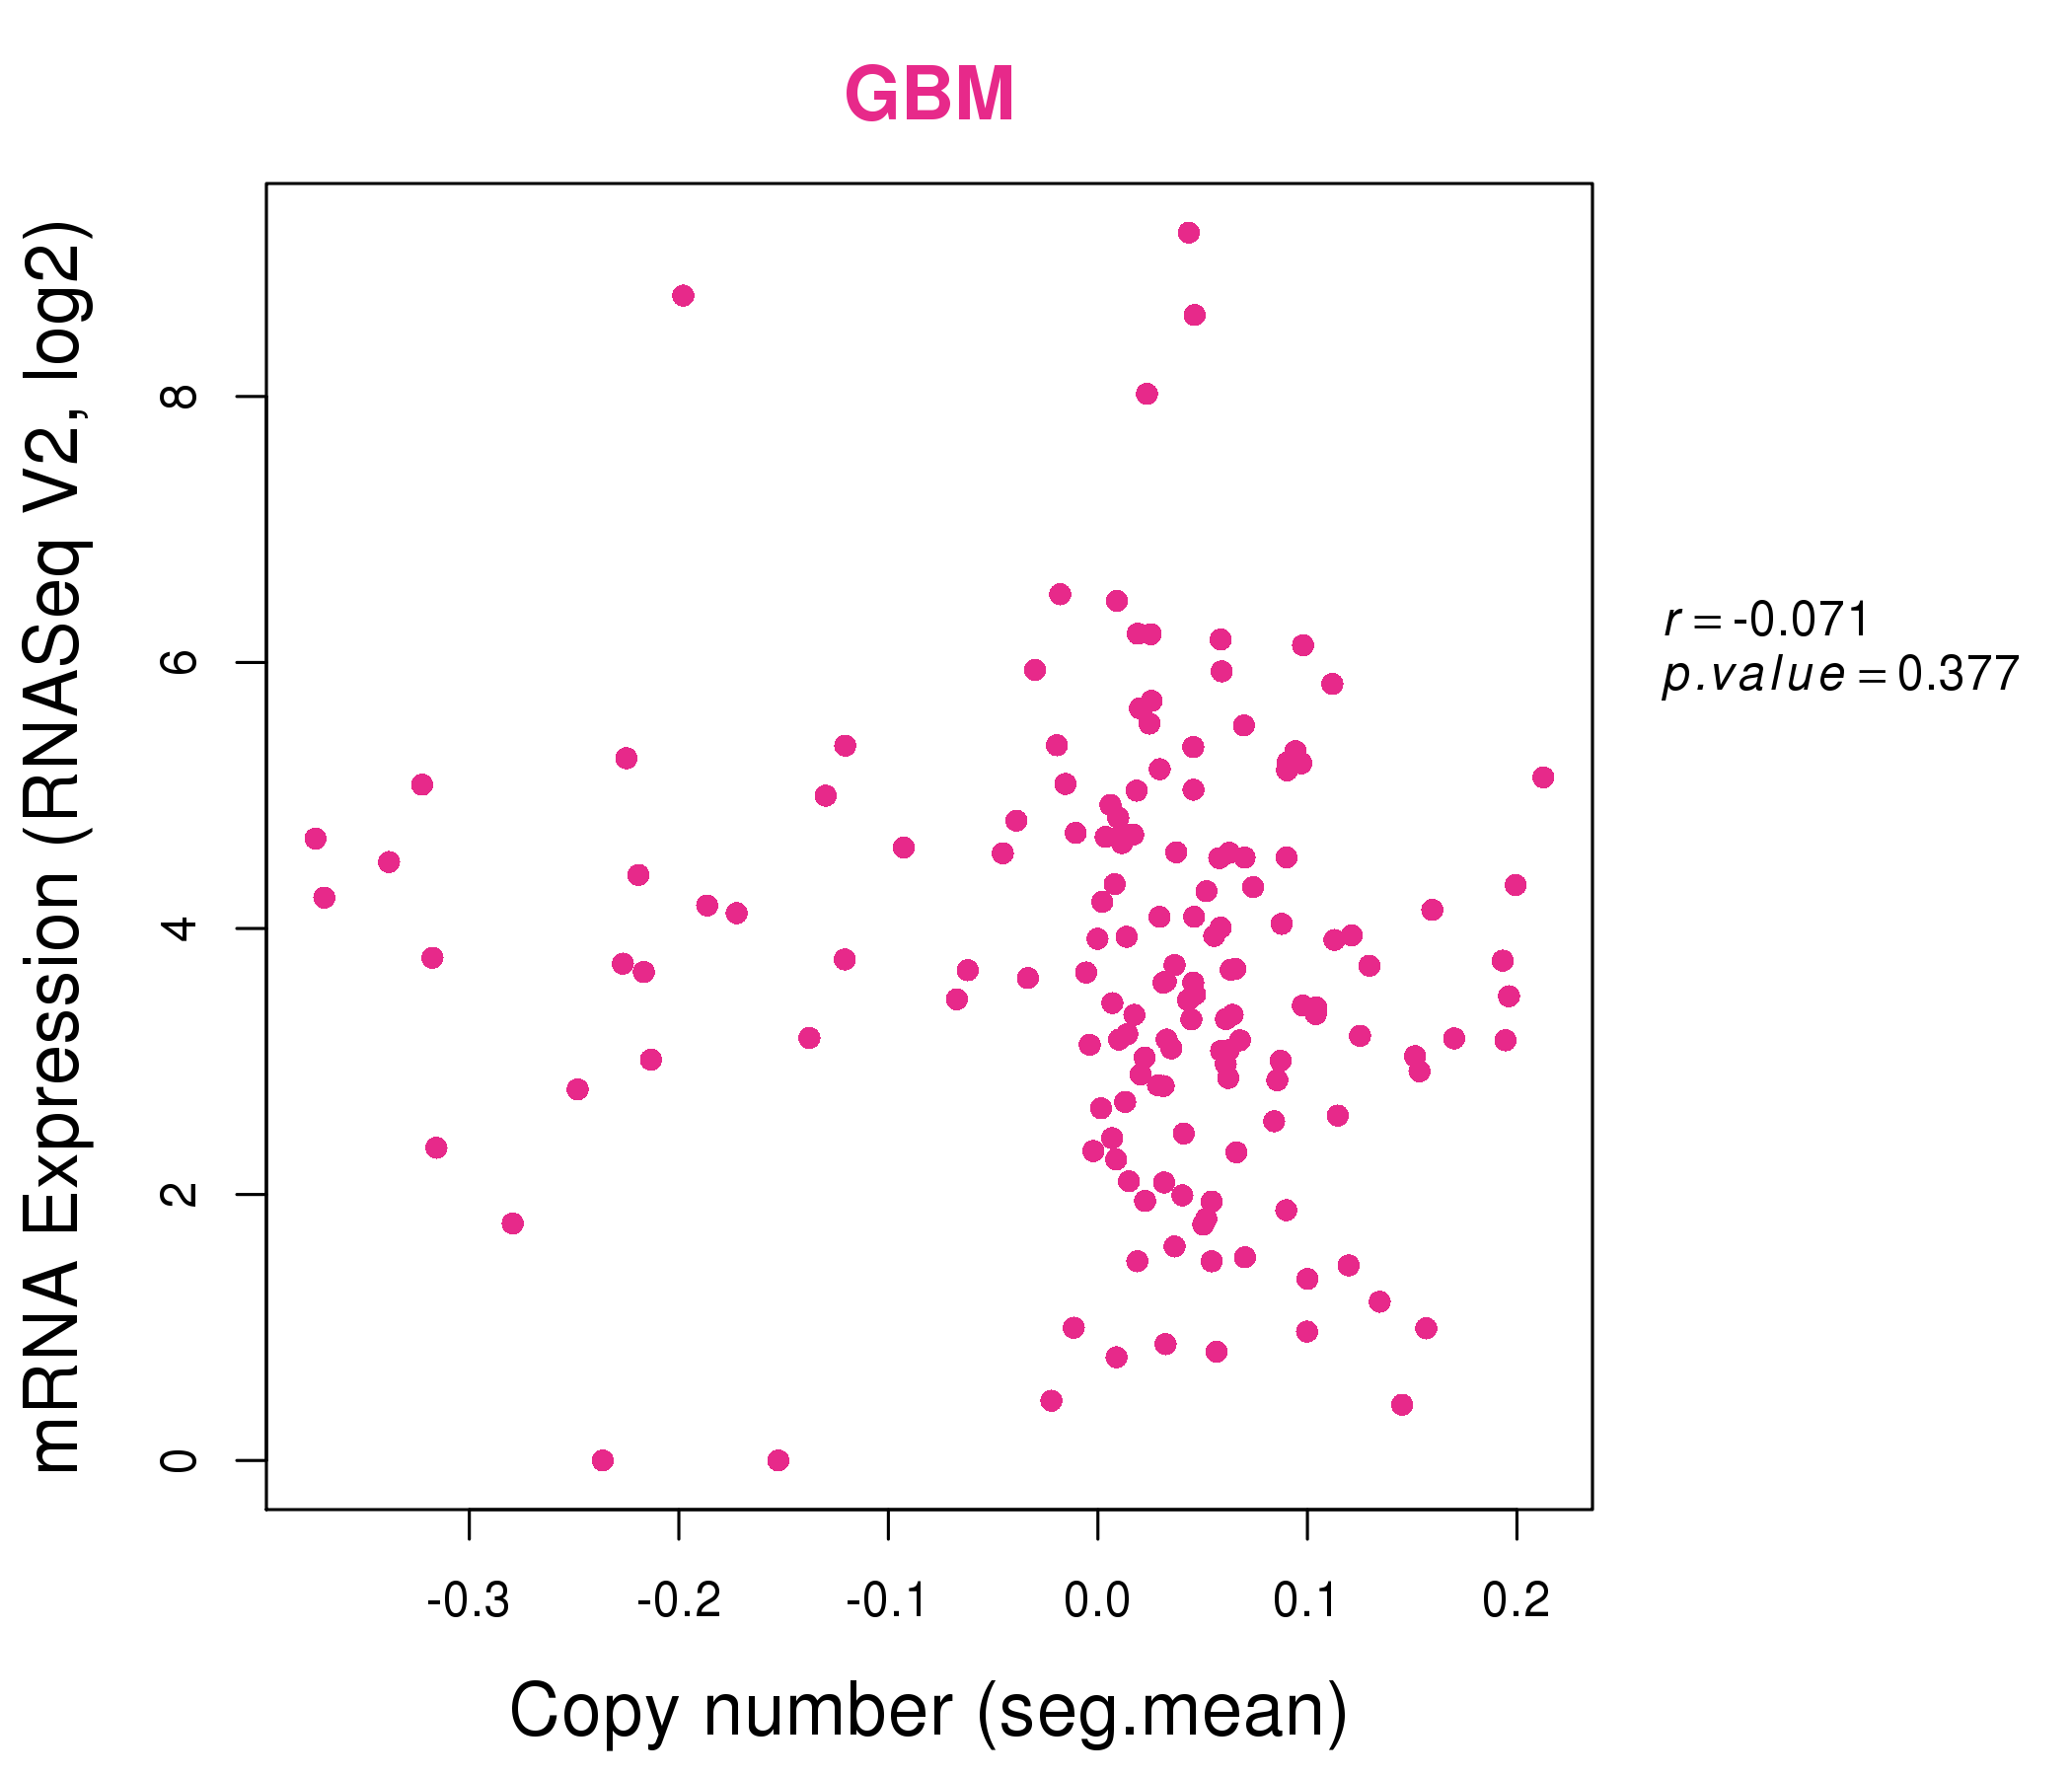
| * Copy number data were extracted from TCGA using R package TCGA-Assembler. The URLs of all public data files on TCGA DCC data server were gathered on Jan-05-2015. Function ProcessCNAData in TCGA-Assembler package was used to obtain gene-level copy number value which is calculated as the average copy number of the genomic region of a gene. |
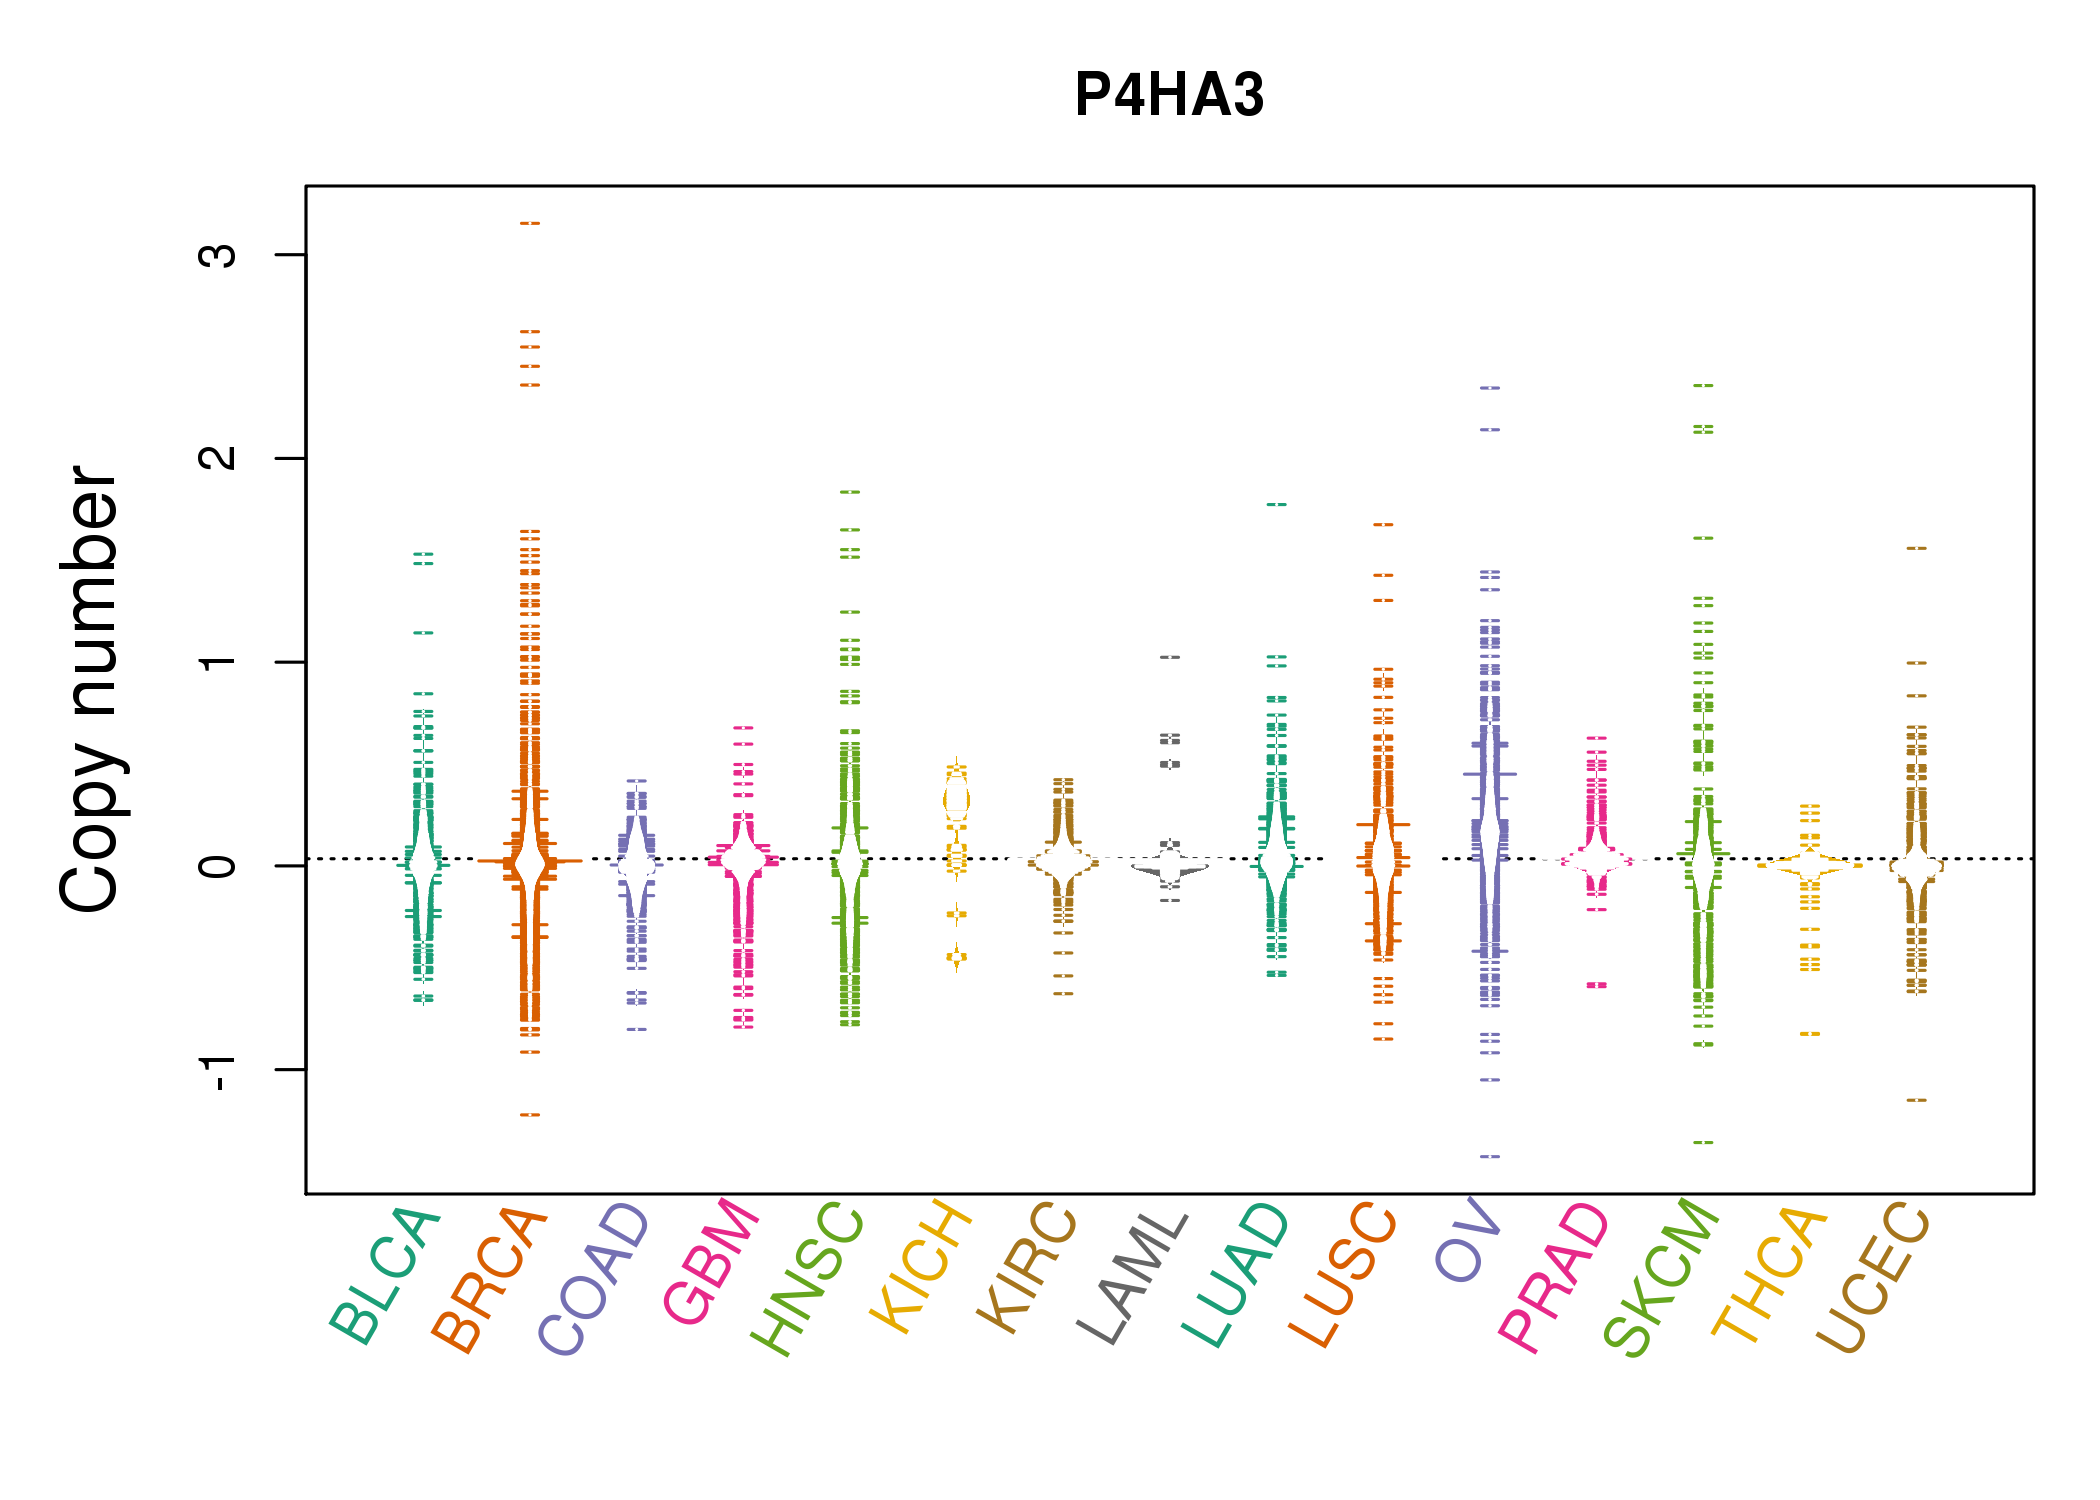 |
| cf) Tissue ID[Tissue type]: BLCA[Bladder Urothelial Carcinoma], BRCA[Breast invasive carcinoma], CESC[Cervical squamous cell carcinoma and endocervical adenocarcinoma], COAD[Colon adenocarcinoma], GBM[Glioblastoma multiforme], Glioma Low Grade, HNSC[Head and Neck squamous cell carcinoma], KICH[Kidney Chromophobe], KIRC[Kidney renal clear cell carcinoma], KIRP[Kidney renal papillary cell carcinoma], LAML[Acute Myeloid Leukemia], LUAD[Lung adenocarcinoma], LUSC[Lung squamous cell carcinoma], OV[Ovarian serous cystadenocarcinoma ], PAAD[Pancreatic adenocarcinoma], PRAD[Prostate adenocarcinoma], SKCM[Skin Cutaneous Melanoma], STAD[Stomach adenocarcinoma], THCA[Thyroid carcinoma], UCEC[Uterine Corpus Endometrial Carcinoma] |
| Top |
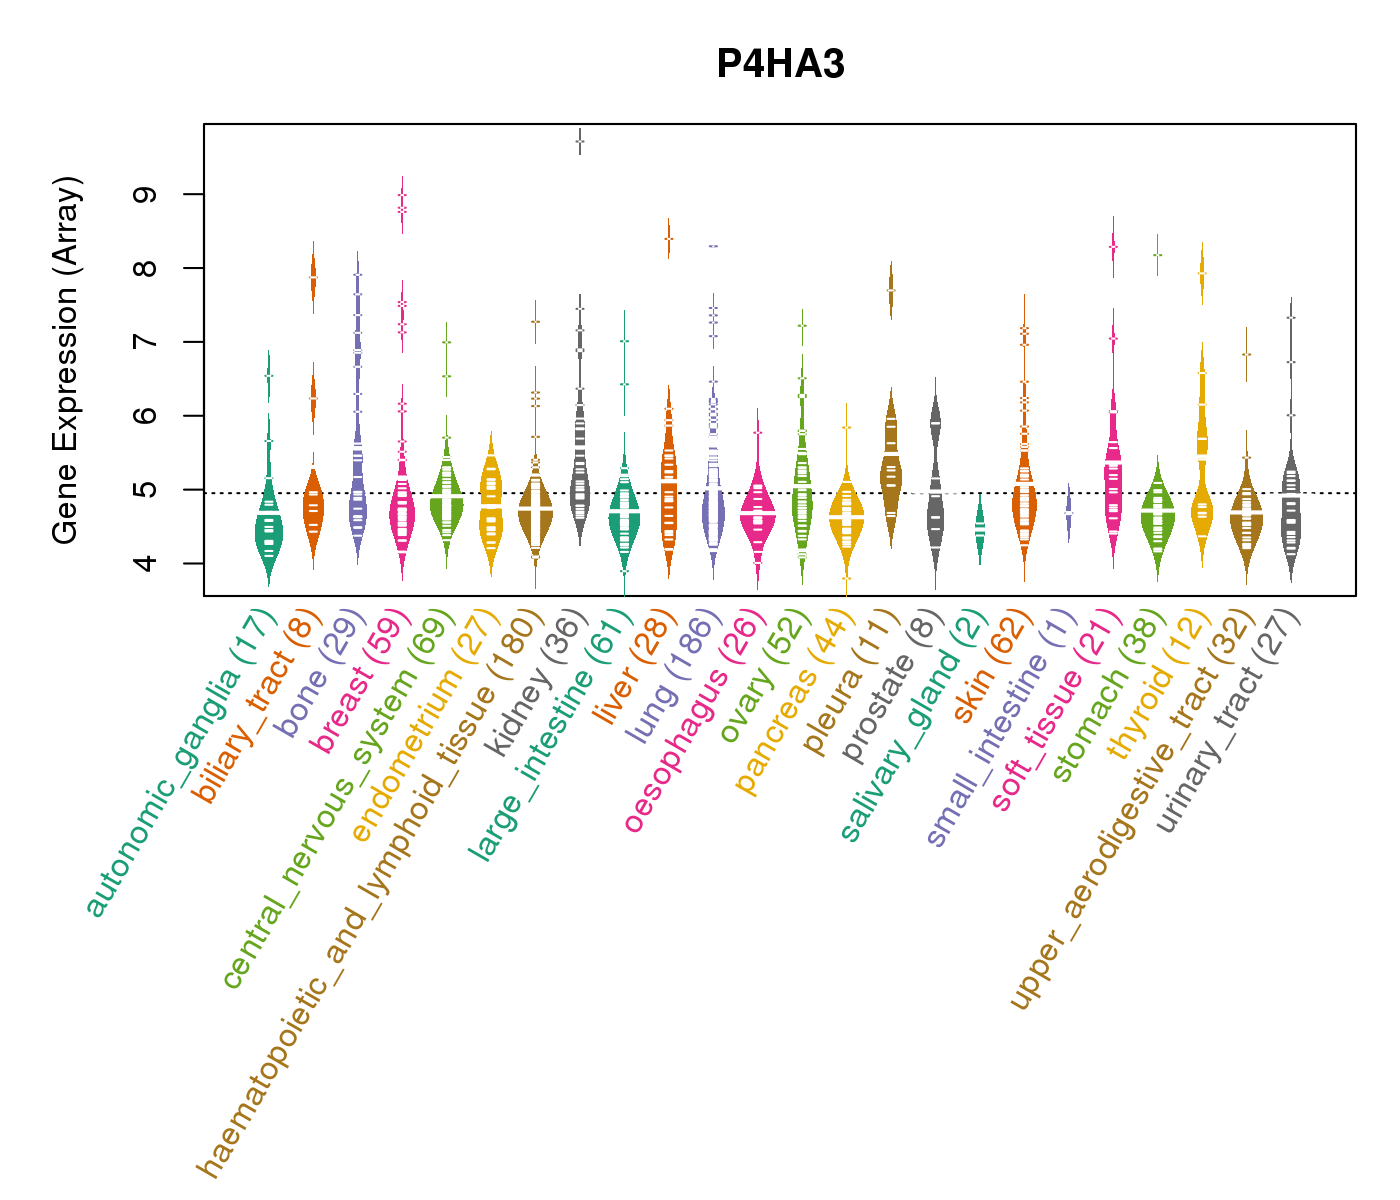
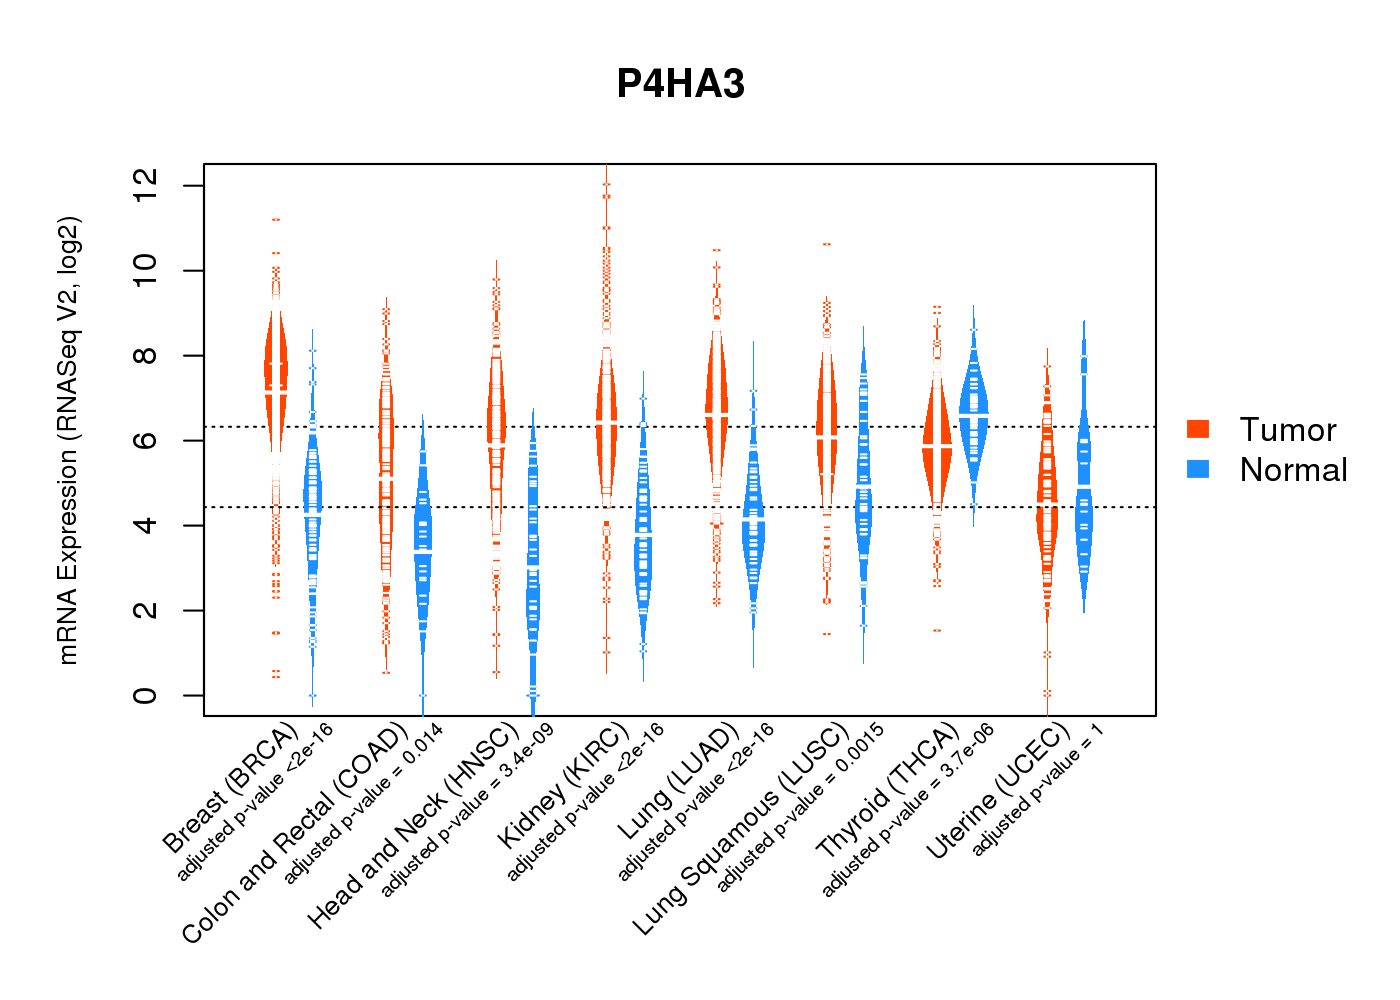
| Gene Expression for P4HA3 |
| * CCLE gene expression data were extracted from CCLE_Expression_Entrez_2012-10-18.res: Gene-centric RMA-normalized mRNA expression data. |
 |
| * Normalized gene expression data of RNASeqV2 was extracted from TCGA using R package TCGA-Assembler. The URLs of all public data files on TCGA DCC data server were gathered at Jan-05-2015. Only eight cancer types have enough normal control samples for differential expression analysis. (t test, adjusted p<0.05 (using Benjamini-Hochberg FDR)) |
 |
| Top |
| * This plots show the correlation between CNV and gene expression. |
: Open all plots for all cancer types
 |
|
 |
|
| Top |
| Gene-Gene Network Information |
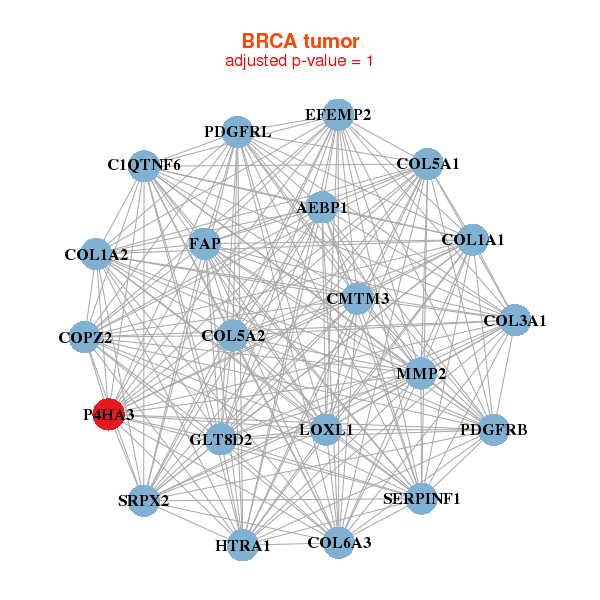
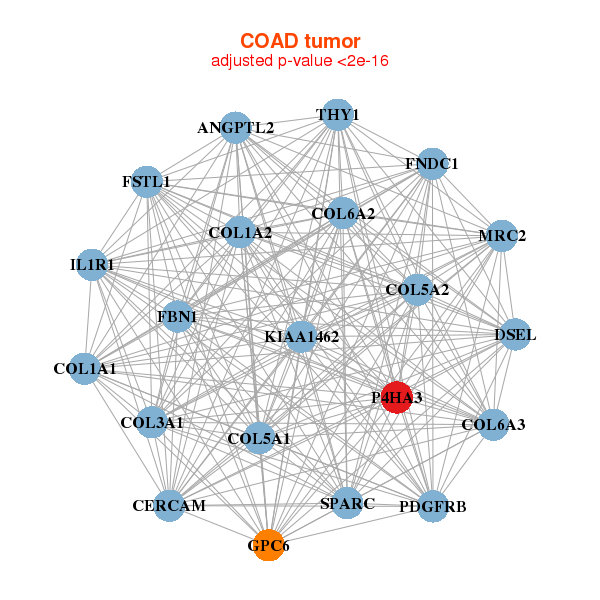
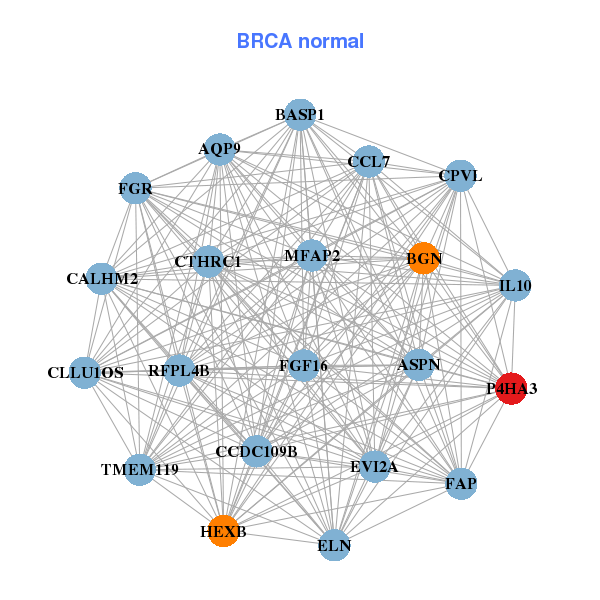
| * Co-Expression network figures were drawn using R package igraph. Only the top 20 genes with the highest correlations were shown. Red circle: input gene, orange circle: cell metabolism gene, sky circle: other gene |
: Open all plots for all cancer types
 |
|
| AEBP1,C1QTNF6,CMTM3,COL1A1,COL1A2,COL3A1,COL5A1, COL5A2,COL6A3,COPZ2,EFEMP2,FAP,GLT8D2,HTRA1, LOXL1,MMP2,P4HA3,PDGFRB,PDGFRL,SERPINF1,SRPX2 | AQP9,ASPN,BASP1,BGN,CALHM2,CCDC109B,CCL7, CLLU1OS,CPVL,CTHRC1,ELN,EVI2A,FAP,FGF16, FGR,HEXB,IL10,MFAP2,P4HA3,RFPL4B,TMEM119 |
 |
|
| ANGPTL2,CERCAM,COL1A1,COL1A2,COL3A1,COL5A1,COL5A2, COL6A2,COL6A3,DSEL,FBN1,FNDC1,FSTL1,GPC6, IL1R1,KIAA1462,MRC2,P4HA3,PDGFRB,SPARC,THY1 | ADAM23,ALDH1A2,ANXA5,DYX1C1,FAM92A1,FAP,GPR176, GPX8,LNP1,MAPKAP1,OLFML2B,P4HA3,PALMD,SETD7, SRPX2,STC2,THBS2,THY1,TIMP1,TSHZ2,WISP1 |
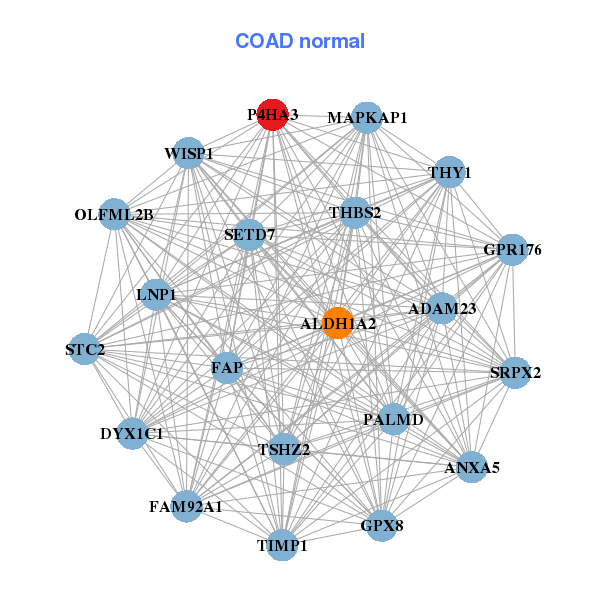
| * Co-Expression network figures were drawn using R package igraph. Only the top 20 genes with the highest correlations were shown. Red circle: input gene, orange circle: cell metabolism gene, sky circle: other gene |
: Open all plots for all cancer types
| Top |
: Open all interacting genes' information including KEGG pathway for all interacting genes from DAVID
| Top |
| Pharmacological Information for P4HA3 |
| There's no related Drug. |
| Top |
| Cross referenced IDs for P4HA3 |
| * We obtained these cross-references from Uniprot database. It covers 150 different DBs, 18 categories. http://www.uniprot.org/help/cross_references_section |
: Open all cross reference information
|
Copyright © 2016-Present - The Univsersity of Texas Health Science Center at Houston @ |