|
||||||||||||||||||||||||||||||||||||||||||||||||||||||||||||||||||||||||||||||||||||||||||||||||||||||||||||||||||||||||||||||||||||||||||||||||||||||||||||||||||||||||||||||||||||||||||||||||||||||||||||||||||||||||||||||||||||||||||||||||||||||||||||||||||||||||||||||||||||||||||||||||||||||||||||||||||||||||||
| |
| Phenotypic Information (metabolism pathway, cancer, disease, phenome) |
| |
| |
| Gene-Gene Network Information: Co-Expression Network, Interacting Genes & KEGG |
| |
|


| Gene Summary for GXYLT1 |
| Top |
| Phenotypic Information for GXYLT1(metabolism pathway, cancer, disease, phenome) |
| Cancer | CGAP: GXYLT1 |
| Familial Cancer Database: GXYLT1 | |
| * This gene is included in those cancer gene databases. |
|
|
|
|
|
|
| ||||||||||||||||||||||||||||||||||||||||||||||||||||||||||||||||||||||||||||||||||||||||||||||||||||||||||||||||||||||||||||||||||||||||||||||||||||||||||||||||||||||||||||||||||||||||||||||||||||||||||||||||||||||||||||||||||||||||||||||||||||||||||||||||||||||||||||||||||||||||||||||||||||||||||||||||||||
Oncogene 1 | Significant driver gene in | |||||||||||||||||||||||||||||||||||||||||||||||||||||||||||||||||||||||||||||||||||||||||||||||||||||||||||||||||||||||||||||||||||||||||||||||||||||||||||||||||||||||||||||||||||||||||||||||||||||||||||||||||||||||||||||||||||||||||||||||||||||||||||||||||||||||||||||||||||||||||||||||||||||||||||||||||||||||||
| cf) number; DB name 1 Oncogene; http://nar.oxfordjournals.org/content/35/suppl_1/D721.long, 2 Tumor Suppressor gene; https://bioinfo.uth.edu/TSGene/, 3 Cancer Gene Census; http://www.nature.com/nrc/journal/v4/n3/abs/nrc1299.html, 4 CancerGenes; http://nar.oxfordjournals.org/content/35/suppl_1/D721.long, 5 Network of Cancer Gene; http://ncg.kcl.ac.uk/index.php, 1Therapeutic Vulnerabilities in Cancer; http://cbio.mskcc.org/cancergenomics/statius/ |
| REACTOME_METABOLISM_OF_CARBOHYDRATES | |
| OMIM | |
| Orphanet | |
| Disease | KEGG Disease: GXYLT1 |
| MedGen: GXYLT1 (Human Medical Genetics with Condition) | |
| ClinVar: GXYLT1 | |
| Phenotype | MGI: GXYLT1 (International Mouse Phenotyping Consortium) |
| PhenomicDB: GXYLT1 | |
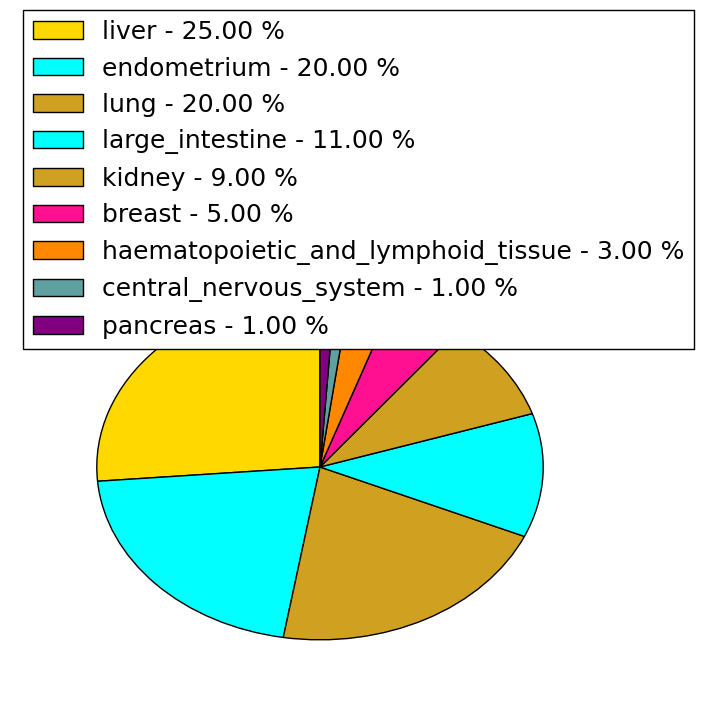
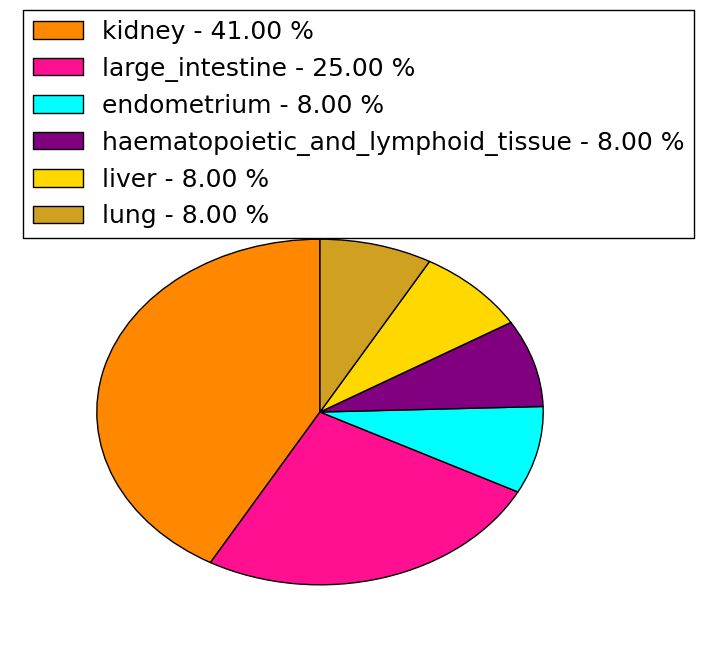
| Mutations for GXYLT1 |
| * Under tables are showing count per each tissue to give us broad intuition about tissue specific mutation patterns.You can go to the detailed page for each mutation database's web site. |
| - Statistics for Tissue and Mutation type | Top |
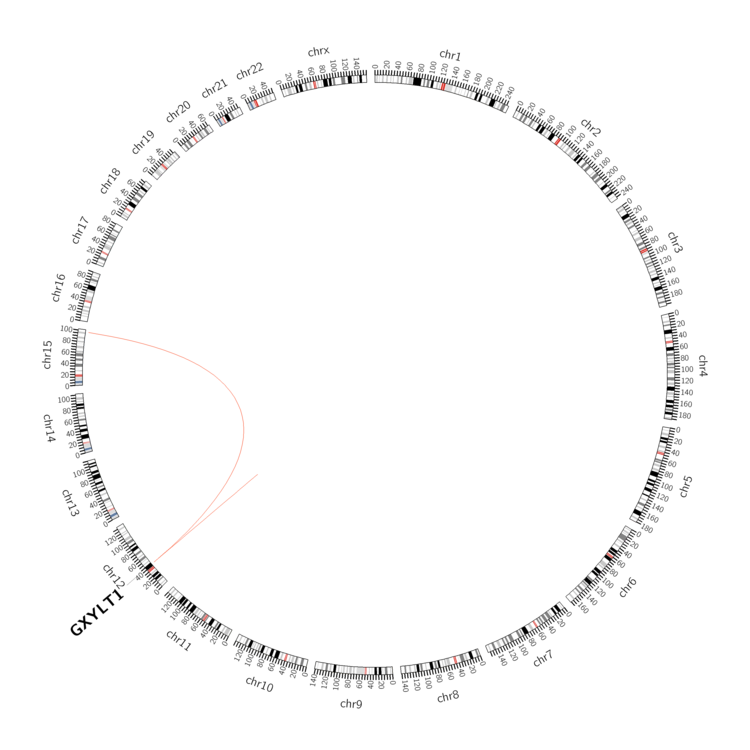 |
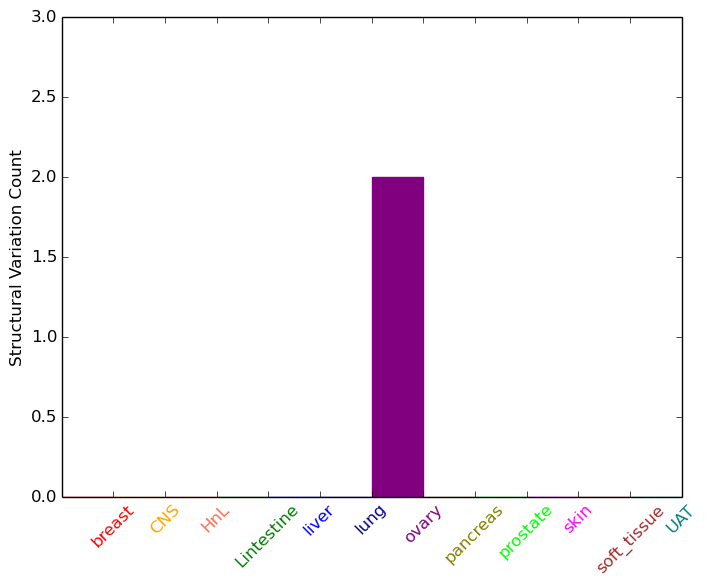
| - For Inter-chromosomal Variations |
| * Inter-chromosomal variantions includes 'interchromosomal amplicon to amplicon', 'interchromosomal amplicon to non-amplified dna', 'interchromosomal insertion', 'Interchromosomal unknown type'. |
 |
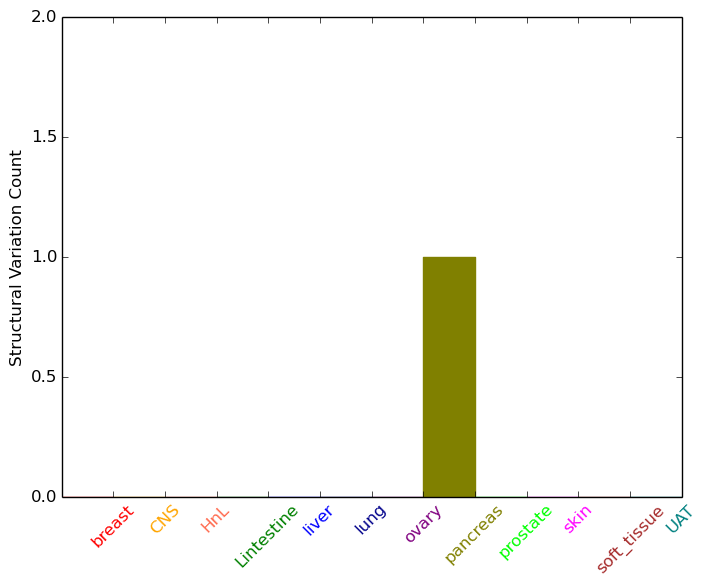
| - For Intra-chromosomal Variations |
| * Intra-chromosomal variantions includes 'intrachromosomal amplicon to amplicon', 'intrachromosomal amplicon to non-amplified dna', 'intrachromosomal deletion', 'intrachromosomal fold-back inversion', 'intrachromosomal inversion', 'intrachromosomal tandem duplication', 'Intrachromosomal unknown type', 'intrachromosomal with inverted orientation', 'intrachromosomal with non-inverted orientation'. |
 |
| Sample | Symbol_a | Chr_a | Start_a | End_a | Symbol_b | Chr_b | Start_b | End_b |
| ovary | GXYLT1 | chr12 | 42504947 | 42505147 | chr15 | 98189233 | 98189433 | |
| ovary | GXYLT1 | chr12 | 42508376 | 42508396 | chr15 | 98192509 | 98192529 | |
| pancreas | GXYLT1 | chr12 | 42505384 | 42505404 | GXYLT1 | chr12 | 42505548 | 42505568 |
| cf) Tissue number; Tissue name (1;Breast, 2;Central_nervous_system, 3;Haematopoietic_and_lymphoid_tissue, 4;Large_intestine, 5;Liver, 6;Lung, 7;Ovary, 8;Pancreas, 9;Prostate, 10;Skin, 11;Soft_tissue, 12;Upper_aerodigestive_tract) |
| * From mRNA Sanger sequences, Chitars2.0 arranged chimeric transcripts. This table shows GXYLT1 related fusion information. |
| ID | Head Gene | Tail Gene | Accession | Gene_a | qStart_a | qEnd_a | Chromosome_a | tStart_a | tEnd_a | Gene_a | qStart_a | qEnd_a | Chromosome_a | tStart_a | tEnd_a |
| BF817918 | CDC42 | 10 | 460 | 1 | 22392226 | 22392675 | GXYLT1 | 453 | 606 | 12 | 42480488 | 42480641 | |
| Top |
| Mutation type/ Tissue ID | brca | cns | cerv | endome | haematopo | kidn | Lintest | liver | lung | ns | ovary | pancre | prost | skin | stoma | thyro | urina | |||
| Total # sample | 2 | 1 | 1 | 2 | 1 | 1 | ||||||||||||||
| GAIN (# sample) | 2 | 1 | 1 | 1 | 1 | |||||||||||||||
| LOSS (# sample) | 1 | 1 |
| cf) Tissue ID; Tissue type (1; Breast, 2; Central_nervous_system, 3; Cervix, 4; Endometrium, 5; Haematopoietic_and_lymphoid_tissue, 6; Kidney, 7; Large_intestine, 8; Liver, 9; Lung, 10; NS, 11; Ovary, 12; Pancreas, 13; Prostate, 14; Skin, 15; Stomach, 16; Thyroid, 17; Urinary_tract) |
| Top |
|
 |
| Top |
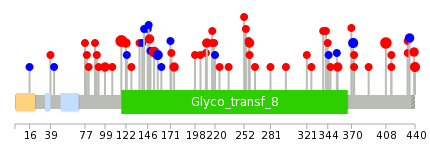
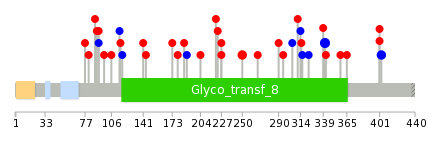
| Stat. for Non-Synonymous SNVs (# total SNVs=54) | (# total SNVs=12) |
 |  |
(# total SNVs=2) | (# total SNVs=0) |
 |
| Top |
| * When you move the cursor on each content, you can see more deailed mutation information on the Tooltip. Those are primary_site,primary_histology,mutation(aa),pubmedID. |
| GRCh37 position | Mutation(aa) | Unique sampleID count |
| chr12:42512938-42512938 | p.H117L | 7 |
| chr12:42481688-42481688 | p.K408I | 6 |
| chr12:42512830-42512830 | p.D153V | 4 |
| chr12:42491289-42491289 | p.D372D | 3 |
| chr12:42512817-42512817 | p.H157H | 3 |
| chr12:42499711-42499711 | p.R258L | 3 |
| chr12:42481592-42481592 | p.K440R | 3 |
| chr12:42481609-42481609 | p.A434A | 2 |
| chr12:42491342-42491342 | p.A355T | 2 |
| chr12:42512924-42512924 | p.A122T | 2 |
| Top |
|
 |
| Point Mutation/ Tissue ID | 1 | 2 | 3 | 4 | 5 | 6 | 7 | 8 | 9 | 10 | 11 | 12 | 13 | 14 | 15 | 16 | 17 | 18 | 19 | 20 |
| # sample | 1 | 1 | 5 | 1 | 6 | 1 | 4 | 3 | 3 | 5 | 9 | |||||||||
| # mutation | 1 | 1 | 5 | 1 | 6 | 1 | 4 | 3 | 3 | 5 | 11 | |||||||||
| nonsynonymous SNV | 1 | 1 | 3 | 1 | 3 | 3 | 3 | 2 | 3 | 10 | ||||||||||
| synonymous SNV | 2 | 3 | 1 | 1 | 1 | 2 | 1 |
| cf) Tissue ID; Tissue type (1; BLCA[Bladder Urothelial Carcinoma], 2; BRCA[Breast invasive carcinoma], 3; CESC[Cervical squamous cell carcinoma and endocervical adenocarcinoma], 4; COAD[Colon adenocarcinoma], 5; GBM[Glioblastoma multiforme], 6; Glioma Low Grade, 7; HNSC[Head and Neck squamous cell carcinoma], 8; KICH[Kidney Chromophobe], 9; KIRC[Kidney renal clear cell carcinoma], 10; KIRP[Kidney renal papillary cell carcinoma], 11; LAML[Acute Myeloid Leukemia], 12; LUAD[Lung adenocarcinoma], 13; LUSC[Lung squamous cell carcinoma], 14; OV[Ovarian serous cystadenocarcinoma ], 15; PAAD[Pancreatic adenocarcinoma], 16; PRAD[Prostate adenocarcinoma], 17; SKCM[Skin Cutaneous Melanoma], 18:STAD[Stomach adenocarcinoma], 19:THCA[Thyroid carcinoma], 20:UCEC[Uterine Corpus Endometrial Carcinoma]) |
| Top |
| * We represented just top 10 SNVs. When you move the cursor on each content, you can see more deailed mutation information on the Tooltip. Those are primary_site, primary_histology, mutation(aa), pubmedID. |
| Genomic Position | Mutation(aa) | Unique sampleID count |
| chr12:42491289 | p.D341D,GXYLT1 | 3 |
| chr12:42499642 | p.R250Q,GXYLT1 | 2 |
| chr12:42499711 | p.R227L,GXYLT1 | 2 |
| chr12:42481609 | p.A403A,GXYLT1 | 2 |
| chr12:42491380 | p.R401H,GXYLT1 | 1 |
| chr12:42499835 | p.C92C,GXYLT1 | 1 |
| chr12:42481617 | p.R401G,GXYLT1 | 1 |
| chr12:42523599 | p.D92E | 1 |
| chr12:42491397 | p.R365S,GXYLT1 | 1 |
| chr12:42499855 | p.G223R,GXYLT1 | 1 |
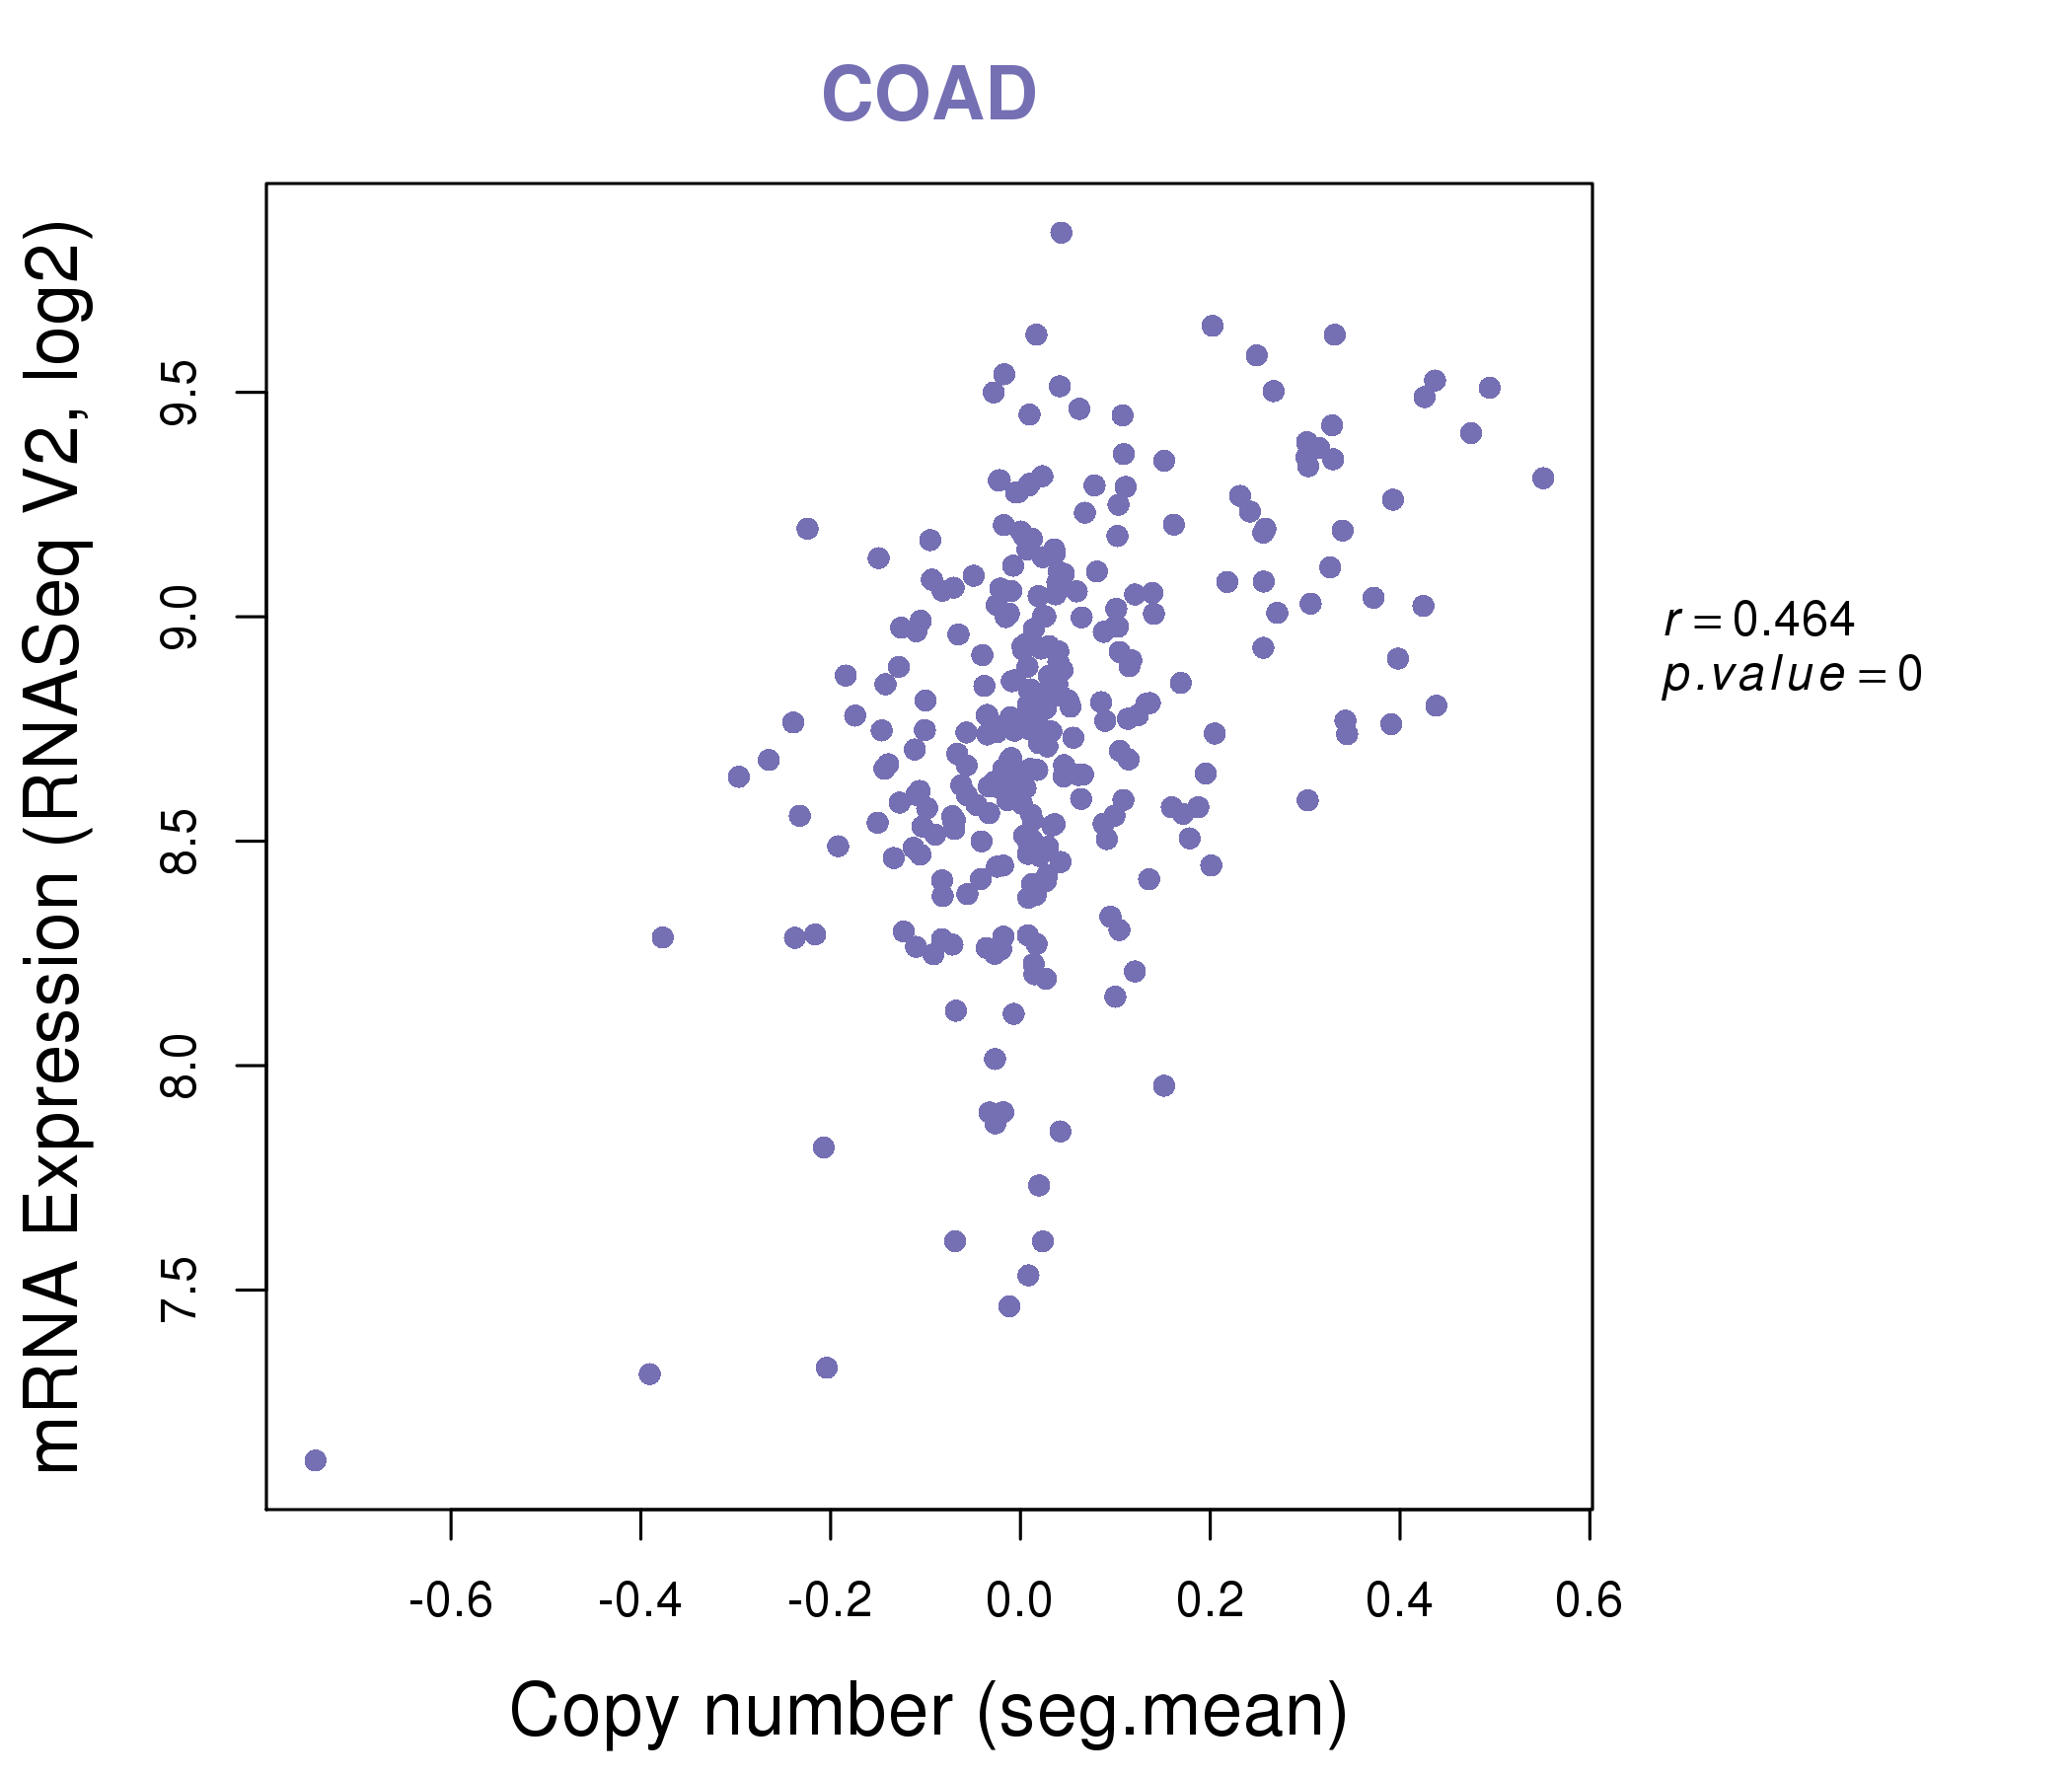
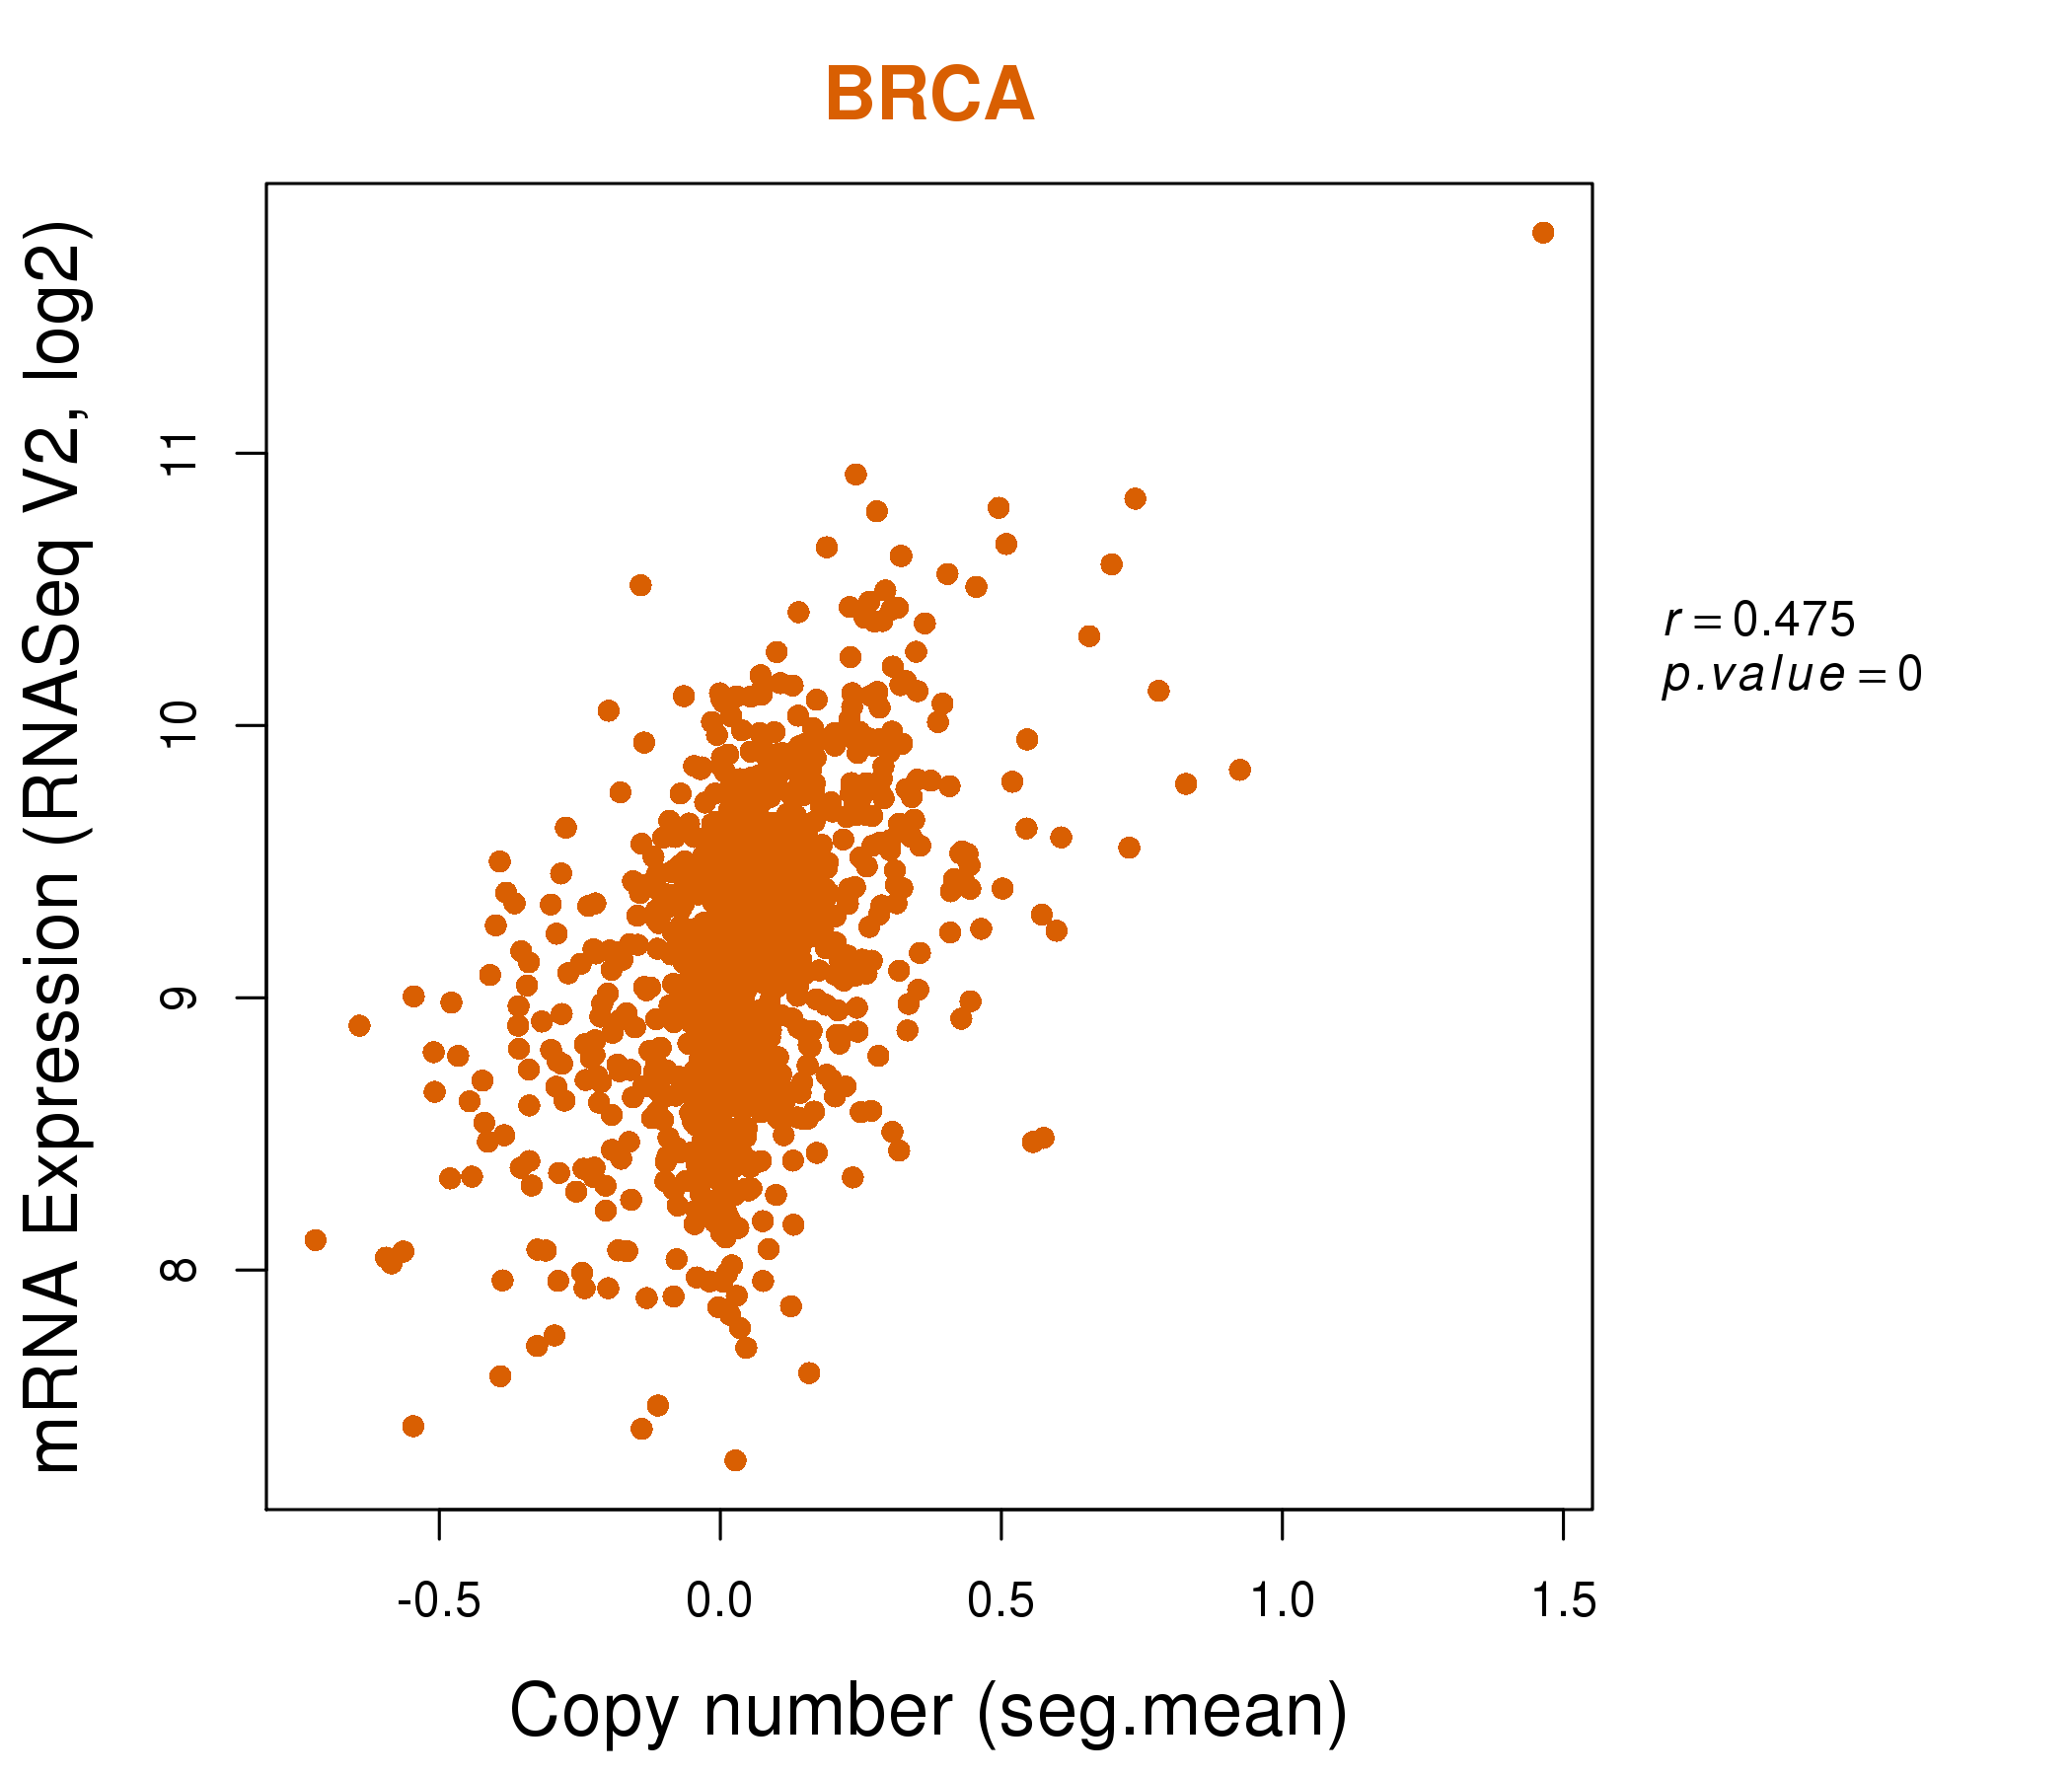
| * Copy number data were extracted from TCGA using R package TCGA-Assembler. The URLs of all public data files on TCGA DCC data server were gathered on Jan-05-2015. Function ProcessCNAData in TCGA-Assembler package was used to obtain gene-level copy number value which is calculated as the average copy number of the genomic region of a gene. |
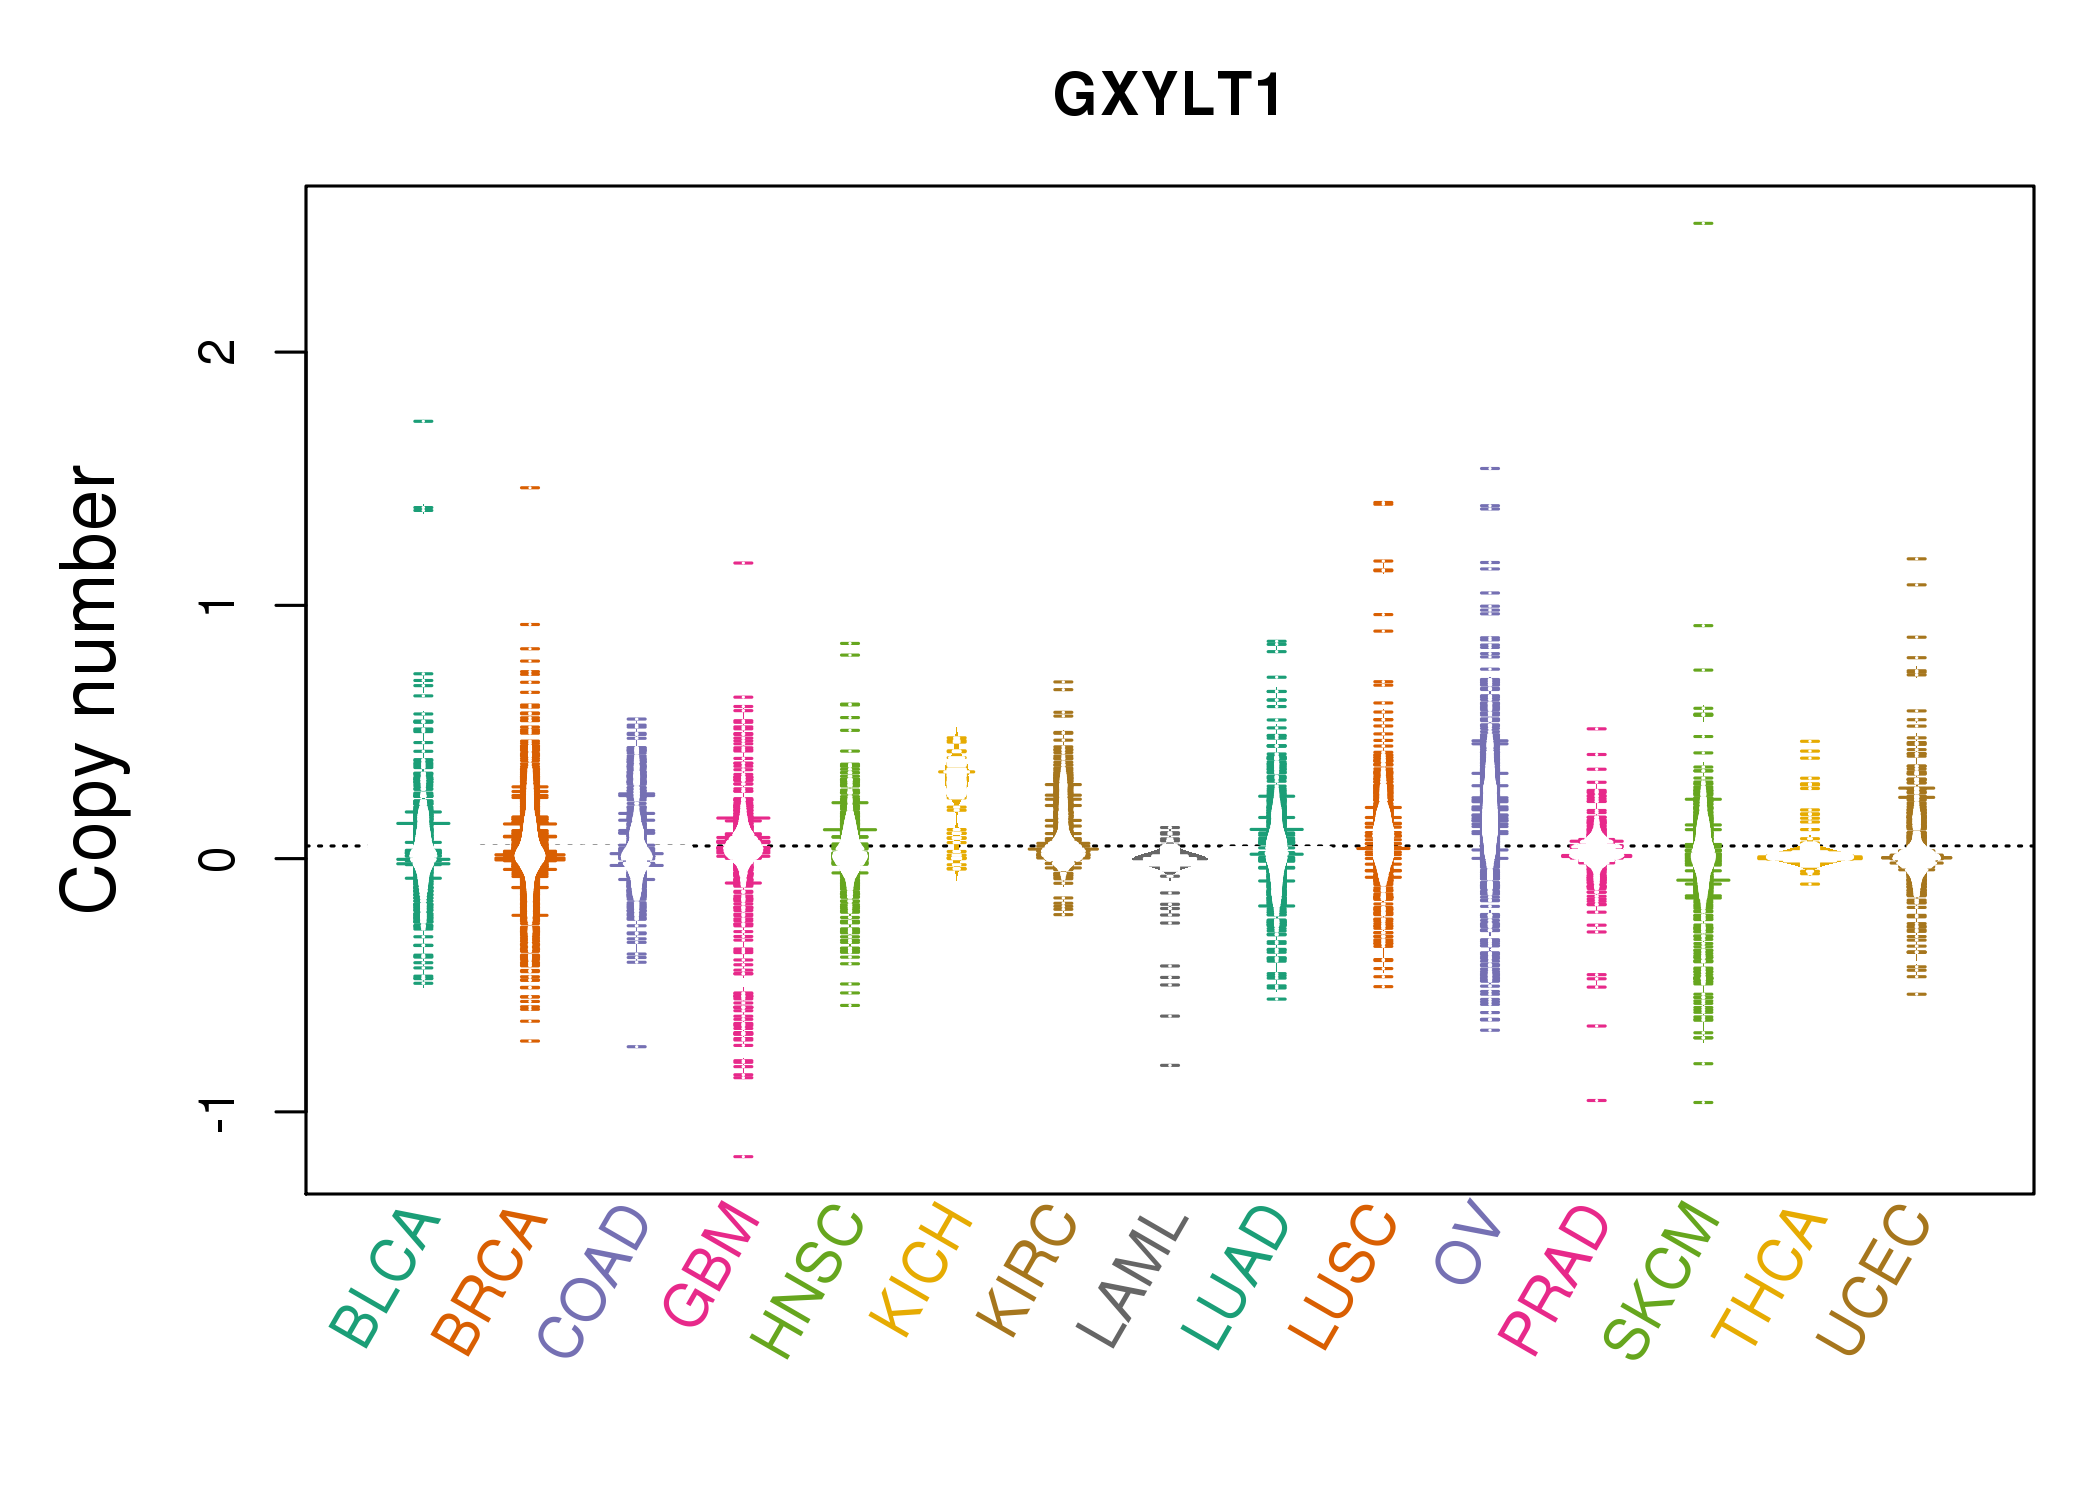 |
| cf) Tissue ID[Tissue type]: BLCA[Bladder Urothelial Carcinoma], BRCA[Breast invasive carcinoma], CESC[Cervical squamous cell carcinoma and endocervical adenocarcinoma], COAD[Colon adenocarcinoma], GBM[Glioblastoma multiforme], Glioma Low Grade, HNSC[Head and Neck squamous cell carcinoma], KICH[Kidney Chromophobe], KIRC[Kidney renal clear cell carcinoma], KIRP[Kidney renal papillary cell carcinoma], LAML[Acute Myeloid Leukemia], LUAD[Lung adenocarcinoma], LUSC[Lung squamous cell carcinoma], OV[Ovarian serous cystadenocarcinoma ], PAAD[Pancreatic adenocarcinoma], PRAD[Prostate adenocarcinoma], SKCM[Skin Cutaneous Melanoma], STAD[Stomach adenocarcinoma], THCA[Thyroid carcinoma], UCEC[Uterine Corpus Endometrial Carcinoma] |
| Top |
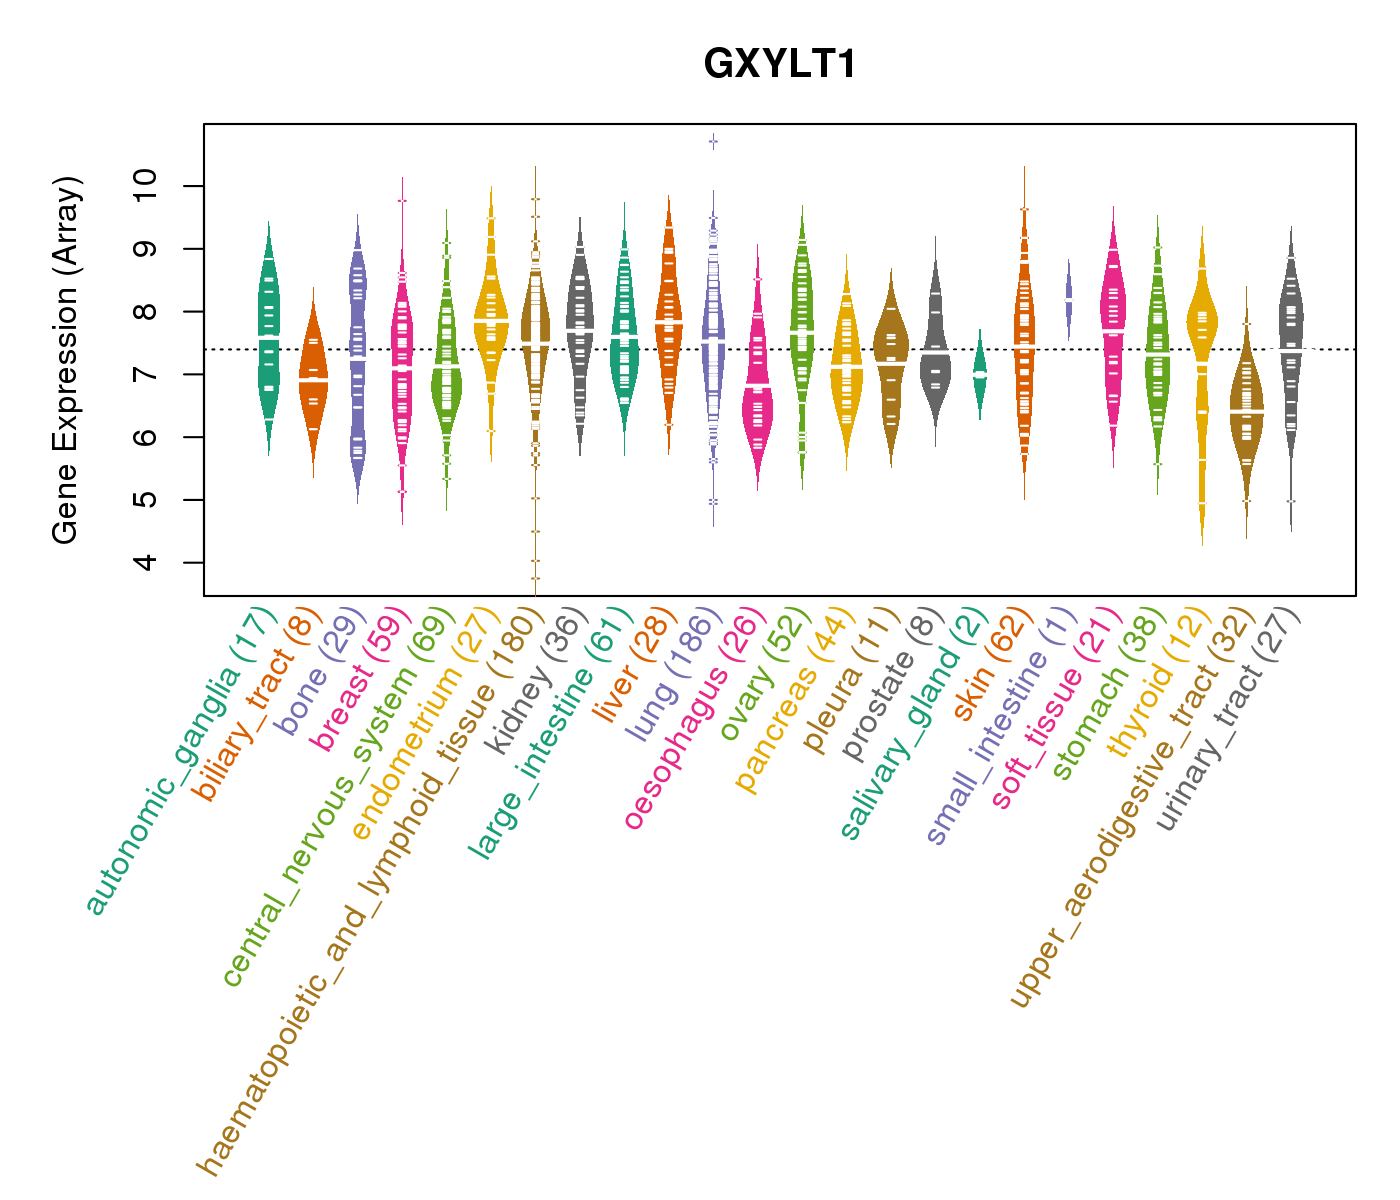
| Gene Expression for GXYLT1 |
| * CCLE gene expression data were extracted from CCLE_Expression_Entrez_2012-10-18.res: Gene-centric RMA-normalized mRNA expression data. |
 |
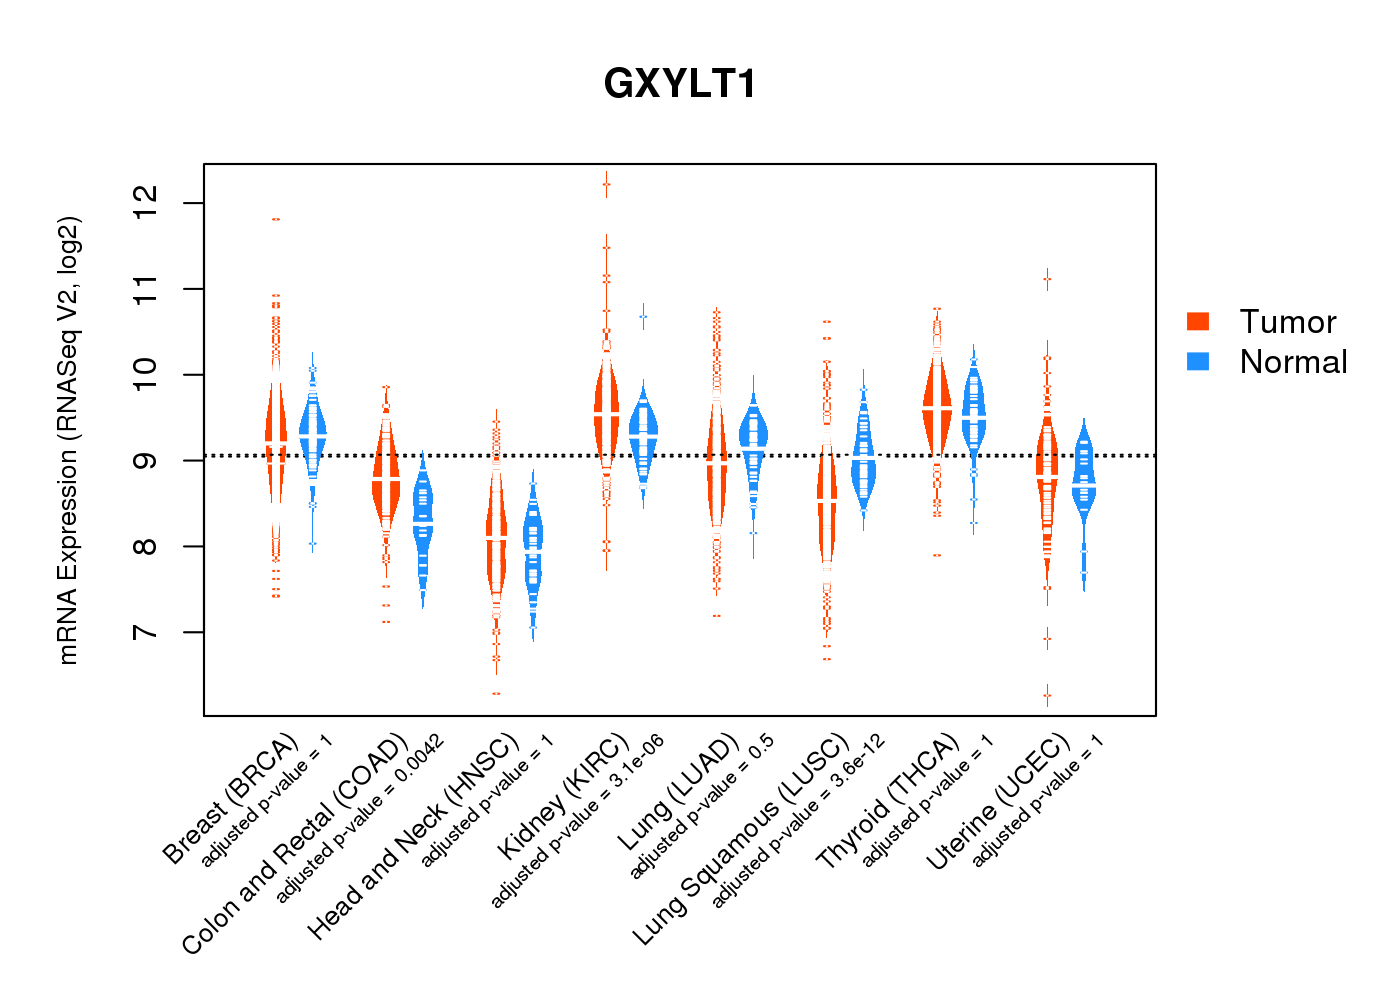
| * Normalized gene expression data of RNASeqV2 was extracted from TCGA using R package TCGA-Assembler. The URLs of all public data files on TCGA DCC data server were gathered at Jan-05-2015. Only eight cancer types have enough normal control samples for differential expression analysis. (t test, adjusted p<0.05 (using Benjamini-Hochberg FDR)) |
 |
| Top |
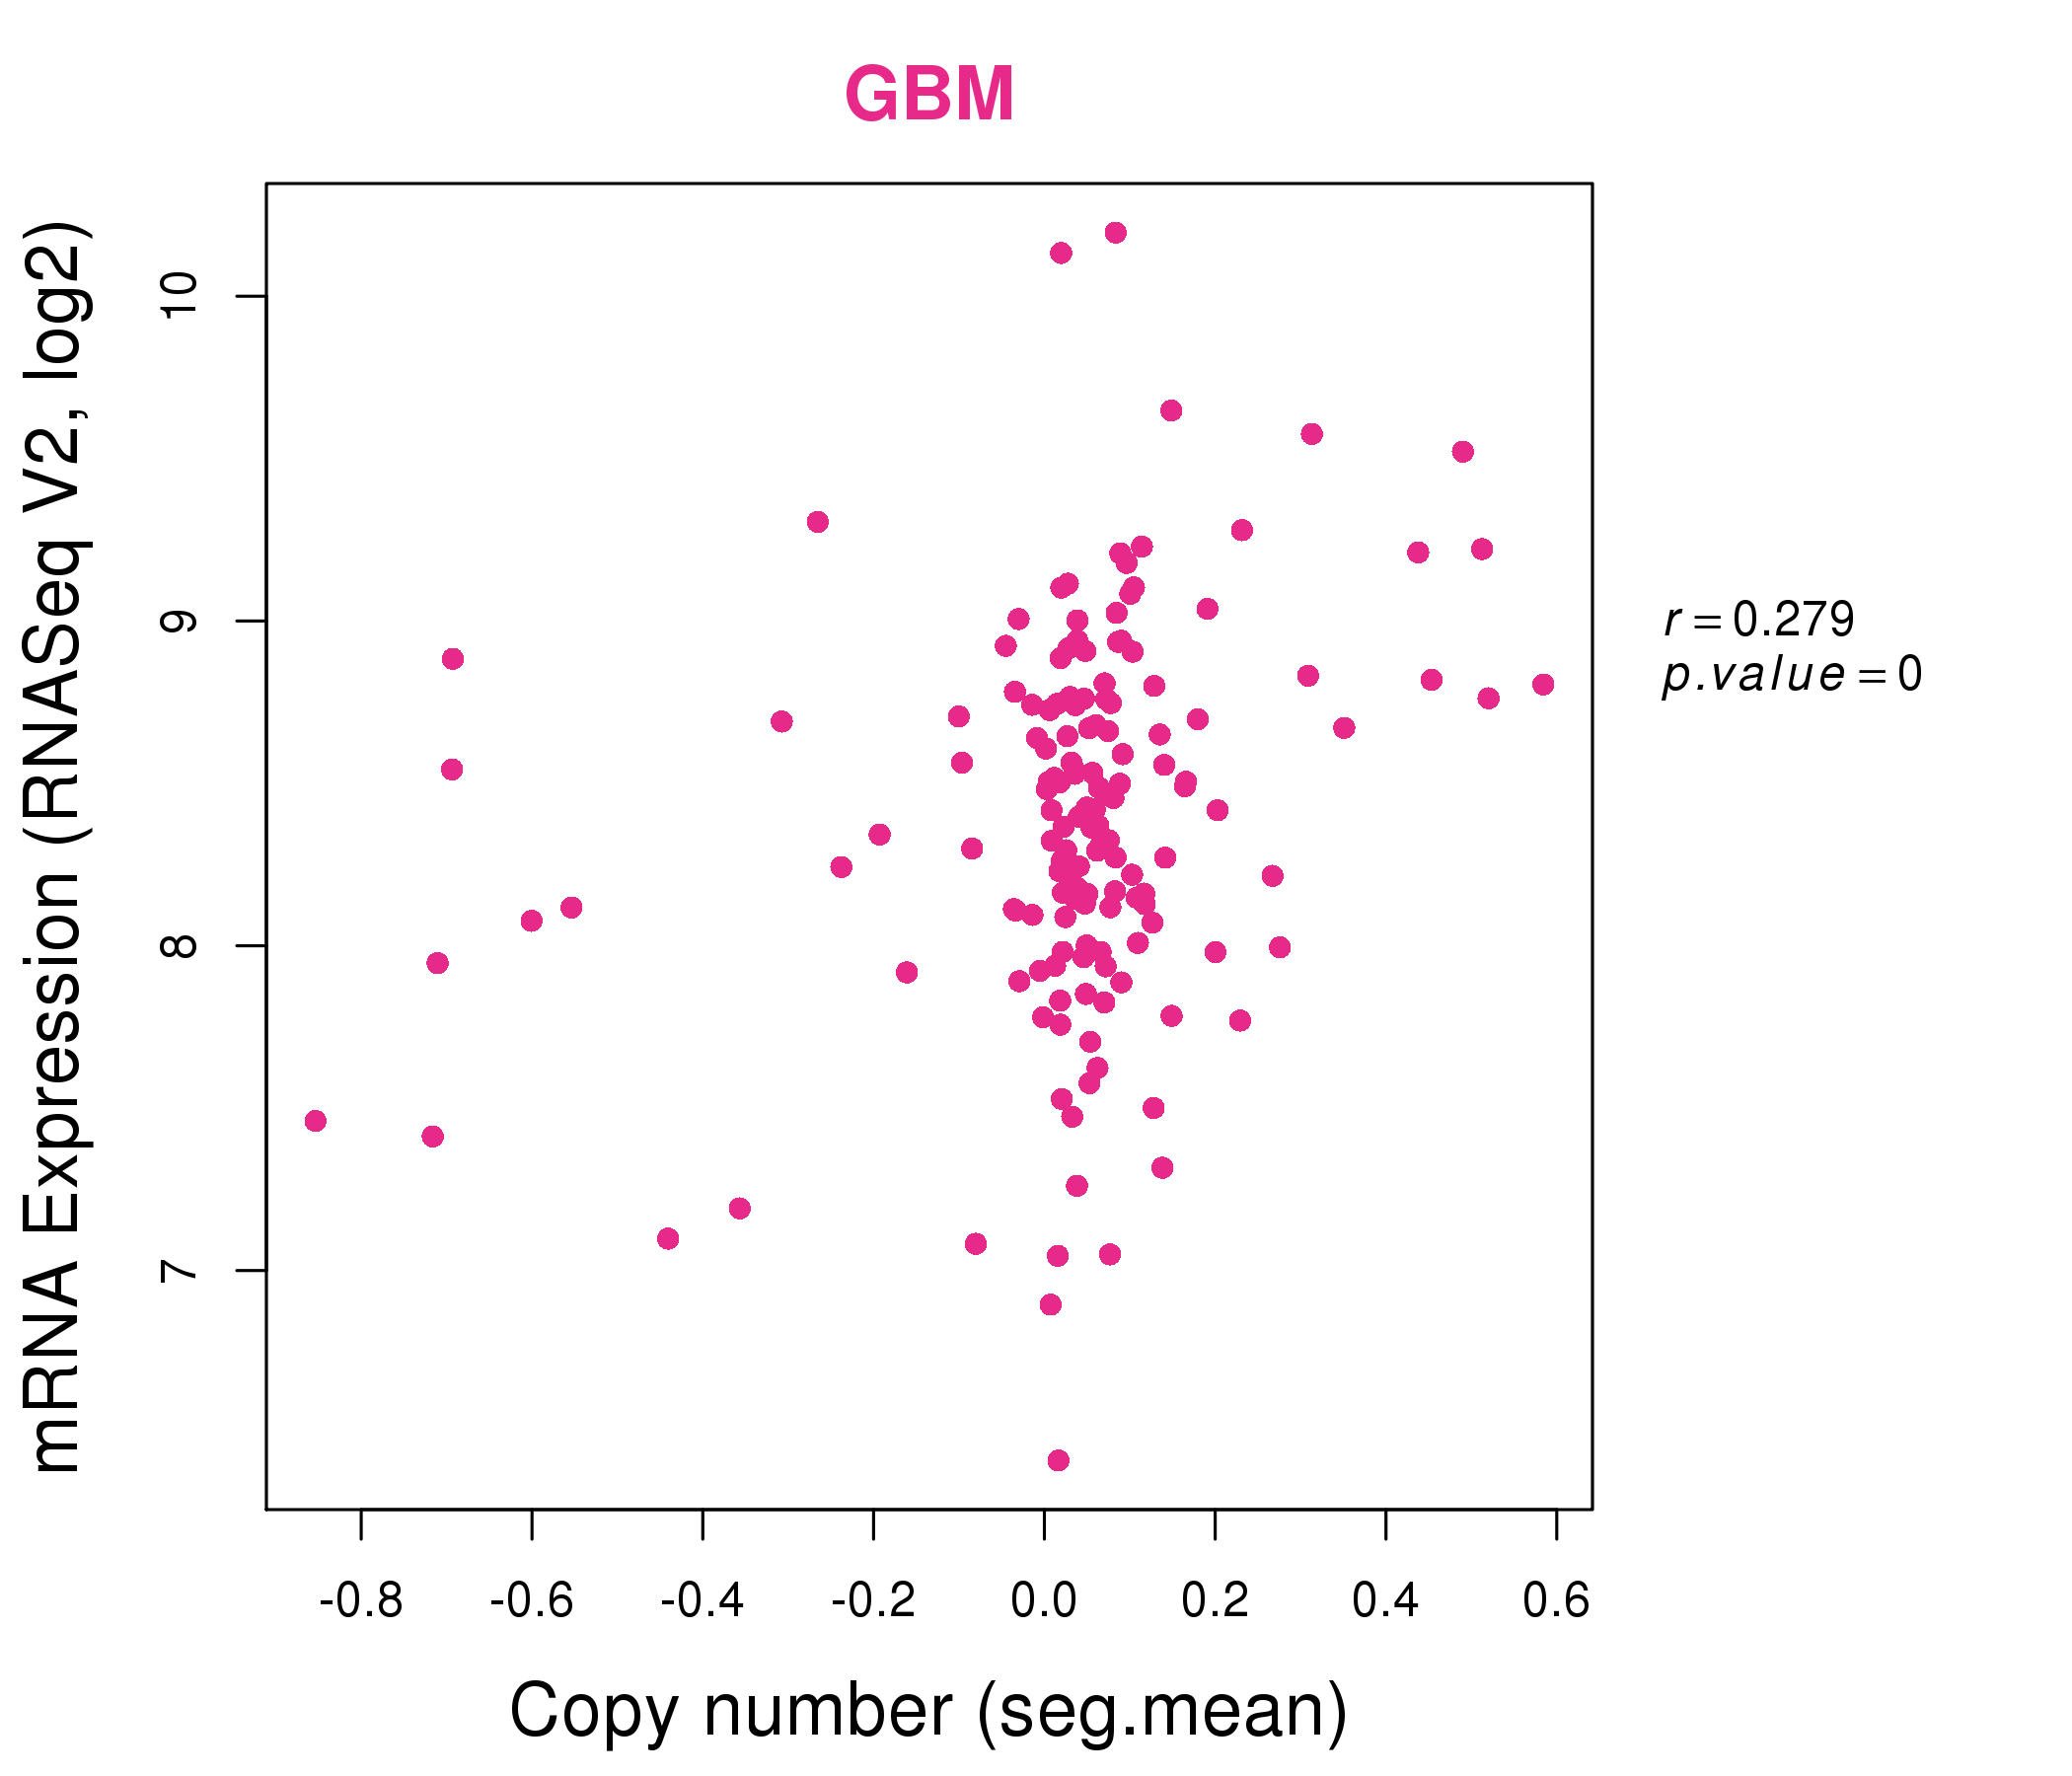
| * This plots show the correlation between CNV and gene expression. |
: Open all plots for all cancer types
 |
|
 |
|
| Top |
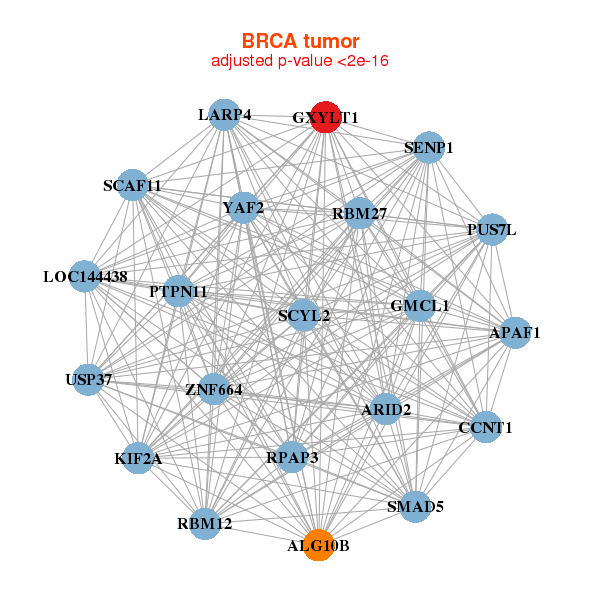
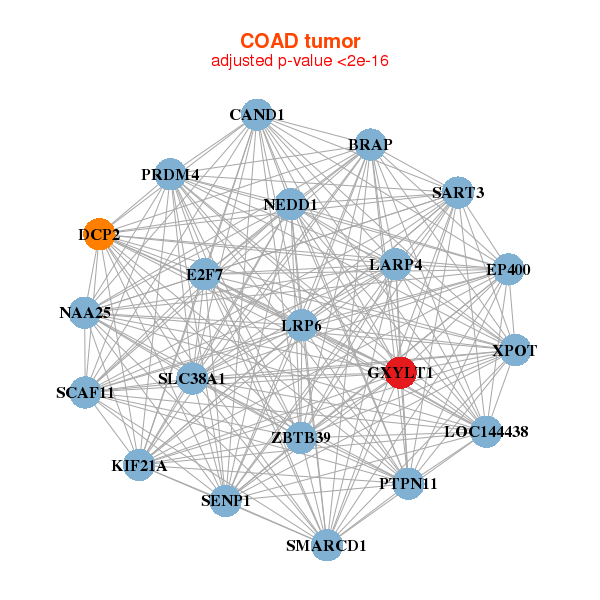
| Gene-Gene Network Information |
| * Co-Expression network figures were drawn using R package igraph. Only the top 20 genes with the highest correlations were shown. Red circle: input gene, orange circle: cell metabolism gene, sky circle: other gene |
: Open all plots for all cancer types
 |
|
| ALG10B,APAF1,ARID2,CCNT1,GMCL1,GXYLT1,KIF2A, LARP4,LOC144438,PTPN11,PUS7L,RBM12,RBM27,RPAP3, SCYL2,SENP1,SCAF11,SMAD5,USP37,YAF2,ZNF664 | ACAP2,FAM208A,C5orf24,C5orf51,CREB1,DICER1,DNAJB14, DPY19L4,GXYLT1,LRRC58,OSBPL8,PHC3,RAB11FIP2,RAB3GAP2, SCAF11,SIKE1,SMAD5,SMCHD1,TRPM7,ZC3H11A,ZNF451 |
 |
|
| BRAP,CAND1,DCP2,E2F7,EP400,GXYLT1,KIF21A, LARP4,LOC144438,LRP6,NAA25,NEDD1,PRDM4,PTPN11, SART3,SENP1,SCAF11,SLC38A1,SMARCD1,XPOT,ZBTB39 | ABLIM1,ATAD2B,ATXN7,PRRC2C,CHD7,DOPEY1,GOLGA4, GOLGB1,GXYLT1,LOC151009,MARCH6,MLLT4,PCLO,PTPRK, RALGAPB,ROCK2,SCAF4,SLTM,SMG1,TMEM181,ZCCHC6 |

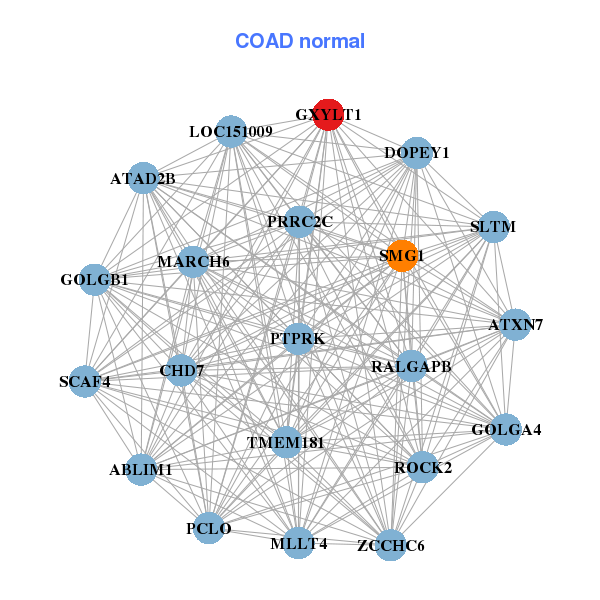
| * Co-Expression network figures were drawn using R package igraph. Only the top 20 genes with the highest correlations were shown. Red circle: input gene, orange circle: cell metabolism gene, sky circle: other gene |
: Open all plots for all cancer types
| Top |
: Open all interacting genes' information including KEGG pathway for all interacting genes from DAVID
| Top |
| Pharmacological Information for GXYLT1 |
| There's no related Drug. |
| Top |
| Cross referenced IDs for GXYLT1 |
| * We obtained these cross-references from Uniprot database. It covers 150 different DBs, 18 categories. http://www.uniprot.org/help/cross_references_section |
: Open all cross reference information
|
Copyright © 2016-Present - The Univsersity of Texas Health Science Center at Houston @ |