|
||||||||||||||||||||
| |
| Phenotypic Information (metabolism pathway, cancer, disease, phenome) |
| |
| |
| Gene-Gene Network Information: Co-Expression Network, Interacting Genes & KEGG |
| |
|


| Gene Summary for PLA2G4D |
| Top |
| Phenotypic Information for PLA2G4D(metabolism pathway, cancer, disease, phenome) |
| Cancer | CGAP: PLA2G4D |
| Familial Cancer Database: PLA2G4D | |
| * This gene is included in those cancer gene databases. |
|
|
|
|
|
|
| ||||||||||||||
Oncogene 1 | Significant driver gene in | |||||||||||||||||||
| cf) number; DB name 1 Oncogene; http://nar.oxfordjournals.org/content/35/suppl_1/D721.long, 2 Tumor Suppressor gene; https://bioinfo.uth.edu/TSGene/, 3 Cancer Gene Census; http://www.nature.com/nrc/journal/v4/n3/abs/nrc1299.html, 4 CancerGenes; http://nar.oxfordjournals.org/content/35/suppl_1/D721.long, 5 Network of Cancer Gene; http://ncg.kcl.ac.uk/index.php, 1Therapeutic Vulnerabilities in Cancer; http://cbio.mskcc.org/cancergenomics/statius/ |
| KEGG_FC_GAMMA_R_MEDIATED_PHAGOCYTOSIS REACTOME_PHOSPHOLIPID_METABOLISM REACTOME_METABOLISM_OF_LIPIDS_AND_LIPOPROTEINS | |
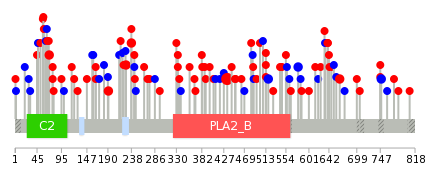
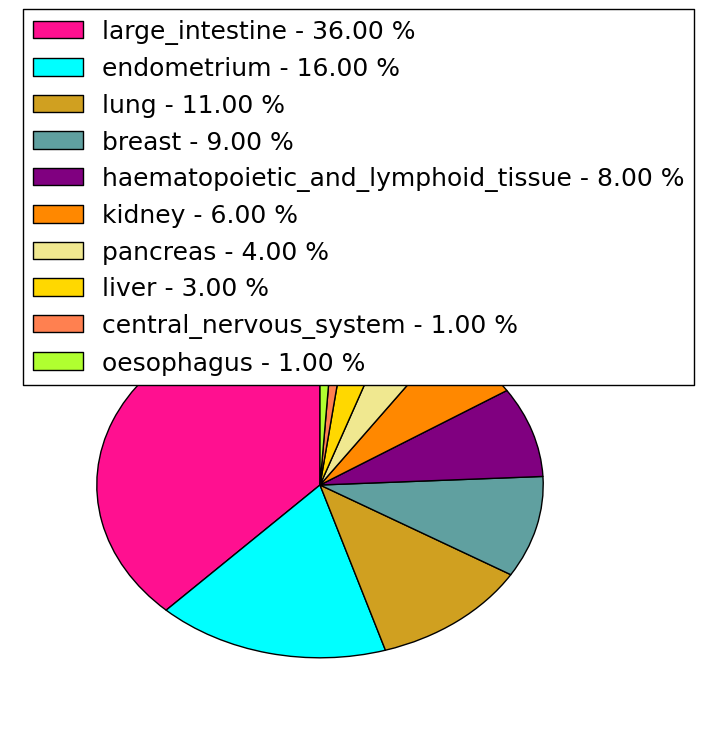
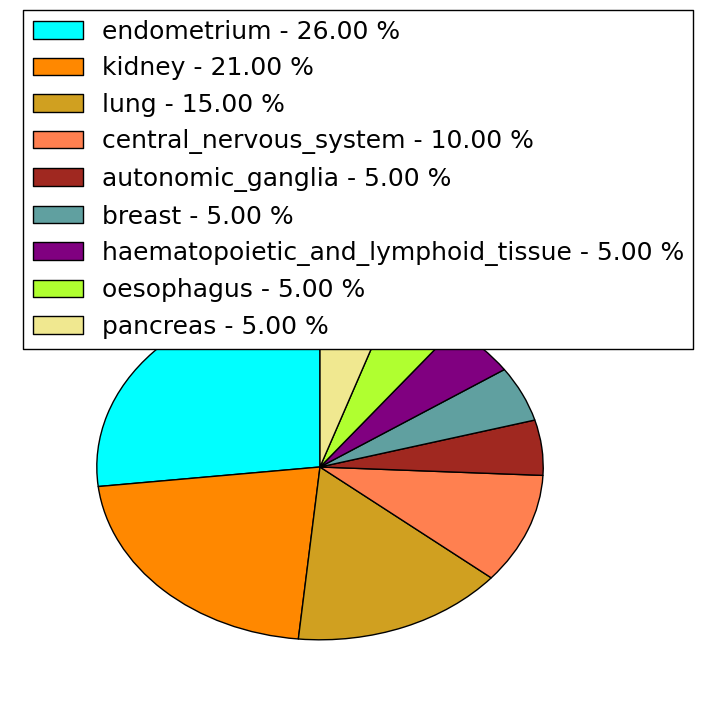
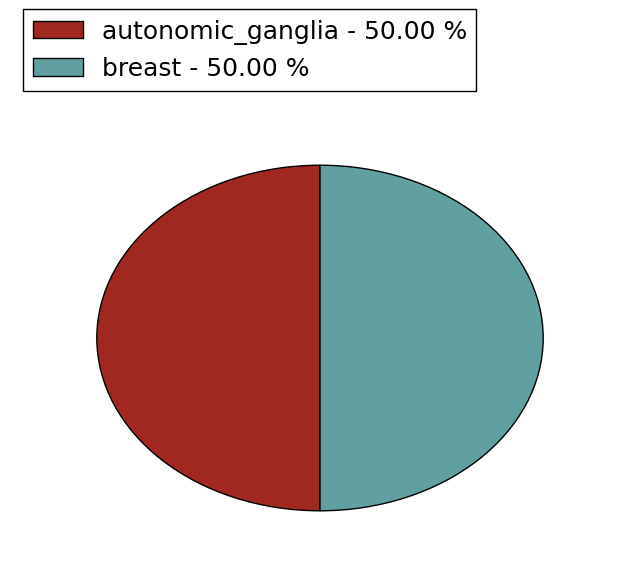
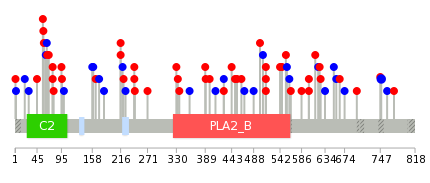
| Mutations for PLA2G4D |
| * Under tables are showing count per each tissue to give us broad intuition about tissue specific mutation patterns.You can go to the detailed page for each mutation database's web site. |
| There's no structural variation information in COSMIC data for this gene. |
| * From mRNA Sanger sequences, Chitars2.0 arranged chimeric transcripts. This table shows PLA2G4D related fusion information. |
| ID | Head Gene | Tail Gene | Accession | Gene_a | qStart_a | qEnd_a | Chromosome_a | tStart_a | tEnd_a | Gene_a | qStart_a | qEnd_a | Chromosome_a | tStart_a | tEnd_a |
| Top |
| There's no copy number variation information in COSMIC data for this gene. |
| Top |
|
 |
| Top |
| Stat. for Non-Synonymous SNVs (# total SNVs=61) | (# total SNVs=19) |
 |  |
(# total SNVs=2) | (# total SNVs=0) |
 |
| Top |
| * When you move the cursor on each content, you can see more deailed mutation information on the Tooltip. Those are primary_site,primary_histology,mutation(aa),pubmedID. |
| GRCh37 position | Mutation(aa) | Unique sampleID count |
| chr15:42371752-42371752 | p.S434T | 8 |
| chr15:42375496-42375496 | p.G191E | 2 |
| chr15:42363462-42363462 | p.L579L | 2 |
| chr15:42363991-42363991 | p.P518P | 2 |
| chr15:42373291-42373291 | p.R333Q | 2 |
| chr15:42377688-42377688 | p.? | 2 |
| chr15:42374547-42374547 | p.G238A | 2 |
| chr15:42374580-42374580 | p.R227K | 2 |
| chr15:42362967-42362967 | p.R664L | 2 |
| chr15:42361123-42361123 | p.P749P | 2 |
| Top |
|
 |
| Point Mutation/ Tissue ID | 1 | 2 | 3 | 4 | 5 | 6 | 7 | 8 | 9 | 10 | 11 | 12 | 13 | 14 | 15 | 16 | 17 | 18 | 19 | 20 |
| # sample | 1 | 2 | 1 | 9 | 2 | 1 | 7 | 1 | 6 | 3 | 1 | 17 | 4 | 12 | ||||||
| # mutation | 1 | 2 | 1 | 9 | 2 | 1 | 7 | 1 | 6 | 3 | 1 | 22 | 4 | 15 | ||||||
| nonsynonymous SNV | 1 | 2 | 1 | 9 | 1 | 1 | 3 | 1 | 6 | 1 | 10 | 2 | 10 | |||||||
| synonymous SNV | 1 | 4 | 3 | 12 | 2 | 5 |
| cf) Tissue ID; Tissue type (1; BLCA[Bladder Urothelial Carcinoma], 2; BRCA[Breast invasive carcinoma], 3; CESC[Cervical squamous cell carcinoma and endocervical adenocarcinoma], 4; COAD[Colon adenocarcinoma], 5; GBM[Glioblastoma multiforme], 6; Glioma Low Grade, 7; HNSC[Head and Neck squamous cell carcinoma], 8; KICH[Kidney Chromophobe], 9; KIRC[Kidney renal clear cell carcinoma], 10; KIRP[Kidney renal papillary cell carcinoma], 11; LAML[Acute Myeloid Leukemia], 12; LUAD[Lung adenocarcinoma], 13; LUSC[Lung squamous cell carcinoma], 14; OV[Ovarian serous cystadenocarcinoma ], 15; PAAD[Pancreatic adenocarcinoma], 16; PRAD[Prostate adenocarcinoma], 17; SKCM[Skin Cutaneous Melanoma], 18:STAD[Stomach adenocarcinoma], 19:THCA[Thyroid carcinoma], 20:UCEC[Uterine Corpus Endometrial Carcinoma]) |
| Top |
| * We represented just top 10 SNVs. When you move the cursor on each content, you can see more deailed mutation information on the Tooltip. Those are primary_site, primary_histology, mutation(aa), pubmedID. |
| Genomic Position | Mutation(aa) | Unique sampleID count |
| chr15:42361123 | p.P749P | 2 |
| chr15:42374005 | p.S226S | 1 |
| chr15:42363337 | p.H69Y | 1 |
| chr15:42375956 | p.E775K | 1 |
| chr15:42364006 | p.A586V | 1 |
| chr15:42379558 | p.A450V | 1 |
| chr15:42371771 | p.Q443H | 1 |
| chr15:42374525 | p.R222C | 1 |
| chr15:42363357 | p.D66G | 1 |
| chr15:42375969 | p.G761G | 1 |
| * Copy number data were extracted from TCGA using R package TCGA-Assembler. The URLs of all public data files on TCGA DCC data server were gathered on Jan-05-2015. Function ProcessCNAData in TCGA-Assembler package was used to obtain gene-level copy number value which is calculated as the average copy number of the genomic region of a gene. |
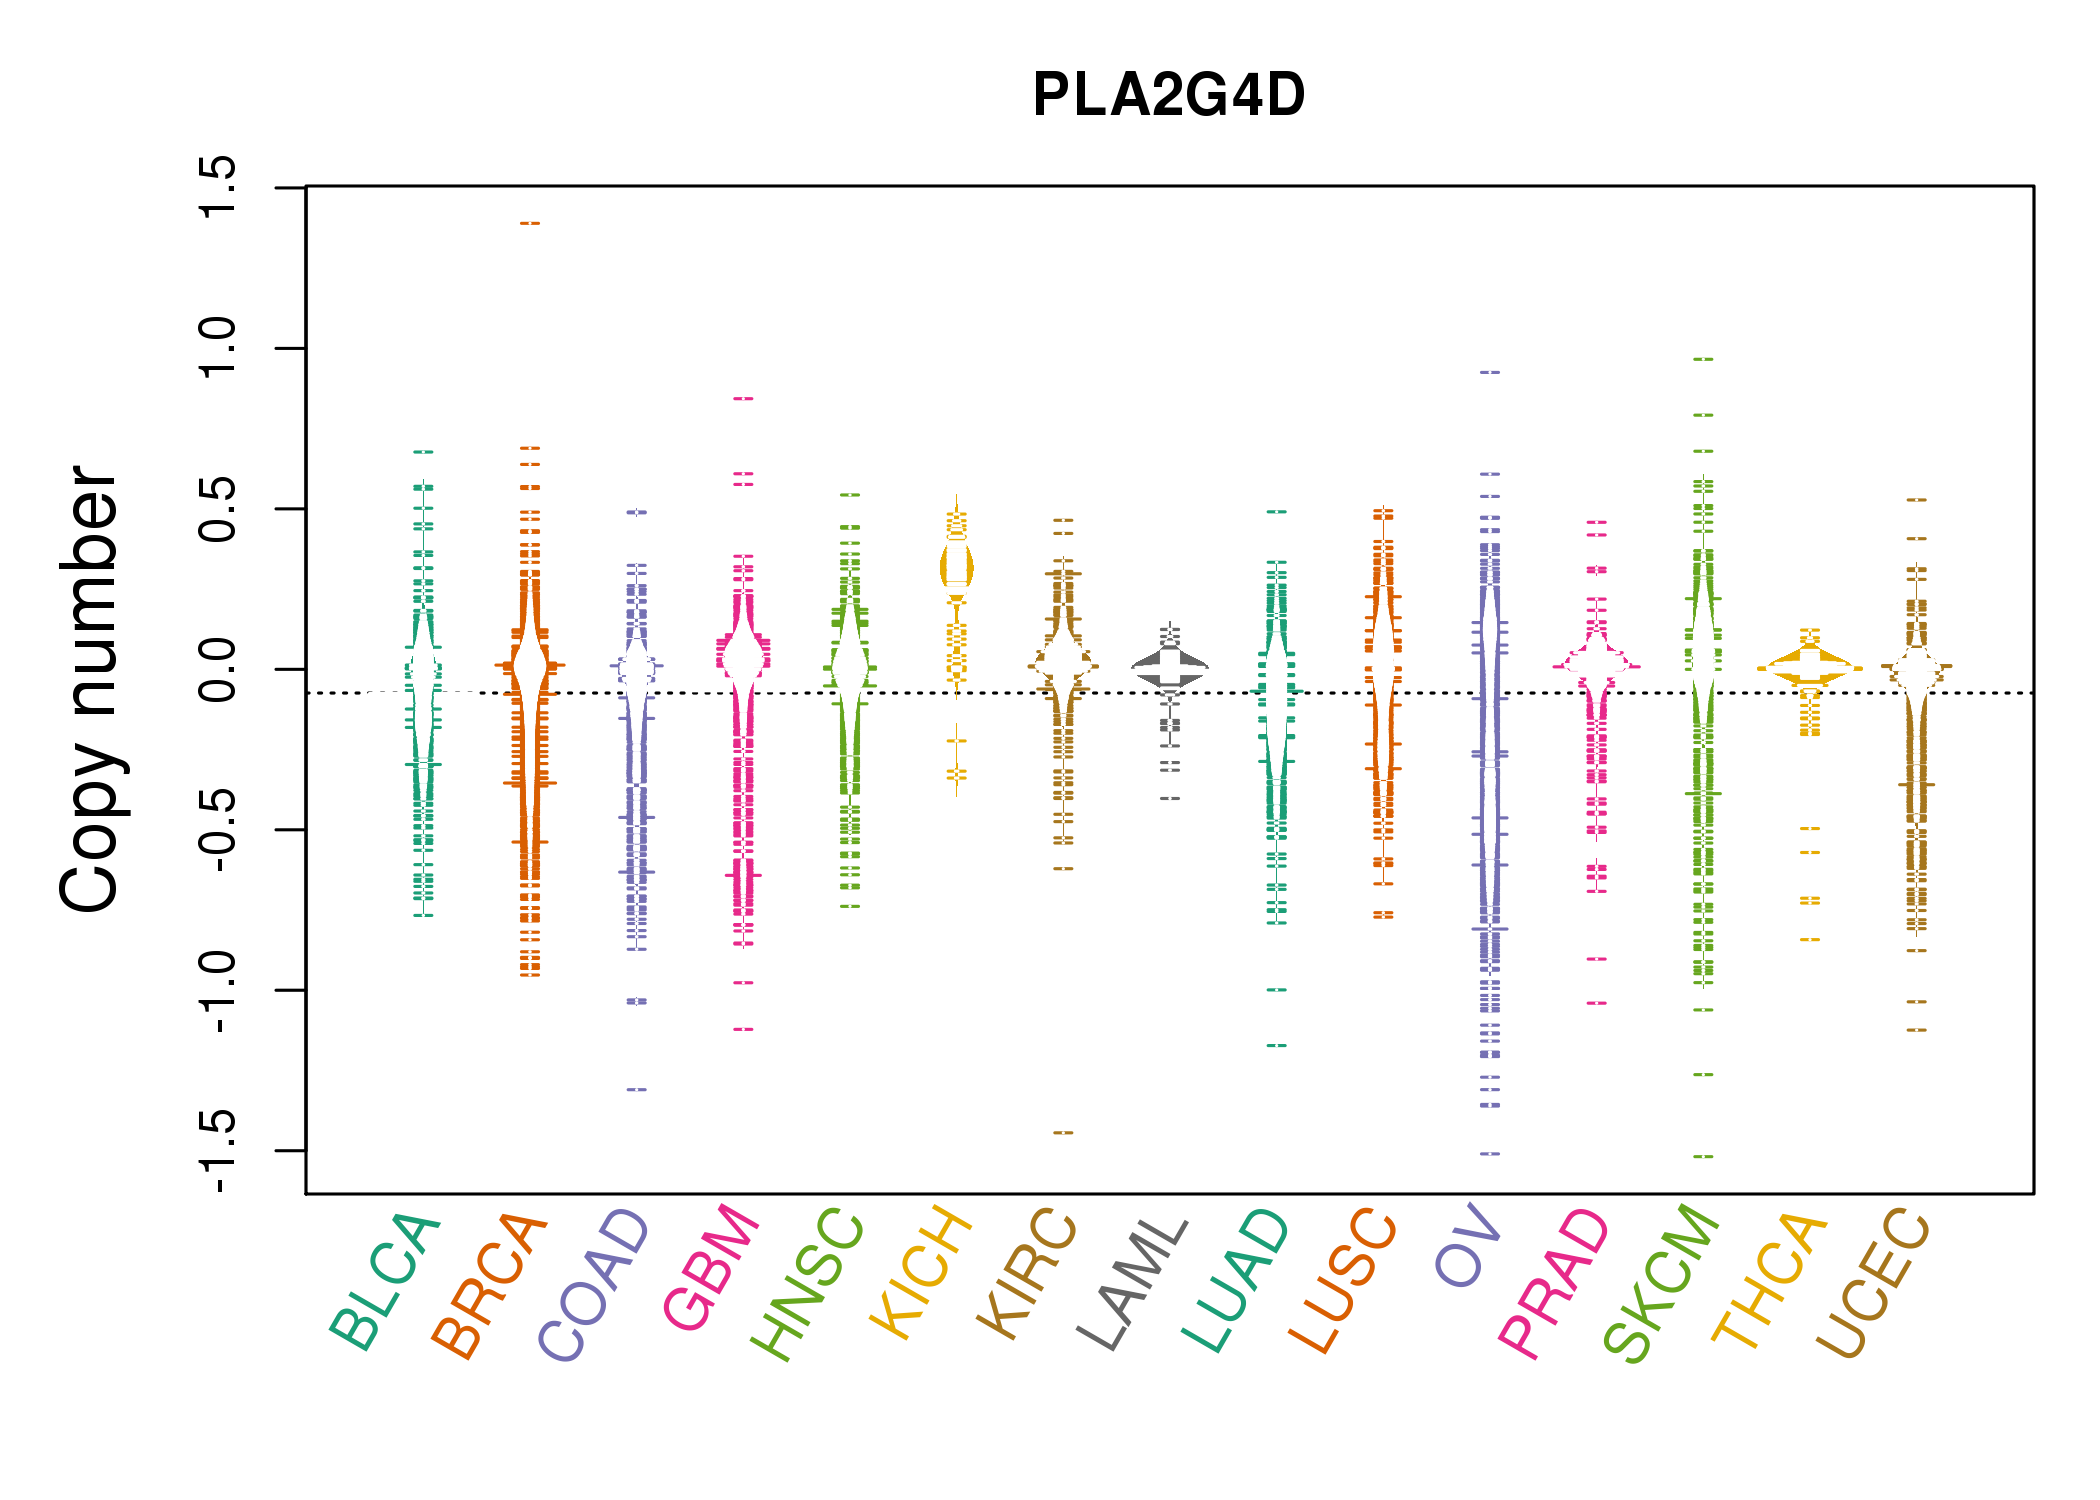 |
| cf) Tissue ID[Tissue type]: BLCA[Bladder Urothelial Carcinoma], BRCA[Breast invasive carcinoma], CESC[Cervical squamous cell carcinoma and endocervical adenocarcinoma], COAD[Colon adenocarcinoma], GBM[Glioblastoma multiforme], Glioma Low Grade, HNSC[Head and Neck squamous cell carcinoma], KICH[Kidney Chromophobe], KIRC[Kidney renal clear cell carcinoma], KIRP[Kidney renal papillary cell carcinoma], LAML[Acute Myeloid Leukemia], LUAD[Lung adenocarcinoma], LUSC[Lung squamous cell carcinoma], OV[Ovarian serous cystadenocarcinoma ], PAAD[Pancreatic adenocarcinoma], PRAD[Prostate adenocarcinoma], SKCM[Skin Cutaneous Melanoma], STAD[Stomach adenocarcinoma], THCA[Thyroid carcinoma], UCEC[Uterine Corpus Endometrial Carcinoma] |
| Top |
| Gene Expression for PLA2G4D |
| * CCLE gene expression data were extracted from CCLE_Expression_Entrez_2012-10-18.res: Gene-centric RMA-normalized mRNA expression data. |
 |
| * Normalized gene expression data of RNASeqV2 was extracted from TCGA using R package TCGA-Assembler. The URLs of all public data files on TCGA DCC data server were gathered at Jan-05-2015. Only eight cancer types have enough normal control samples for differential expression analysis. (t test, adjusted p<0.05 (using Benjamini-Hochberg FDR)) |
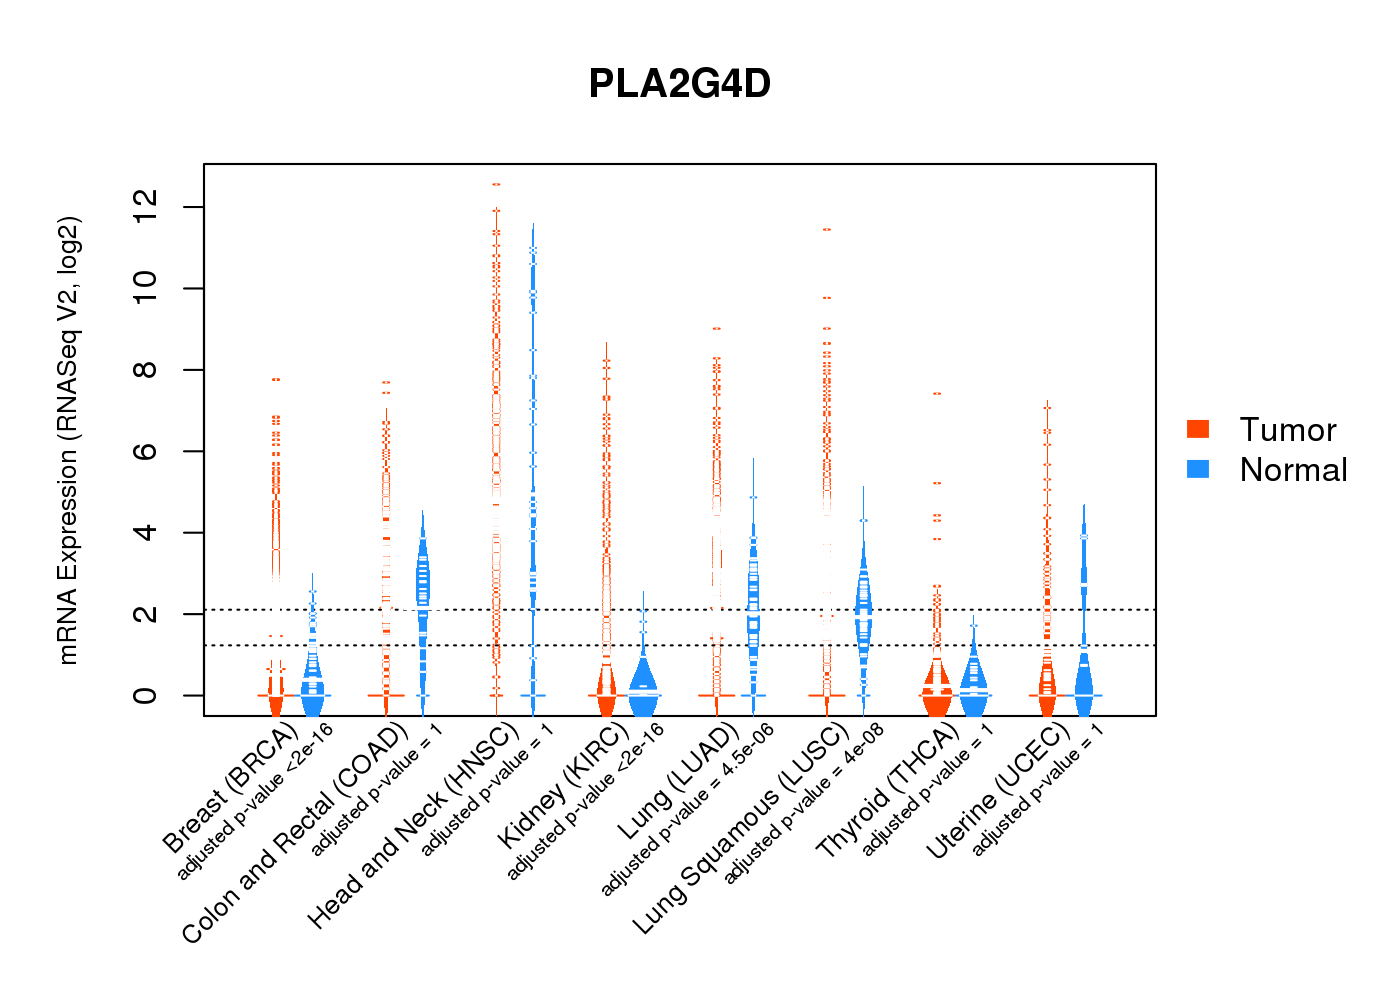 |
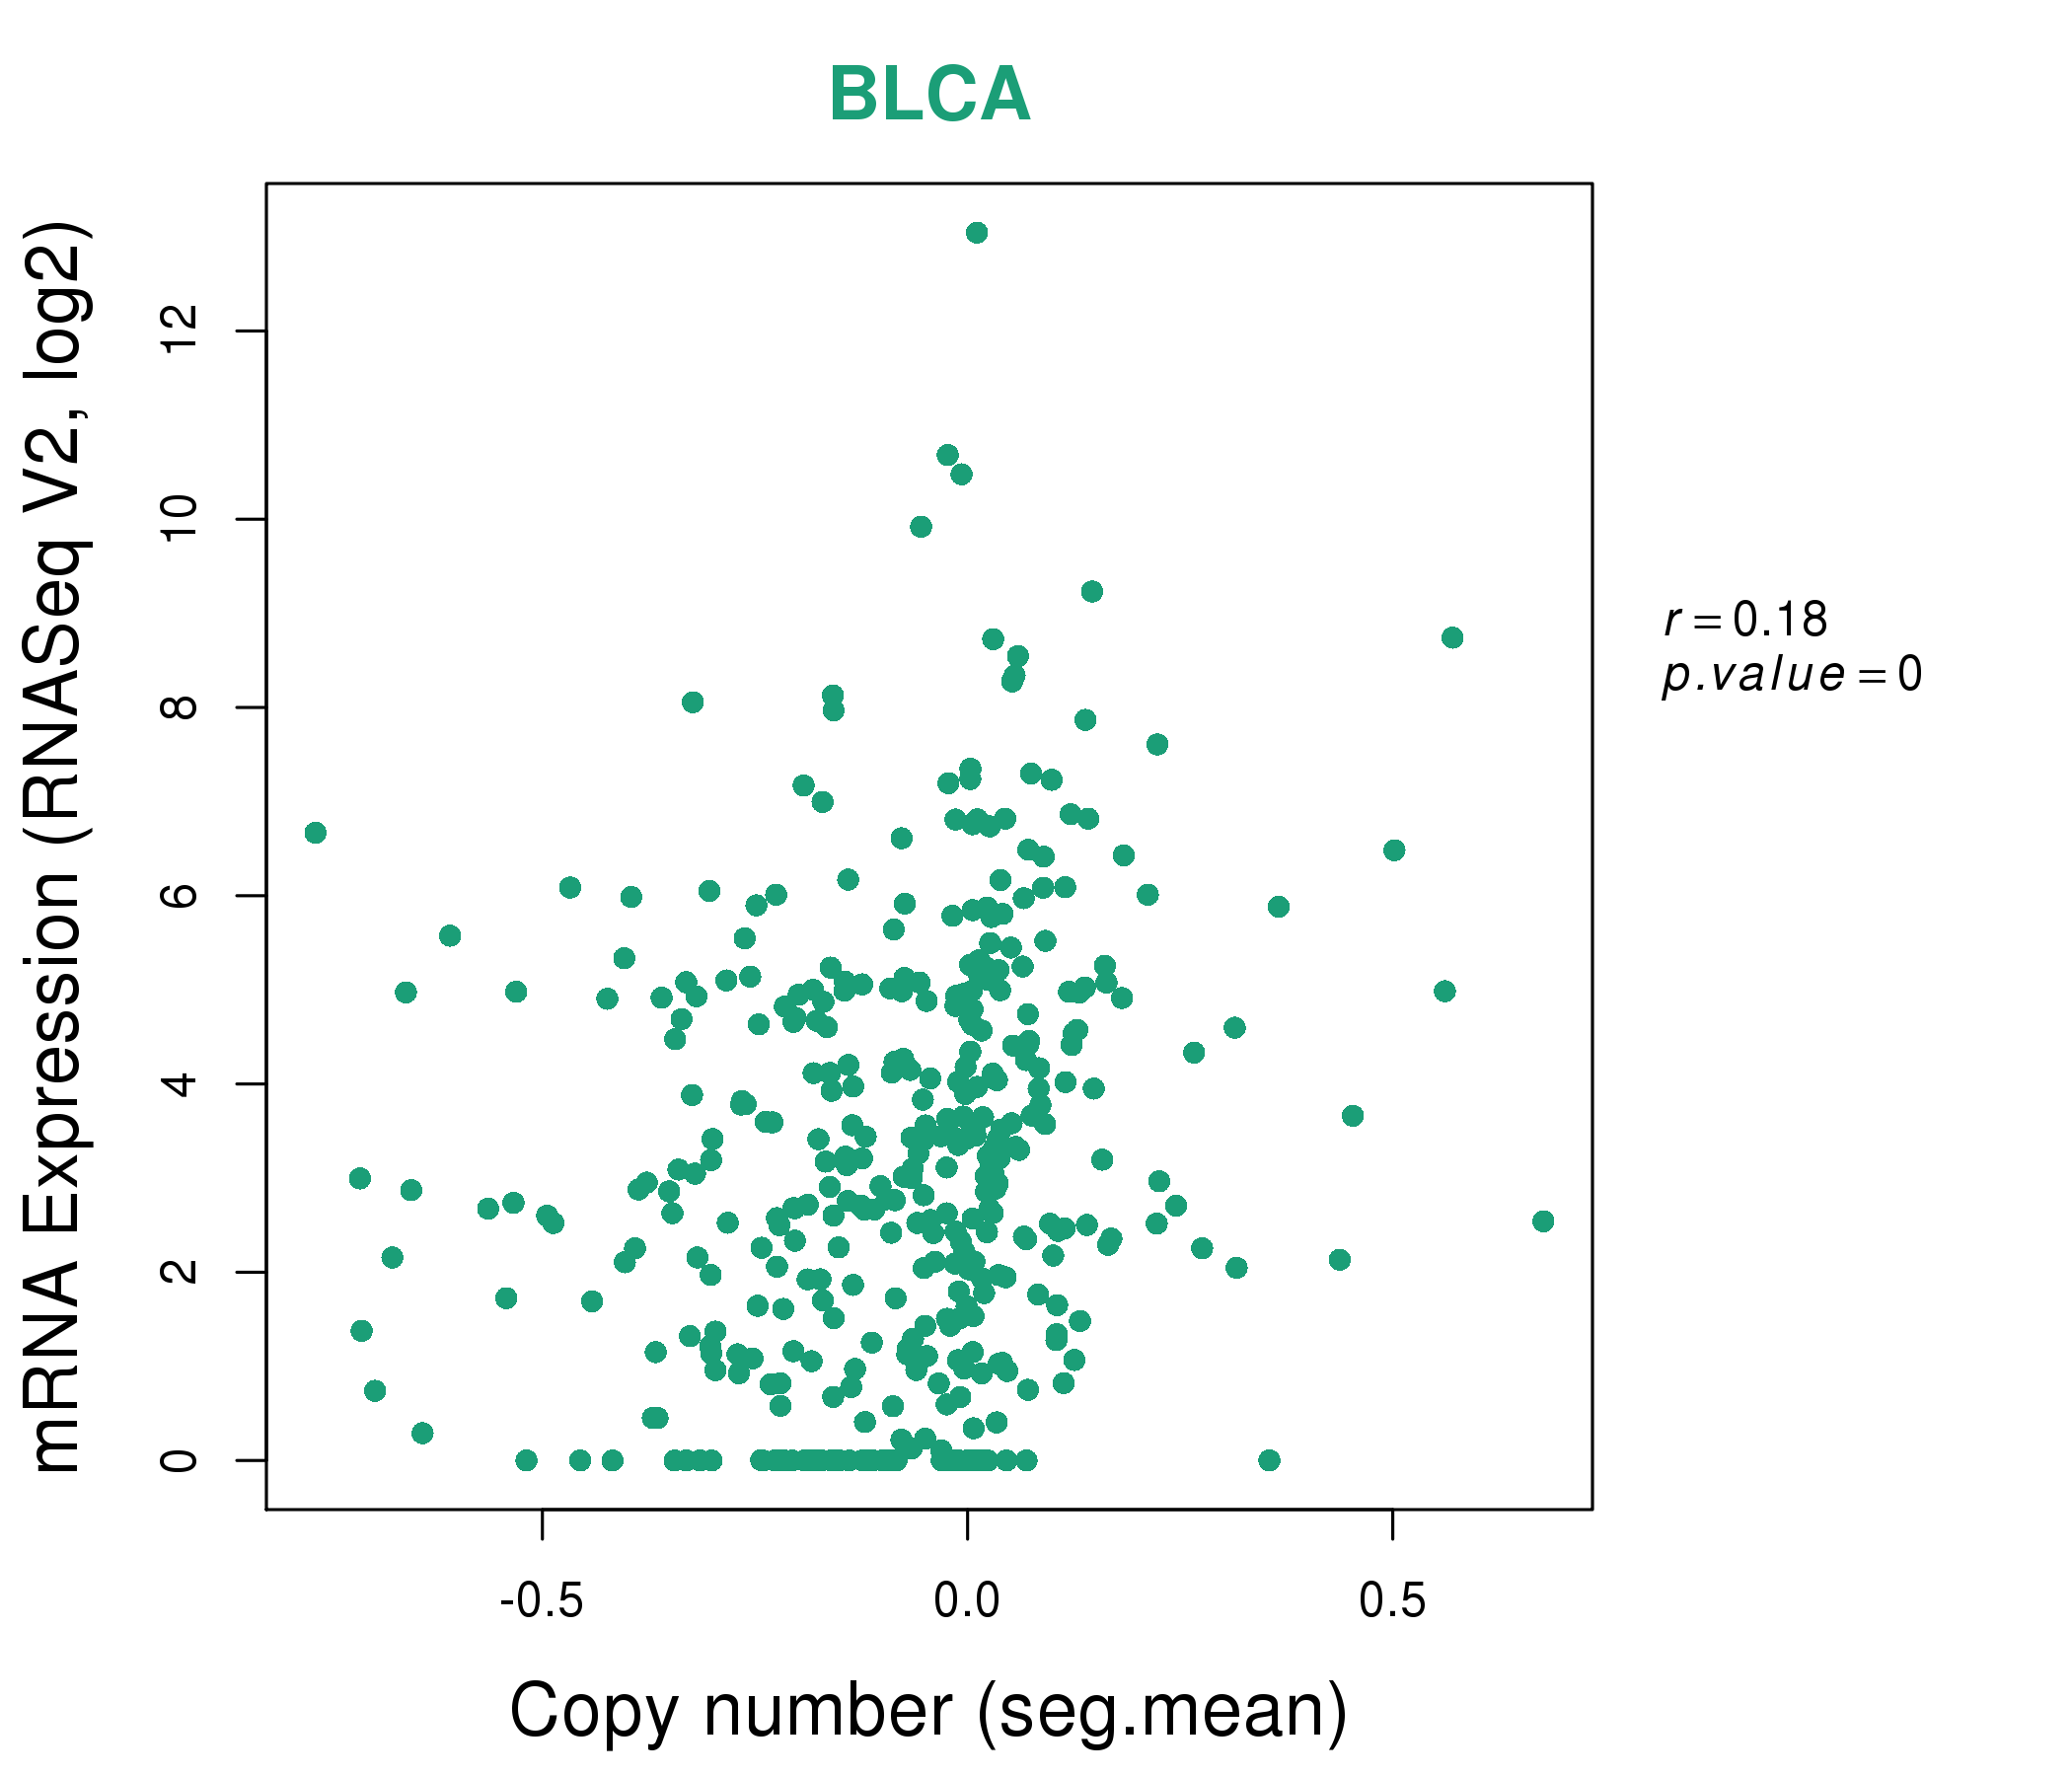
| Top |
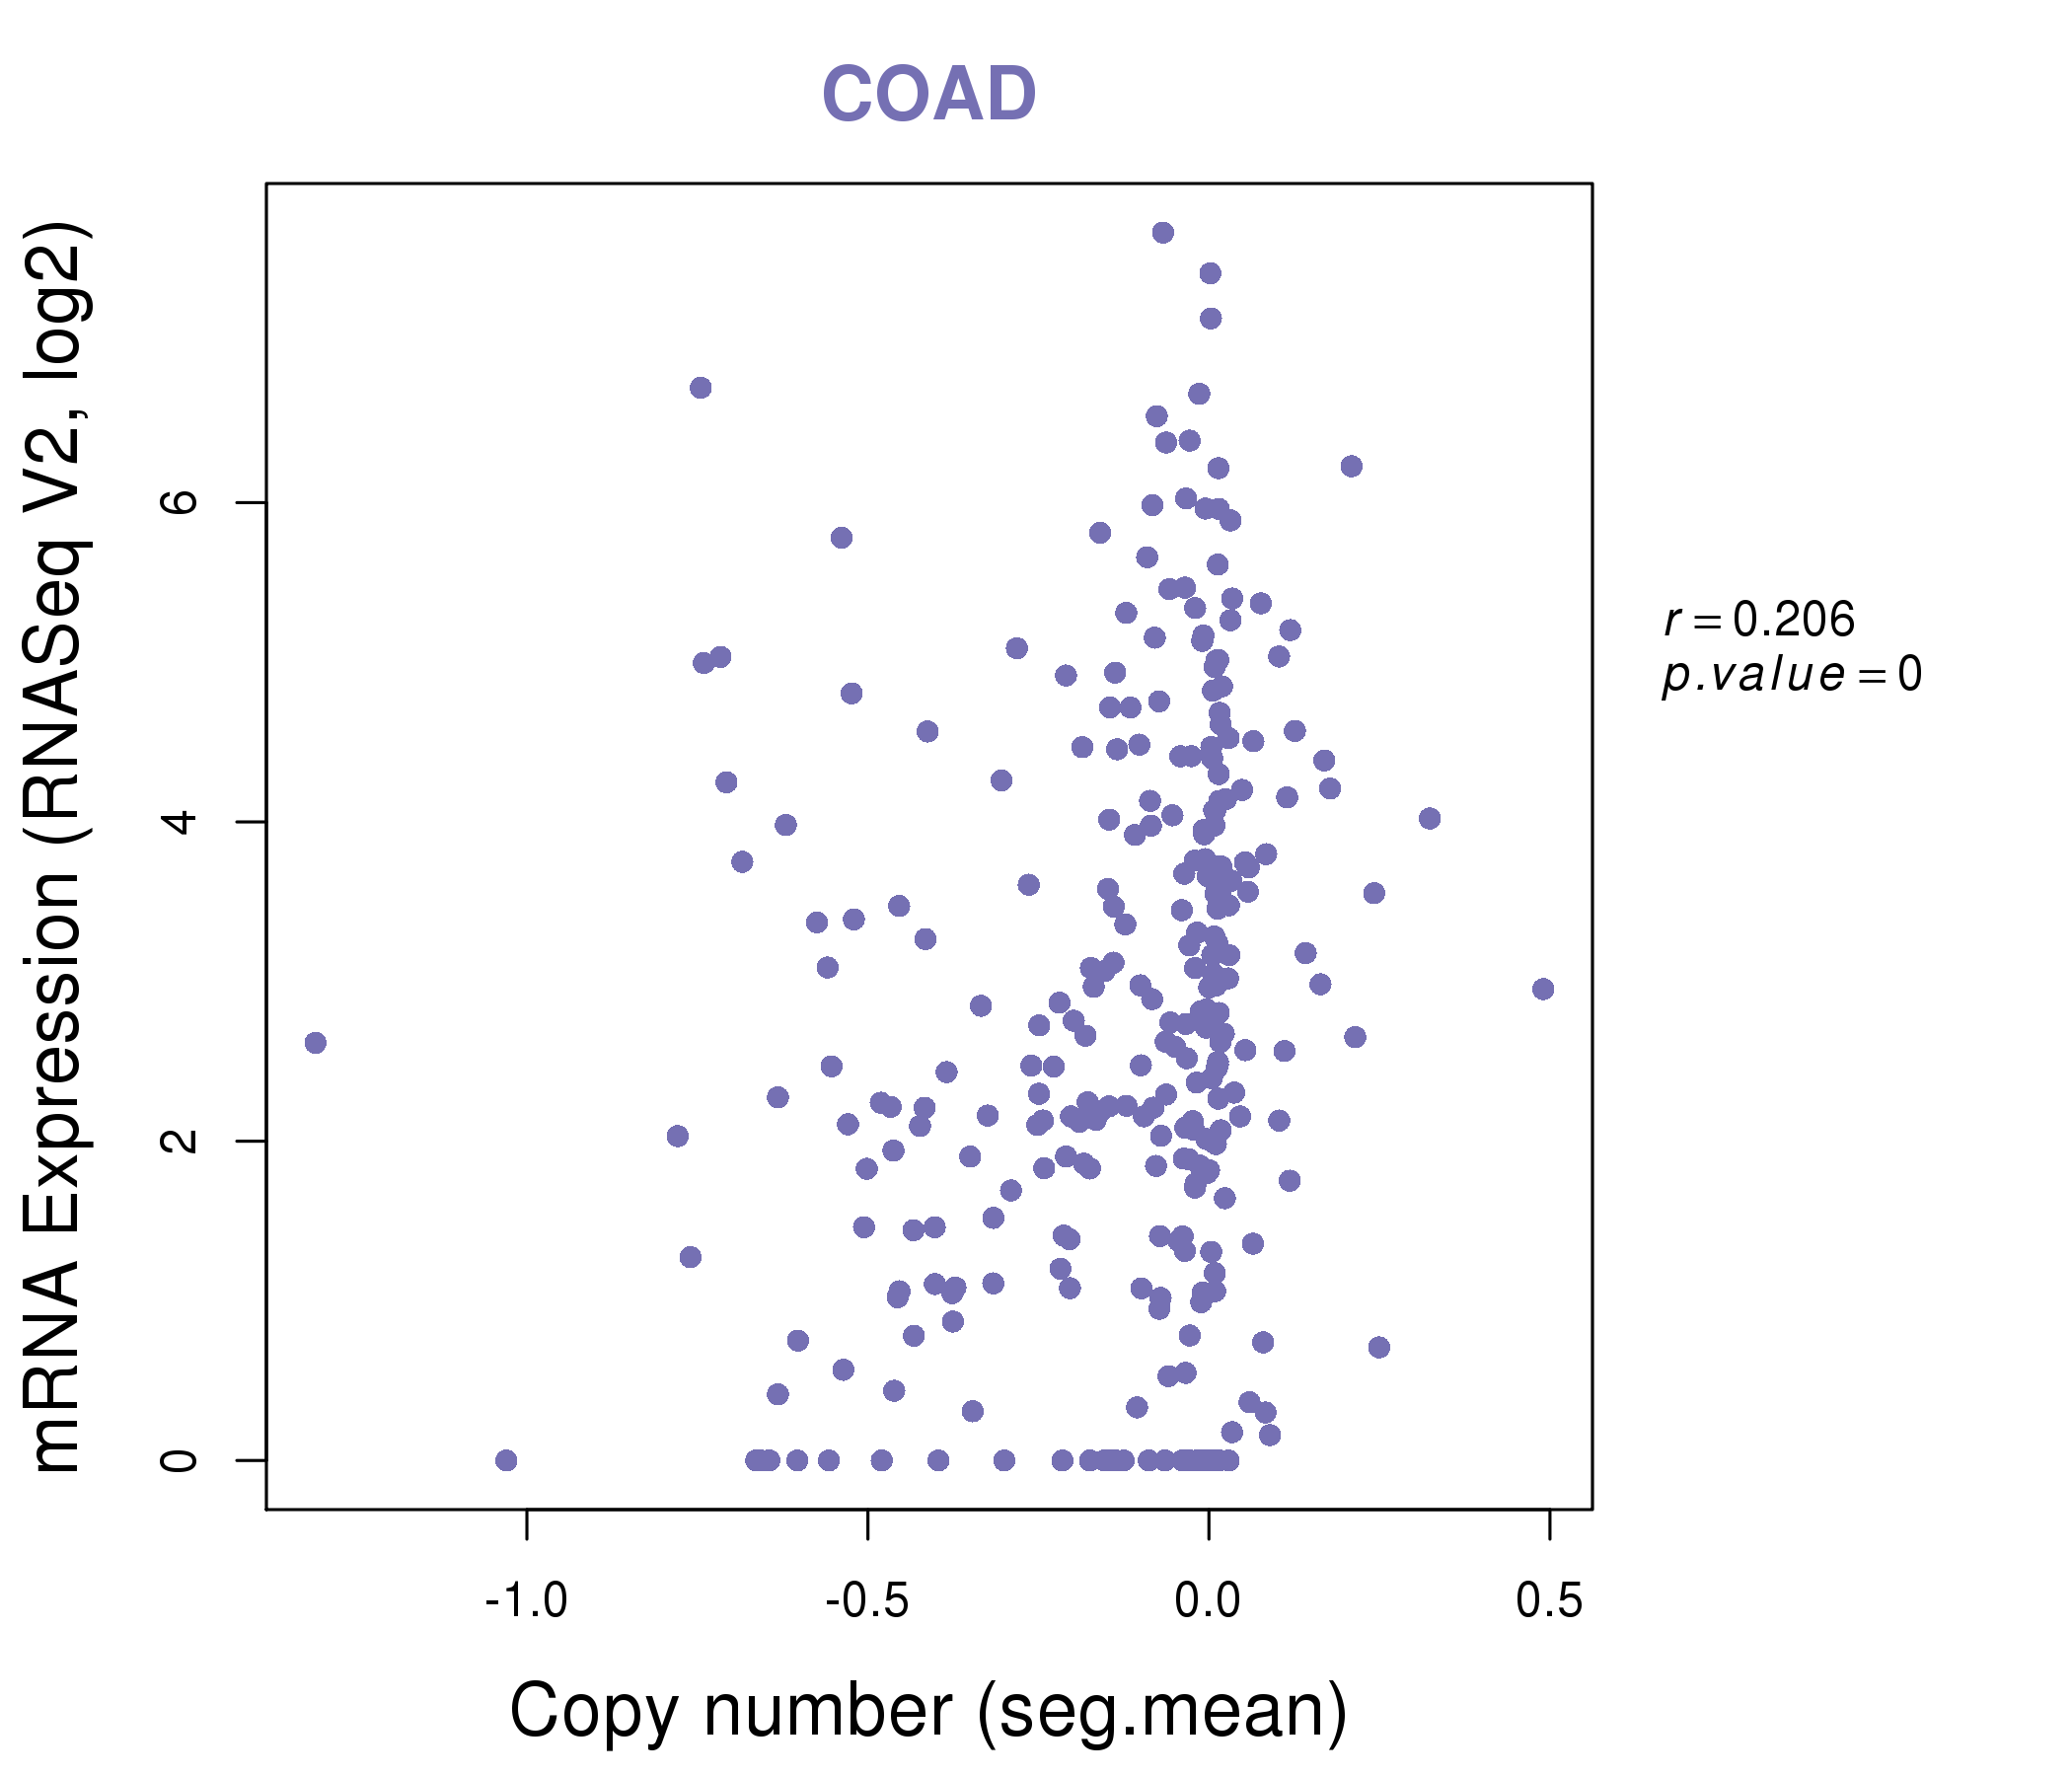
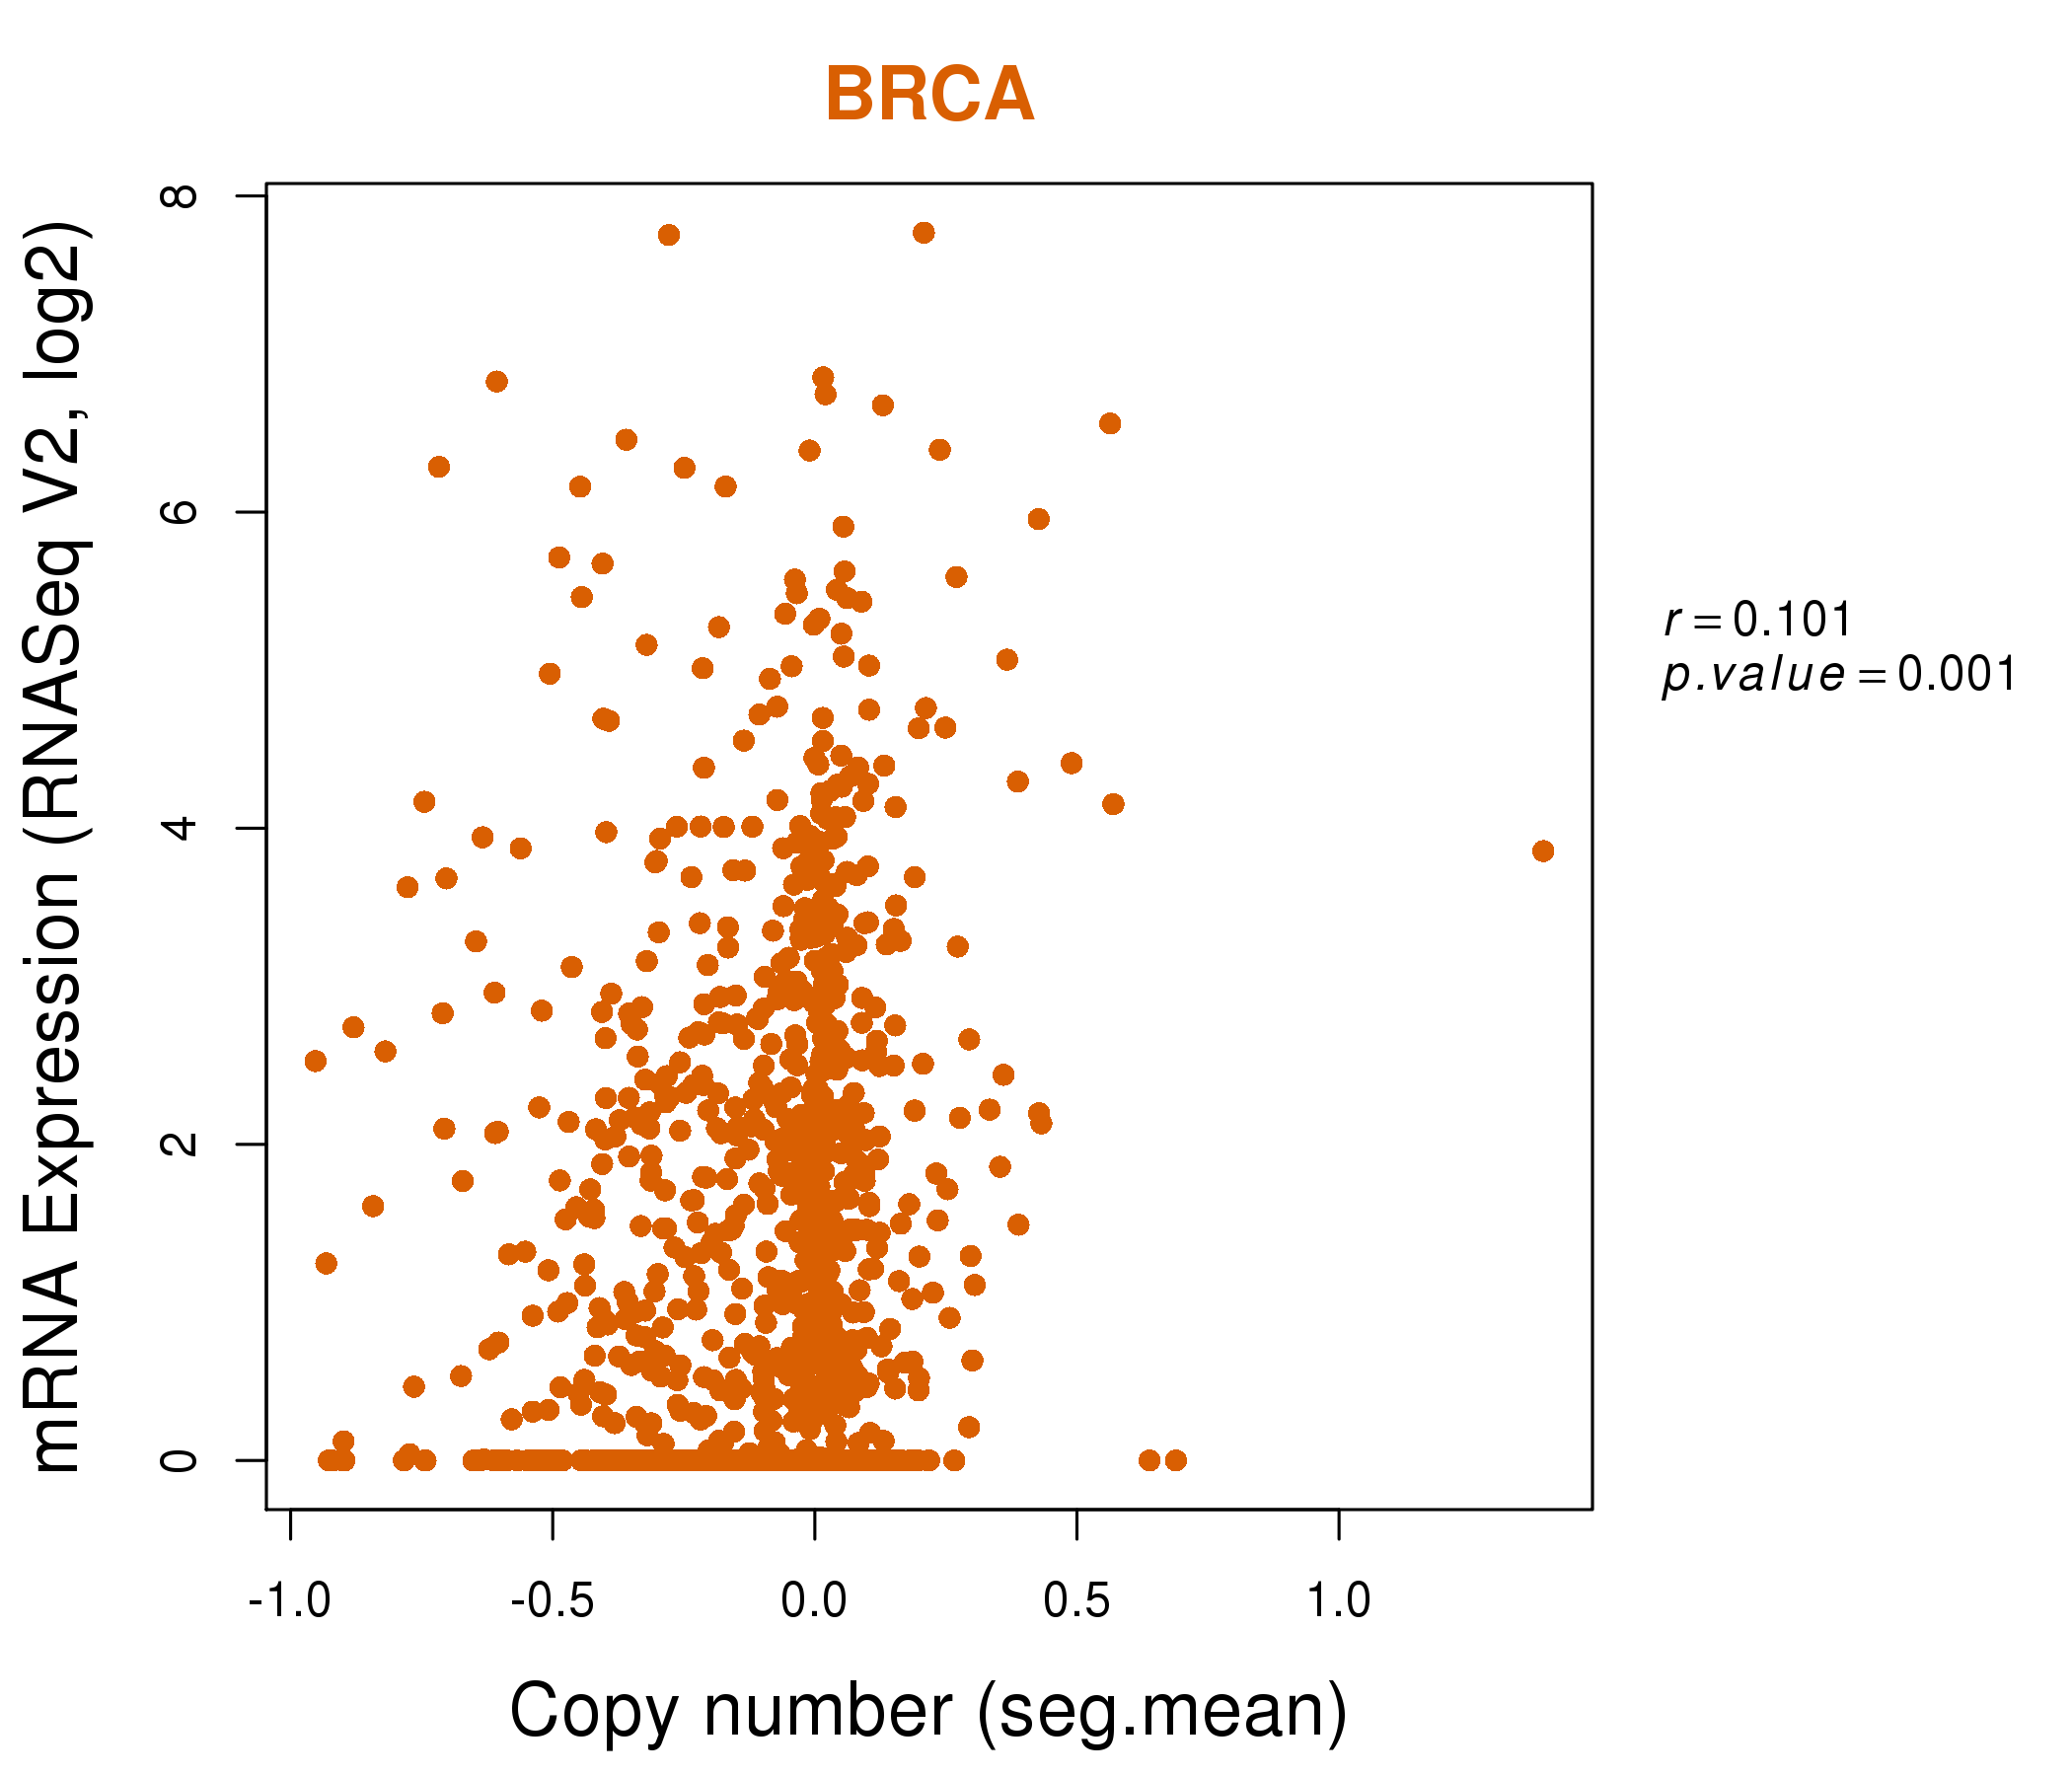
| * This plots show the correlation between CNV and gene expression. |
: Open all plots for all cancer types
 |
|
 |
|

| Top |
| Gene-Gene Network Information |
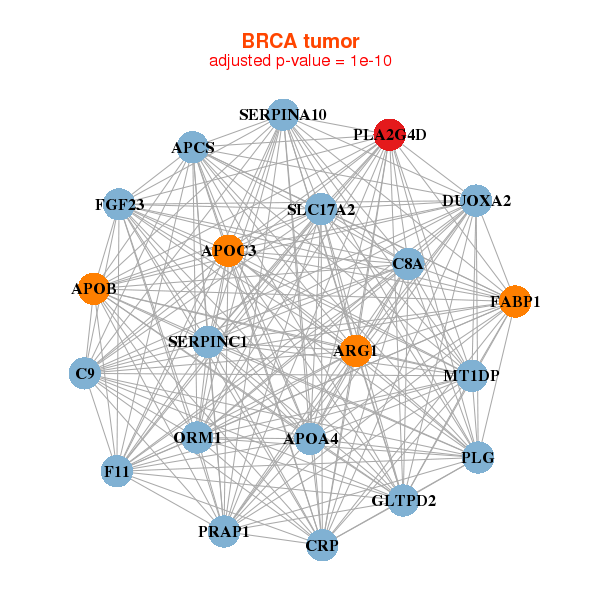
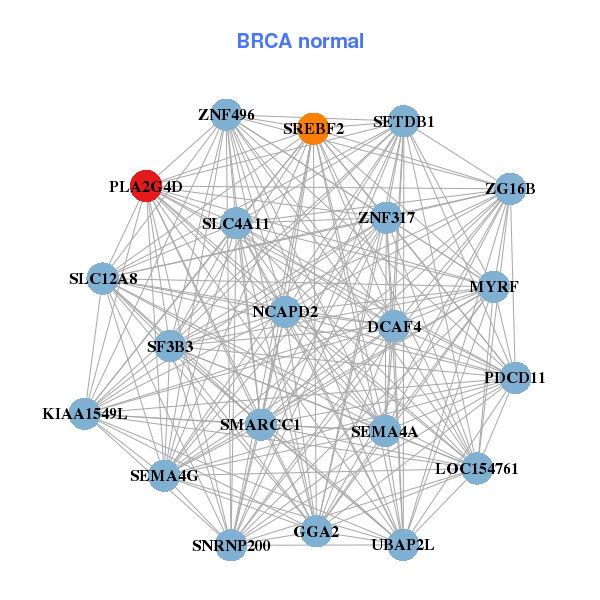
| * Co-Expression network figures were drawn using R package igraph. Only the top 20 genes with the highest correlations were shown. Red circle: input gene, orange circle: cell metabolism gene, sky circle: other gene |
: Open all plots for all cancer types
 |
|
| APCS,APOA4,APOB,APOC3,ARG1,C8A,C9, CRP,DUOXA2,F11,FABP1,FGF23,GLTPD2,MT1DP, ORM1,PLA2G4D,PLG,PRAP1,SERPINA10,SERPINC1,SLC17A2 | KIAA1549L,MYRF,DCAF4,GGA2,LOC154761,NCAPD2,PDCD11, PLA2G4D,SEMA4A,SEMA4G,SETDB1,SF3B3,SLC12A8,SLC4A11, SMARCC1,SNRNP200,SREBF2,UBAP2L,ZG16B,ZNF317,ZNF496 |
 |
|
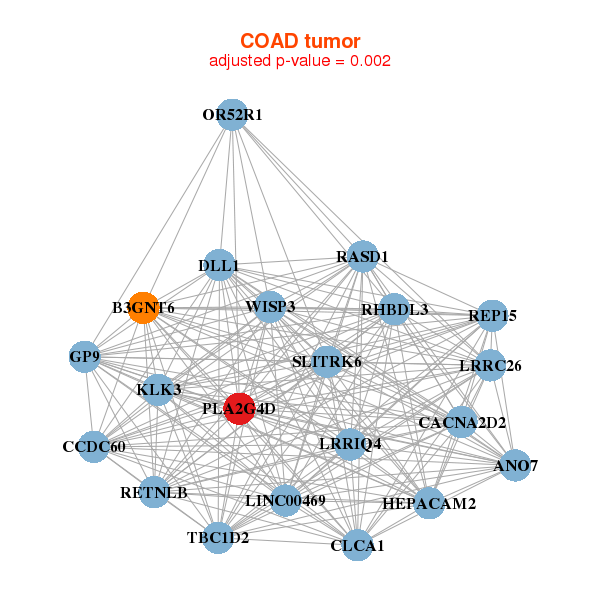
| ANO7,B3GNT6,LINC00469,CACNA2D2,CCDC60,CLCA1,DLL1, GP9,HEPACAM2,KLK3,LRRC26,LRRIQ4,OR52R1,PLA2G4D, RASD1,REP15,RETNLB,RHBDL3,SLITRK6,TBC1D2,WISP3 | AACS,ACSL3,SYNE4,C1QTNF6,CATSPERB,CKAP4,DHCR7, DMBT1,GALNT5,GNA14,KIAA1244,LRIG3,LSS,MUC5B, PCSK9,PKP4,PLA2G4D,QSOX1,SLC10A7,SRD5A3,USP17L2 |
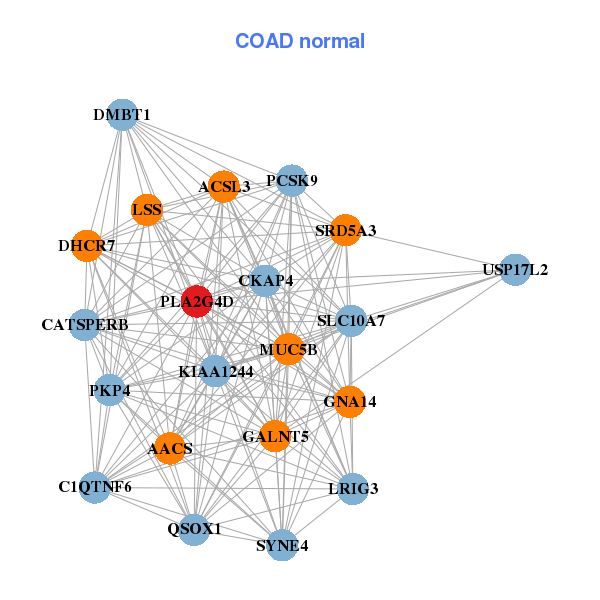
| * Co-Expression network figures were drawn using R package igraph. Only the top 20 genes with the highest correlations were shown. Red circle: input gene, orange circle: cell metabolism gene, sky circle: other gene |
: Open all plots for all cancer types
| Top |
: Open all interacting genes' information including KEGG pathway for all interacting genes from DAVID
| Top |
| Pharmacological Information for PLA2G4D |
| There's no related Drug. |
| Top |
| Cross referenced IDs for PLA2G4D |
| * We obtained these cross-references from Uniprot database. It covers 150 different DBs, 18 categories. http://www.uniprot.org/help/cross_references_section |
: Open all cross reference information
|
Copyright © 2016-Present - The Univsersity of Texas Health Science Center at Houston @ |