|
||||||||||||||||||||
| |
| Phenotypic Information (metabolism pathway, cancer, disease, phenome) |
| |
| |
| Gene-Gene Network Information: Co-Expression Network, Interacting Genes & KEGG |
| |
|


| Gene Summary for PIGW |
| Top |
| Phenotypic Information for PIGW(metabolism pathway, cancer, disease, phenome) |
| Cancer | CGAP: PIGW |
| Familial Cancer Database: PIGW | |
| * This gene is included in those cancer gene databases. |
|
|
|
|
|
| . | ||||||||||||||
Oncogene 1 | Significant driver gene in | |||||||||||||||||||
| cf) number; DB name 1 Oncogene; http://nar.oxfordjournals.org/content/35/suppl_1/D721.long, 2 Tumor Suppressor gene; https://bioinfo.uth.edu/TSGene/, 3 Cancer Gene Census; http://www.nature.com/nrc/journal/v4/n3/abs/nrc1299.html, 4 CancerGenes; http://nar.oxfordjournals.org/content/35/suppl_1/D721.long, 5 Network of Cancer Gene; http://ncg.kcl.ac.uk/index.php, 1Therapeutic Vulnerabilities in Cancer; http://cbio.mskcc.org/cancergenomics/statius/ |
| REACTOME_METABOLISM_OF_PROTEINS | |
| OMIM | |
| Orphanet | |
| Disease | KEGG Disease: PIGW |
| MedGen: PIGW (Human Medical Genetics with Condition) | |
| ClinVar: PIGW | |
| Phenotype | MGI: PIGW (International Mouse Phenotyping Consortium) |
| PhenomicDB: PIGW | |
| Mutations for PIGW |
| * Under tables are showing count per each tissue to give us broad intuition about tissue specific mutation patterns.You can go to the detailed page for each mutation database's web site. |
| There's no structural variation information in COSMIC data for this gene. |
| * From mRNA Sanger sequences, Chitars2.0 arranged chimeric transcripts. This table shows PIGW related fusion information. |
| ID | Head Gene | Tail Gene | Accession | Gene_a | qStart_a | qEnd_a | Chromosome_a | tStart_a | tEnd_a | Gene_a | qStart_a | qEnd_a | Chromosome_a | tStart_a | tEnd_a |
| AI376808 | PIGW | 1 | 263 | 17 | 34894873 | 34895268 | POMGNT1 | 261 | 466 | 1 | 46656022 | 46656227 | |
| AW272407 | PIGW | 3 | 262 | 17 | 34894873 | 34895132 | POMGNT1 | 260 | 450 | 1 | 46656022 | 46656212 | |
| Top |
| There's no copy number variation information in COSMIC data for this gene. |
| Top |
|
 |
| Top |
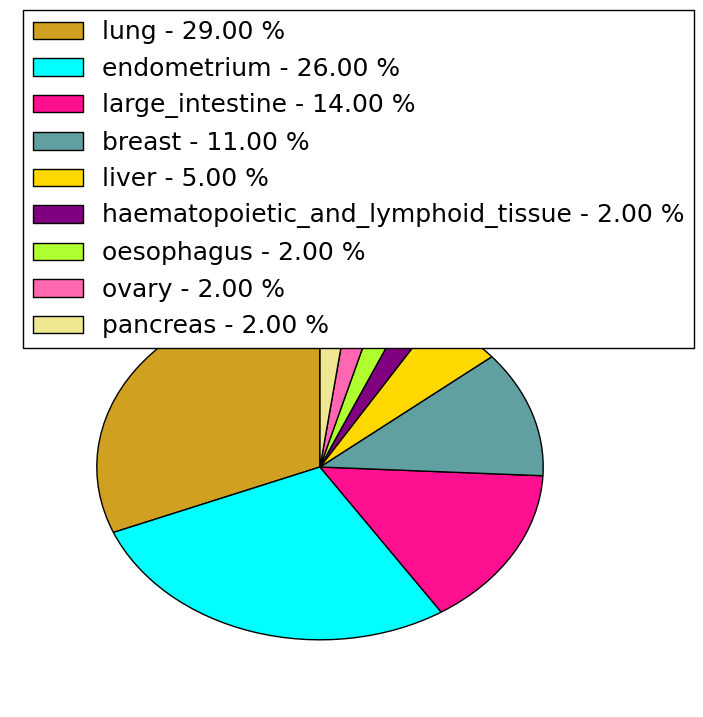
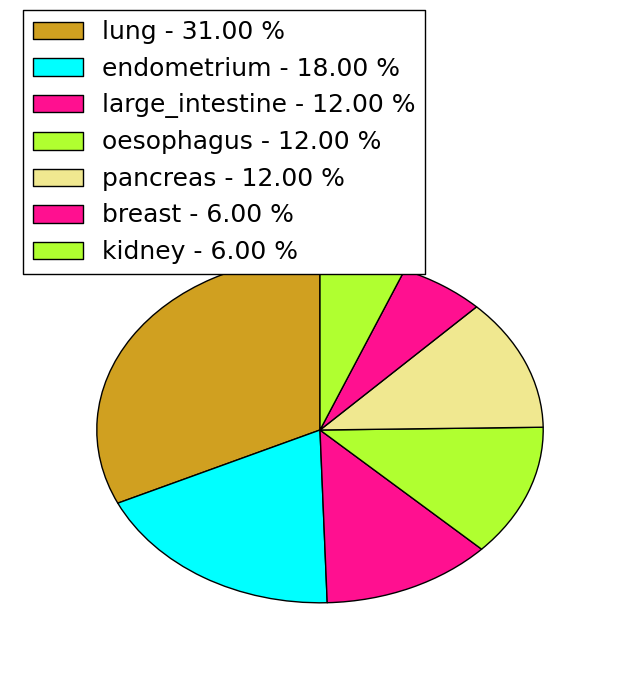
| Stat. for Non-Synonymous SNVs (# total SNVs=34) | (# total SNVs=16) |
 |  |
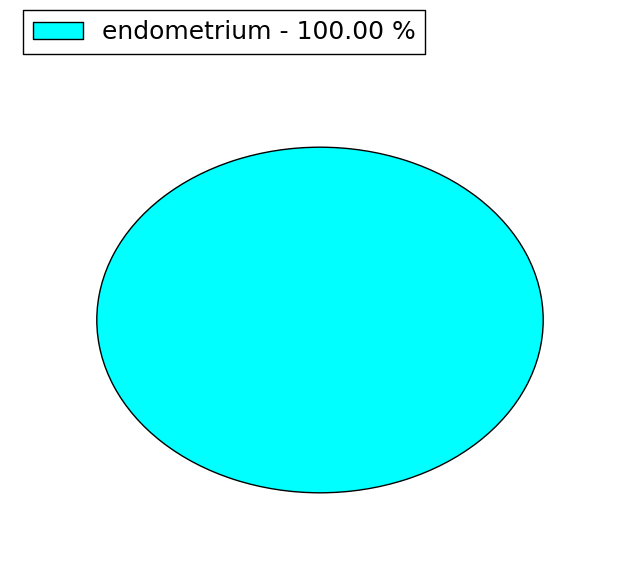
(# total SNVs=1) | (# total SNVs=0) |
 |
| Top |
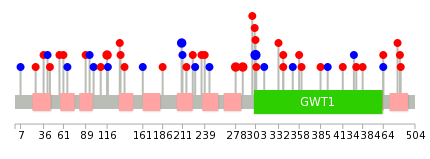
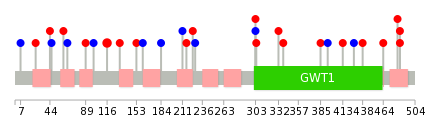
| * When you move the cursor on each content, you can see more deailed mutation information on the Tooltip. Those are primary_site,primary_histology,mutation(aa),pubmedID. |
| GRCh37 position | Mutation(aa) | Unique sampleID count |
| chr17:34893859-34893859 | p.R303R | 3 |
| chr17:34893298-34893298 | p.F116L | 2 |
| chr17:34893783-34893783 | p.F278C | 2 |
| chr17:34893810-34893810 | p.Y287C | 2 |
| chr17:34893580-34893580 | p.V210V | 2 |
| chr17:34893081-34893081 | p.Q44R | 1 |
| chr17:34894104-34894104 | p.L385P | 1 |
| chr17:34893631-34893631 | p.E227E | 1 |
| chr17:34894407-34894407 | p.S486F | 1 |
| chr17:34893091-34893094 | p.S48fs*16 | 1 |
| Top |
|
 |
| Point Mutation/ Tissue ID | 1 | 2 | 3 | 4 | 5 | 6 | 7 | 8 | 9 | 10 | 11 | 12 | 13 | 14 | 15 | 16 | 17 | 18 | 19 | 20 |
| # sample | 1 | 3 | 3 | 2 | 1 | 4 | 2 | 3 | 1 | 9 | ||||||||||
| # mutation | 1 | 3 | 3 | 2 | 1 | 4 | 2 | 3 | 1 | 10 | ||||||||||
| nonsynonymous SNV | 3 | 2 | 2 | 2 | 2 | 1 | 7 | |||||||||||||
| synonymous SNV | 1 | 1 | 2 | 1 | 2 | 1 | 3 |
| cf) Tissue ID; Tissue type (1; BLCA[Bladder Urothelial Carcinoma], 2; BRCA[Breast invasive carcinoma], 3; CESC[Cervical squamous cell carcinoma and endocervical adenocarcinoma], 4; COAD[Colon adenocarcinoma], 5; GBM[Glioblastoma multiforme], 6; Glioma Low Grade, 7; HNSC[Head and Neck squamous cell carcinoma], 8; KICH[Kidney Chromophobe], 9; KIRC[Kidney renal clear cell carcinoma], 10; KIRP[Kidney renal papillary cell carcinoma], 11; LAML[Acute Myeloid Leukemia], 12; LUAD[Lung adenocarcinoma], 13; LUSC[Lung squamous cell carcinoma], 14; OV[Ovarian serous cystadenocarcinoma ], 15; PAAD[Pancreatic adenocarcinoma], 16; PRAD[Prostate adenocarcinoma], 17; SKCM[Skin Cutaneous Melanoma], 18:STAD[Stomach adenocarcinoma], 19:THCA[Thyroid carcinoma], 20:UCEC[Uterine Corpus Endometrial Carcinoma]) |
| Top |
| * We represented just top 10 SNVs. When you move the cursor on each content, you can see more deailed mutation information on the Tooltip. Those are primary_site, primary_histology, mutation(aa), pubmedID. |
| Genomic Position | Mutation(aa) | Unique sampleID count |
| chr17:34893298 | p.F116L | 2 |
| chr17:34893132 | p.F61S | 1 |
| chr17:34893620 | p.H332D | 1 |
| chr17:34894262 | p.V66V | 1 |
| chr17:34893148 | p.K338R | 1 |
| chr17:34893631 | p.F89C | 1 |
| chr17:34894341 | p.L385P | 1 |
| chr17:34893216 | p.R99R | 1 |
| chr17:34893858 | p.I394I | 1 |
| chr17:34894394 | p.L413R | 1 |
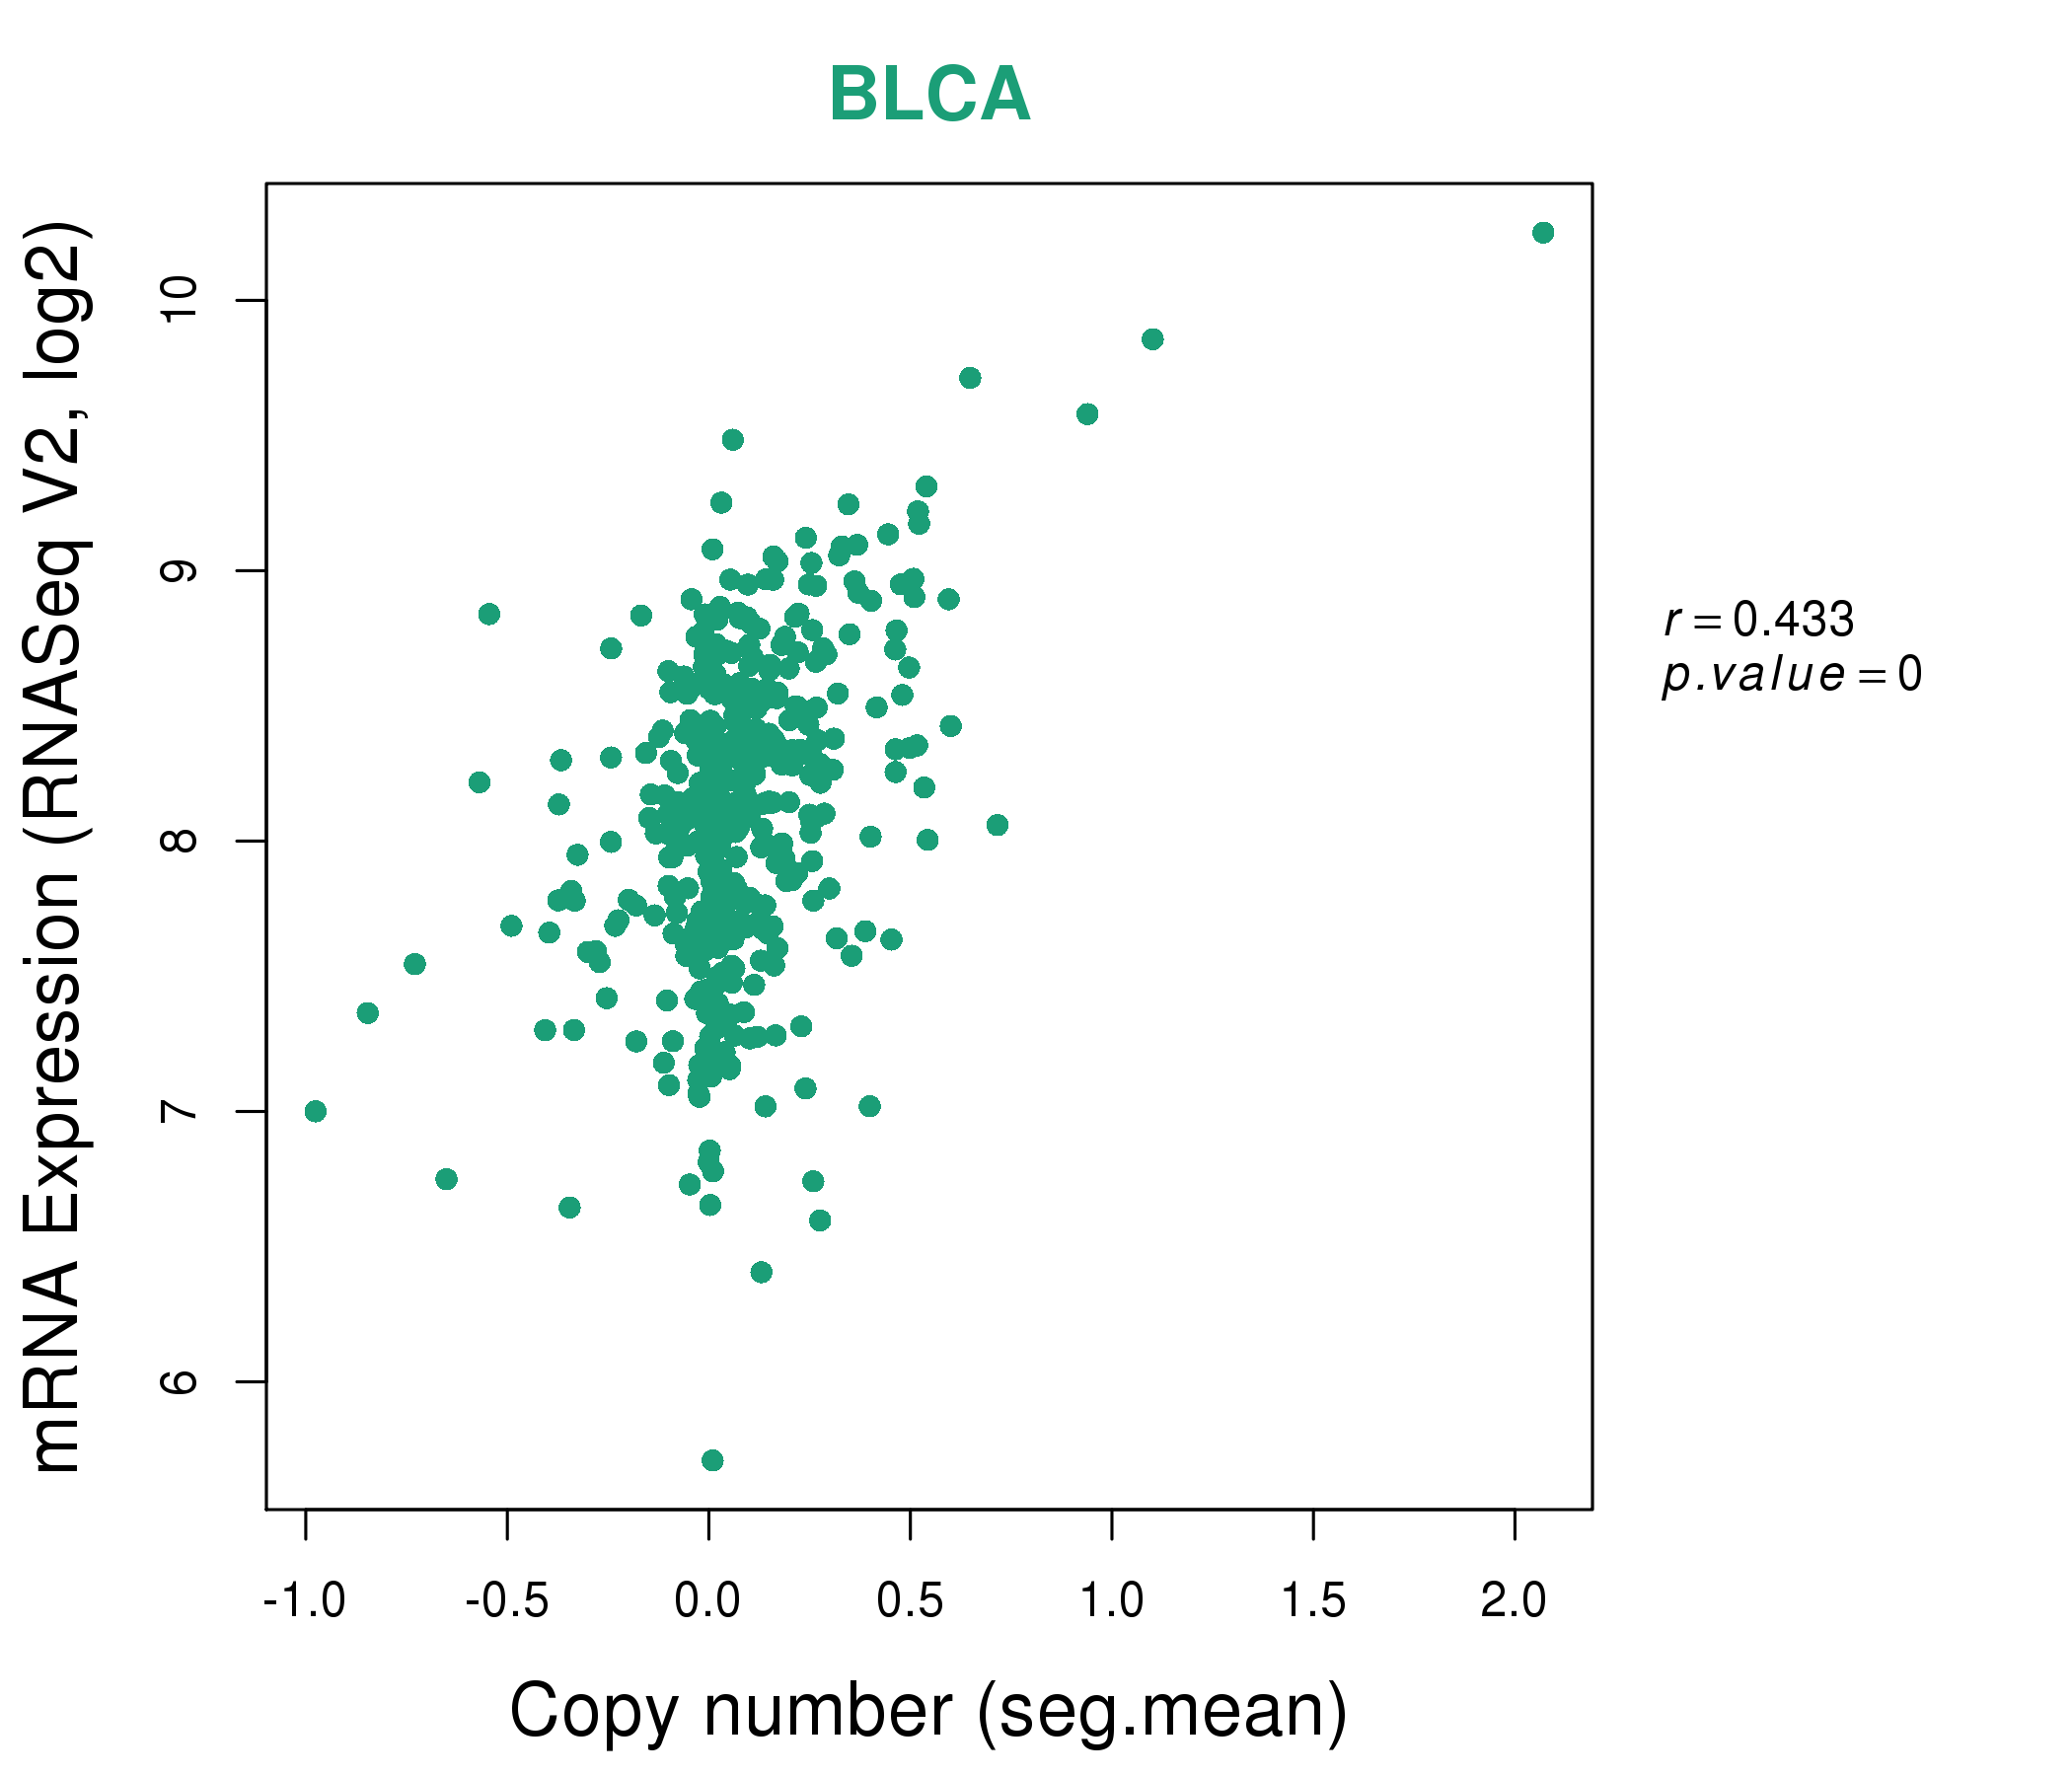
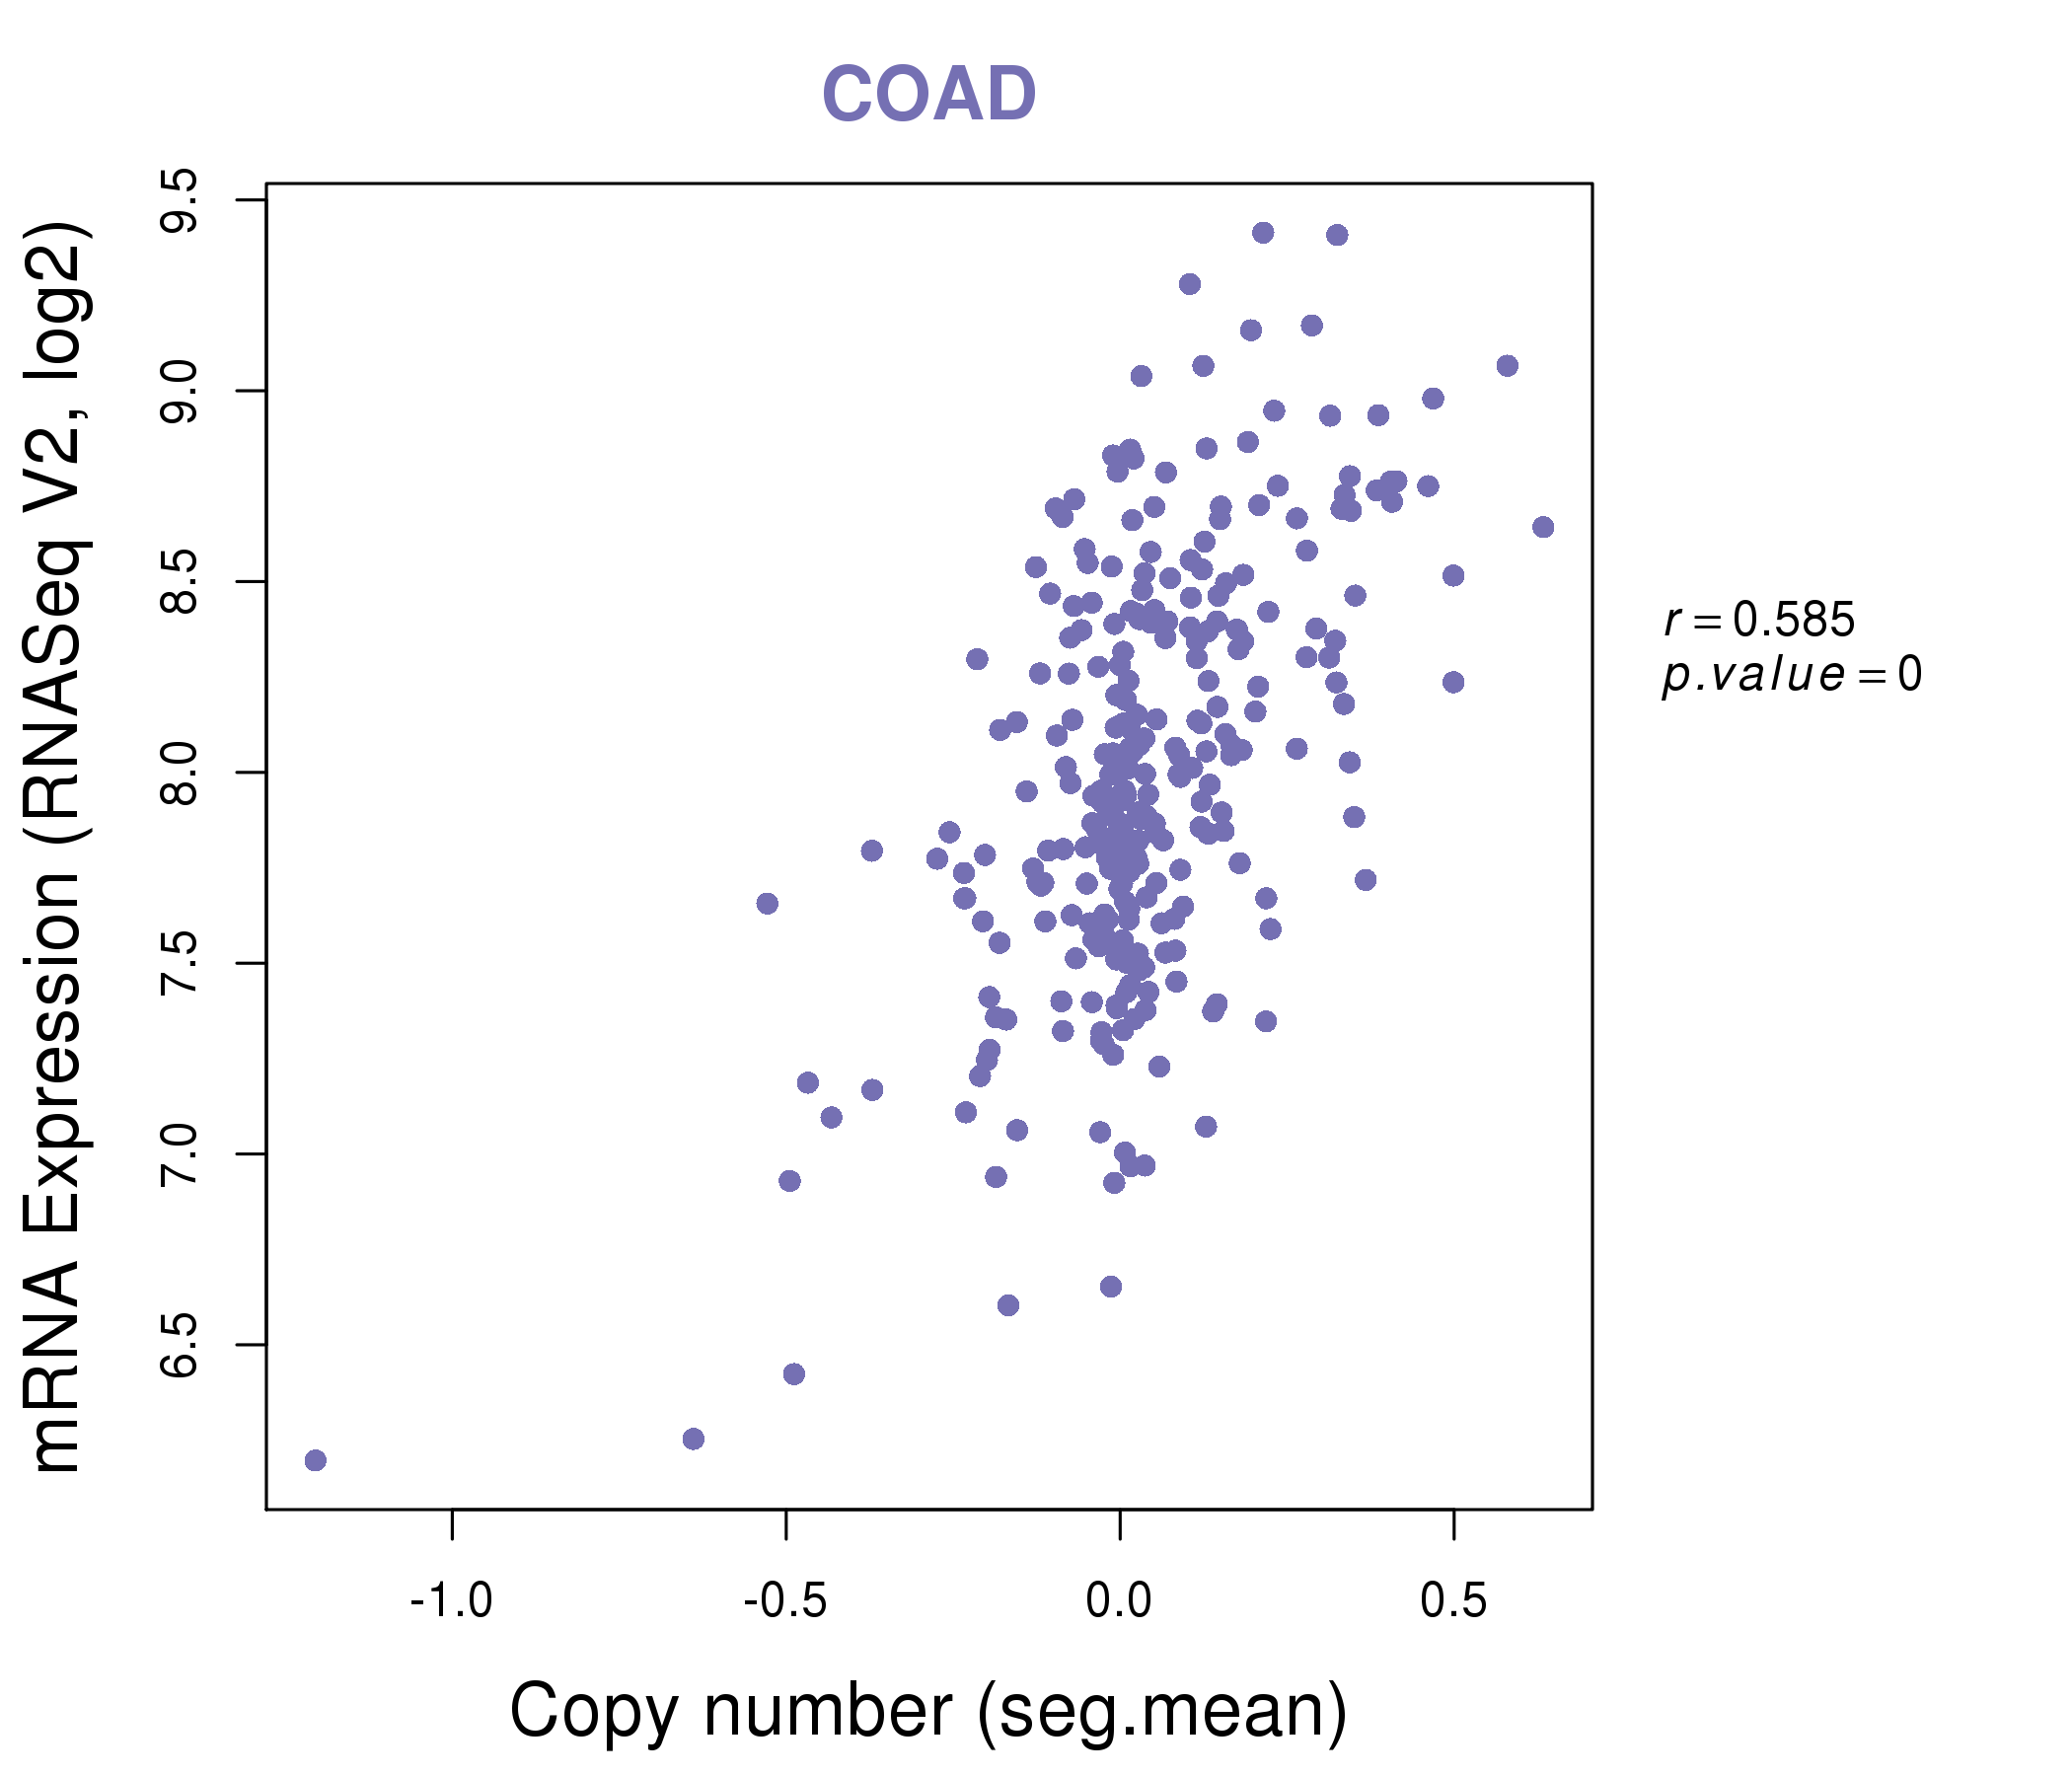
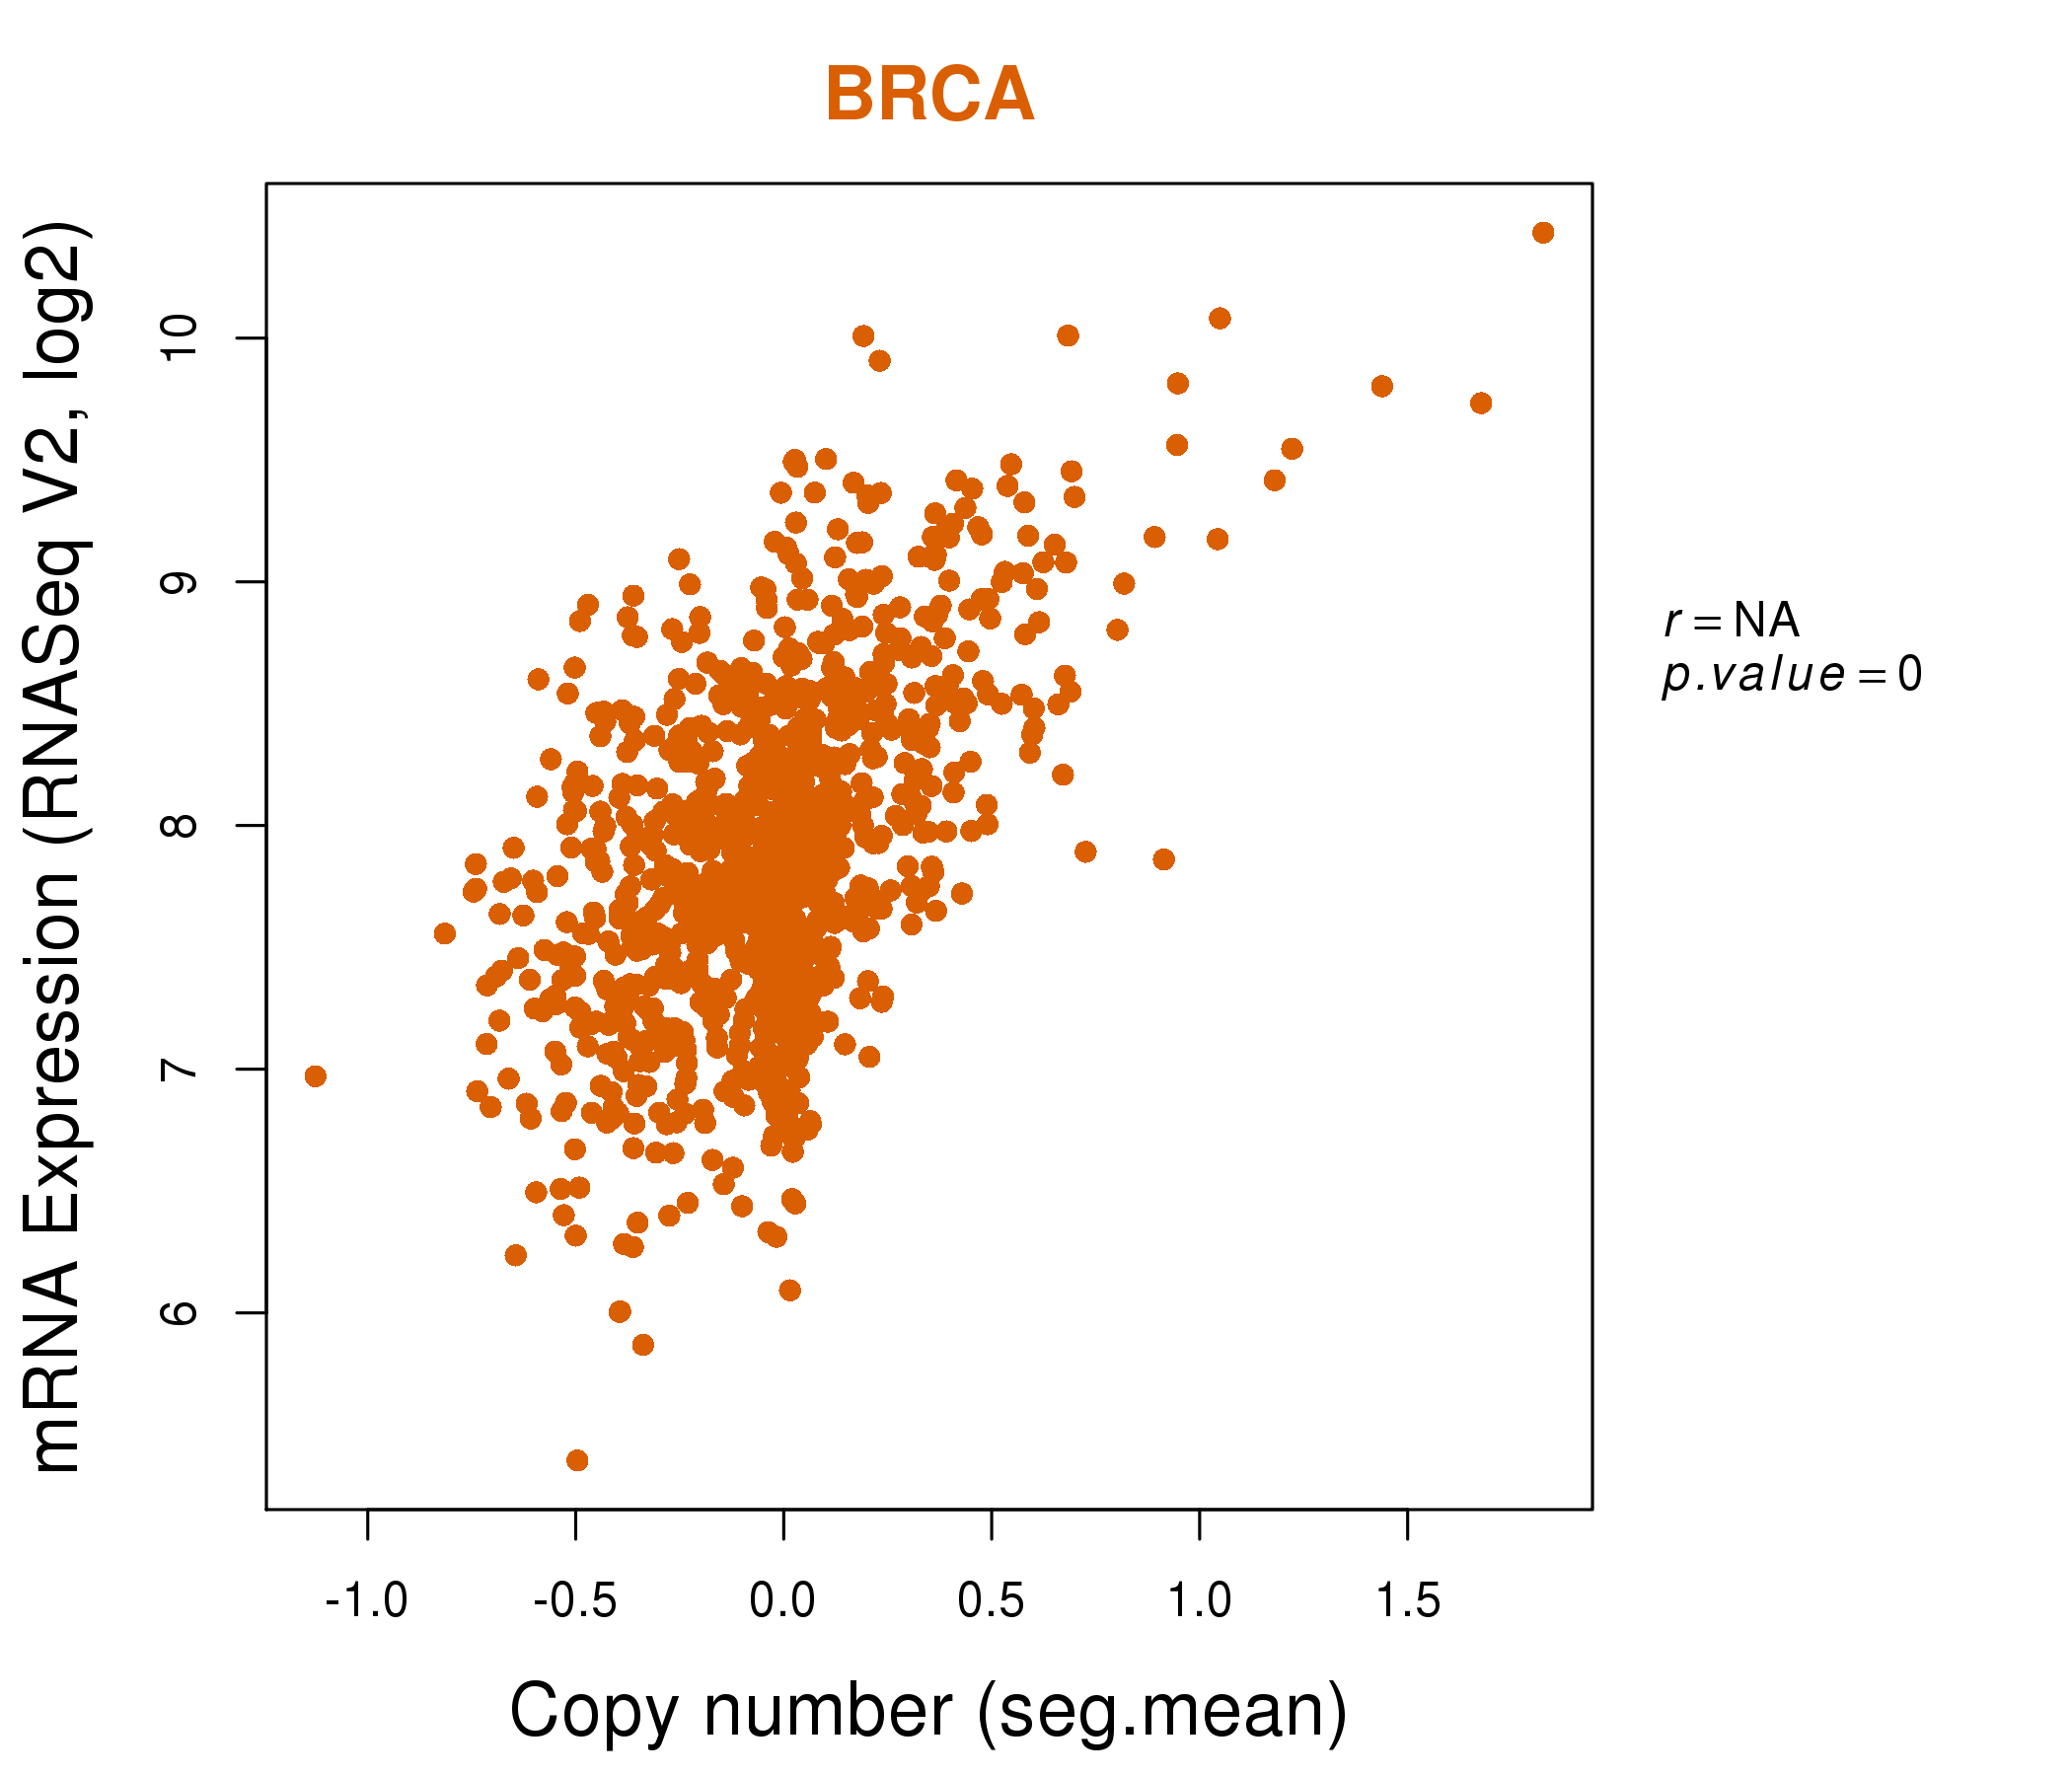
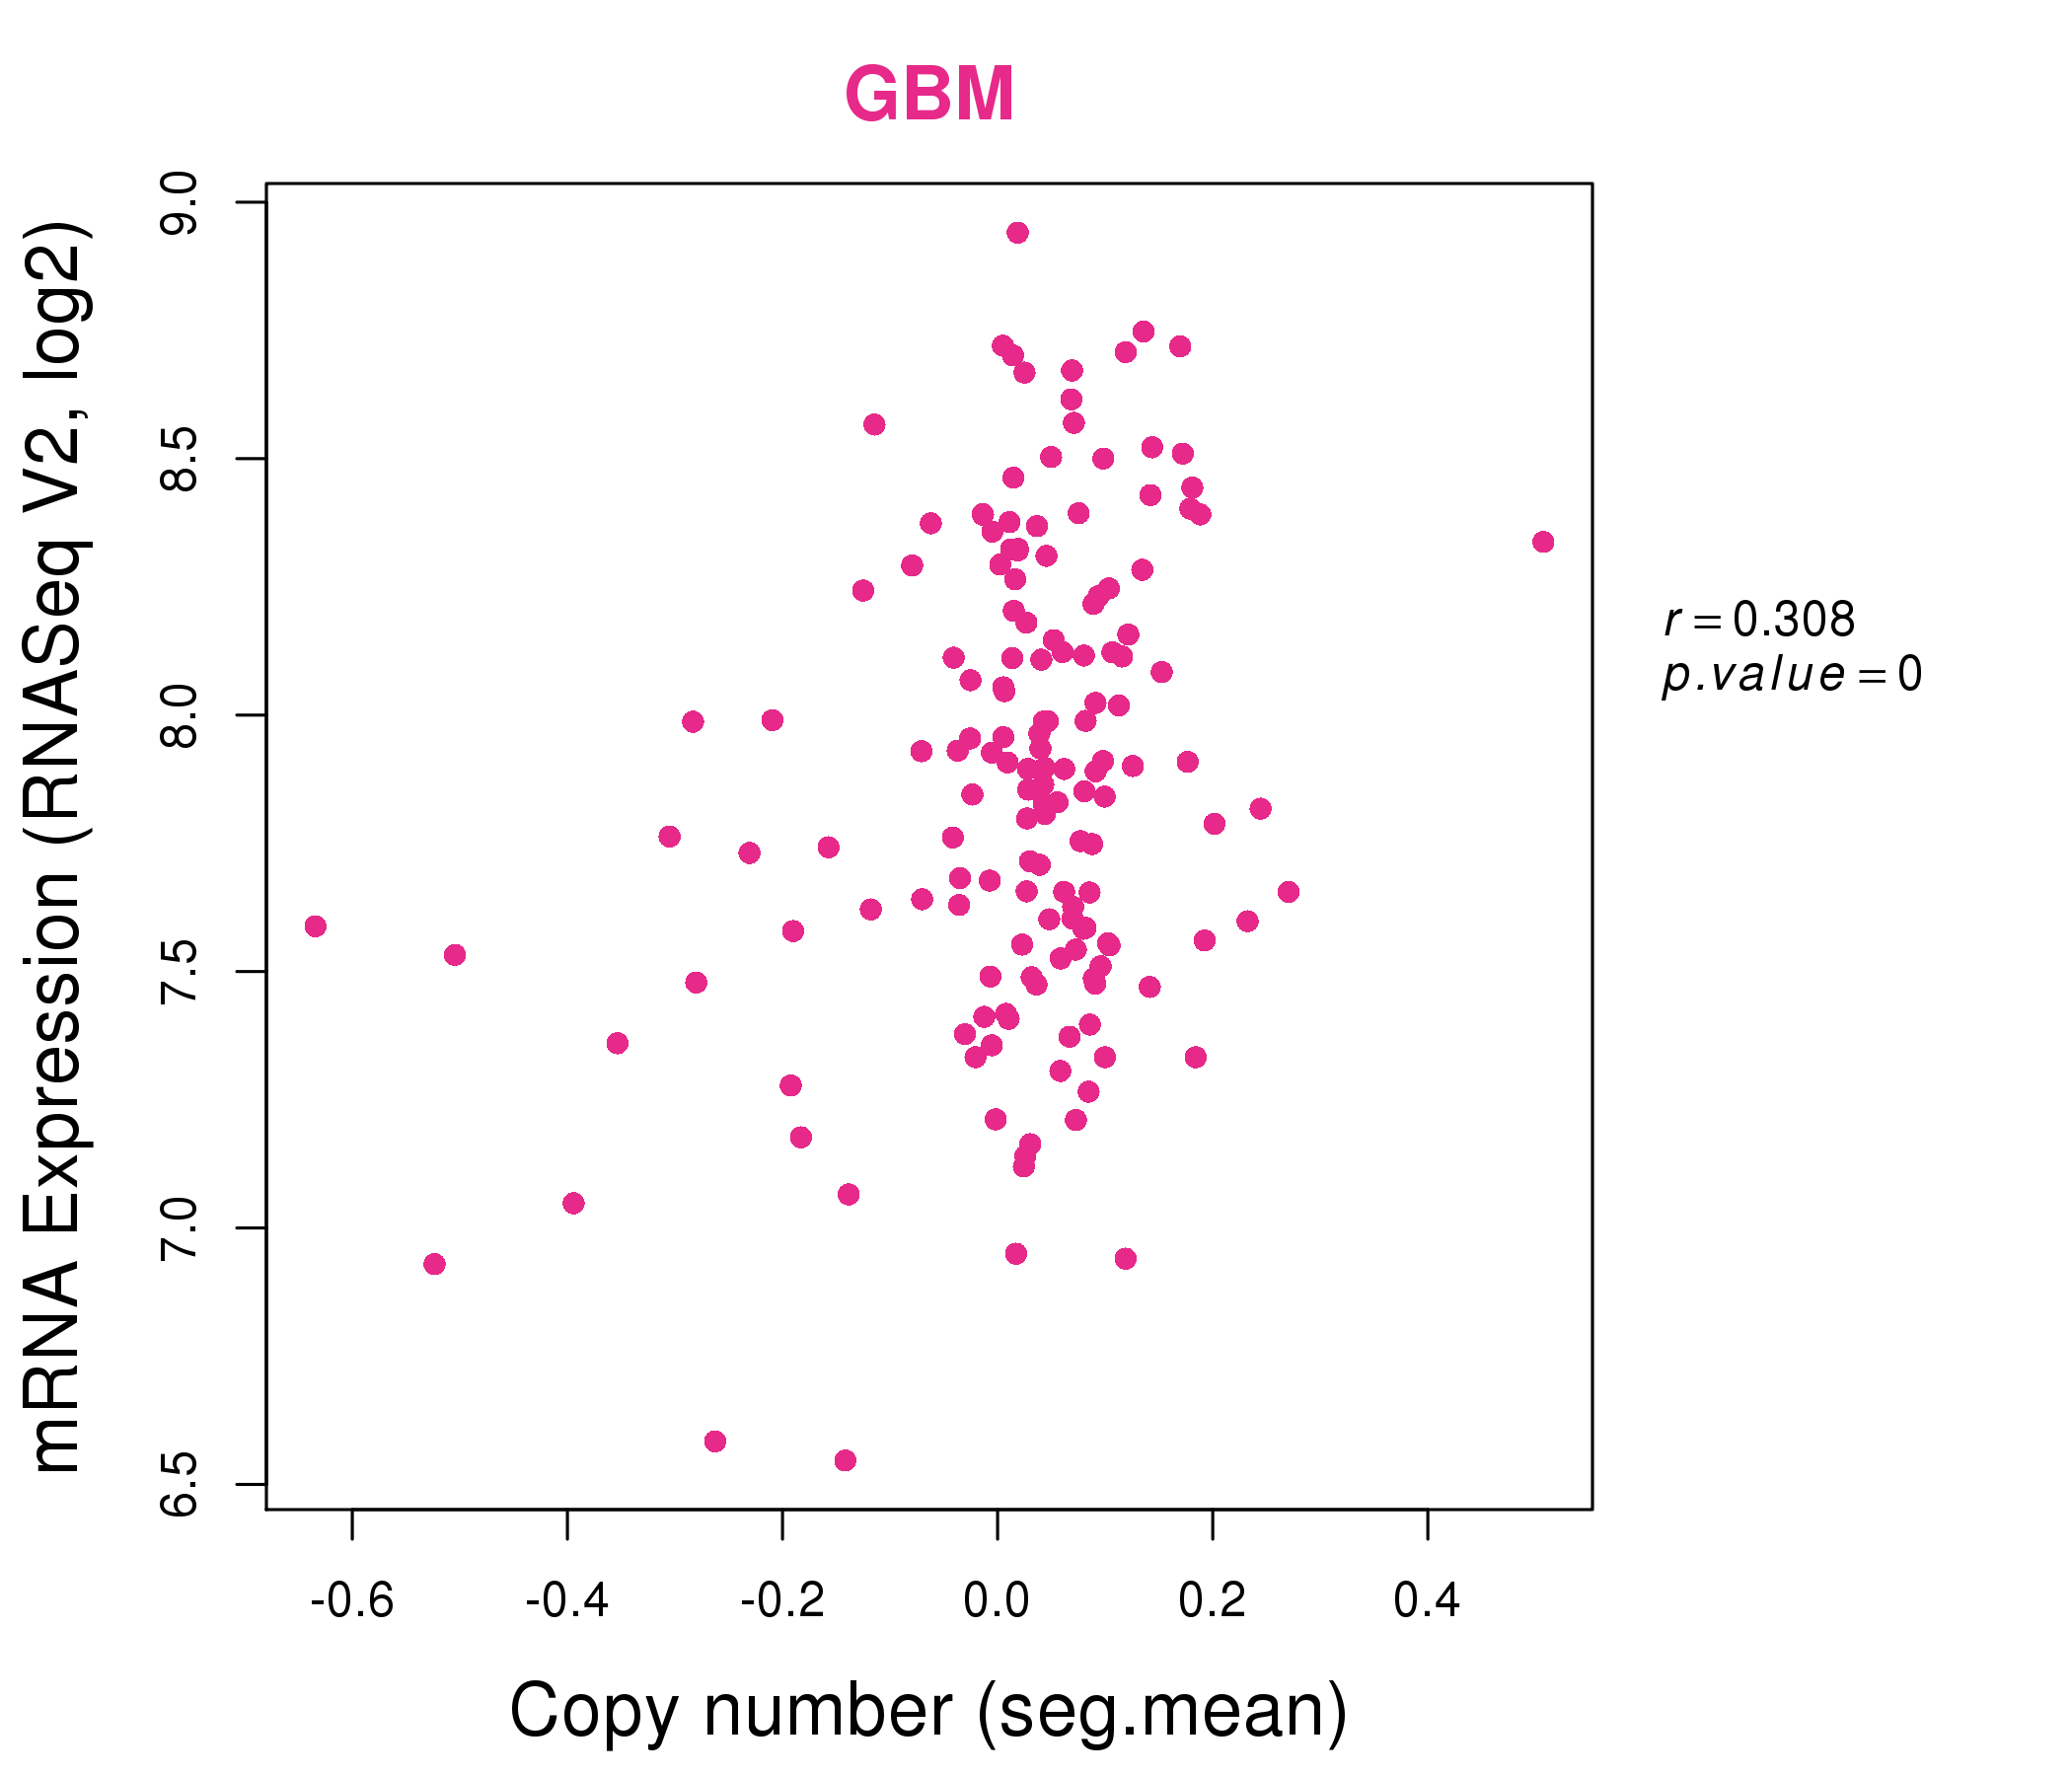
| * Copy number data were extracted from TCGA using R package TCGA-Assembler. The URLs of all public data files on TCGA DCC data server were gathered on Jan-05-2015. Function ProcessCNAData in TCGA-Assembler package was used to obtain gene-level copy number value which is calculated as the average copy number of the genomic region of a gene. |
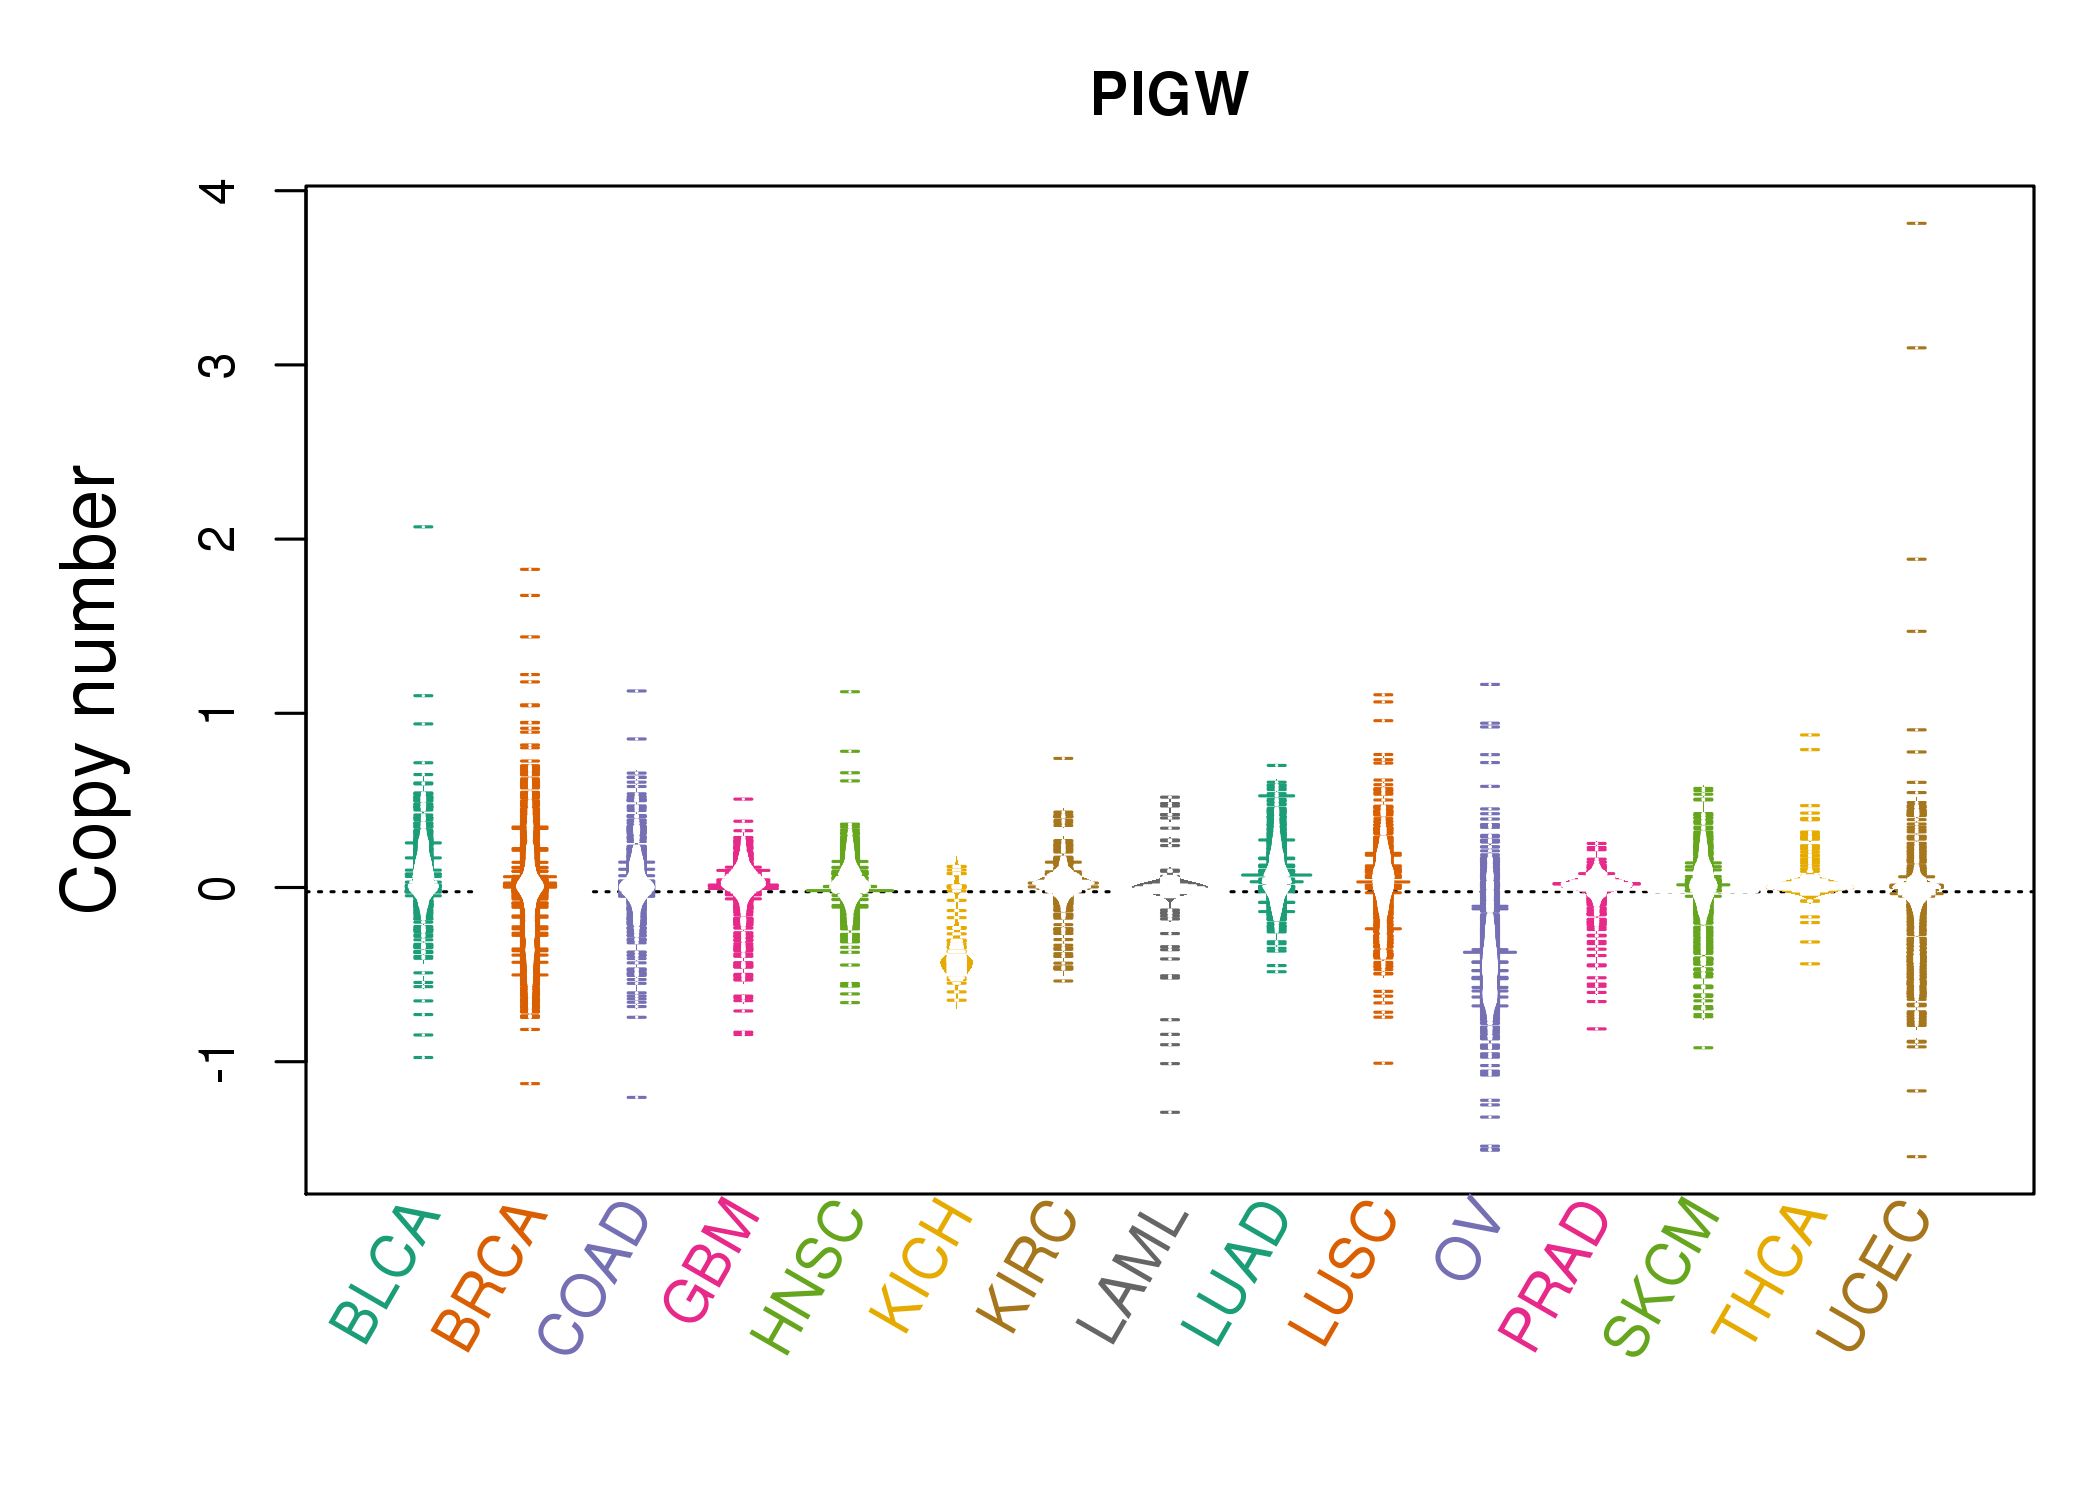 |
| cf) Tissue ID[Tissue type]: BLCA[Bladder Urothelial Carcinoma], BRCA[Breast invasive carcinoma], CESC[Cervical squamous cell carcinoma and endocervical adenocarcinoma], COAD[Colon adenocarcinoma], GBM[Glioblastoma multiforme], Glioma Low Grade, HNSC[Head and Neck squamous cell carcinoma], KICH[Kidney Chromophobe], KIRC[Kidney renal clear cell carcinoma], KIRP[Kidney renal papillary cell carcinoma], LAML[Acute Myeloid Leukemia], LUAD[Lung adenocarcinoma], LUSC[Lung squamous cell carcinoma], OV[Ovarian serous cystadenocarcinoma ], PAAD[Pancreatic adenocarcinoma], PRAD[Prostate adenocarcinoma], SKCM[Skin Cutaneous Melanoma], STAD[Stomach adenocarcinoma], THCA[Thyroid carcinoma], UCEC[Uterine Corpus Endometrial Carcinoma] |
| Top |
| Gene Expression for PIGW |
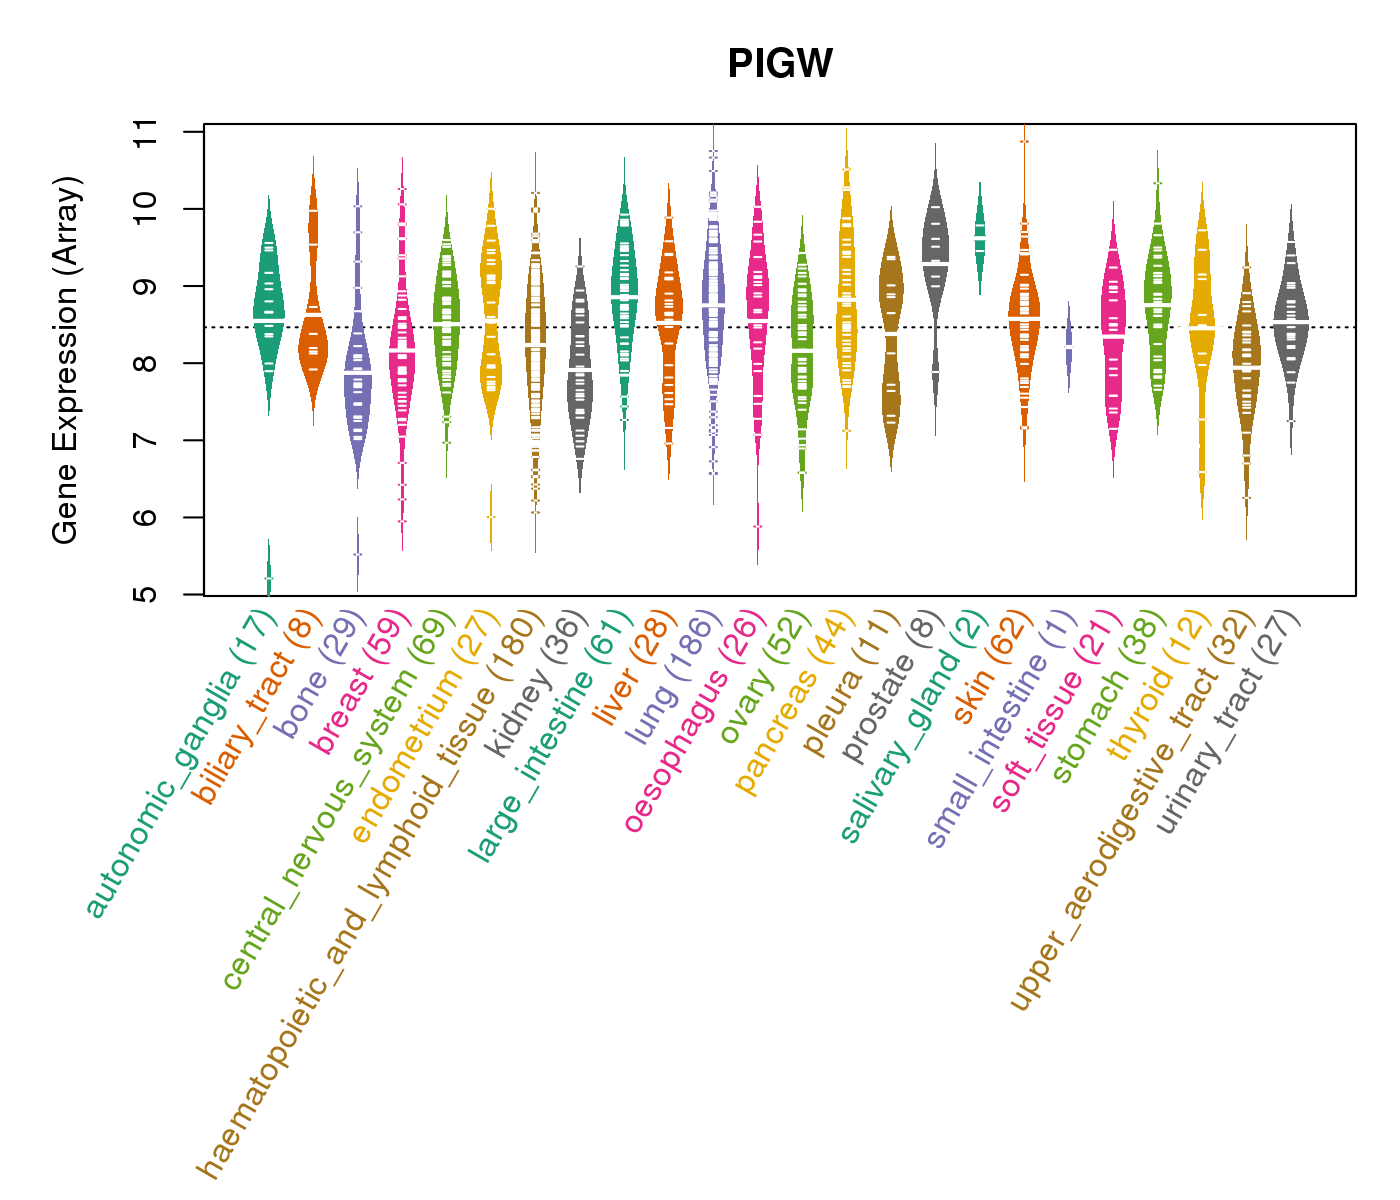
| * CCLE gene expression data were extracted from CCLE_Expression_Entrez_2012-10-18.res: Gene-centric RMA-normalized mRNA expression data. |
 |
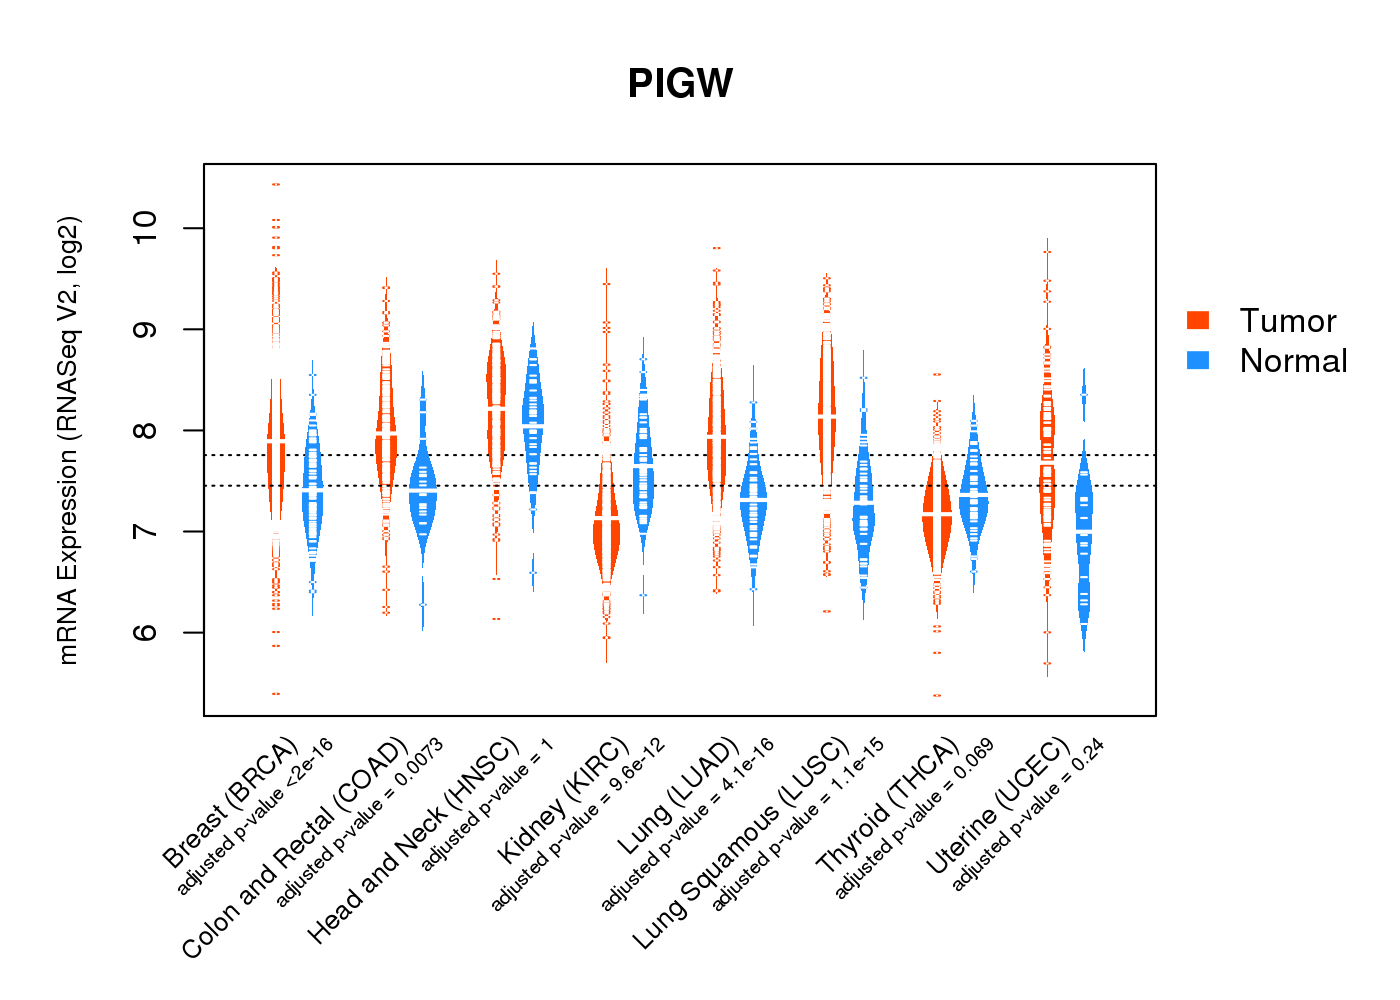
| * Normalized gene expression data of RNASeqV2 was extracted from TCGA using R package TCGA-Assembler. The URLs of all public data files on TCGA DCC data server were gathered at Jan-05-2015. Only eight cancer types have enough normal control samples for differential expression analysis. (t test, adjusted p<0.05 (using Benjamini-Hochberg FDR)) |
 |
| Top |
| * This plots show the correlation between CNV and gene expression. |
: Open all plots for all cancer types
 |
|
 |
|
| Top |
| Gene-Gene Network Information |
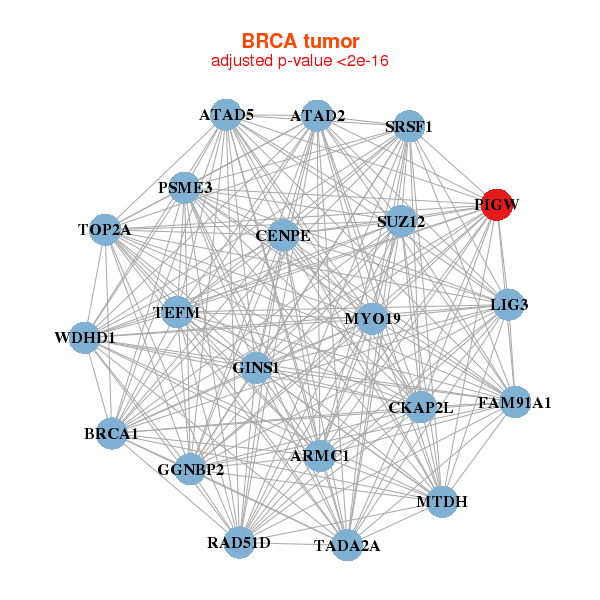
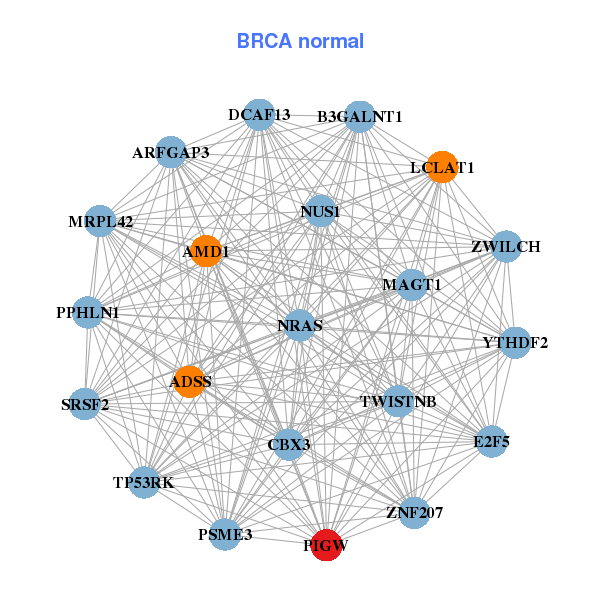
| * Co-Expression network figures were drawn using R package igraph. Only the top 20 genes with the highest correlations were shown. Red circle: input gene, orange circle: cell metabolism gene, sky circle: other gene |
: Open all plots for all cancer types
 |
|
| ARMC1,ATAD2,ATAD5,BRCA1,TEFM,CENPE,CKAP2L, FAM91A1,GGNBP2,GINS1,LIG3,MTDH,MYO19,PIGW, PSME3,RAD51D,SRSF1,SUZ12,TADA2A,TOP2A,WDHD1 | ADSS,AMD1,ARFGAP3,B3GALNT1,CBX3,DCAF13,E2F5, LCLAT1,MAGT1,MRPL42,NRAS,NUS1,PIGW,PPHLN1, PSME3,SRSF2,TP53RK,TWISTNB,YTHDF2,ZNF207,ZWILCH |
 |
|
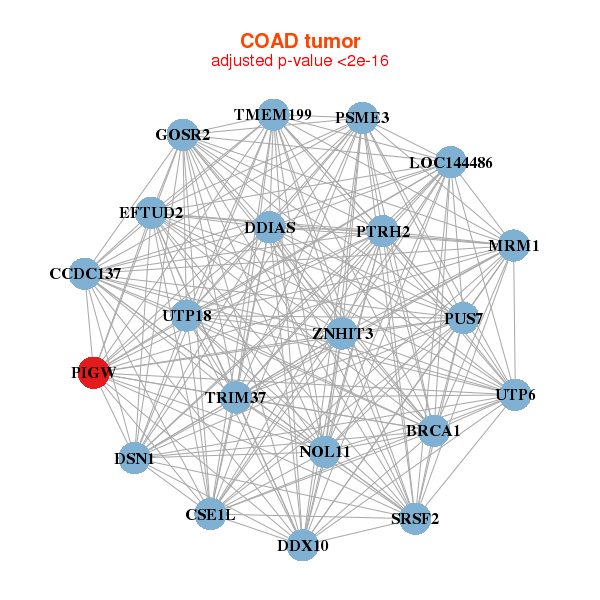
| BRCA1,DDIAS,CCDC137,CSE1L,DDX10,DSN1,EFTUD2, GOSR2,LOC144486,MRM1,NOL11,PIGW,PSME3,PTRH2, PUS7,SRSF2,TMEM199,TRIM37,UTP18,UTP6,ZNHIT3 | AEN,BYSL,CCDC86,DDX21,FUT4,GNL2,GTPBP4, NOP16,NOP2,ODC1,PDE12,PDF,PIGW,PMM2, PNPT1,SEH1L,SRSF2,TDG,TOMM40,TRMT6,UTP15 |
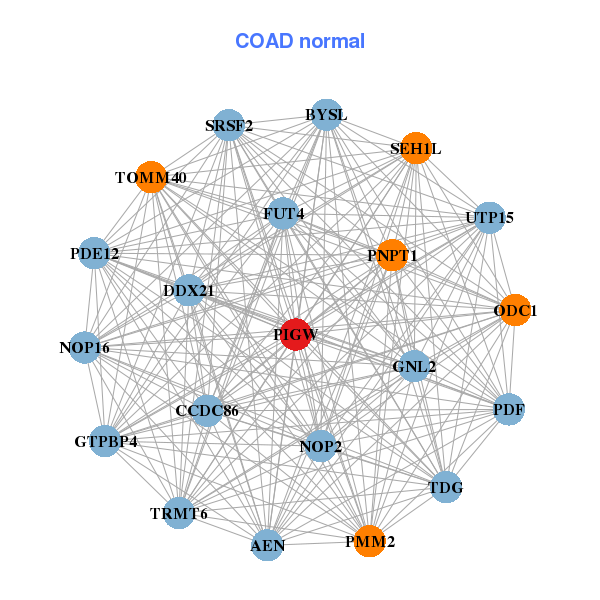
| * Co-Expression network figures were drawn using R package igraph. Only the top 20 genes with the highest correlations were shown. Red circle: input gene, orange circle: cell metabolism gene, sky circle: other gene |
: Open all plots for all cancer types
| Top |
: Open all interacting genes' information including KEGG pathway for all interacting genes from DAVID
| Top |
| Pharmacological Information for PIGW |
| There's no related Drug. |
| Top |
| Cross referenced IDs for PIGW |
| * We obtained these cross-references from Uniprot database. It covers 150 different DBs, 18 categories. http://www.uniprot.org/help/cross_references_section |
: Open all cross reference information
|
Copyright © 2016-Present - The Univsersity of Texas Health Science Center at Houston @ |