|
||||||||||||||||||||||||||||||||||||||||||||||||||||||||||||||||||||||||||||||||||||||||||||||||||||||||||||||||||||||||||||||||||||||||||||||||||||||||||||||||||||||||||||||||||||||||||||||||||||||||||||||||||||||||||||||||||||||||||||||||||||||||||||||||||||||||||||||||||||||||||||||||||||||||||||||||||||||||||
| |
| Phenotypic Information (metabolism pathway, cancer, disease, phenome) |
| |
| |
| Gene-Gene Network Information: Co-Expression Network, Interacting Genes & KEGG |
| |
|


| Gene Summary for SUMF1 |
| Top |
| Phenotypic Information for SUMF1(metabolism pathway, cancer, disease, phenome) |
| Cancer | CGAP: SUMF1 |
| Familial Cancer Database: SUMF1 | |
| * This gene is included in those cancer gene databases. |
|
|
|
|
|
|
| ||||||||||||||||||||||||||||||||||||||||||||||||||||||||||||||||||||||||||||||||||||||||||||||||||||||||||||||||||||||||||||||||||||||||||||||||||||||||||||||||||||||||||||||||||||||||||||||||||||||||||||||||||||||||||||||||||||||||||||||||||||||||||||||||||||||||||||||||||||||||||||||||||||||||||||||||||||
Oncogene 1 | Significant driver gene in | |||||||||||||||||||||||||||||||||||||||||||||||||||||||||||||||||||||||||||||||||||||||||||||||||||||||||||||||||||||||||||||||||||||||||||||||||||||||||||||||||||||||||||||||||||||||||||||||||||||||||||||||||||||||||||||||||||||||||||||||||||||||||||||||||||||||||||||||||||||||||||||||||||||||||||||||||||||||||
| cf) number; DB name 1 Oncogene; http://nar.oxfordjournals.org/content/35/suppl_1/D721.long, 2 Tumor Suppressor gene; https://bioinfo.uth.edu/TSGene/, 3 Cancer Gene Census; http://www.nature.com/nrc/journal/v4/n3/abs/nrc1299.html, 4 CancerGenes; http://nar.oxfordjournals.org/content/35/suppl_1/D721.long, 5 Network of Cancer Gene; http://ncg.kcl.ac.uk/index.php, 1Therapeutic Vulnerabilities in Cancer; http://cbio.mskcc.org/cancergenomics/statius/ |
| REACTOME_GLYCOSPHINGOLIPID_METABOLISM REACTOME_PHOSPHOLIPID_METABOLISM REACTOME_METABOLISM_OF_PROTEINS REACTOME_SPHINGOLIPID_METABOLISM REACTOME_METABOLISM_OF_LIPIDS_AND_LIPOPROTEINS | |
| OMIM | |
| Orphanet | |
| Disease | KEGG Disease: SUMF1 |
| MedGen: SUMF1 (Human Medical Genetics with Condition) | |
| ClinVar: SUMF1 | |
| Phenotype | MGI: SUMF1 (International Mouse Phenotyping Consortium) |
| PhenomicDB: SUMF1 | |
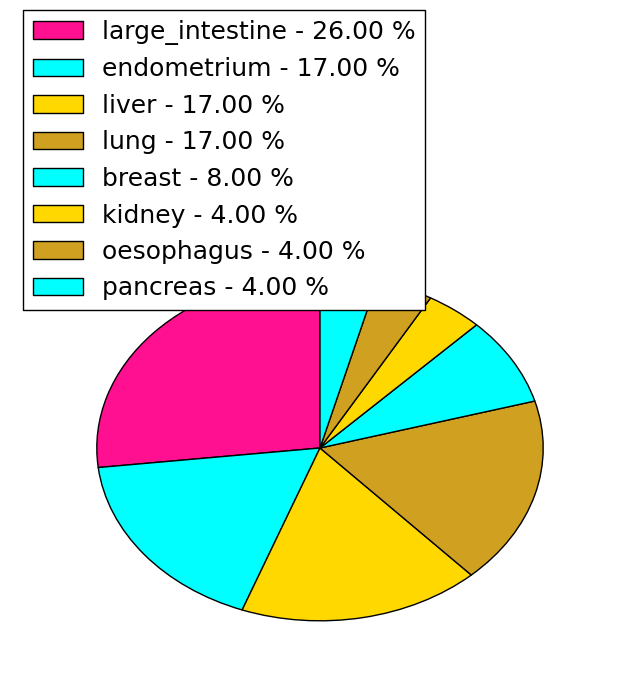
| Mutations for SUMF1 |
| * Under tables are showing count per each tissue to give us broad intuition about tissue specific mutation patterns.You can go to the detailed page for each mutation database's web site. |
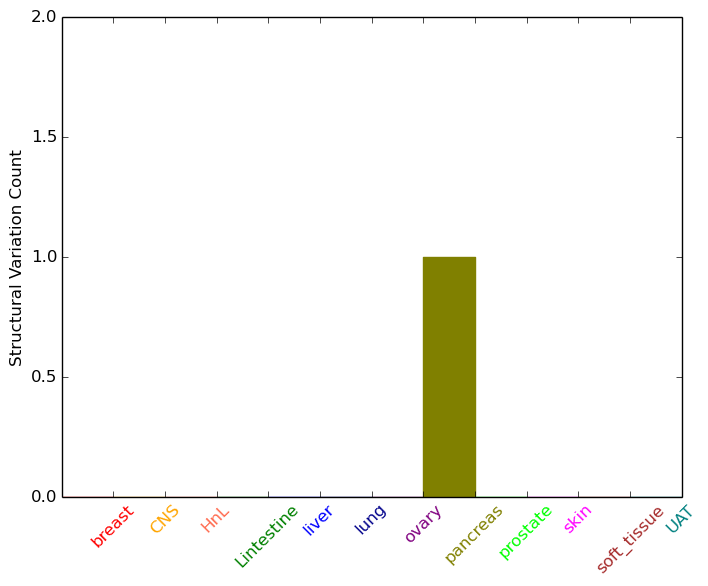
| - Statistics for Tissue and Mutation type | Top |
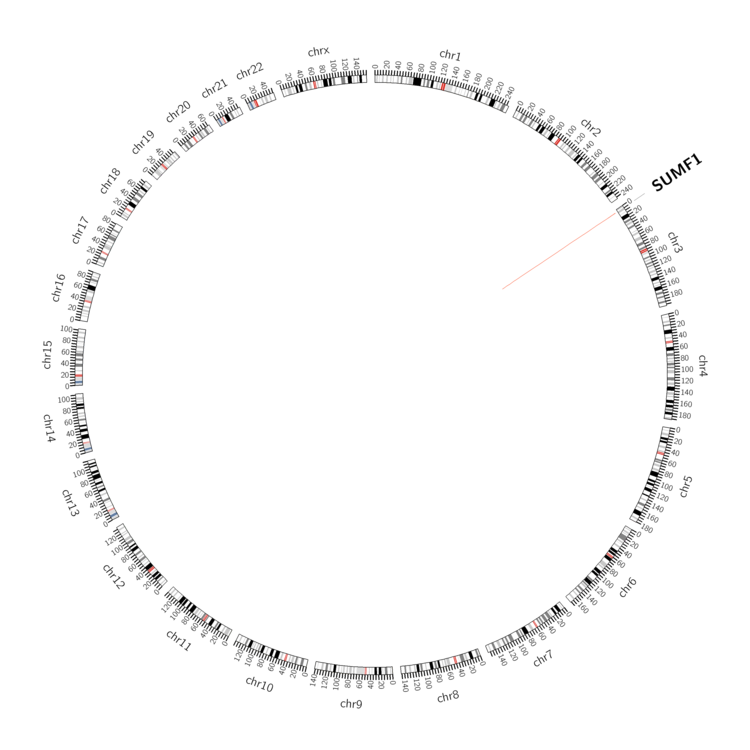 |
| - For Inter-chromosomal Variations |
| There's no inter-chromosomal structural variation. |
| - For Intra-chromosomal Variations |
| * Intra-chromosomal variantions includes 'intrachromosomal amplicon to amplicon', 'intrachromosomal amplicon to non-amplified dna', 'intrachromosomal deletion', 'intrachromosomal fold-back inversion', 'intrachromosomal inversion', 'intrachromosomal tandem duplication', 'Intrachromosomal unknown type', 'intrachromosomal with inverted orientation', 'intrachromosomal with non-inverted orientation'. |
 |
| Sample | Symbol_a | Chr_a | Start_a | End_a | Symbol_b | Chr_b | Start_b | End_b |
| pancreas | SUMF1 | chr3 | 4424404 | 4424424 | chr3 | 4392721 | 4392741 |
| cf) Tissue number; Tissue name (1;Breast, 2;Central_nervous_system, 3;Haematopoietic_and_lymphoid_tissue, 4;Large_intestine, 5;Liver, 6;Lung, 7;Ovary, 8;Pancreas, 9;Prostate, 10;Skin, 11;Soft_tissue, 12;Upper_aerodigestive_tract) |
| * From mRNA Sanger sequences, Chitars2.0 arranged chimeric transcripts. This table shows SUMF1 related fusion information. |
| ID | Head Gene | Tail Gene | Accession | Gene_a | qStart_a | qEnd_a | Chromosome_a | tStart_a | tEnd_a | Gene_a | qStart_a | qEnd_a | Chromosome_a | tStart_a | tEnd_a |
| XX000010 | SUMF1 | 1 | 51 | 3 | 4418013 | 4418063 | LRRFIP2 | 50 | 125 | 3 | 37170566 | 37170641 | |
| AW236721 | SUMF1 | 2 | 141 | 3 | 4402835 | 4402974 | PRPF38B | 138 | 377 | 1 | 109241803 | 109242042 | |
| AI127082 | SUMF1 | 6 | 76 | 3 | 4402831 | 4402901 | SUMF1 | 75 | 297 | 3 | 4402952 | 4403174 | |
| BE831647 | SMAD7 | 7 | 135 | 18 | 46448045 | 46448175 | SUMF1 | 129 | 383 | 3 | 3841494 | 3886191 | |
| AI126937 | SUMF1 | 1 | 71 | 3 | 4402831 | 4402901 | SUMF1 | 70 | 292 | 3 | 4402952 | 4403174 | |
| Top |
| Mutation type/ Tissue ID | brca | cns | cerv | endome | haematopo | kidn | Lintest | liver | lung | ns | ovary | pancre | prost | skin | stoma | thyro | urina | |||
| Total # sample | 5 | 1 | ||||||||||||||||||
| GAIN (# sample) | 3 | |||||||||||||||||||
| LOSS (# sample) | 2 | 1 |
| cf) Tissue ID; Tissue type (1; Breast, 2; Central_nervous_system, 3; Cervix, 4; Endometrium, 5; Haematopoietic_and_lymphoid_tissue, 6; Kidney, 7; Large_intestine, 8; Liver, 9; Lung, 10; NS, 11; Ovary, 12; Pancreas, 13; Prostate, 14; Skin, 15; Stomach, 16; Thyroid, 17; Urinary_tract) |
| Top |
|
 |
| Top |
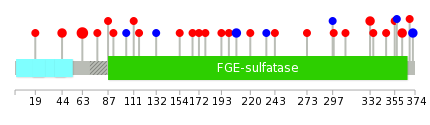
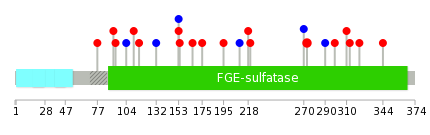
| Stat. for Non-Synonymous SNVs (# total SNVs=23) | (# total SNVs=7) |
 |  |
(# total SNVs=0) | (# total SNVs=0) |
| Top |
| * When you move the cursor on each content, you can see more deailed mutation information on the Tooltip. Those are primary_site,primary_histology,mutation(aa),pubmedID. |
| GRCh37 position | Mutation(aa) | Unique sampleID count |
| chr3:4508742-4508742 | p.S63N | 6 |
| chr3:4418033-4418033 | p.G332E | 2 |
| chr3:4459798-4459798 | p.L207L | 2 |
| chr3:4403829-4403829 | p.*375* | 2 |
| chr3:4403837-4403837 | p.T372T | 2 |
| chr3:4508800-4508800 | p.G44R | 2 |
| chr3:4403869-4403869 | p.G362R | 2 |
| chr3:4403882-4403882 | p.S357S | 1 |
| chr3:4458925-4458925 | p.L243V | 1 |
| chr3:4494608-4494608 | p.S132S | 1 |
| Top |
|
 |
| Point Mutation/ Tissue ID | 1 | 2 | 3 | 4 | 5 | 6 | 7 | 8 | 9 | 10 | 11 | 12 | 13 | 14 | 15 | 16 | 17 | 18 | 19 | 20 |
| # sample | 1 | 1 | 2 | 2 | 1 | 5 | 1 | 5 | 6 | |||||||||||
| # mutation | 1 | 1 | 2 | 2 | 1 | 5 | 1 | 4 | 6 | |||||||||||
| nonsynonymous SNV | 1 | 1 | 2 | 2 | 1 | 4 | 3 | 4 | ||||||||||||
| synonymous SNV | 1 | 1 | 1 | 2 |
| cf) Tissue ID; Tissue type (1; BLCA[Bladder Urothelial Carcinoma], 2; BRCA[Breast invasive carcinoma], 3; CESC[Cervical squamous cell carcinoma and endocervical adenocarcinoma], 4; COAD[Colon adenocarcinoma], 5; GBM[Glioblastoma multiforme], 6; Glioma Low Grade, 7; HNSC[Head and Neck squamous cell carcinoma], 8; KICH[Kidney Chromophobe], 9; KIRC[Kidney renal clear cell carcinoma], 10; KIRP[Kidney renal papillary cell carcinoma], 11; LAML[Acute Myeloid Leukemia], 12; LUAD[Lung adenocarcinoma], 13; LUSC[Lung squamous cell carcinoma], 14; OV[Ovarian serous cystadenocarcinoma ], 15; PAAD[Pancreatic adenocarcinoma], 16; PRAD[Prostate adenocarcinoma], 17; SKCM[Skin Cutaneous Melanoma], 18:STAD[Stomach adenocarcinoma], 19:THCA[Thyroid carcinoma], 20:UCEC[Uterine Corpus Endometrial Carcinoma]) |
| Top |
| * We represented just top 10 SNVs. When you move the cursor on each content, you can see more deailed mutation information on the Tooltip. Those are primary_site, primary_histology, mutation(aa), pubmedID. |
| Genomic Position | Mutation(aa) | Unique sampleID count |
| chr3:4452611 | p.A273T,SUMF1 | 2 |
| chr3:4418058 | p.G299W,SUMF1 | 1 |
| chr3:4491009 | p.D104D,SUMF1 | 1 |
| chr3:4452558 | p.T290T,SUMF1 | 1 |
| chr3:4491010 | p.I94V,SUMF1 | 1 |
| chr3:4494608 | p.V92F,SUMF1 | 1 |
| chr3:4452618 | p.V270V,SUMF1 | 1 |
| chr3:4494657 | p.P77A,SUMF1 | 1 |
| chr3:4458918 | p.P220R,SUMF1 | 1 |
| chr3:4494673 | p.L218V,SUMF1 | 1 |
| * Copy number data were extracted from TCGA using R package TCGA-Assembler. The URLs of all public data files on TCGA DCC data server were gathered on Jan-05-2015. Function ProcessCNAData in TCGA-Assembler package was used to obtain gene-level copy number value which is calculated as the average copy number of the genomic region of a gene. |
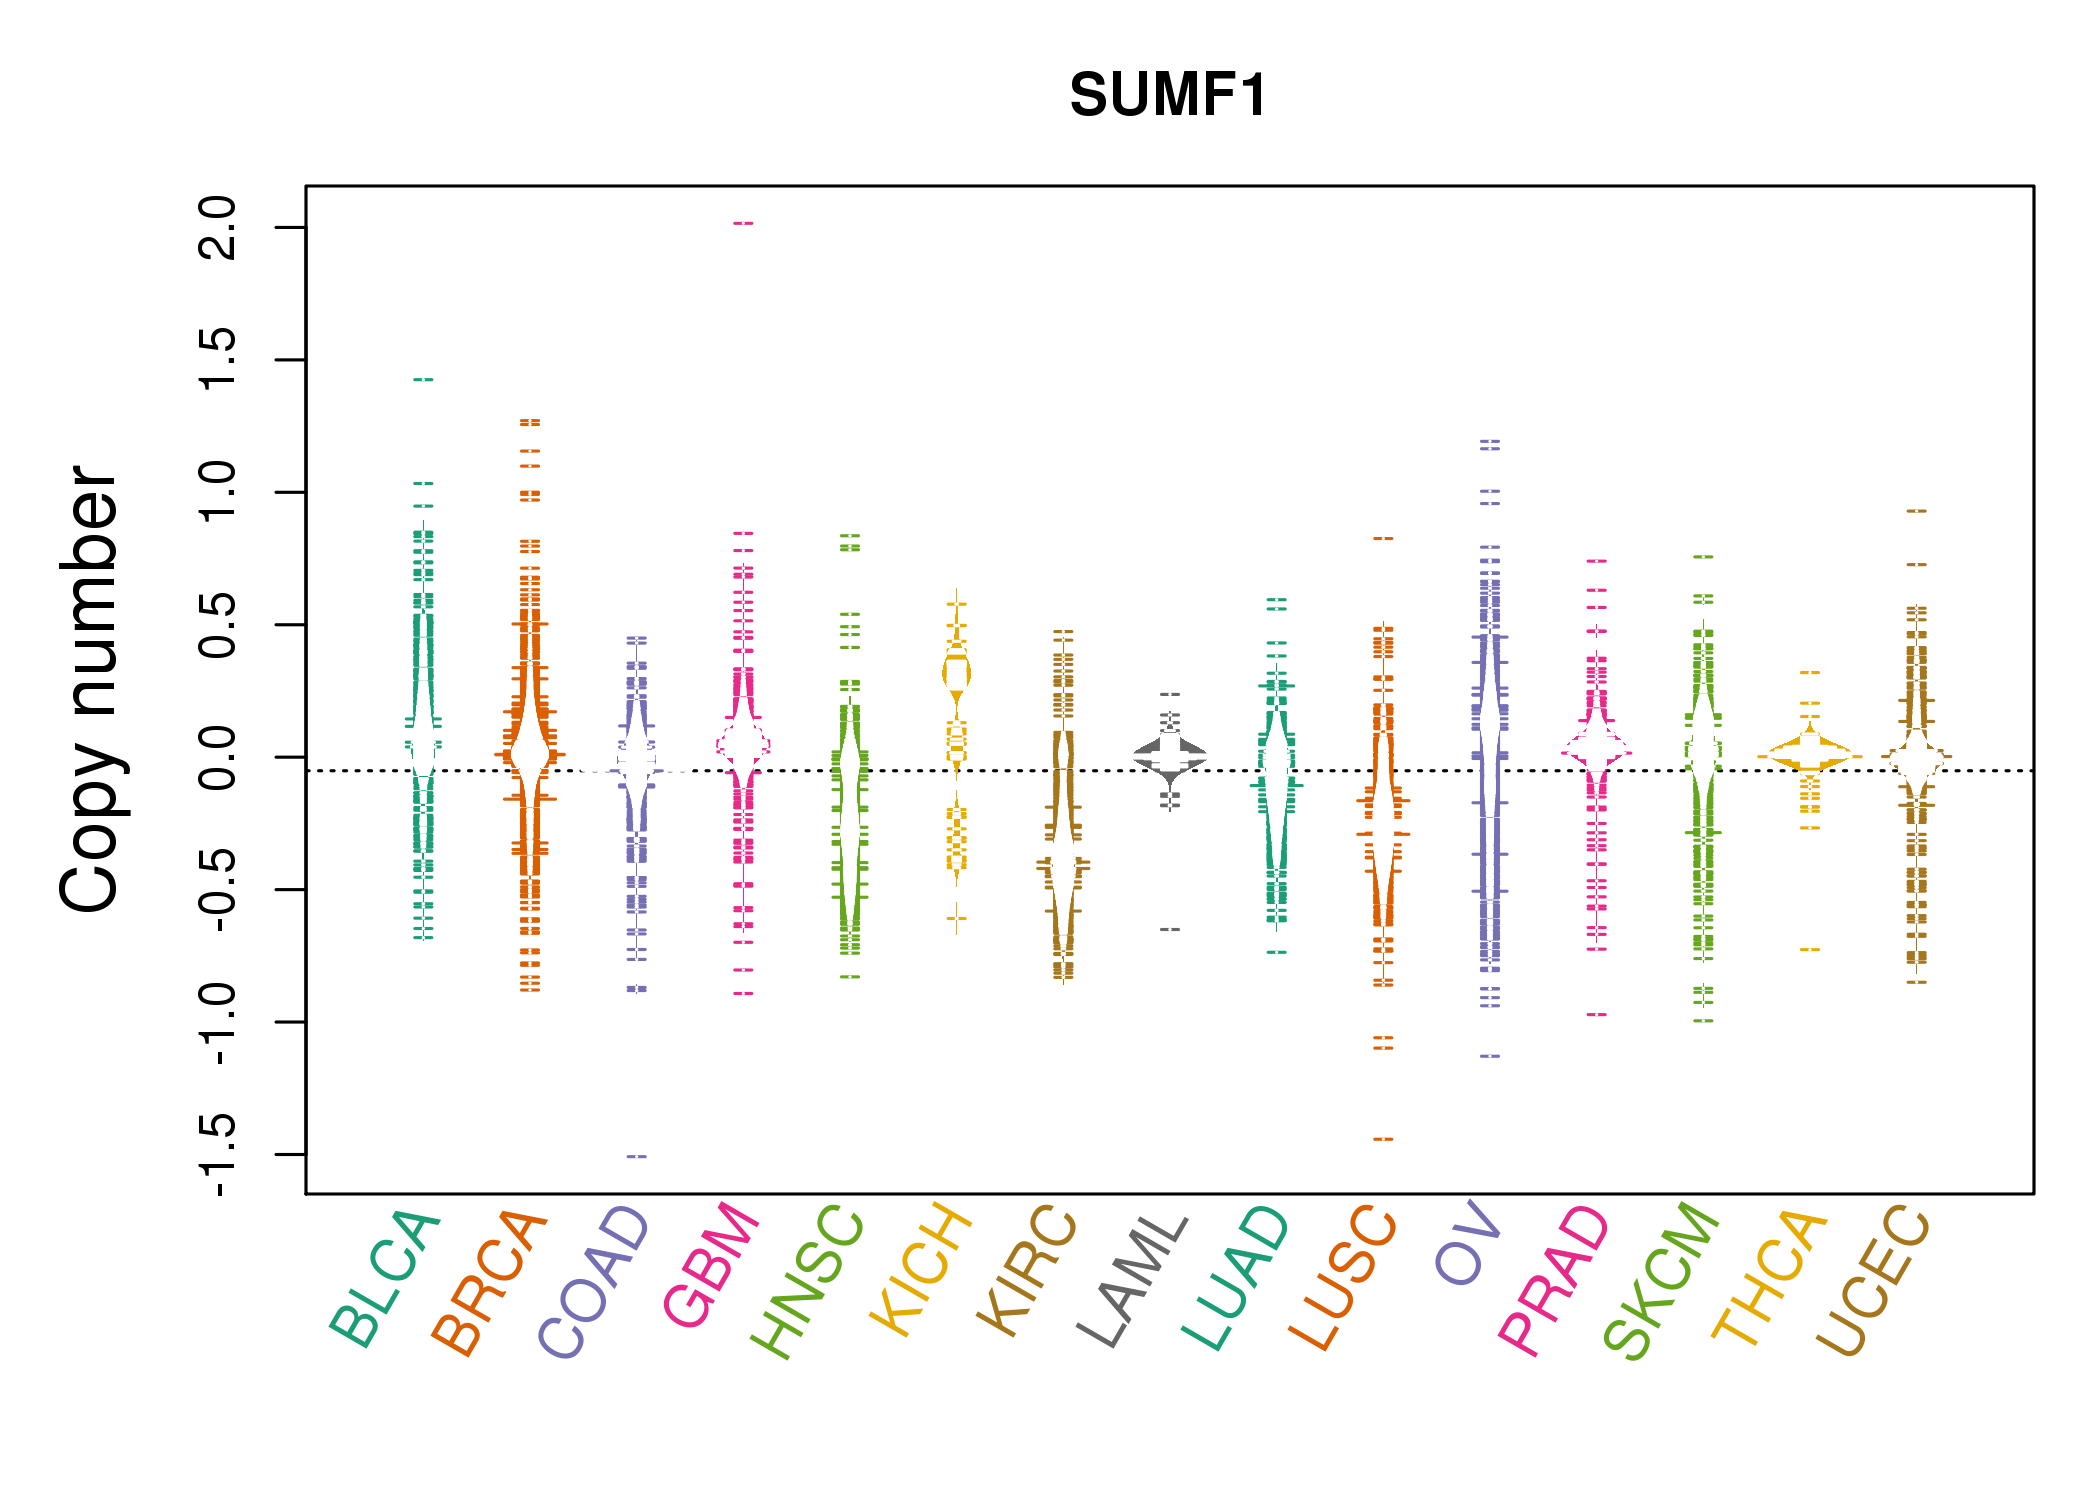 |
| cf) Tissue ID[Tissue type]: BLCA[Bladder Urothelial Carcinoma], BRCA[Breast invasive carcinoma], CESC[Cervical squamous cell carcinoma and endocervical adenocarcinoma], COAD[Colon adenocarcinoma], GBM[Glioblastoma multiforme], Glioma Low Grade, HNSC[Head and Neck squamous cell carcinoma], KICH[Kidney Chromophobe], KIRC[Kidney renal clear cell carcinoma], KIRP[Kidney renal papillary cell carcinoma], LAML[Acute Myeloid Leukemia], LUAD[Lung adenocarcinoma], LUSC[Lung squamous cell carcinoma], OV[Ovarian serous cystadenocarcinoma ], PAAD[Pancreatic adenocarcinoma], PRAD[Prostate adenocarcinoma], SKCM[Skin Cutaneous Melanoma], STAD[Stomach adenocarcinoma], THCA[Thyroid carcinoma], UCEC[Uterine Corpus Endometrial Carcinoma] |
| Top |
| Gene Expression for SUMF1 |
| * CCLE gene expression data were extracted from CCLE_Expression_Entrez_2012-10-18.res: Gene-centric RMA-normalized mRNA expression data. |
 |
| * Normalized gene expression data of RNASeqV2 was extracted from TCGA using R package TCGA-Assembler. The URLs of all public data files on TCGA DCC data server were gathered at Jan-05-2015. Only eight cancer types have enough normal control samples for differential expression analysis. (t test, adjusted p<0.05 (using Benjamini-Hochberg FDR)) |
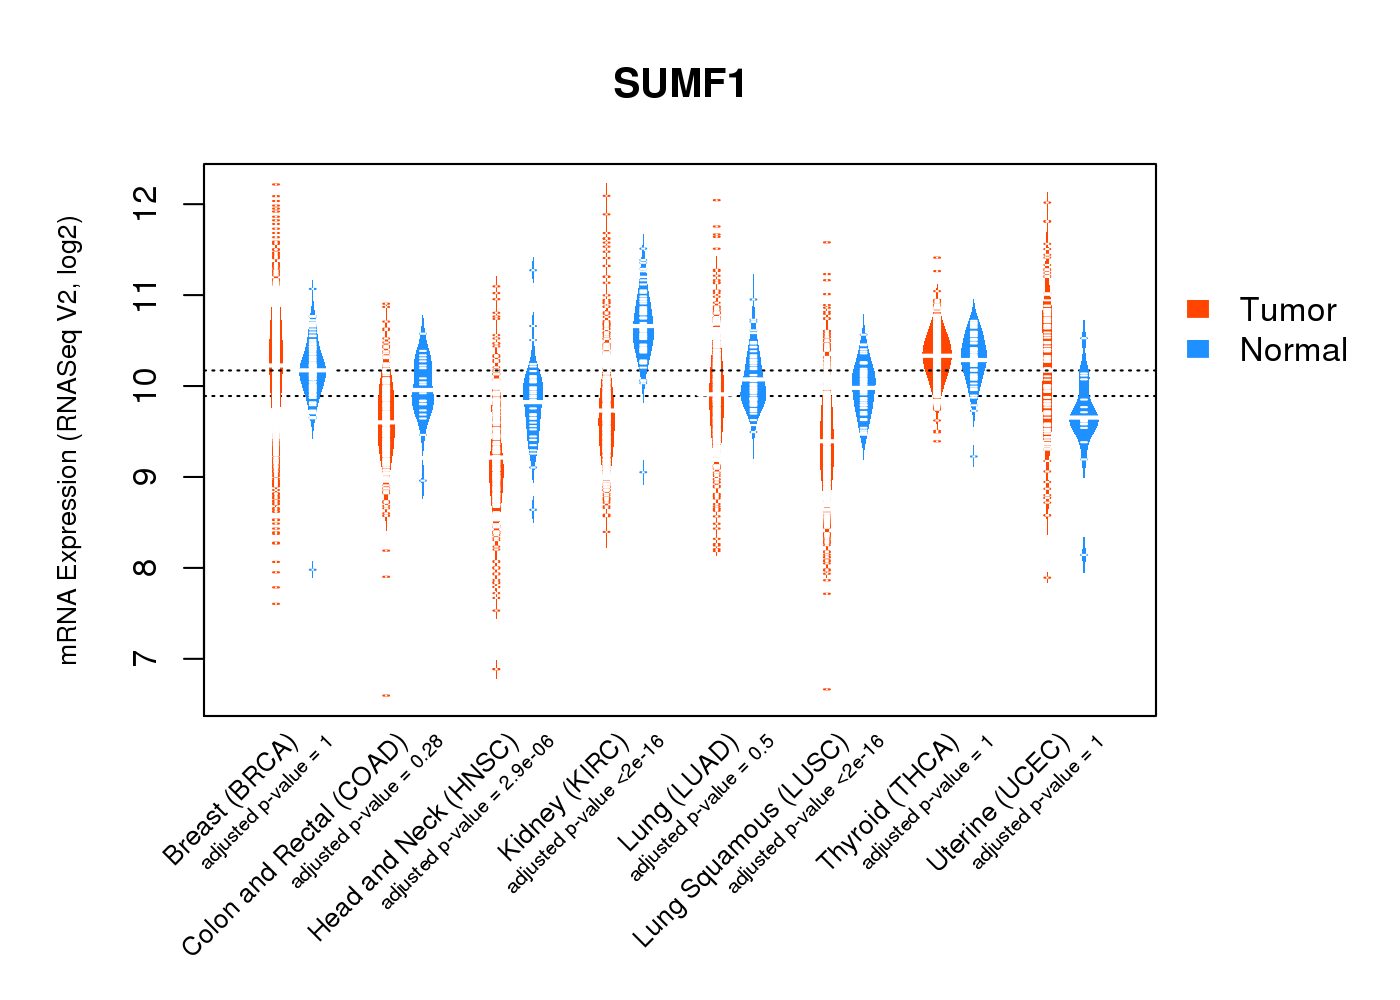 |
| Top |
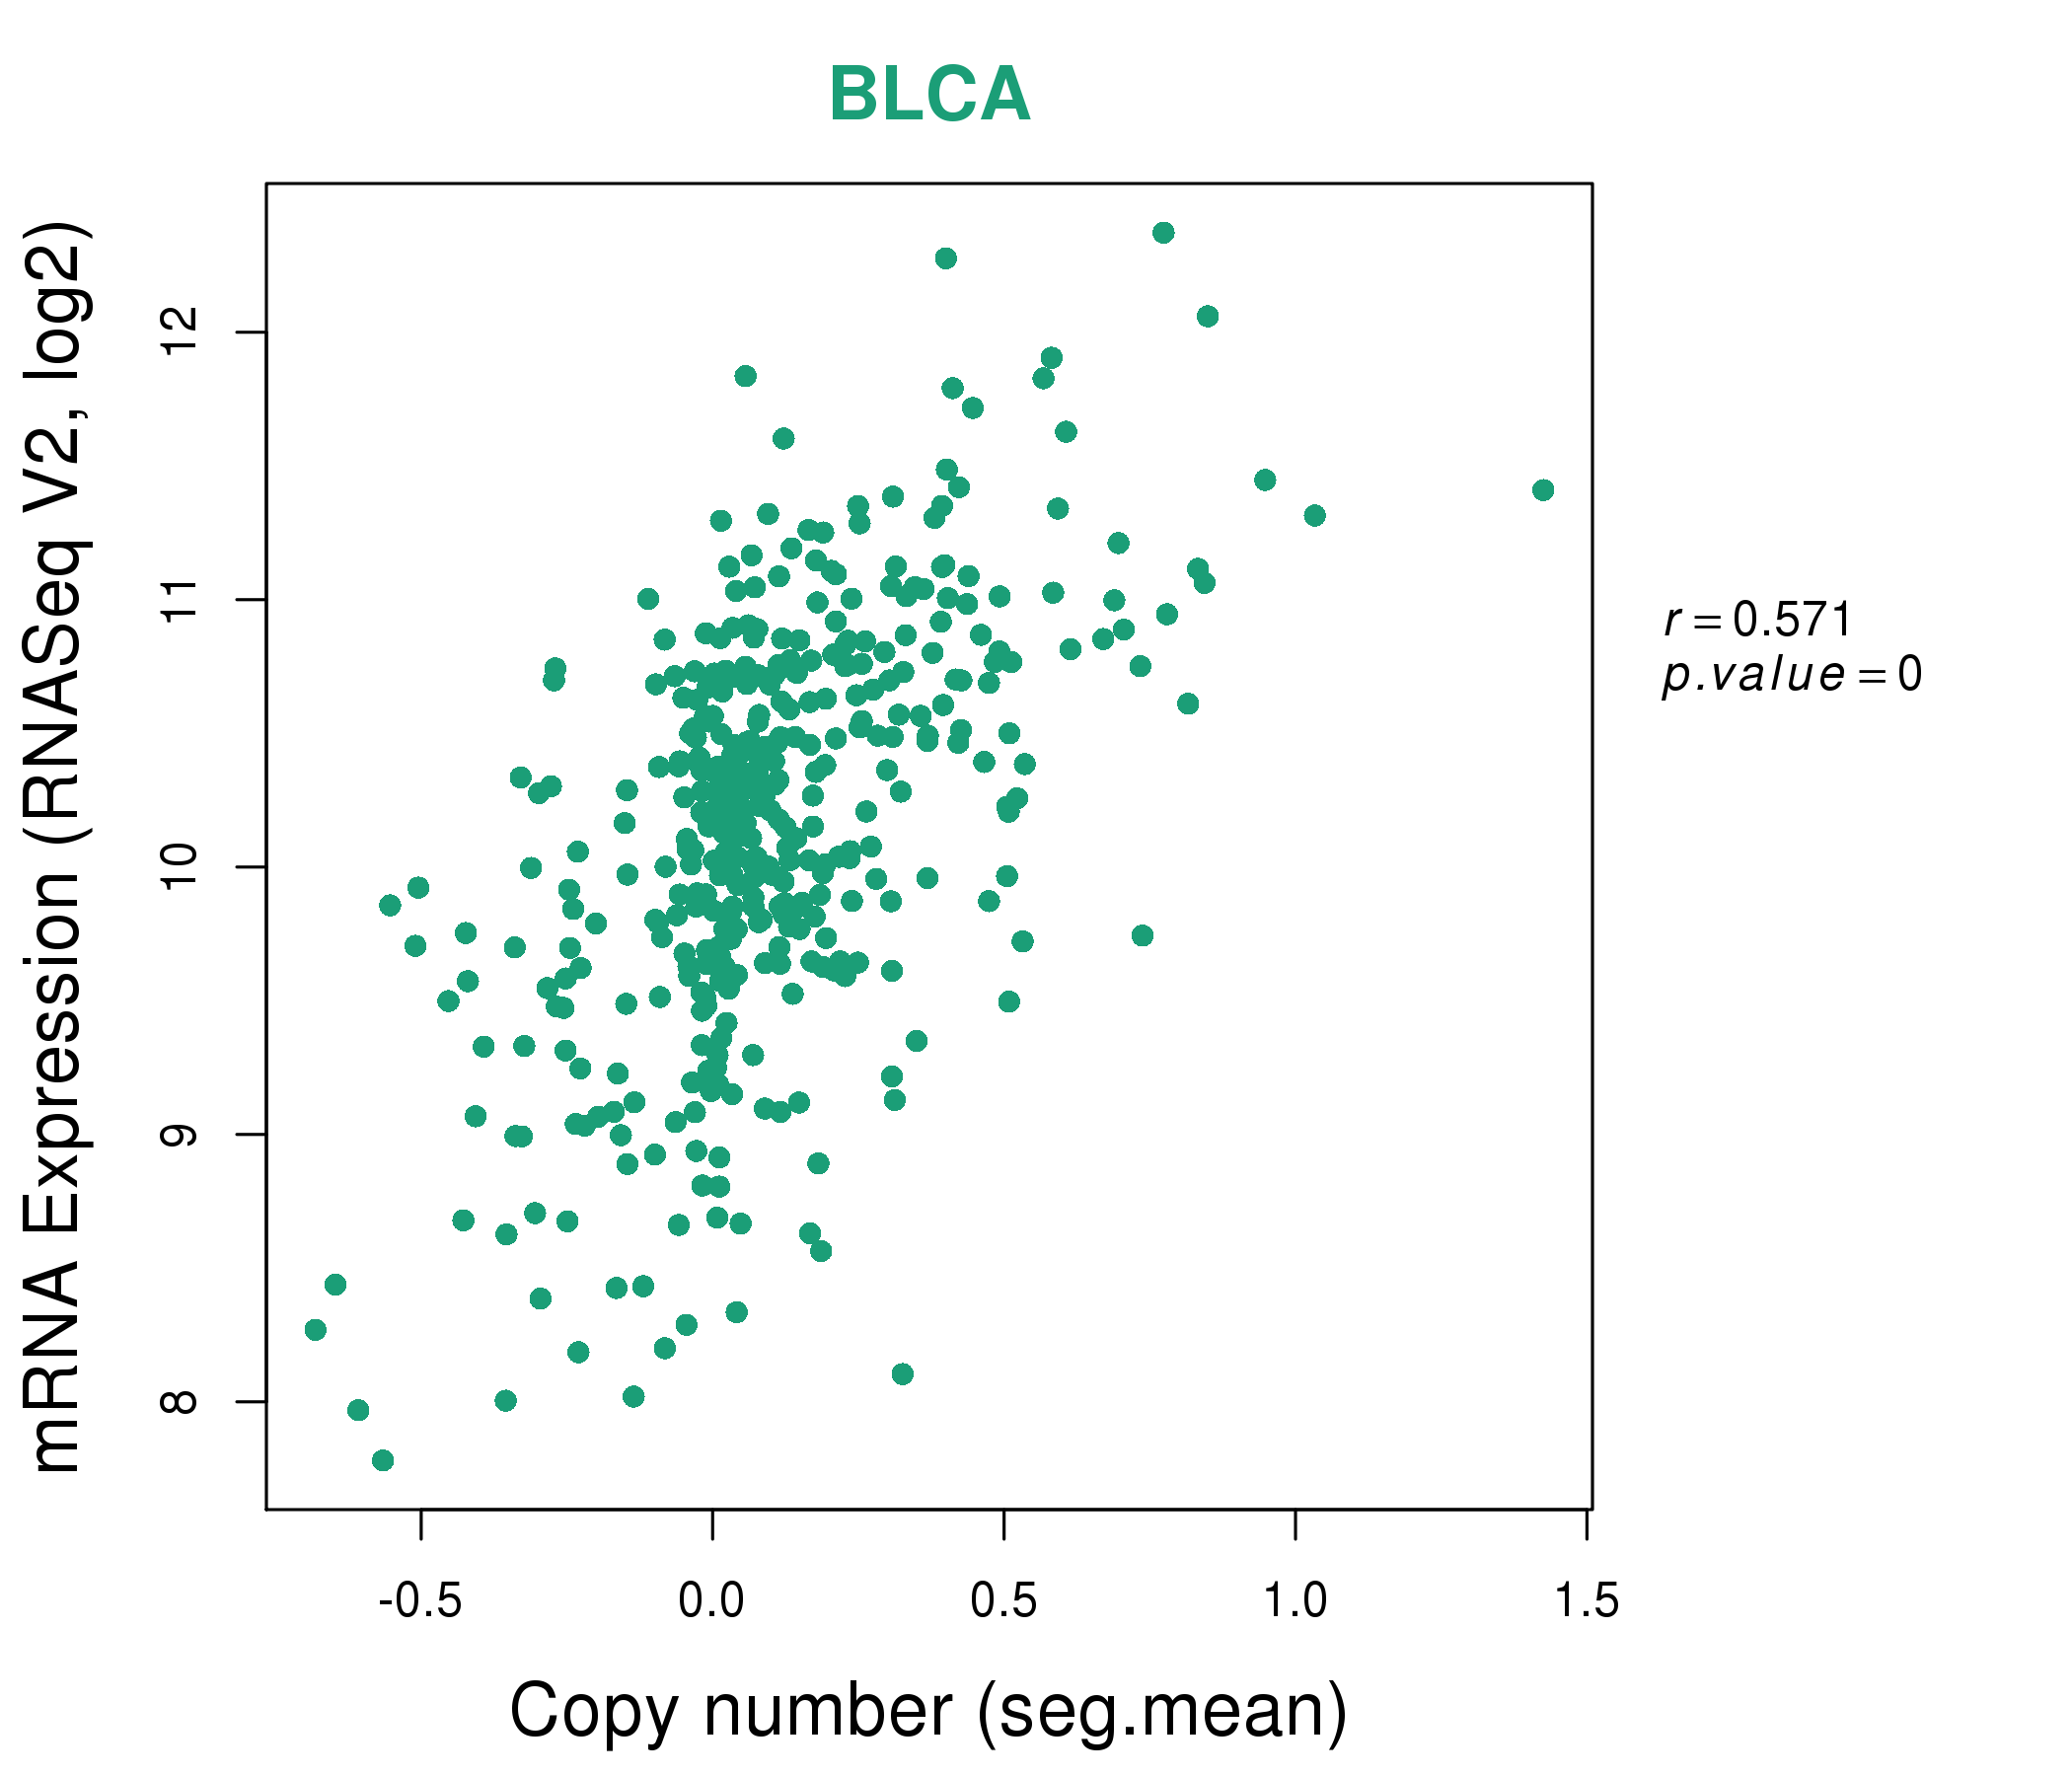
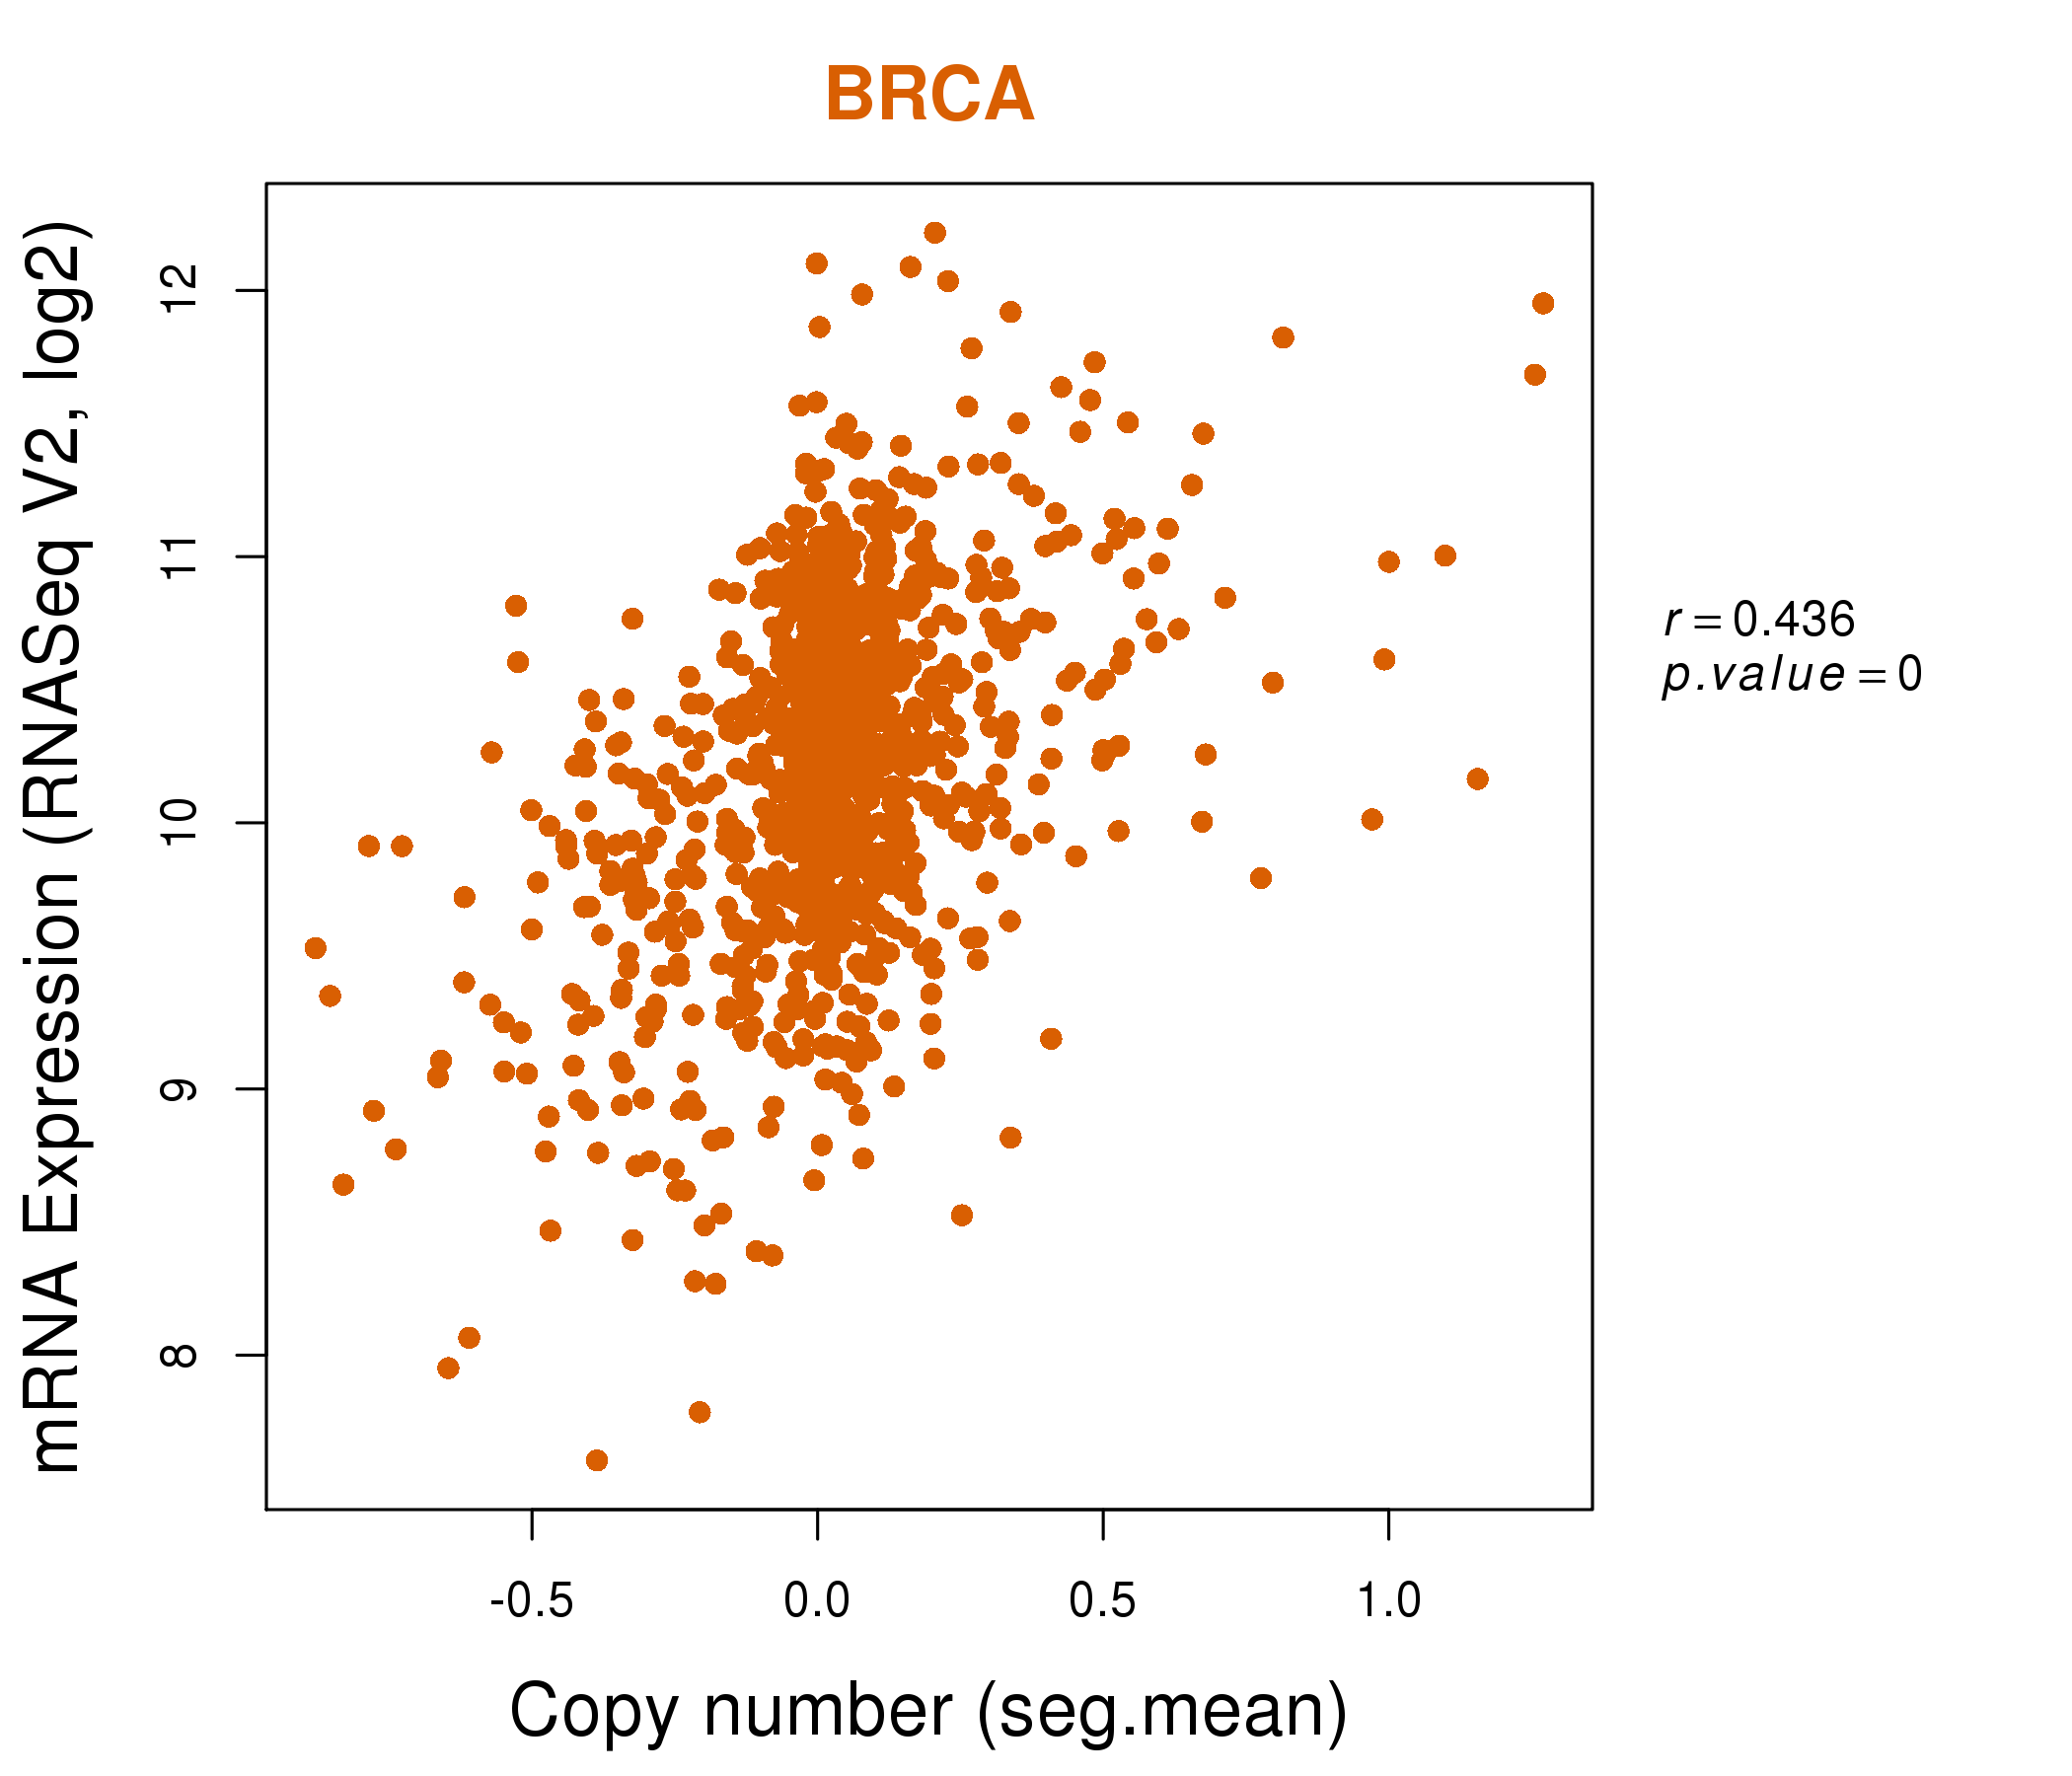
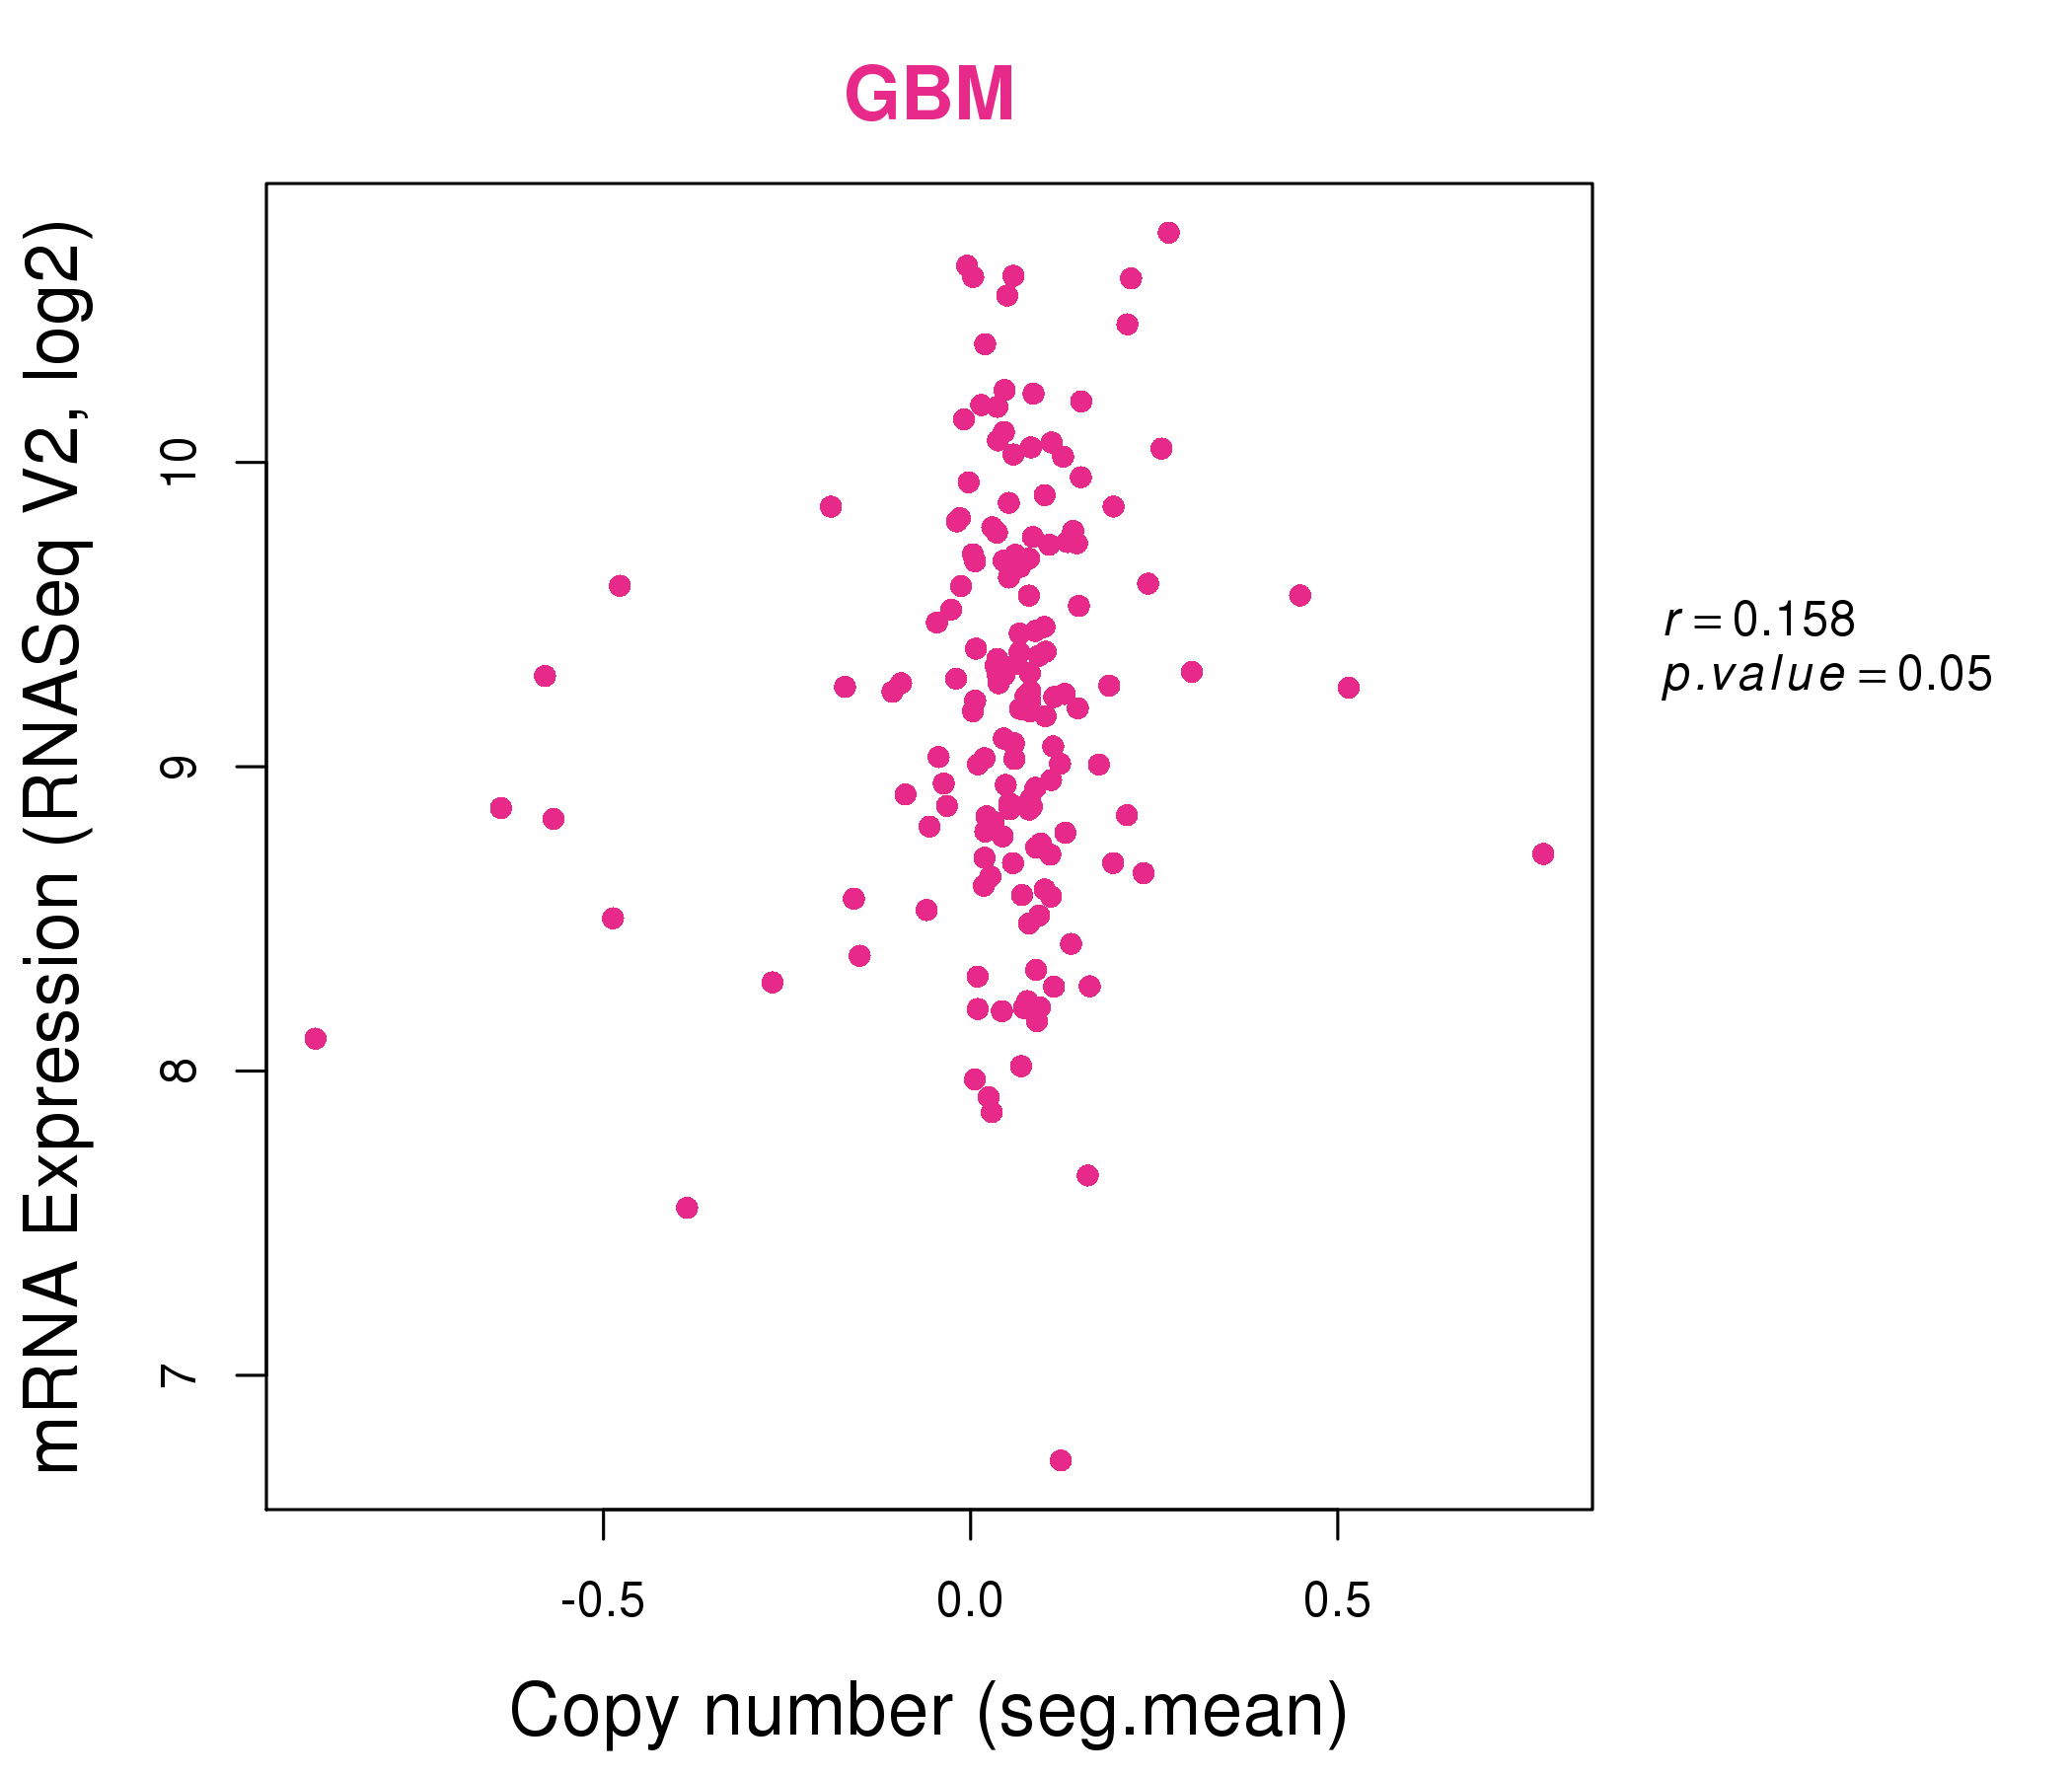
| * This plots show the correlation between CNV and gene expression. |
: Open all plots for all cancer types
 |
|
 |
|
| Top |
| Gene-Gene Network Information |
| * Co-Expression network figures were drawn using R package igraph. Only the top 20 genes with the highest correlations were shown. Red circle: input gene, orange circle: cell metabolism gene, sky circle: other gene |
: Open all plots for all cancer types
 |
|
| ACOT4,ALG1,ARL8B,BCDIN3D,BTD,CCDC103,COQ7, EARS2,FAM134A,FAM134C,G6PC3,HMGCL,HSD17B8,ZNF205-AS1, ORAI3,PIGV,RBKS,SUMF1,TMBIM6,TMEM9B,TTC39A | CHTF8,CLPTM1L,CYB5D2,GBA,LAMP1,LHPP,MFSD5, ORMDL2,PDZD11,POLR2G,PPCS,RPN1,SCAMP2,SUMF1, TM2D2,TM9SF1,TMEM127,TOR1A,TRAPPC3,TSPAN31,UFC1 |
 |
|
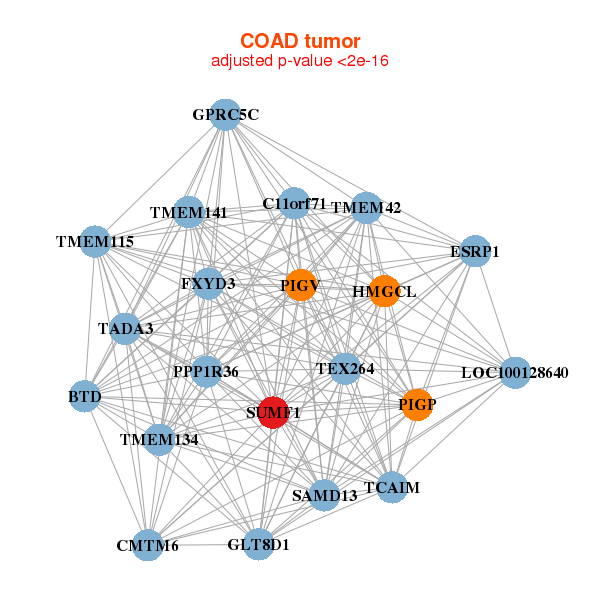
| BTD,C11orf71,PPP1R36,TCAIM,CMTM6,ESRP1,FXYD3, GLT8D1,GPRC5C,HMGCL,LOC100128640,PIGP,PIGV,SAMD13, SUMF1,TADA3,TEX264,TMEM115,TMEM134,TMEM141,TMEM42 | ADCK2,PROSER2,TMEM246,C9orf152,CWH43,FOXA1,FOXD2, FRAT2,IMPA2,KREMEN1,LRRC31,MAZ,MTL5,MYCL, PABPC1,PPP1R1B,QARS,SFT2D3,SMAGP,SUMF1,TMEM44 |
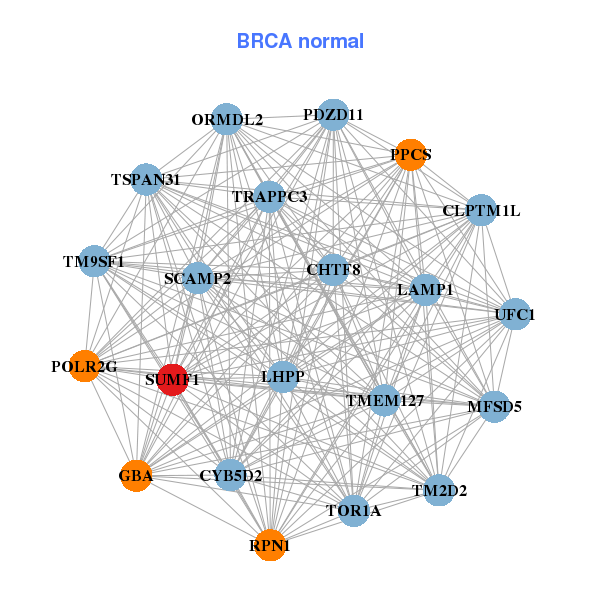
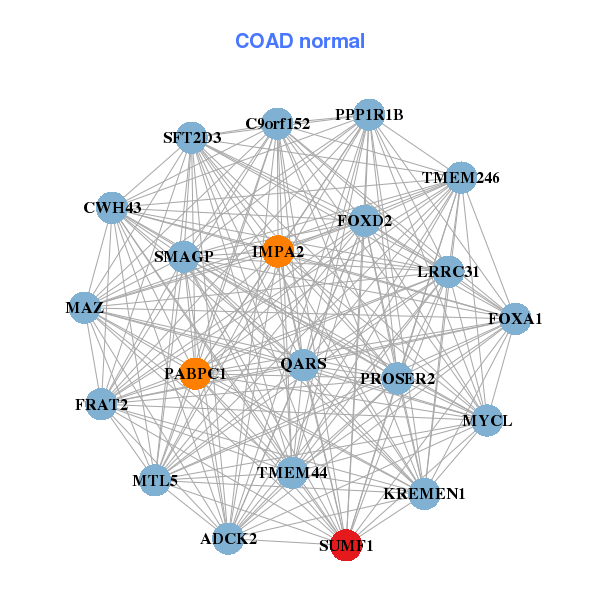
| * Co-Expression network figures were drawn using R package igraph. Only the top 20 genes with the highest correlations were shown. Red circle: input gene, orange circle: cell metabolism gene, sky circle: other gene |
: Open all plots for all cancer types
| Top |
: Open all interacting genes' information including KEGG pathway for all interacting genes from DAVID
| Top |
| Pharmacological Information for SUMF1 |
| There's no related Drug. |
| Top |
| Cross referenced IDs for SUMF1 |
| * We obtained these cross-references from Uniprot database. It covers 150 different DBs, 18 categories. http://www.uniprot.org/help/cross_references_section |
: Open all cross reference information
|
Copyright © 2016-Present - The Univsersity of Texas Health Science Center at Houston @ |