|
||||||||||||||||||||
| |
| Phenotypic Information (metabolism pathway, cancer, disease, phenome) |
| |
| |
| Gene-Gene Network Information: Co-Expression Network, Interacting Genes & KEGG |
| |
|


| Gene Summary for FFAR1 |
| Basic gene info. | Gene symbol | FFAR1 |
| Gene name | free fatty acid receptor 1 | |
| Synonyms | FFA1R|GPCR40|GPR40 | |
| Cytomap | UCSC genome browser: 19q13.1 | |
| Genomic location | chr19 :35842444-35843367 | |
| Type of gene | protein-coding | |
| RefGenes | NM_005303.2, | |
| Ensembl id | ENSG00000126266 | |
| Description | G protein-coupled receptor 40G-protein coupled receptor 40 | |
| Modification date | 20141207 | |
| dbXrefs | MIM : 603820 | |
| HGNC : HGNC | ||
| HPRD : 04822 | ||
| Protein | UniProt: go to UniProt's Cross Reference DB Table | |
| Expression | CleanEX: HS_FFAR1 | |
| BioGPS: 2864 | ||
| Gene Expression Atlas: ENSG00000126266 | ||
| The Human Protein Atlas: ENSG00000126266 | ||
| Pathway | NCI Pathway Interaction Database: FFAR1 | |
| KEGG: FFAR1 | ||
| REACTOME: FFAR1 | ||
| ConsensusPathDB | ||
| Pathway Commons: FFAR1 | ||
| Metabolism | MetaCyc: FFAR1 | |
| HUMANCyc: FFAR1 | ||
| Regulation | Ensembl's Regulation: ENSG00000126266 | |
| miRBase: chr19 :35,842,444-35,843,367 | ||
| TargetScan: NM_005303 | ||
| cisRED: ENSG00000126266 | ||
| Context | iHOP: FFAR1 | |
| cancer metabolism search in PubMed: FFAR1 | ||
| UCL Cancer Institute: FFAR1 | ||
| Assigned class in ccmGDB | C | |
| Top |
| Phenotypic Information for FFAR1(metabolism pathway, cancer, disease, phenome) |
| Cancer | CGAP: FFAR1 |
| Familial Cancer Database: FFAR1 | |
| * This gene is included in those cancer gene databases. |
|
|
|
|
|
|
| ||||||||||||||
Oncogene 1 | Significant driver gene in | |||||||||||||||||||
| cf) number; DB name 1 Oncogene; http://nar.oxfordjournals.org/content/35/suppl_1/D721.long, 2 Tumor Suppressor gene; https://bioinfo.uth.edu/TSGene/, 3 Cancer Gene Census; http://www.nature.com/nrc/journal/v4/n3/abs/nrc1299.html, 4 CancerGenes; http://nar.oxfordjournals.org/content/35/suppl_1/D721.long, 5 Network of Cancer Gene; http://ncg.kcl.ac.uk/index.php, 1Therapeutic Vulnerabilities in Cancer; http://cbio.mskcc.org/cancergenomics/statius/ |
| REACTOME_INTEGRATION_OF_ENERGY_METABOLISM | |
| OMIM | |
| Orphanet | |
| Disease | KEGG Disease: FFAR1 |
| MedGen: FFAR1 (Human Medical Genetics with Condition) | |
| ClinVar: FFAR1 | |
| Phenotype | MGI: FFAR1 (International Mouse Phenotyping Consortium) |
| PhenomicDB: FFAR1 | |
| Mutations for FFAR1 |
| * Under tables are showing count per each tissue to give us broad intuition about tissue specific mutation patterns.You can go to the detailed page for each mutation database's web site. |
| There's no structural variation information in COSMIC data for this gene. |
| * From mRNA Sanger sequences, Chitars2.0 arranged chimeric transcripts. This table shows FFAR1 related fusion information. |
| ID | Head Gene | Tail Gene | Accession | Gene_a | qStart_a | qEnd_a | Chromosome_a | tStart_a | tEnd_a | Gene_a | qStart_a | qEnd_a | Chromosome_a | tStart_a | tEnd_a |
| Top |
| There's no copy number variation information in COSMIC data for this gene. |
| Top |
|
 |
| Top |
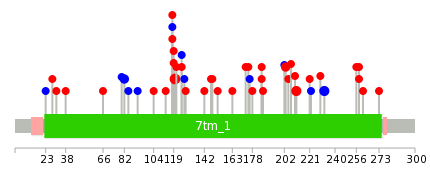
| Stat. for Non-Synonymous SNVs (# total SNVs=25) | (# total SNVs=10) |
 |  |
(# total SNVs=0) | (# total SNVs=0) |
| Top |
| * When you move the cursor on each content, you can see more deailed mutation information on the Tooltip. Those are primary_site,primary_histology,mutation(aa),pubmedID. |
| GRCh37 position | Mutation(aa) | Unique sampleID count |
| chr19:35842813-35842813 | p.P120L | 4 |
| chr19:35843150-35843150 | p.T232T | 3 |
| chr19:35843086-35843086 | p.R211H | 3 |
| chr19:35843061-35843061 | p.V203M | 2 |
| chr19:35842700-35842700 | p.F82F | 2 |
| chr19:35842987-35842987 | p.S178F | 1 |
| chr19:35843115-35843115 | p.R221W | 1 |
| chr19:35842765-35842765 | p.R104H | 1 |
| chr19:35842835-35842835 | p.C127C | 1 |
| chr19:35843007-35843007 | p.S185G | 1 |
| Top |
|
 |
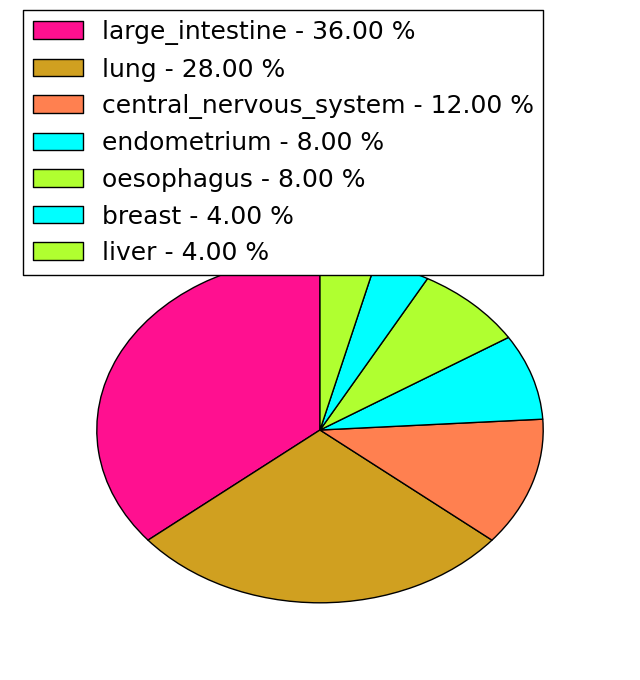
| Point Mutation/ Tissue ID | 1 | 2 | 3 | 4 | 5 | 6 | 7 | 8 | 9 | 10 | 11 | 12 | 13 | 14 | 15 | 16 | 17 | 18 | 19 | 20 |
| # sample | 2 | 5 | 1 | 1 | 1 | 5 | 5 | 2 | 3 | |||||||||||
| # mutation | 2 | 5 | 1 | 1 | 1 | 5 | 6 | 2 | 3 | |||||||||||
| nonsynonymous SNV | 1 | 3 | 1 | 1 | 5 | 5 | 2 | 2 | ||||||||||||
| synonymous SNV | 1 | 2 | 1 | 1 | 1 |
| cf) Tissue ID; Tissue type (1; BLCA[Bladder Urothelial Carcinoma], 2; BRCA[Breast invasive carcinoma], 3; CESC[Cervical squamous cell carcinoma and endocervical adenocarcinoma], 4; COAD[Colon adenocarcinoma], 5; GBM[Glioblastoma multiforme], 6; Glioma Low Grade, 7; HNSC[Head and Neck squamous cell carcinoma], 8; KICH[Kidney Chromophobe], 9; KIRC[Kidney renal clear cell carcinoma], 10; KIRP[Kidney renal papillary cell carcinoma], 11; LAML[Acute Myeloid Leukemia], 12; LUAD[Lung adenocarcinoma], 13; LUSC[Lung squamous cell carcinoma], 14; OV[Ovarian serous cystadenocarcinoma ], 15; PAAD[Pancreatic adenocarcinoma], 16; PRAD[Prostate adenocarcinoma], 17; SKCM[Skin Cutaneous Melanoma], 18:STAD[Stomach adenocarcinoma], 19:THCA[Thyroid carcinoma], 20:UCEC[Uterine Corpus Endometrial Carcinoma]) |
| Top |
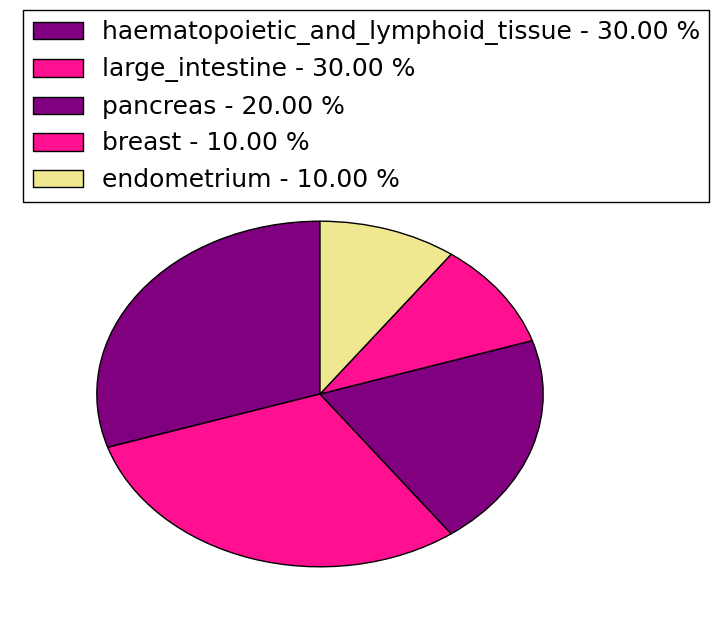
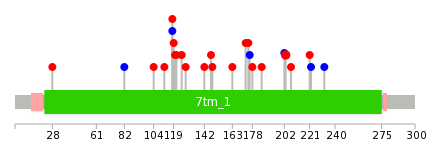
| * We represented just top 10 SNVs. When you move the cursor on each content, you can see more deailed mutation information on the Tooltip. Those are primary_site, primary_histology, mutation(aa), pubmedID. |
| Genomic Position | Mutation(aa) | Unique sampleID count |
| chr19:35843061 | p.V203M | 2 |
| chr19:35842828 | p.G148E | 1 |
| chr19:35843060 | p.P163L | 1 |
| chr19:35842837 | p.A173T | 1 |
| chr19:35842536 | p.D175Y | 1 |
| chr19:35842879 | p.R28G | 1 |
| chr19:35843074 | p.P176P | 1 |
| chr19:35842700 | p.F82F | 1 |
| chr19:35842894 | p.S178C | 1 |
| chr19:35843115 | p.R104H | 1 |
| * Copy number data were extracted from TCGA using R package TCGA-Assembler. The URLs of all public data files on TCGA DCC data server were gathered on Jan-05-2015. Function ProcessCNAData in TCGA-Assembler package was used to obtain gene-level copy number value which is calculated as the average copy number of the genomic region of a gene. |
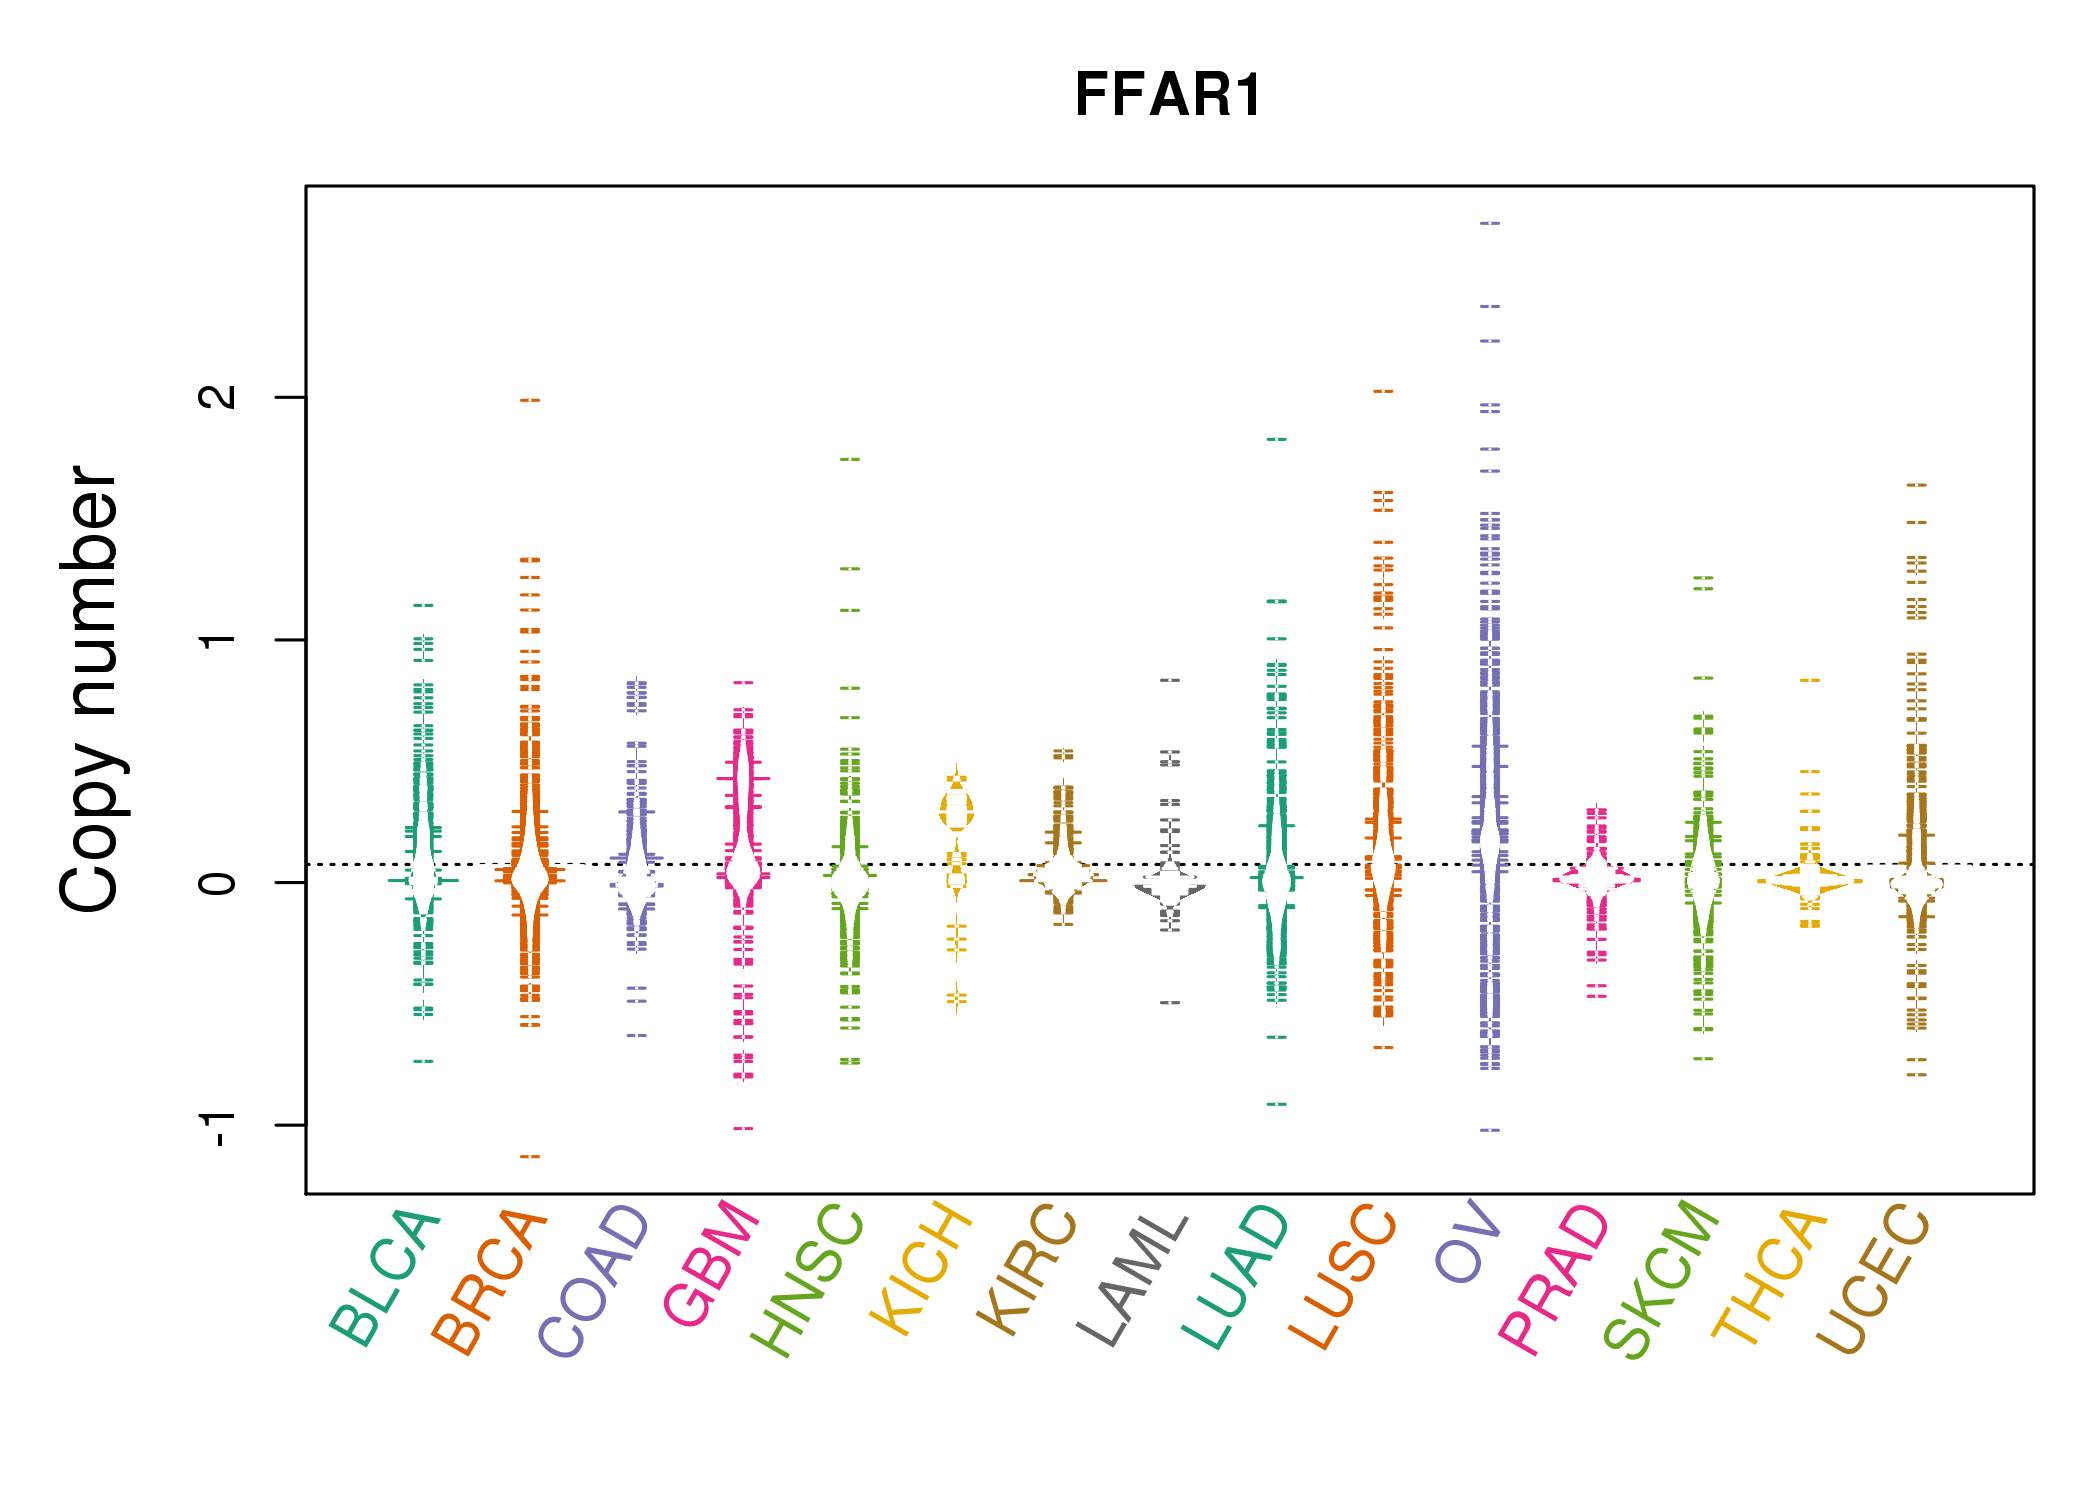 |
| cf) Tissue ID[Tissue type]: BLCA[Bladder Urothelial Carcinoma], BRCA[Breast invasive carcinoma], CESC[Cervical squamous cell carcinoma and endocervical adenocarcinoma], COAD[Colon adenocarcinoma], GBM[Glioblastoma multiforme], Glioma Low Grade, HNSC[Head and Neck squamous cell carcinoma], KICH[Kidney Chromophobe], KIRC[Kidney renal clear cell carcinoma], KIRP[Kidney renal papillary cell carcinoma], LAML[Acute Myeloid Leukemia], LUAD[Lung adenocarcinoma], LUSC[Lung squamous cell carcinoma], OV[Ovarian serous cystadenocarcinoma ], PAAD[Pancreatic adenocarcinoma], PRAD[Prostate adenocarcinoma], SKCM[Skin Cutaneous Melanoma], STAD[Stomach adenocarcinoma], THCA[Thyroid carcinoma], UCEC[Uterine Corpus Endometrial Carcinoma] |
| Top |
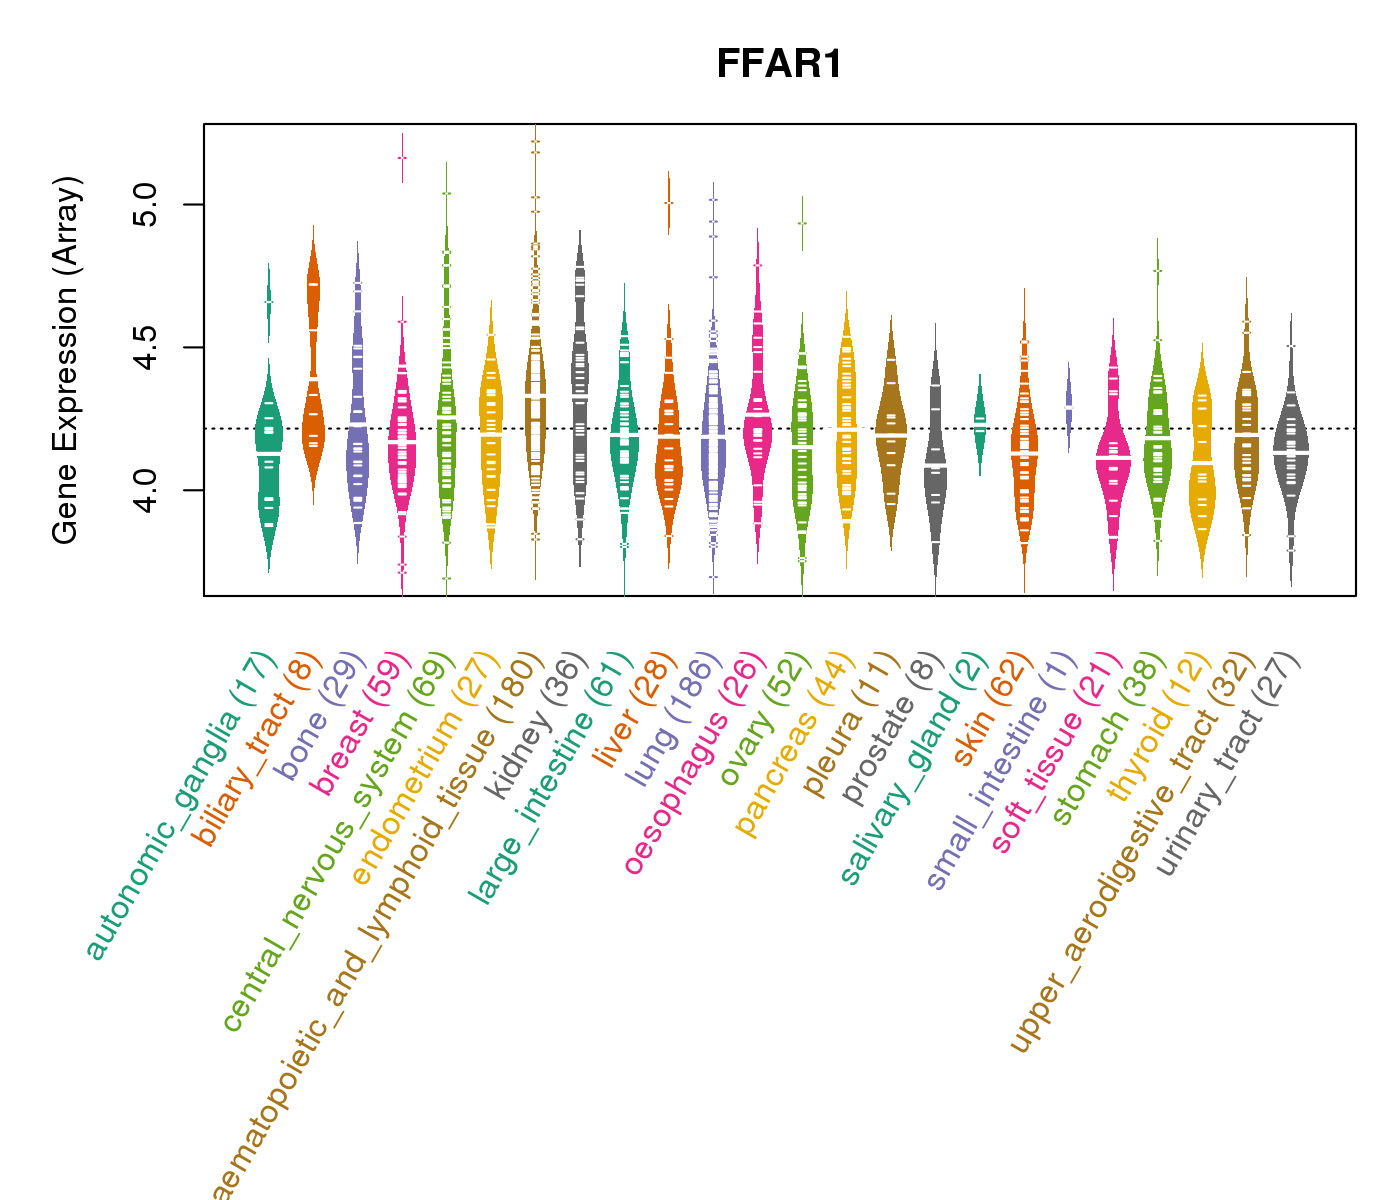
| Gene Expression for FFAR1 |
| * CCLE gene expression data were extracted from CCLE_Expression_Entrez_2012-10-18.res: Gene-centric RMA-normalized mRNA expression data. |
 |
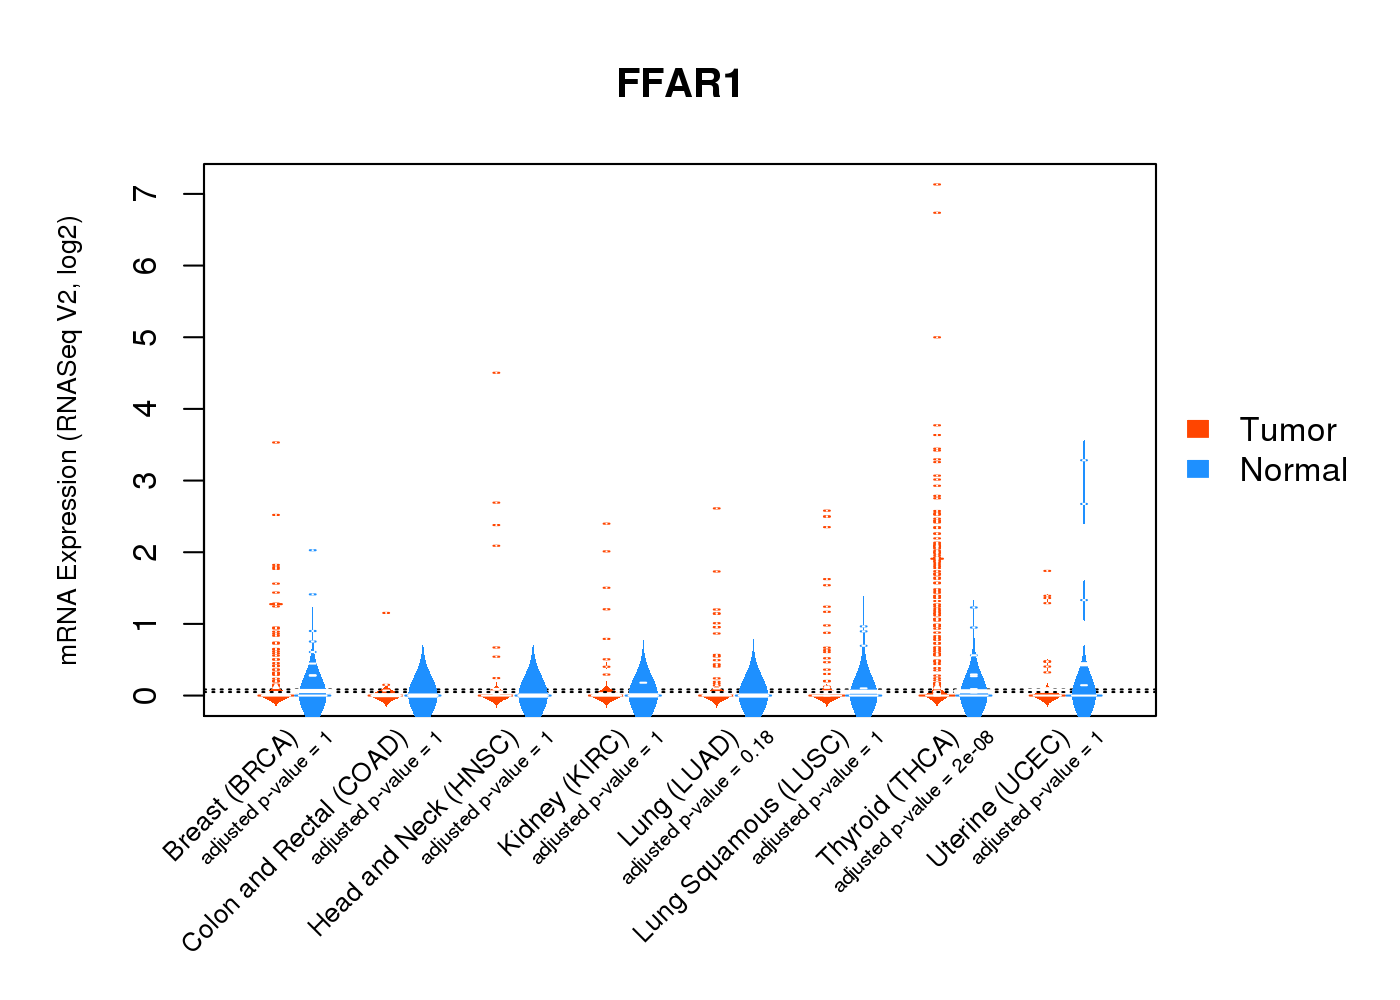
| * Normalized gene expression data of RNASeqV2 was extracted from TCGA using R package TCGA-Assembler. The URLs of all public data files on TCGA DCC data server were gathered at Jan-05-2015. Only eight cancer types have enough normal control samples for differential expression analysis. (t test, adjusted p<0.05 (using Benjamini-Hochberg FDR)) |
 |
| Top |
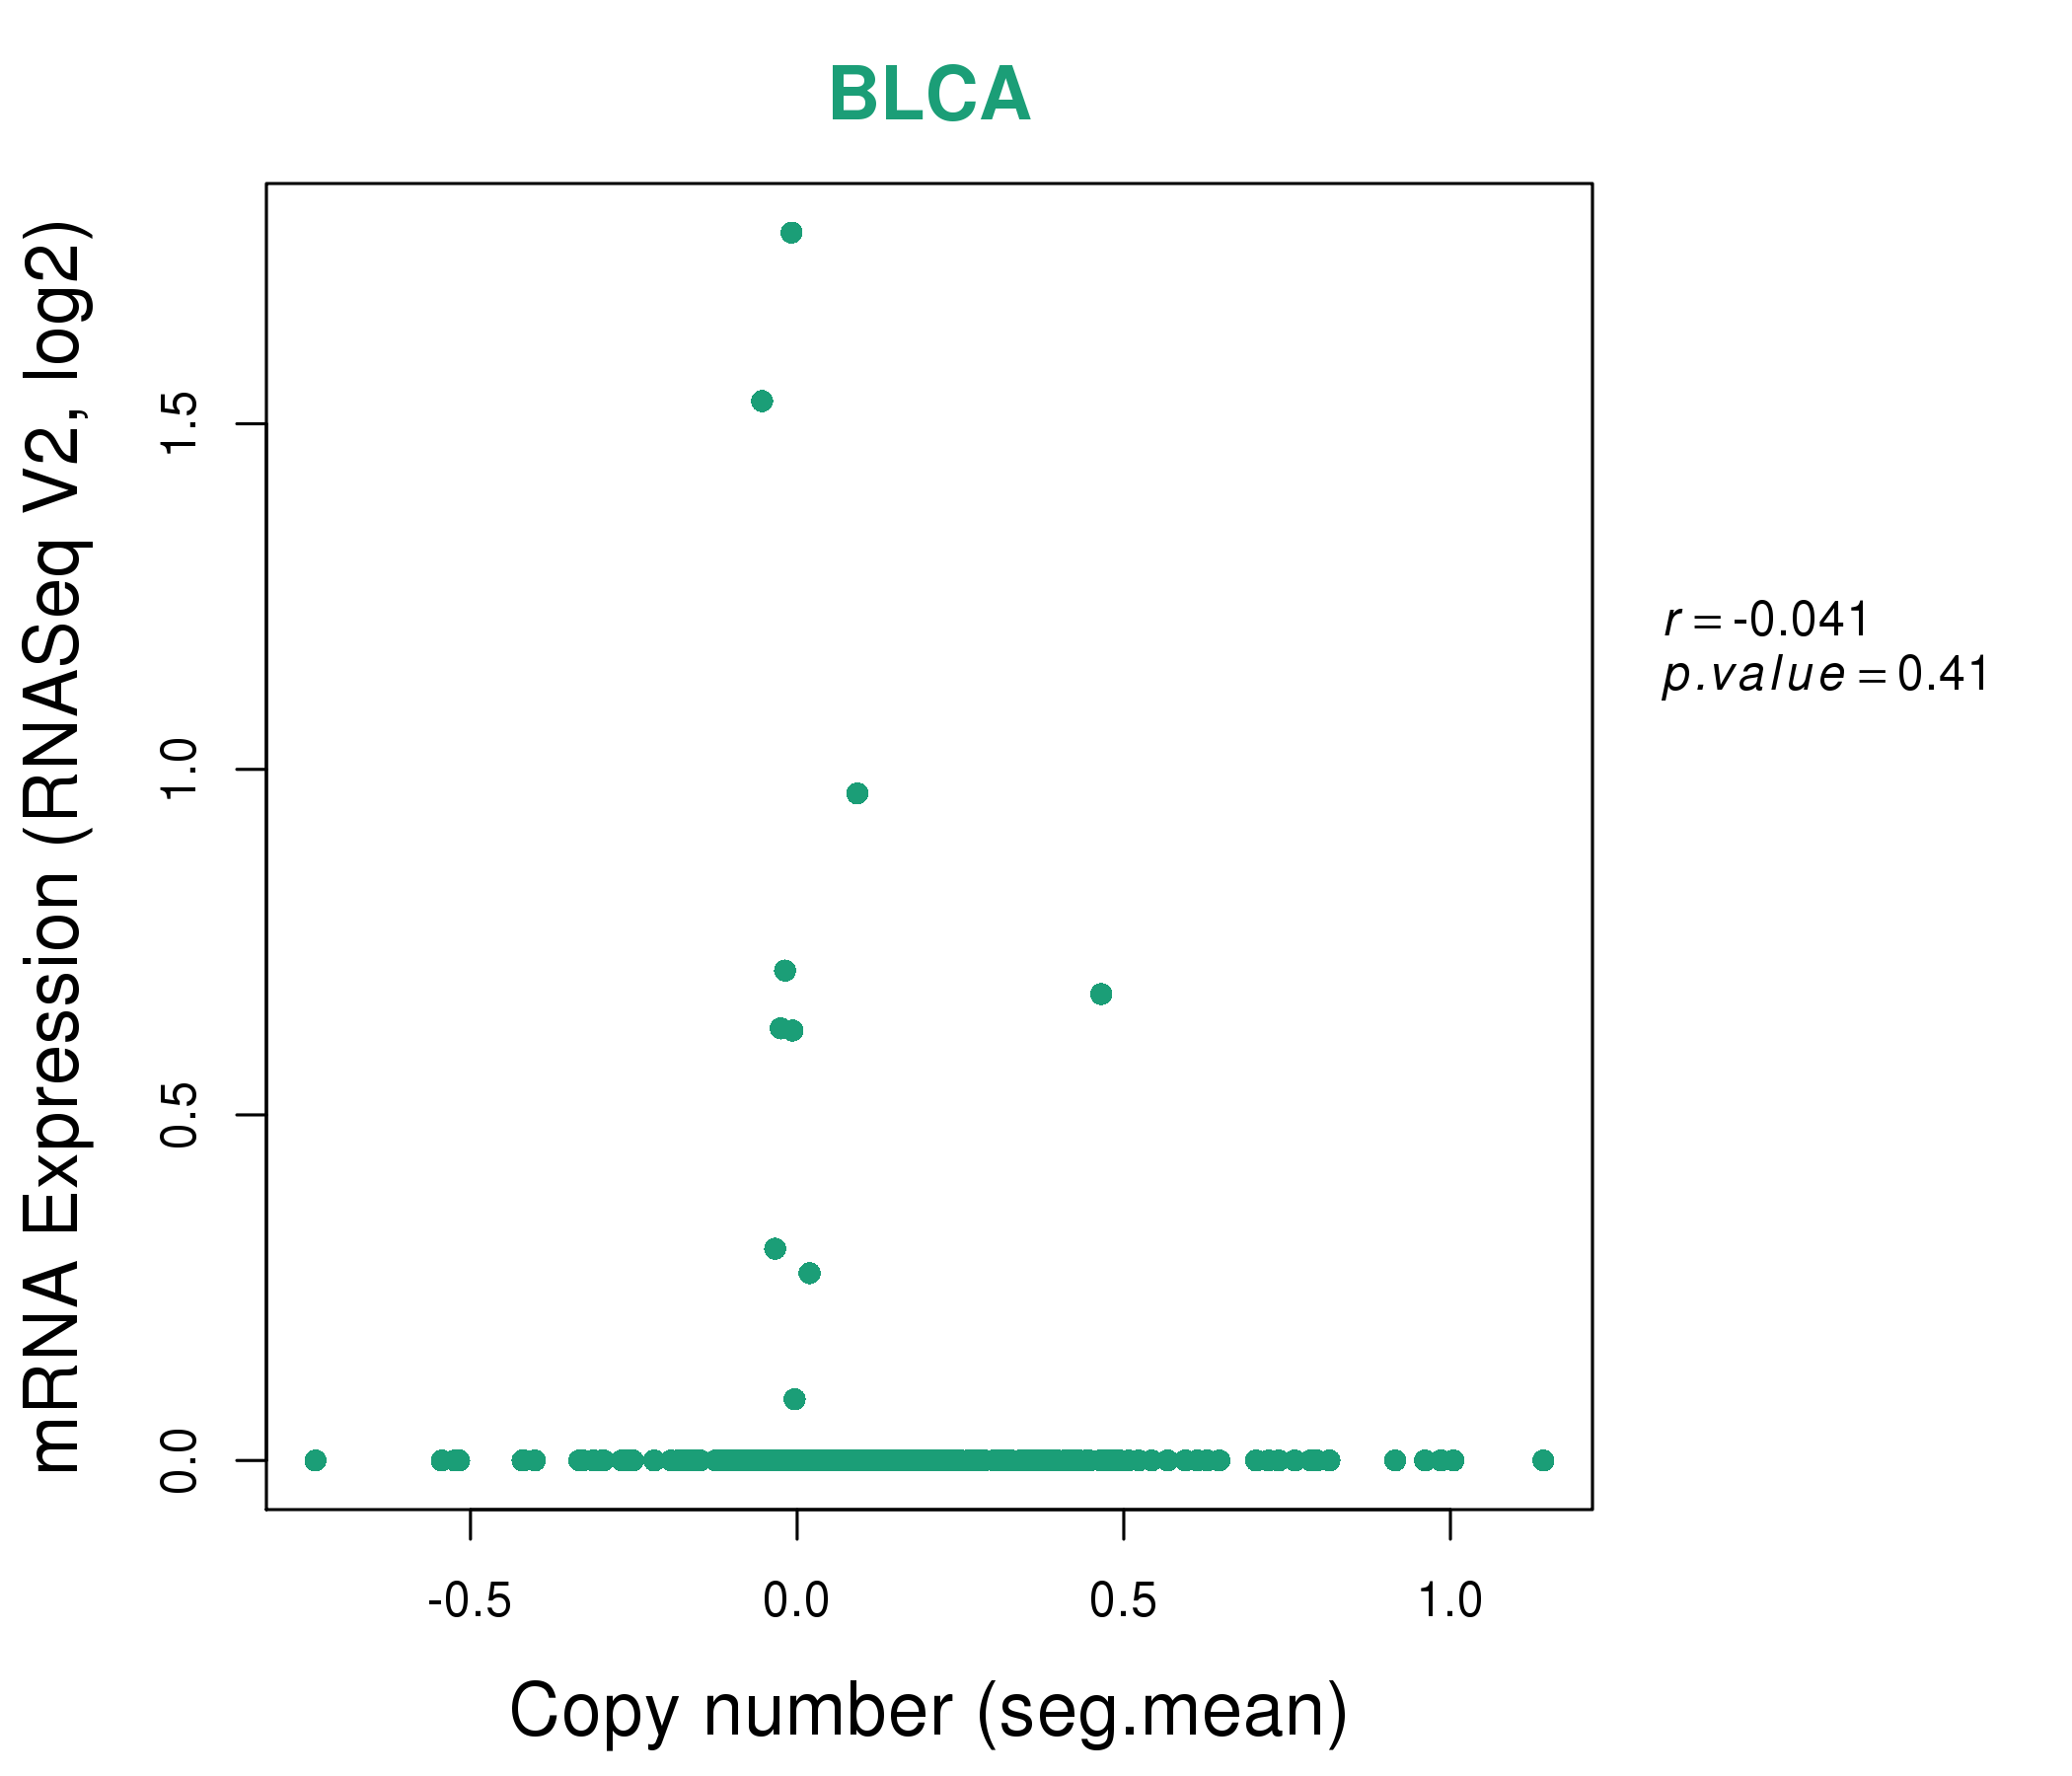
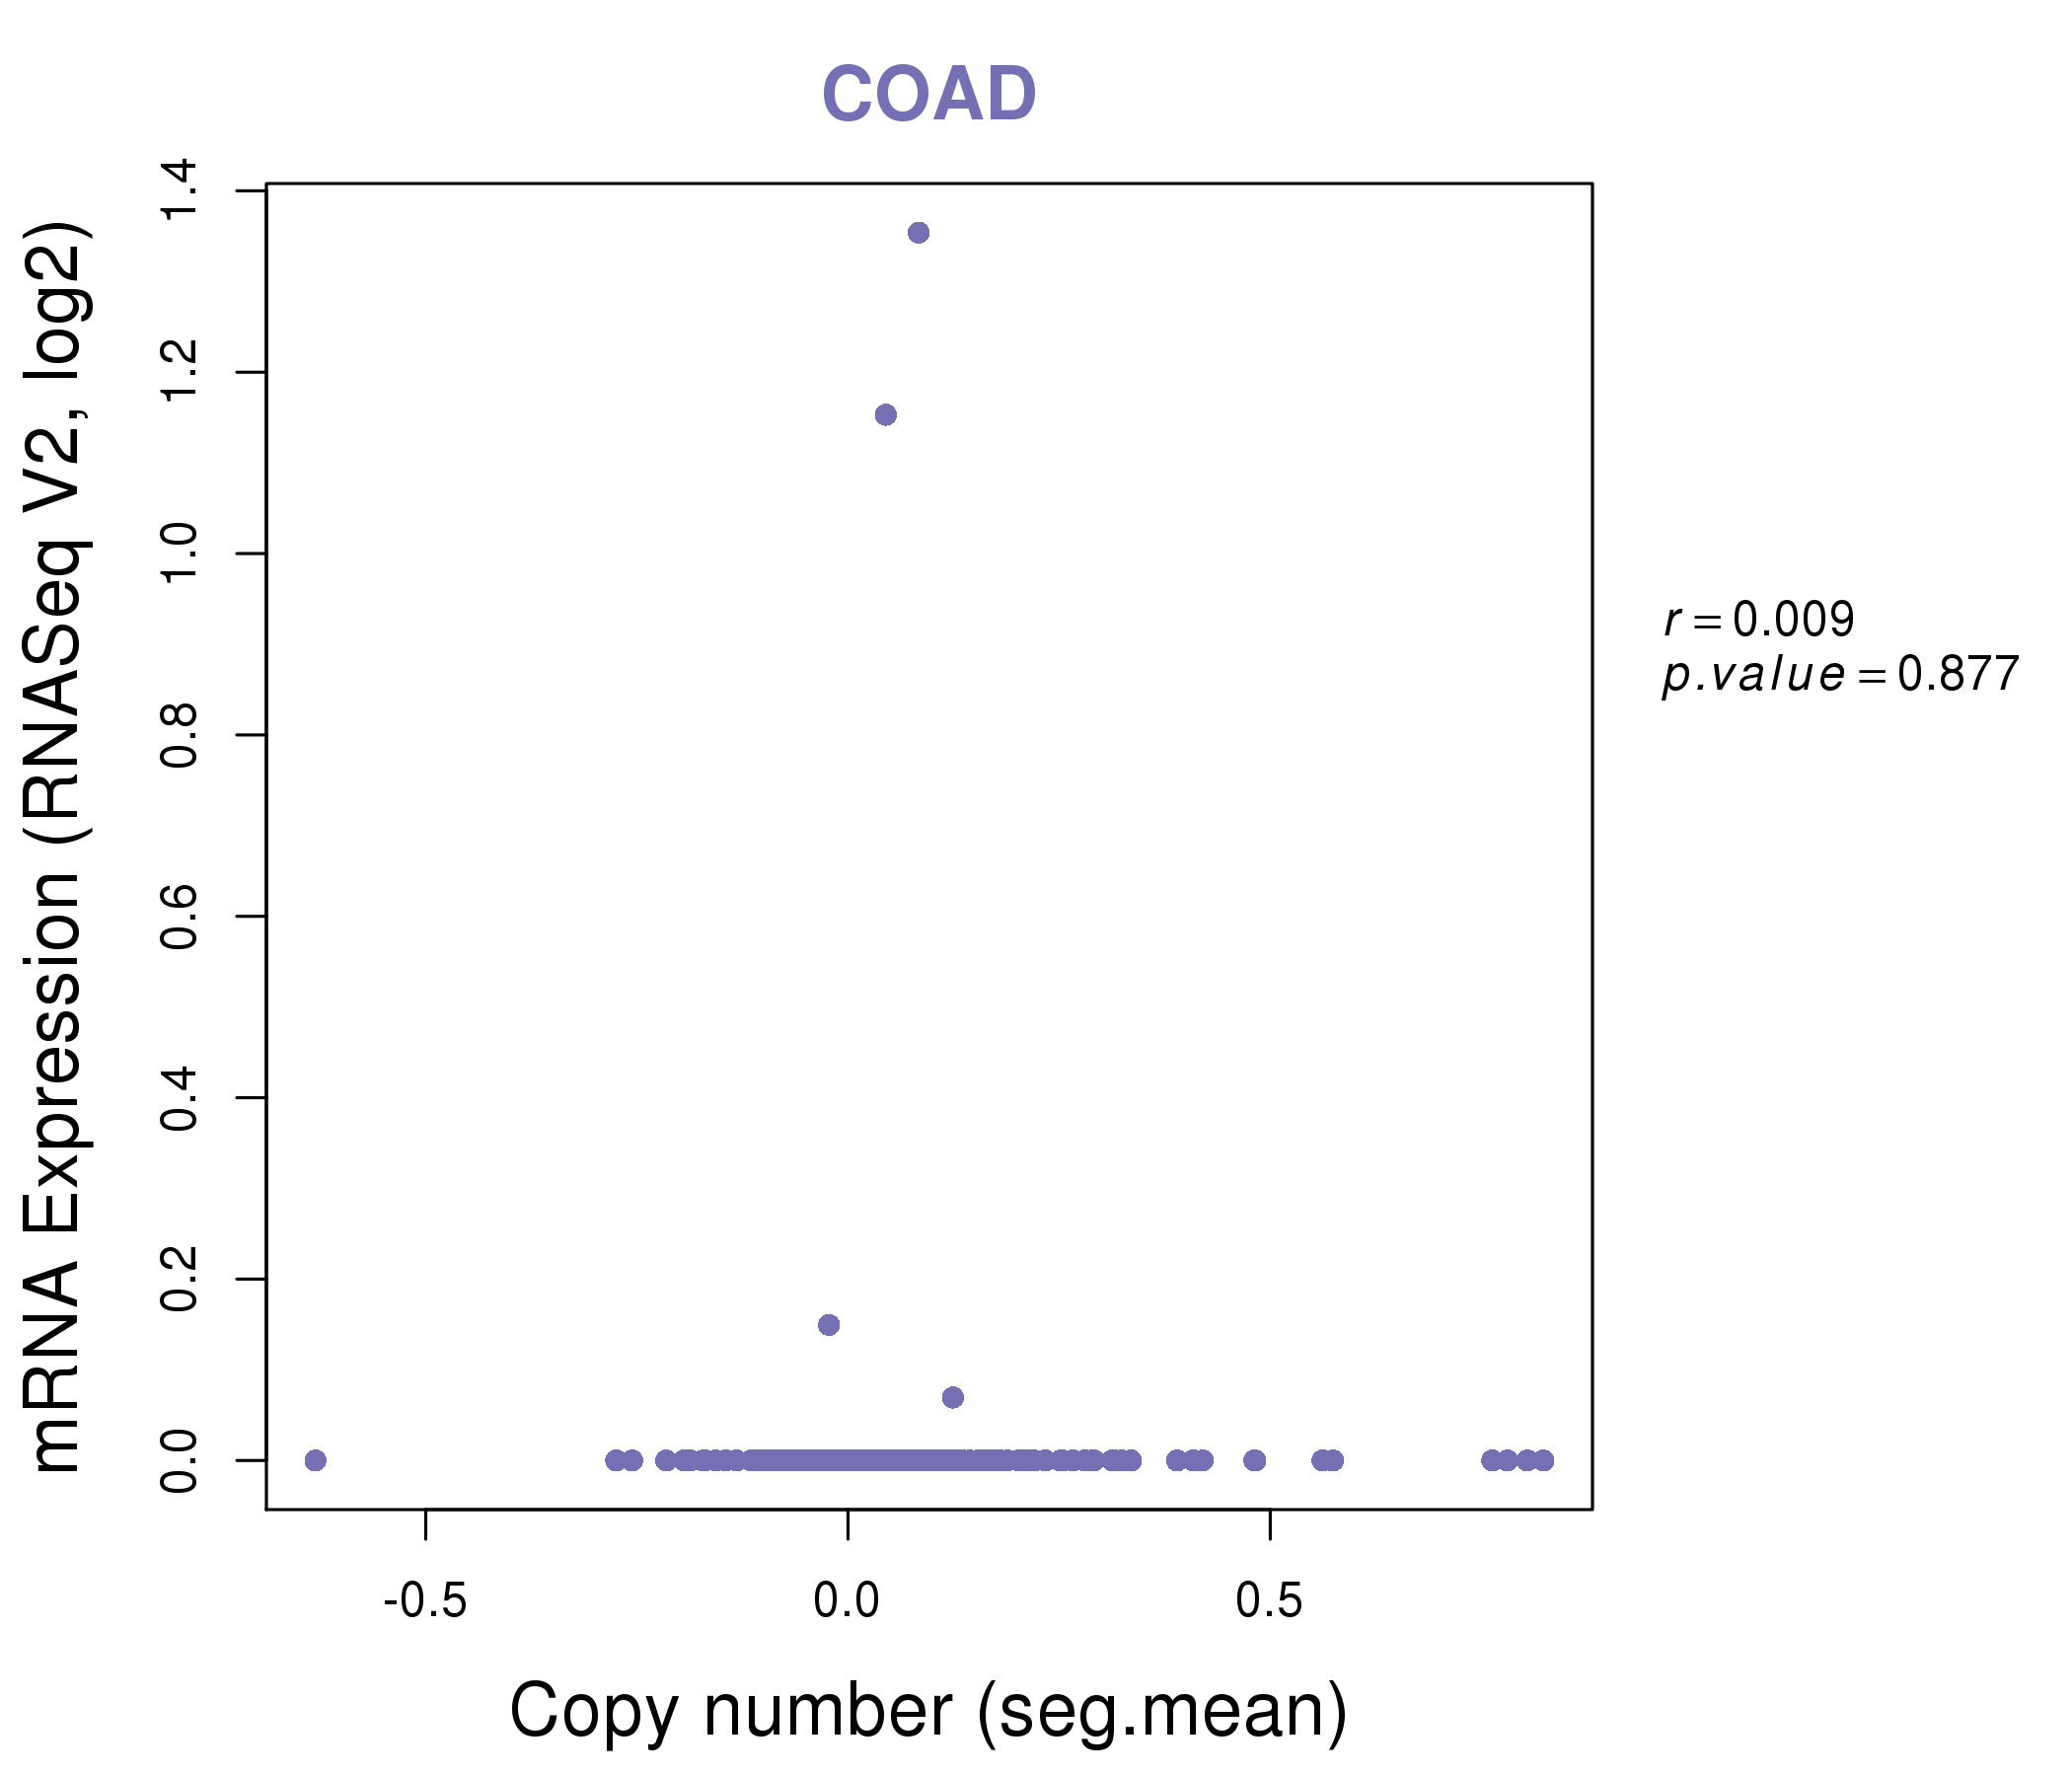
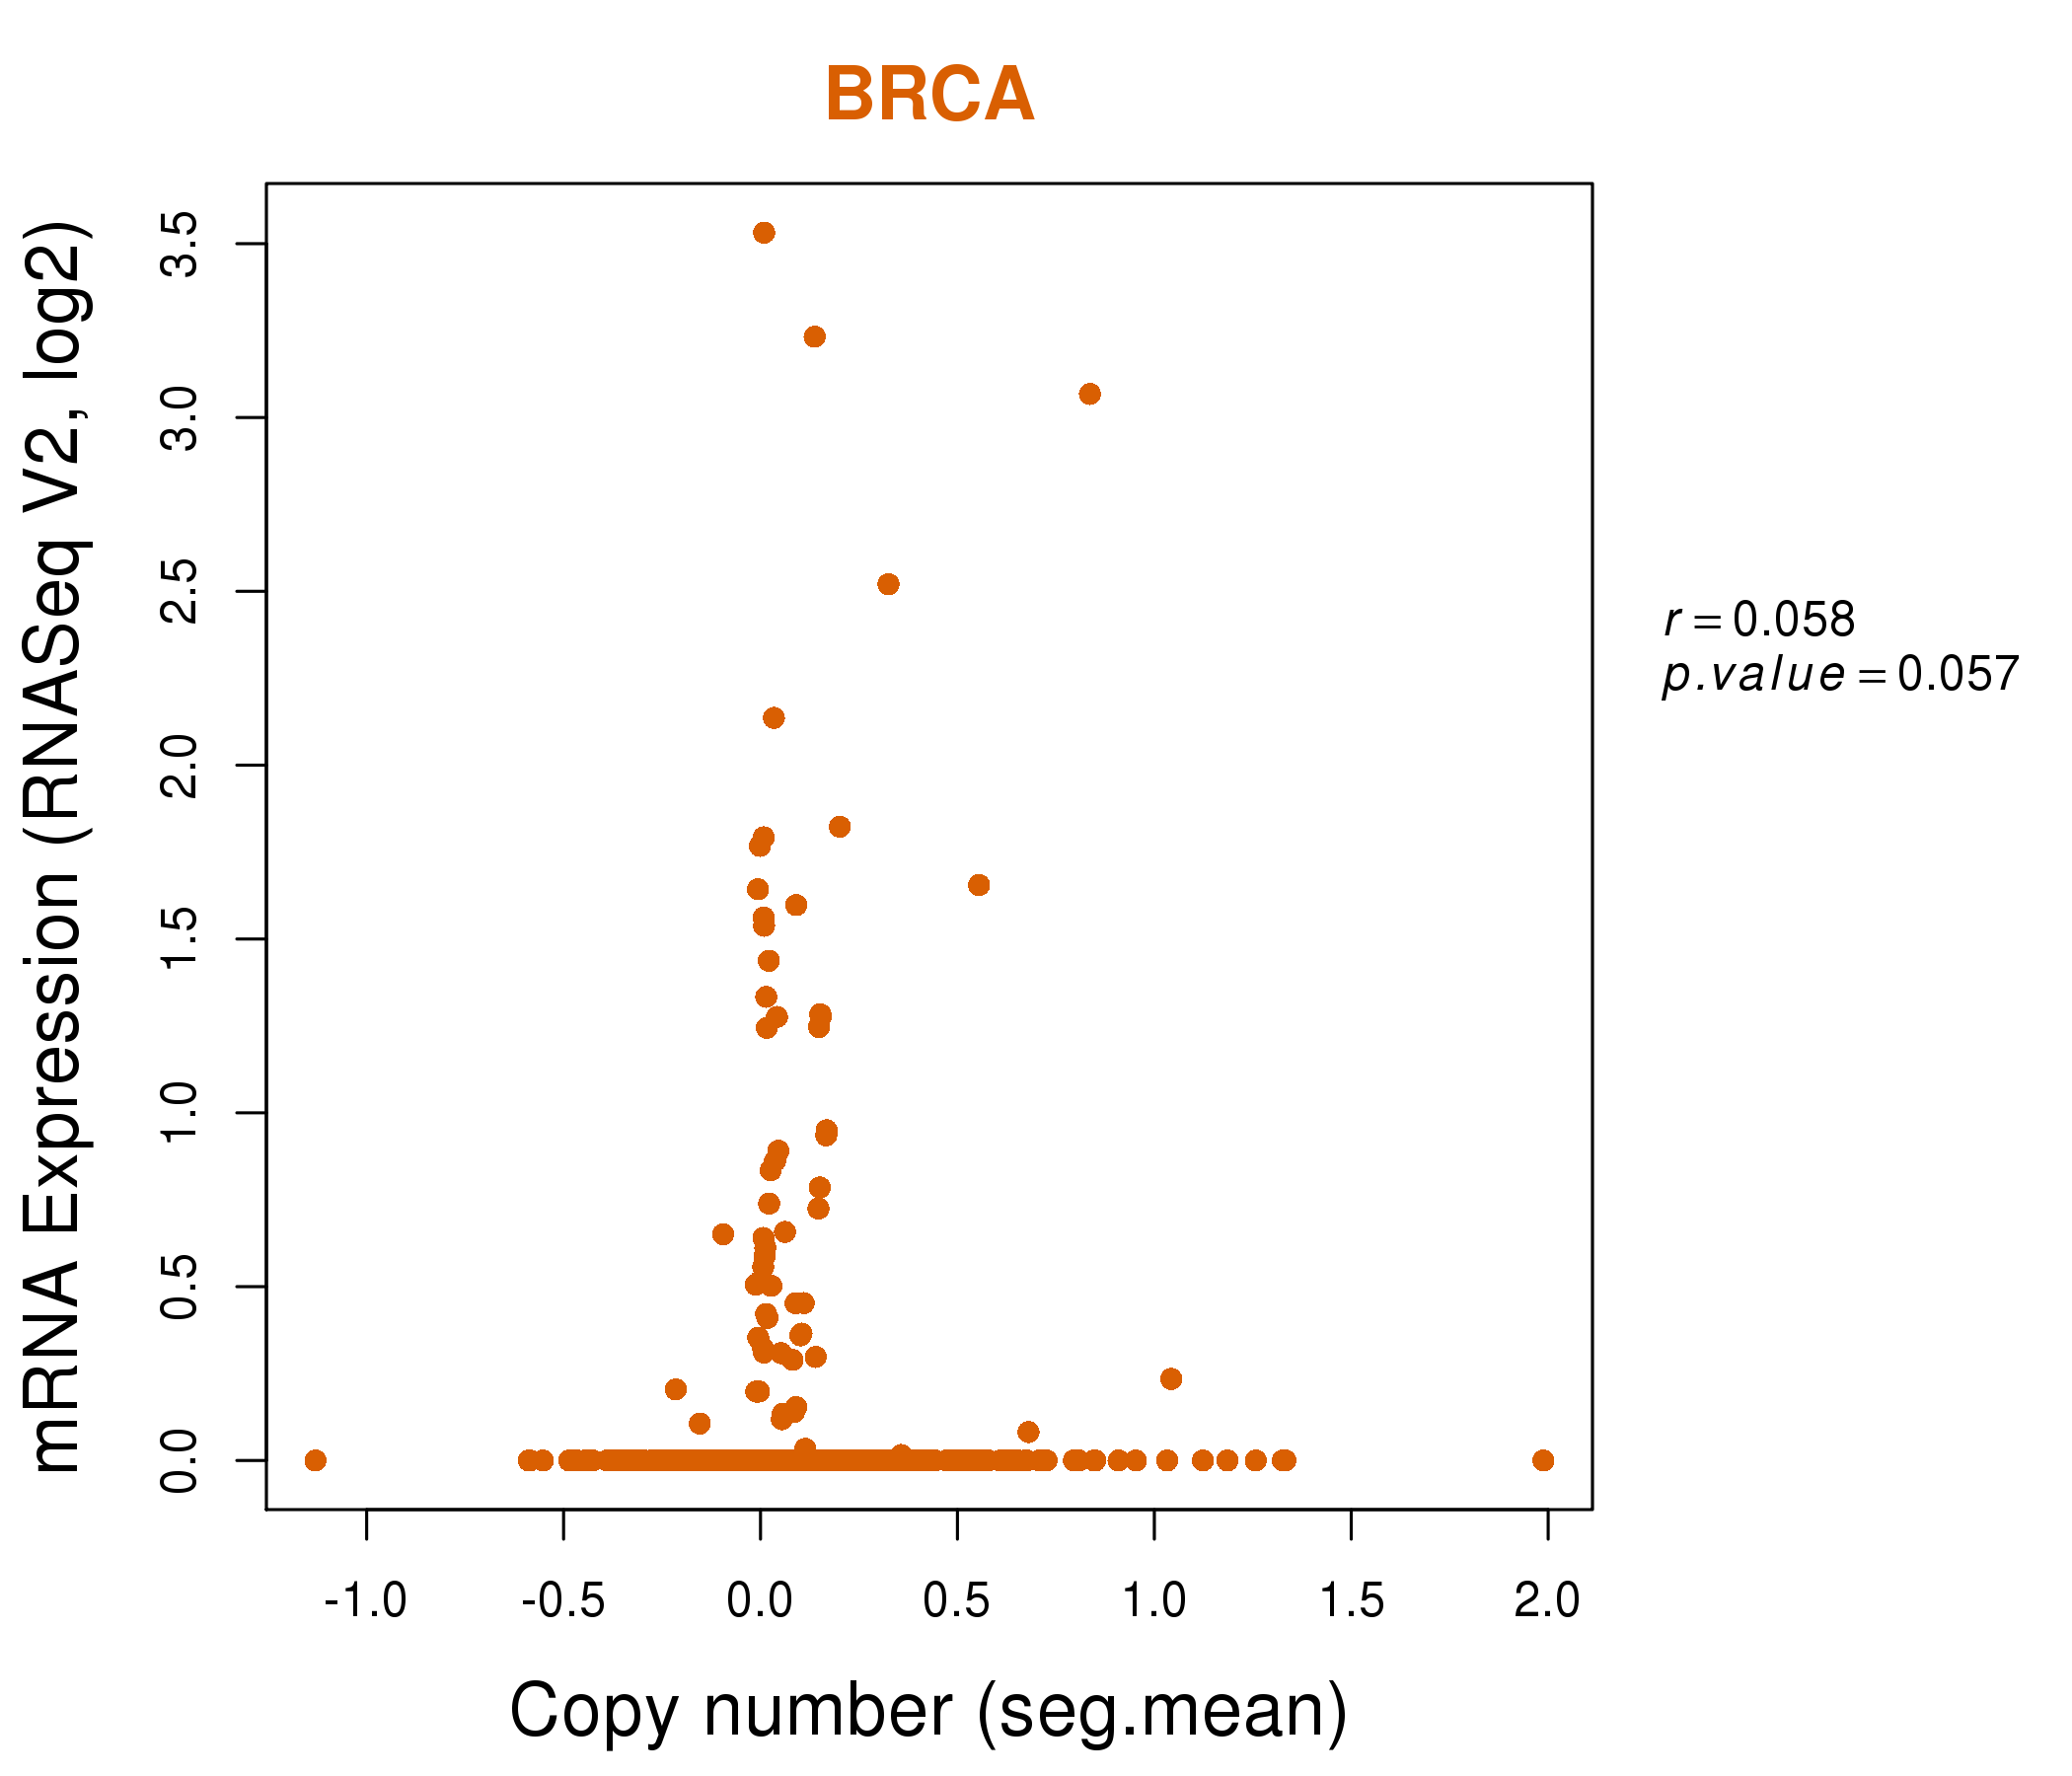
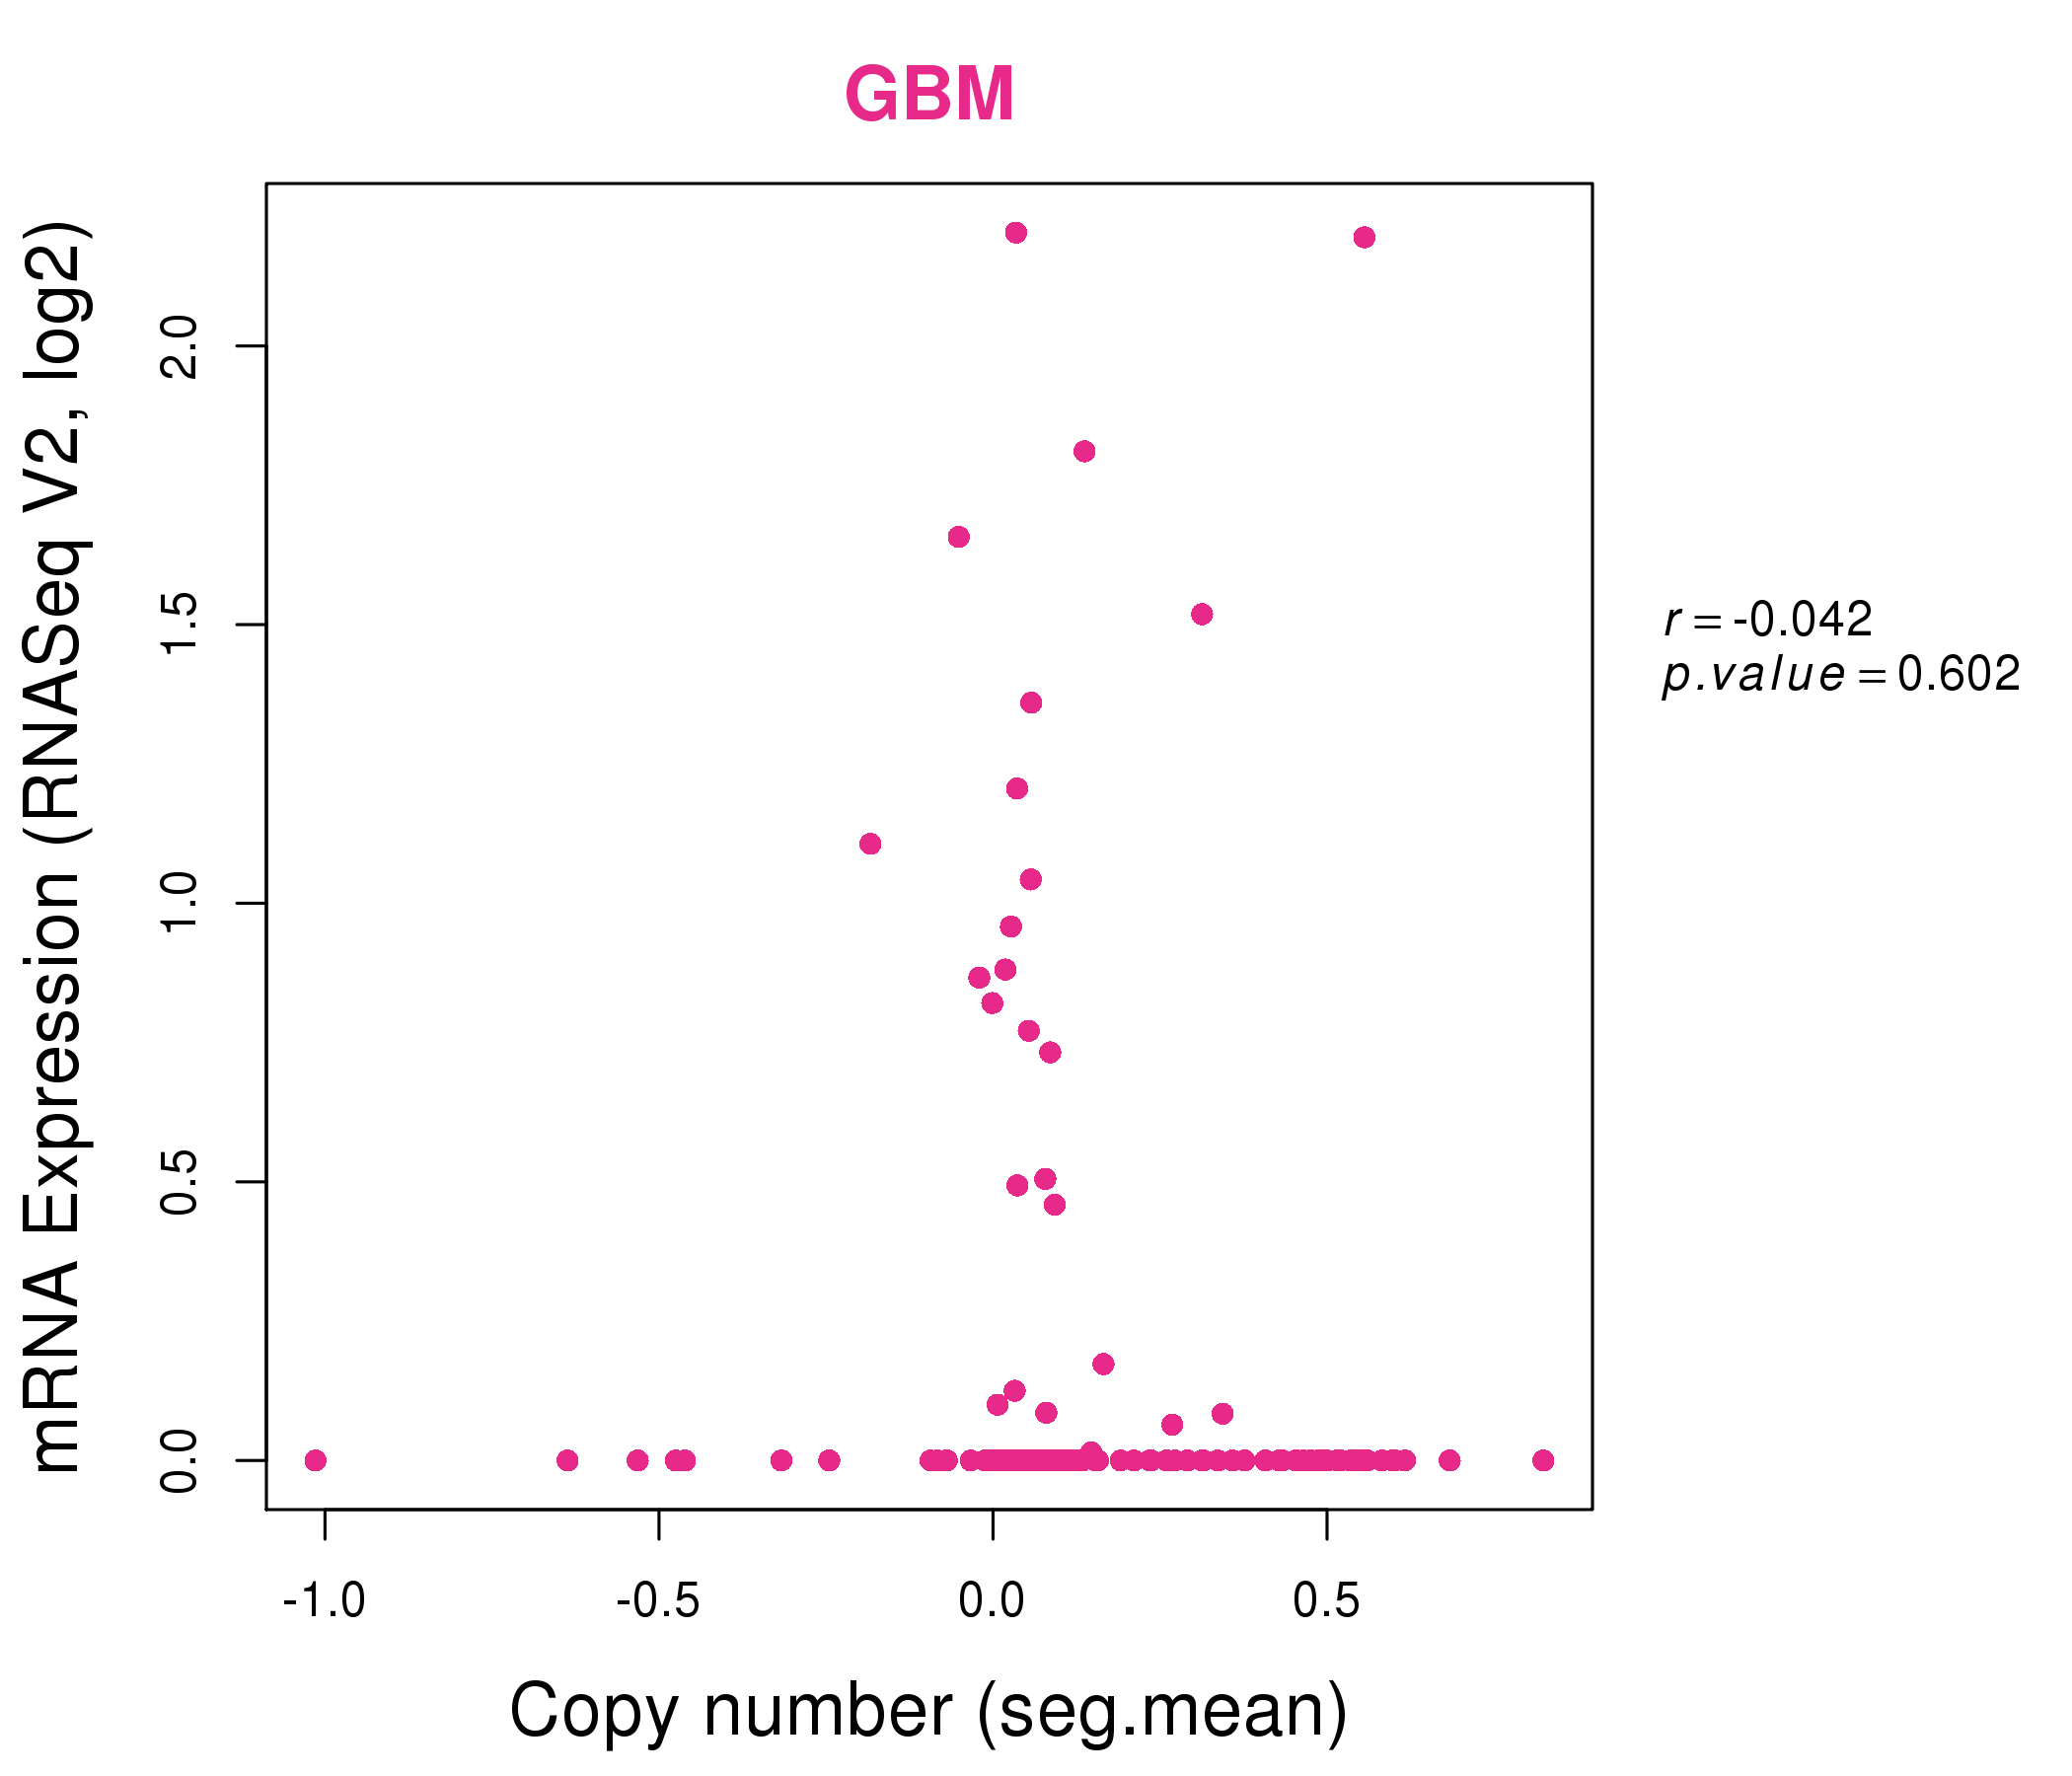
| * This plots show the correlation between CNV and gene expression. |
: Open all plots for all cancer types
 |
|
 |
|
| Top |
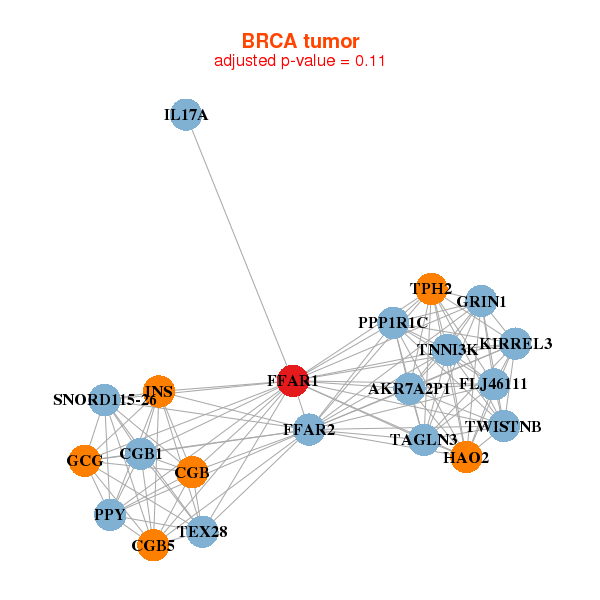
| Gene-Gene Network Information |
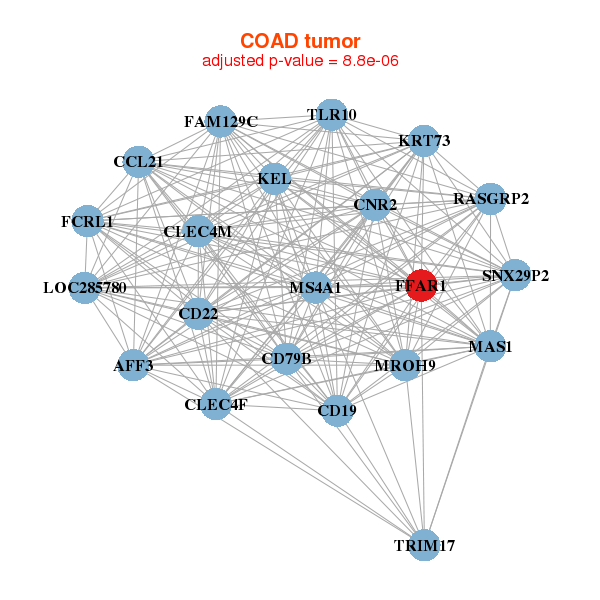
| * Co-Expression network figures were drawn using R package igraph. Only the top 20 genes with the highest correlations were shown. Red circle: input gene, orange circle: cell metabolism gene, sky circle: other gene |
: Open all plots for all cancer types
 |
| ||||
| AKR7A2P1,CGB,CGB1,CGB5,FFAR1,FFAR2,FLJ46111, GCG,GRIN1,HAO2,IL17A,INS,KIRREL3,PPP1R1C, PPY,SNORD115-26,TAGLN3,TEX28,TNNI3K,TPH2,TWISTNB | C16orf74,SMIM24,C1orf86,C1QL1,COL23A1,COL9A2,CTXN1, FAM27B,FFAR1,KRT81,LGALS7,MAG,MIF,NKX2-5, PTRH1,RBP1,SELM,TLE6,TMEM191A,TNFRSF18,ZNHIT2 | ||||
 |
| ||||
| AFF3,MROH9,CCL21,CD19,CD22,CD79B,CLEC4F, CLEC4M,CNR2,FAM129C,FCRL1,FFAR1,KEL,KRT73, LOC285780,MAS1,MS4A1,RASGRP2,SNX29P2,TLR10,TRIM17 | ABCC11,APOBEC1,CA9,CBR1,CYP2J2,DDC,FFAR1, GATA5,GBA3,GOLT1A,KDM8,MEP1B,MMEL1,NR1H4, OTC,PTGR1,SLC23A1,SLC23A3,SLC2A9,TIGD3,AGMO |
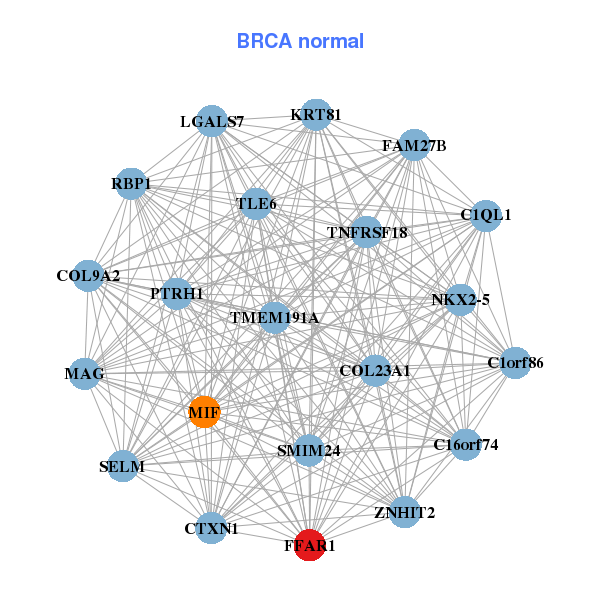
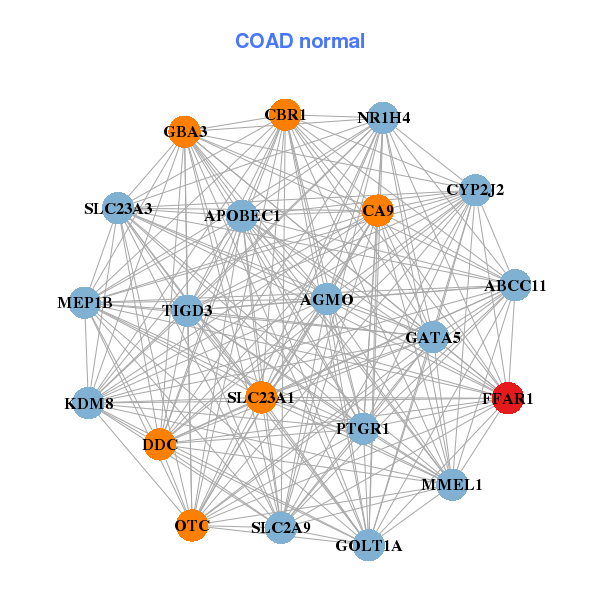
| * Co-Expression network figures were drawn using R package igraph. Only the top 20 genes with the highest correlations were shown. Red circle: input gene, orange circle: cell metabolism gene, sky circle: other gene |
: Open all plots for all cancer types
| Top |
: Open all interacting genes' information including KEGG pathway for all interacting genes from DAVID
| Top |
| Pharmacological Information for FFAR1 |
| DB Category | DB Name | DB's ID and Url link |
| * Gene Centered Interaction Network. |
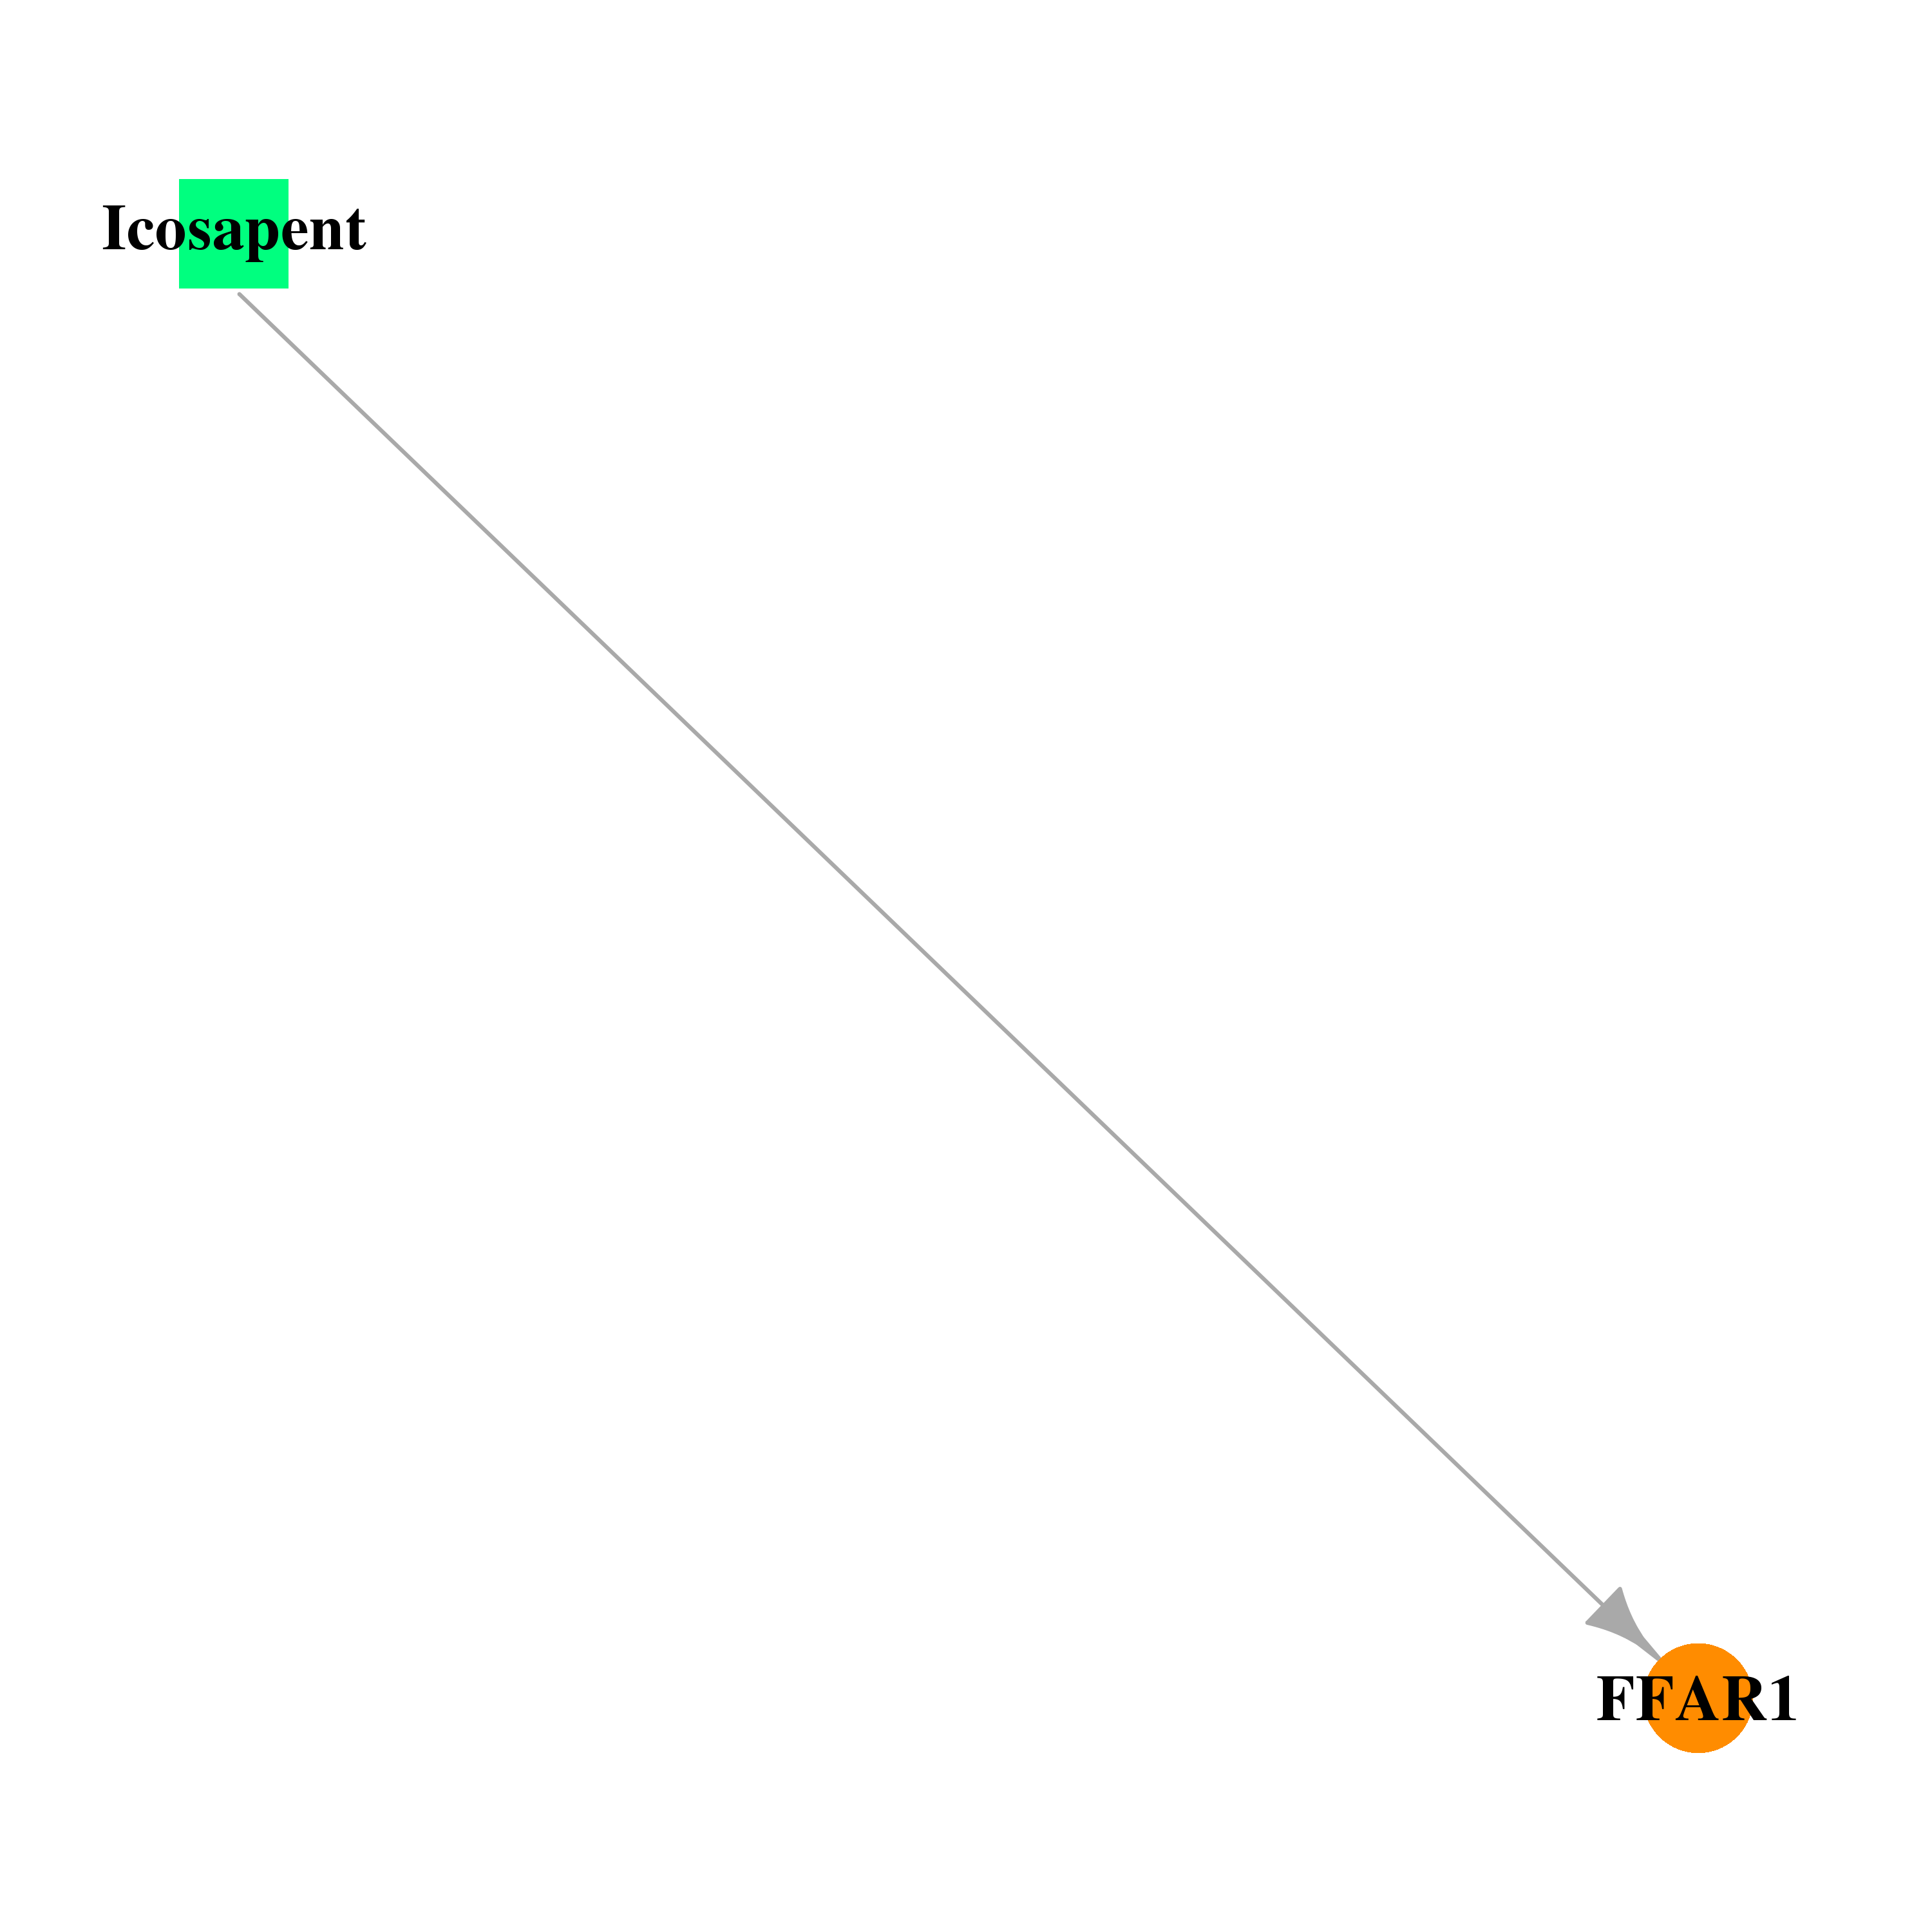 |
| * Drug Centered Interaction Network. |
| DrugBank ID | Target Name | Drug Groups | Generic Name | Drug Centered Network | Drug Structure |
| DB00159 | free fatty acid receptor 1 | approved; nutraceutical | Icosapent | 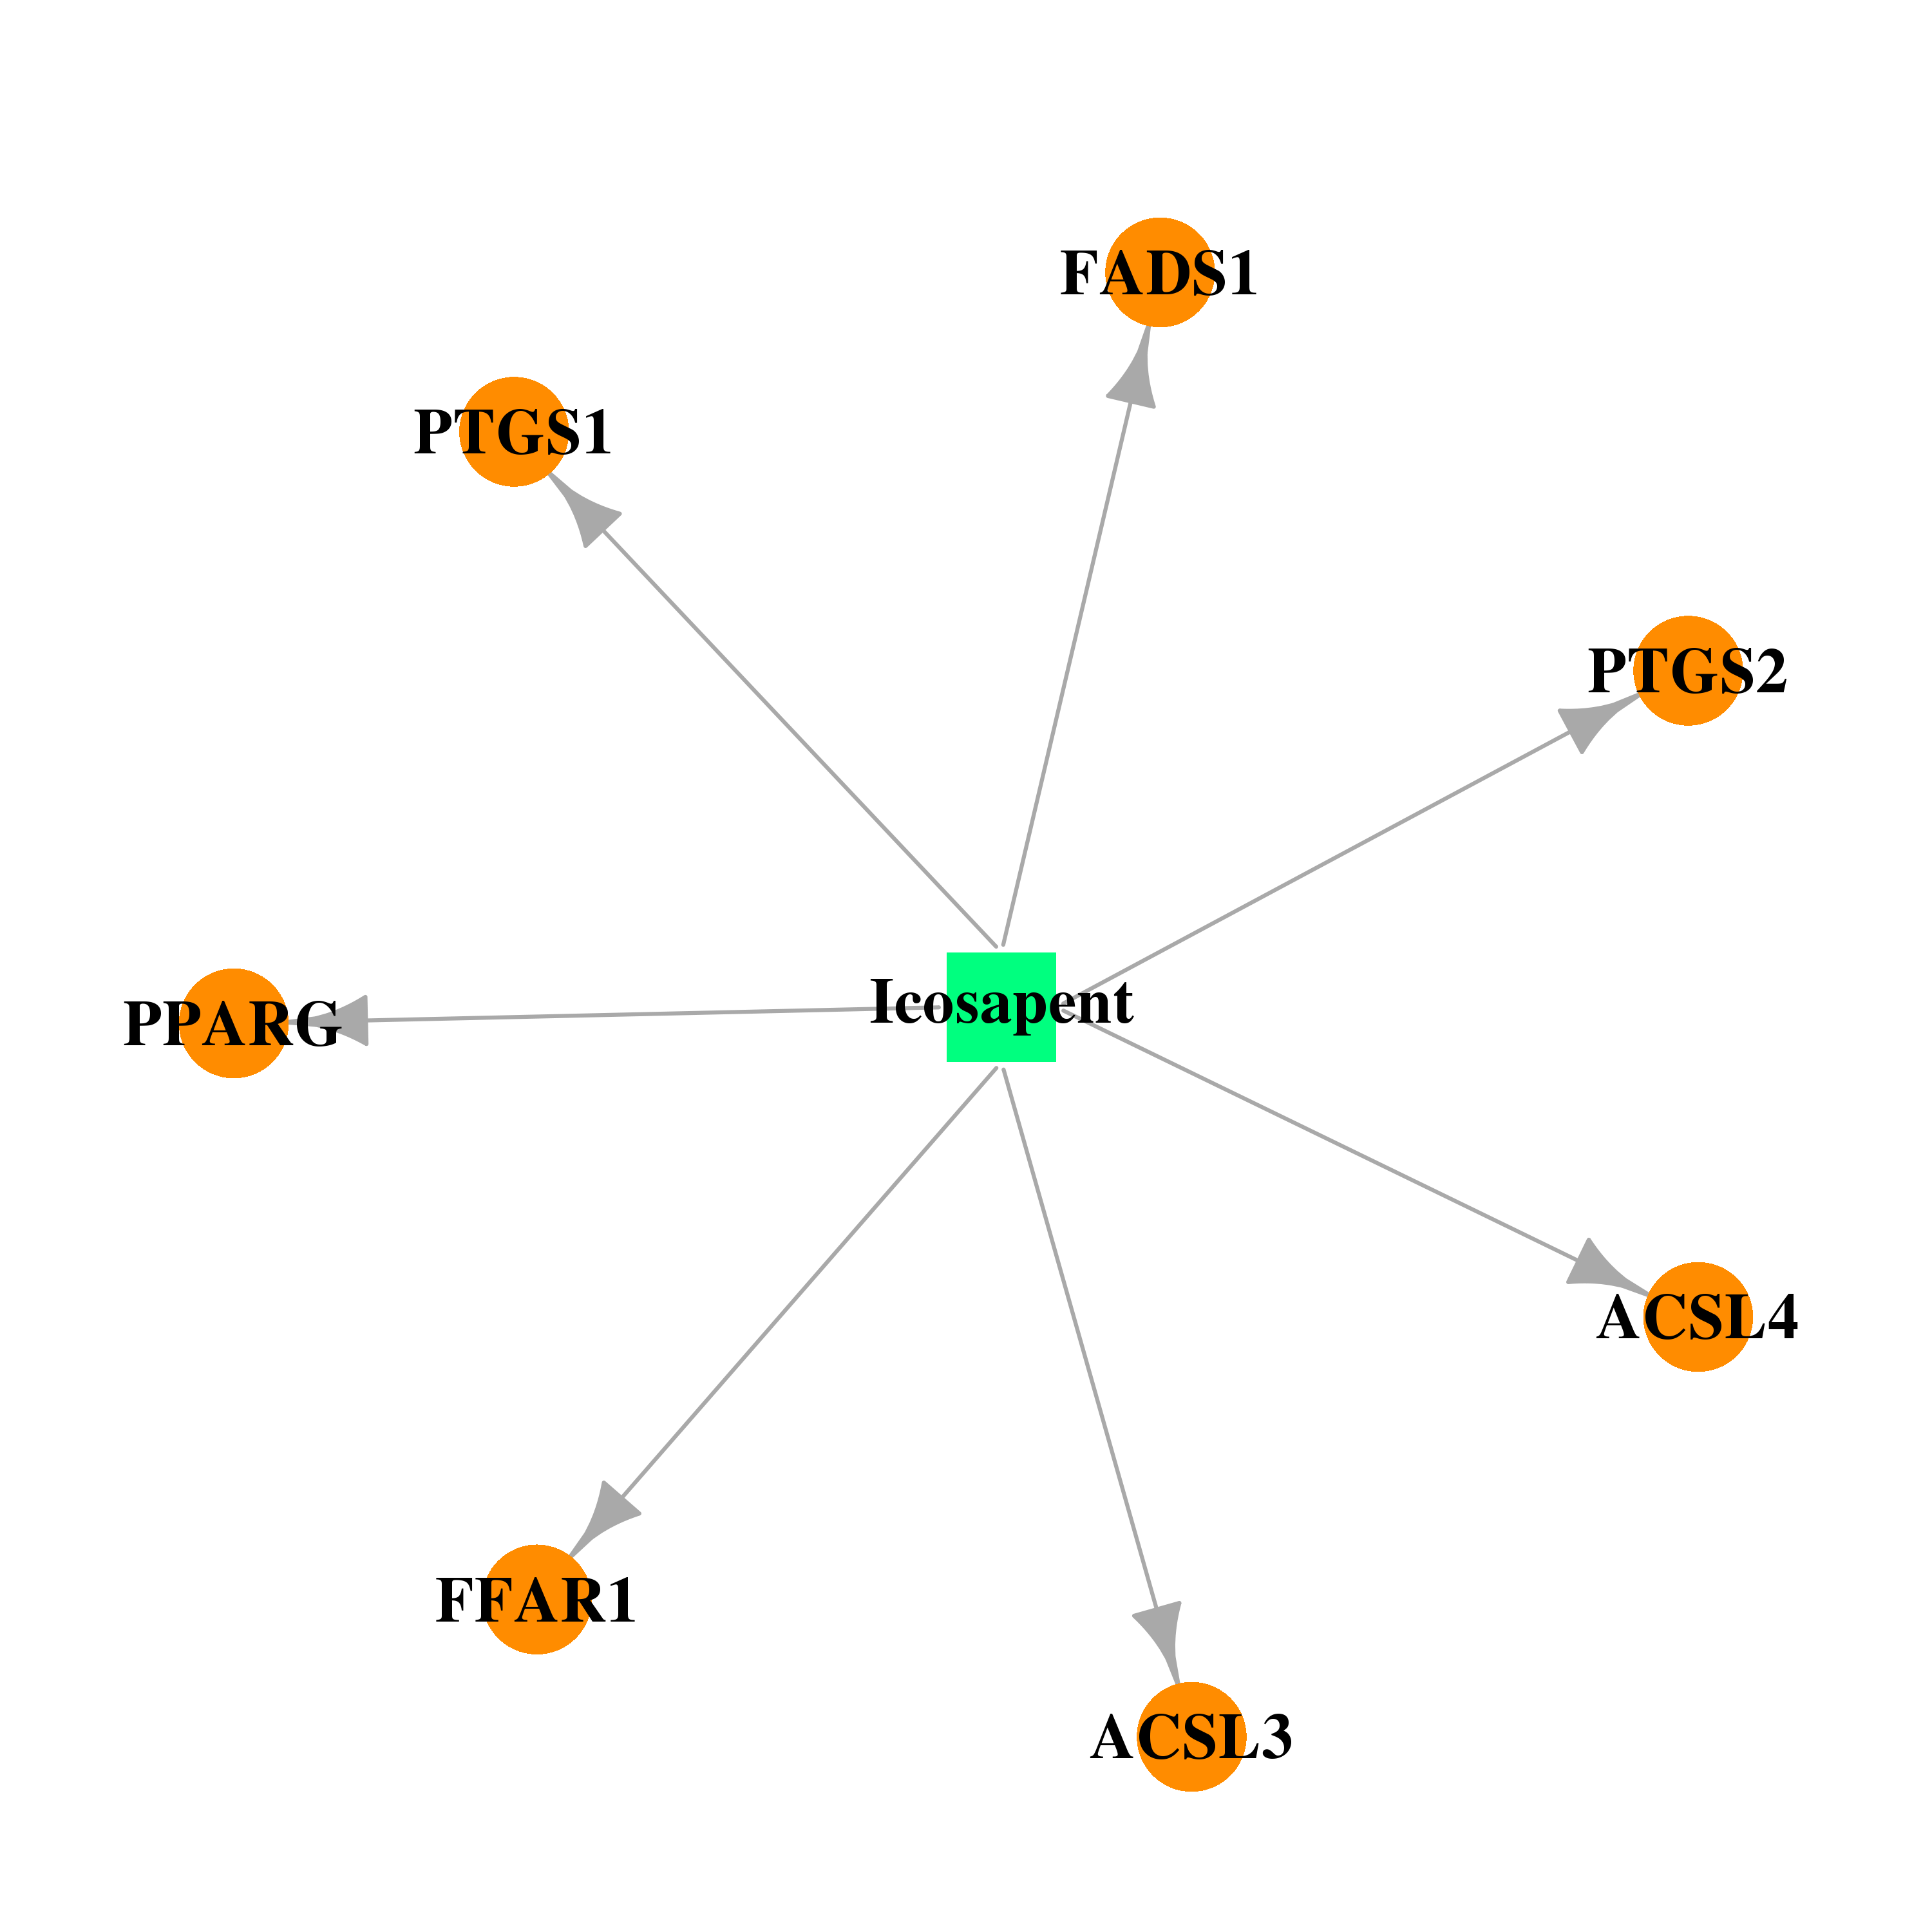 | 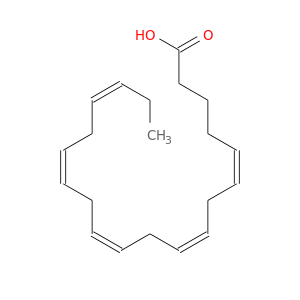 |
| Top |
| Cross referenced IDs for FFAR1 |
| * We obtained these cross-references from Uniprot database. It covers 150 different DBs, 18 categories. http://www.uniprot.org/help/cross_references_section |
: Open all cross reference information
|
Copyright © 2016-Present - The Univsersity of Texas Health Science Center at Houston @ |