|
||||||||||||||||||||
| |
| Phenotypic Information (metabolism pathway, cancer, disease, phenome) |
| |
| |
| Gene-Gene Network Information: Co-Expression Network, Interacting Genes & KEGG |
| |
|


| Gene Summary for GPX5 |
| Basic gene info. | Gene symbol | GPX5 |
| Gene name | glutathione peroxidase 5 | |
| Synonyms | HEL-S-75p | |
| Cytomap | UCSC genome browser: 6p22.1 | |
| Genomic location | chr6_cox_hap2 :15992-24932 | |
| Type of gene | protein-coding | |
| RefGenes | NM_001509.2, NM_003996.3, | |
| Ensembl id | ENSG00000224586 | |
| Description | EGLPGPx-5GSHPx-5epididymal androgen-related proteinepididymal secretory glutathione peroxidaseepididymis secretory sperm binding protein Li 75pepididymis-specific glutathione peroxidase-like protein | |
| Modification date | 20141207 | |
| dbXrefs | MIM : 603435 | |
| HGNC : HGNC | ||
| Ensembl : ENSG00000224586 | ||
| HPRD : 11941 | ||
| Vega : OTTHUMG00000016307 | ||
| Protein | UniProt: O75715 go to UniProt's Cross Reference DB Table | |
| Expression | CleanEX: HS_GPX5 | |
| BioGPS: 2880 | ||
| Gene Expression Atlas: ENSG00000224586 | ||
| The Human Protein Atlas: ENSG00000224586 | ||
| Pathway | NCI Pathway Interaction Database: GPX5 | |
| KEGG: GPX5 | ||
| REACTOME: GPX5 | ||
| ConsensusPathDB | ||
| Pathway Commons: GPX5 | ||
| Metabolism | MetaCyc: GPX5 | |
| HUMANCyc: GPX5 | ||
| Regulation | Ensembl's Regulation: ENSG00000224586 | |
| miRBase: chr6_cox_hap2 :15,992-24,932 | ||
| TargetScan: NM_001509 | ||
| cisRED: ENSG00000224586 | ||
| Context | iHOP: GPX5 | |
| cancer metabolism search in PubMed: GPX5 | ||
| UCL Cancer Institute: GPX5 | ||
| Assigned class in ccmGDB | A - This gene has a literature evidence and it belongs to cancer gene. | |
| References showing role of GPX5 in cancer cell metabolism | 1. Li Y, Sun Z, Cunningham JM, Aubry MC, Wampfler JA, et al. (2011) Genetic variations in multiple drug action pathways and survival in advanced stage non-small cell lung cancer treated with chemotherapy. Clin Cancer Res 17: 3830-3840. doi: 10.1158/1078-0432.CCR-10-2877. pmid: 3124814. go to article | |
| Top |
| Phenotypic Information for GPX5(metabolism pathway, cancer, disease, phenome) |
| Cancer | CGAP: GPX5 |
| Familial Cancer Database: GPX5 | |
| * This gene is included in those cancer gene databases. |
|
|
|
|
|
| . | ||||||||||||||
Oncogene 1 | Significant driver gene in GBM 6, | |||||||||||||||||||
| cf) number; DB name 1 Oncogene; http://nar.oxfordjournals.org/content/35/suppl_1/D721.long, 2 Tumor Suppressor gene; https://bioinfo.uth.edu/TSGene/, 3 Cancer Gene Census; http://www.nature.com/nrc/journal/v4/n3/abs/nrc1299.html, 4 CancerGenes; http://nar.oxfordjournals.org/content/35/suppl_1/D721.long, 5 Network of Cancer Gene; http://ncg.kcl.ac.uk/index.php, 6 http://www.sciencedirect.com/science/article/pii/S0092867413012087, 7Therapeutic Vulnerabilities in Cancer; http://cbio.mskcc.org/cancergenomics/statius/ |
| KEGG_GLUTATHIONE_METABOLISM KEGG_ARACHIDONIC_ACID_METABOLISM | |
| OMIM | 603435; gene. |
| Orphanet | |
| Disease | KEGG Disease: GPX5 |
| MedGen: GPX5 (Human Medical Genetics with Condition) | |
| ClinVar: GPX5 | |
| Phenotype | MGI: GPX5 (International Mouse Phenotyping Consortium) |
| PhenomicDB: GPX5 | |
| Mutations for GPX5 |
| * Under tables are showing count per each tissue to give us broad intuition about tissue specific mutation patterns.You can go to the detailed page for each mutation database's web site. |
| There's no structural variation information in COSMIC data for this gene. |
| * From mRNA Sanger sequences, Chitars2.0 arranged chimeric transcripts. This table shows GPX5 related fusion information. |
| ID | Head Gene | Tail Gene | Accession | Gene_a | qStart_a | qEnd_a | Chromosome_a | tStart_a | tEnd_a | Gene_a | qStart_a | qEnd_a | Chromosome_a | tStart_a | tEnd_a |
| Top |
| There's no copy number variation information in COSMIC data for this gene. |
| Top |
|
 |
| Top |
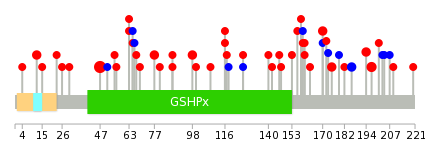
| Stat. for Non-Synonymous SNVs (# total SNVs=43) | (# total SNVs=7) |
 |  |
(# total SNVs=0) | (# total SNVs=0) |
| Top |
| * When you move the cursor on each content, you can see more deailed mutation information on the Tooltip. Those are primary_site,primary_histology,mutation(aa),pubmedID. |
| GRCh37 position | Mutation(aa) | Unique sampleID count |
| chr6:28497279-28497279 | p.A47T | 8 |
| chr6:28501867-28501867 | p.R197C | 3 |
| chr6:28499606-28499606 | p.G98D | 2 |
| chr6:28501858-28501858 | p.P194S | 2 |
| chr6:28501787-28501787 | p.S170F | 2 |
| chr6:28493824-28493824 | p.P12S | 2 |
| chr6:28499659-28499659 | p.L116F | 2 |
| chr6:28501803-28501803 | p.K175N | 2 |
| chr6:28497370-28497370 | p.A77V | 2 |
| chr6:28499572-28499572 | p.E87K | 2 |
| Top |
|
 |
| Point Mutation/ Tissue ID | 1 | 2 | 3 | 4 | 5 | 6 | 7 | 8 | 9 | 10 | 11 | 12 | 13 | 14 | 15 | 16 | 17 | 18 | 19 | 20 |
| # sample | 2 | 7 | 4 | 1 | 1 | 6 | 2 | 12 | 1 | 6 | ||||||||||
| # mutation | 2 | 5 | 3 | 1 | 1 | 7 | 2 | 13 | 1 | 5 | ||||||||||
| nonsynonymous SNV | 2 | 5 | 3 | 1 | 1 | 6 | 2 | 9 | 1 | 5 | ||||||||||
| synonymous SNV | 1 | 4 |
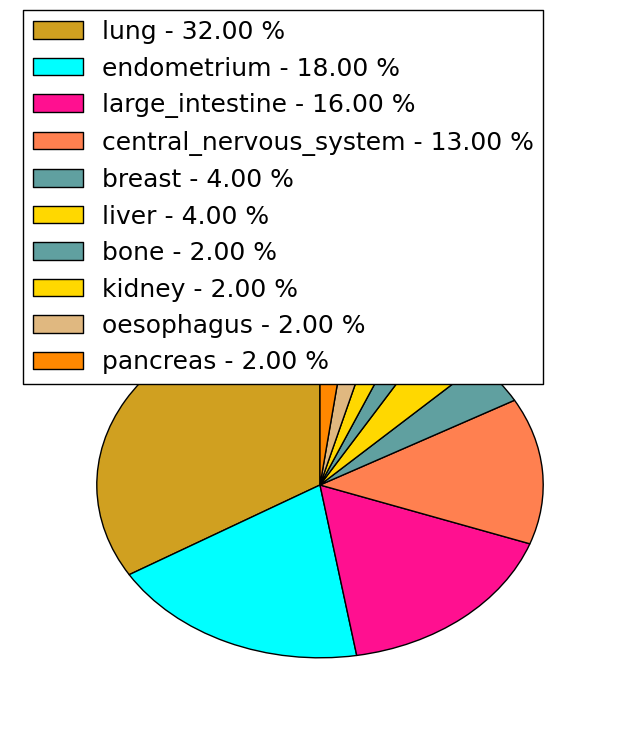
| cf) Tissue ID; Tissue type (1; BLCA[Bladder Urothelial Carcinoma], 2; BRCA[Breast invasive carcinoma], 3; CESC[Cervical squamous cell carcinoma and endocervical adenocarcinoma], 4; COAD[Colon adenocarcinoma], 5; GBM[Glioblastoma multiforme], 6; Glioma Low Grade, 7; HNSC[Head and Neck squamous cell carcinoma], 8; KICH[Kidney Chromophobe], 9; KIRC[Kidney renal clear cell carcinoma], 10; KIRP[Kidney renal papillary cell carcinoma], 11; LAML[Acute Myeloid Leukemia], 12; LUAD[Lung adenocarcinoma], 13; LUSC[Lung squamous cell carcinoma], 14; OV[Ovarian serous cystadenocarcinoma ], 15; PAAD[Pancreatic adenocarcinoma], 16; PRAD[Prostate adenocarcinoma], 17; SKCM[Skin Cutaneous Melanoma], 18:STAD[Stomach adenocarcinoma], 19:THCA[Thyroid carcinoma], 20:UCEC[Uterine Corpus Endometrial Carcinoma]) |
| Top |
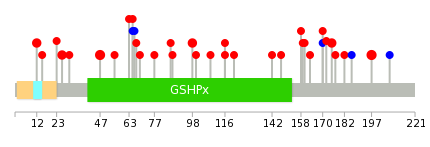
| * We represented just top 10 SNVs. When you move the cursor on each content, you can see more deailed mutation information on the Tooltip. Those are primary_site, primary_histology, mutation(aa), pubmedID. |
| Genomic Position | Mutation(aa) | Unique sampleID count |
| chr6:28501867 | p.R197C | 3 |
| chr6:28497279 | p.A47T,GPX5 | 3 |
| chr6:28493824 | p.G98D | 2 |
| chr6:28493868 | p.P12S,GPX5 | 2 |
| chr6:28499606 | p.E26D,GPX5 | 2 |
| chr6:28499659 | p.L116I | 2 |
| chr6:28501803 | p.K175N | 2 |
| chr6:28500099 | p.E87Q | 1 |
| chr6:28501807 | p.H177N | 1 |
| chr6:28497338 | p.N182D | 1 |
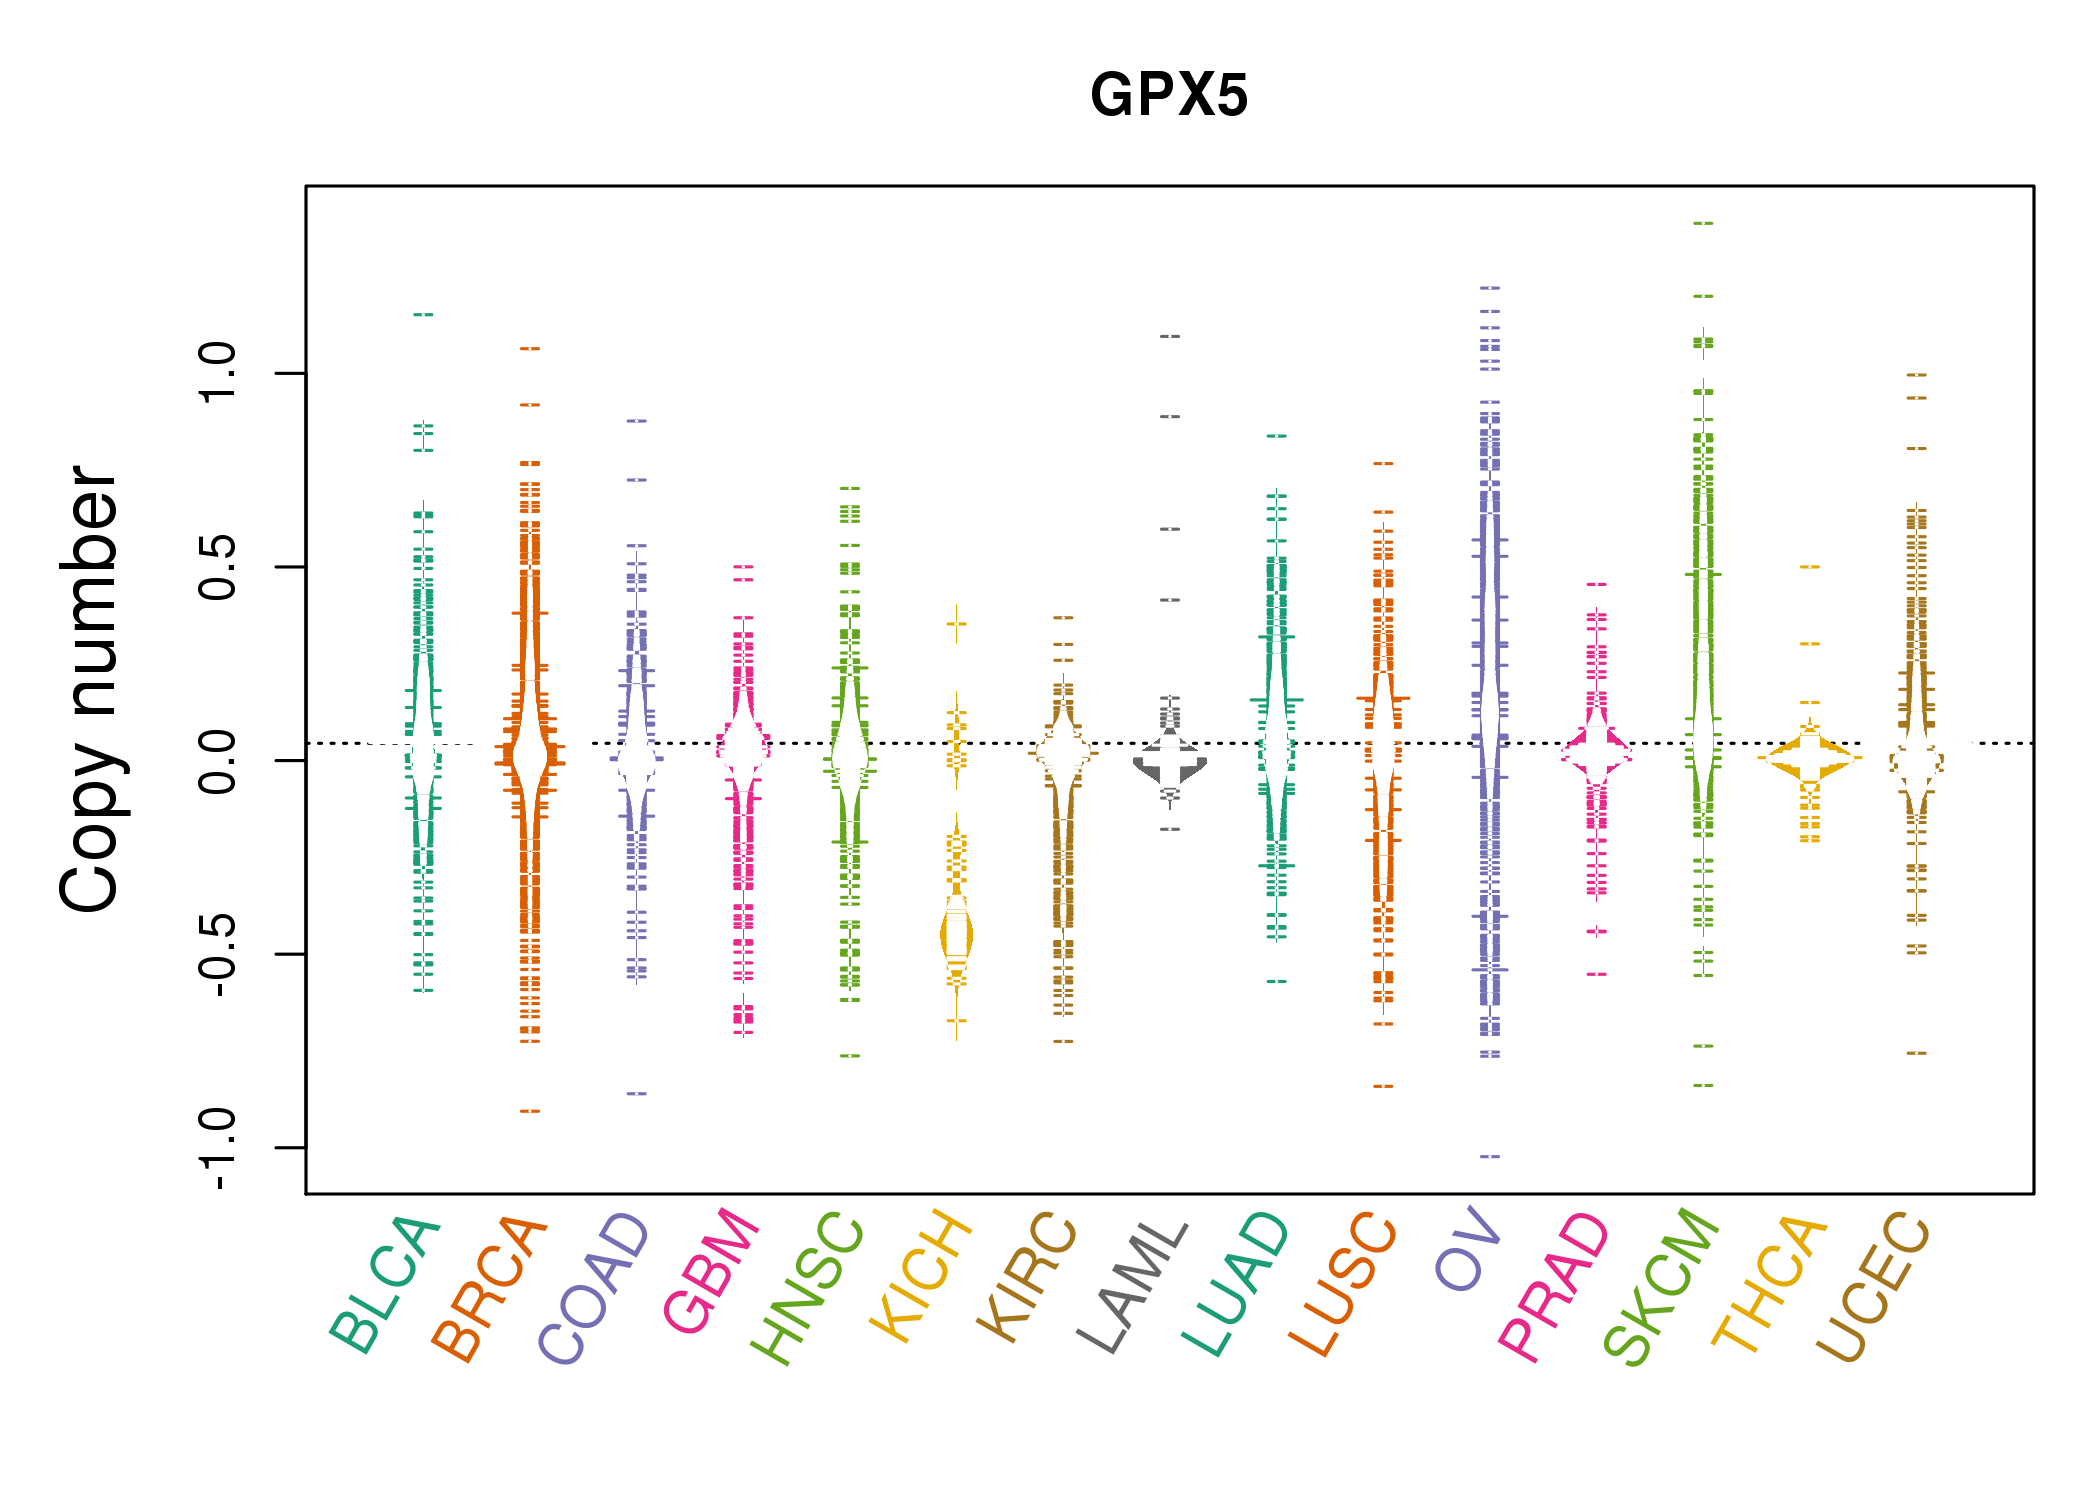
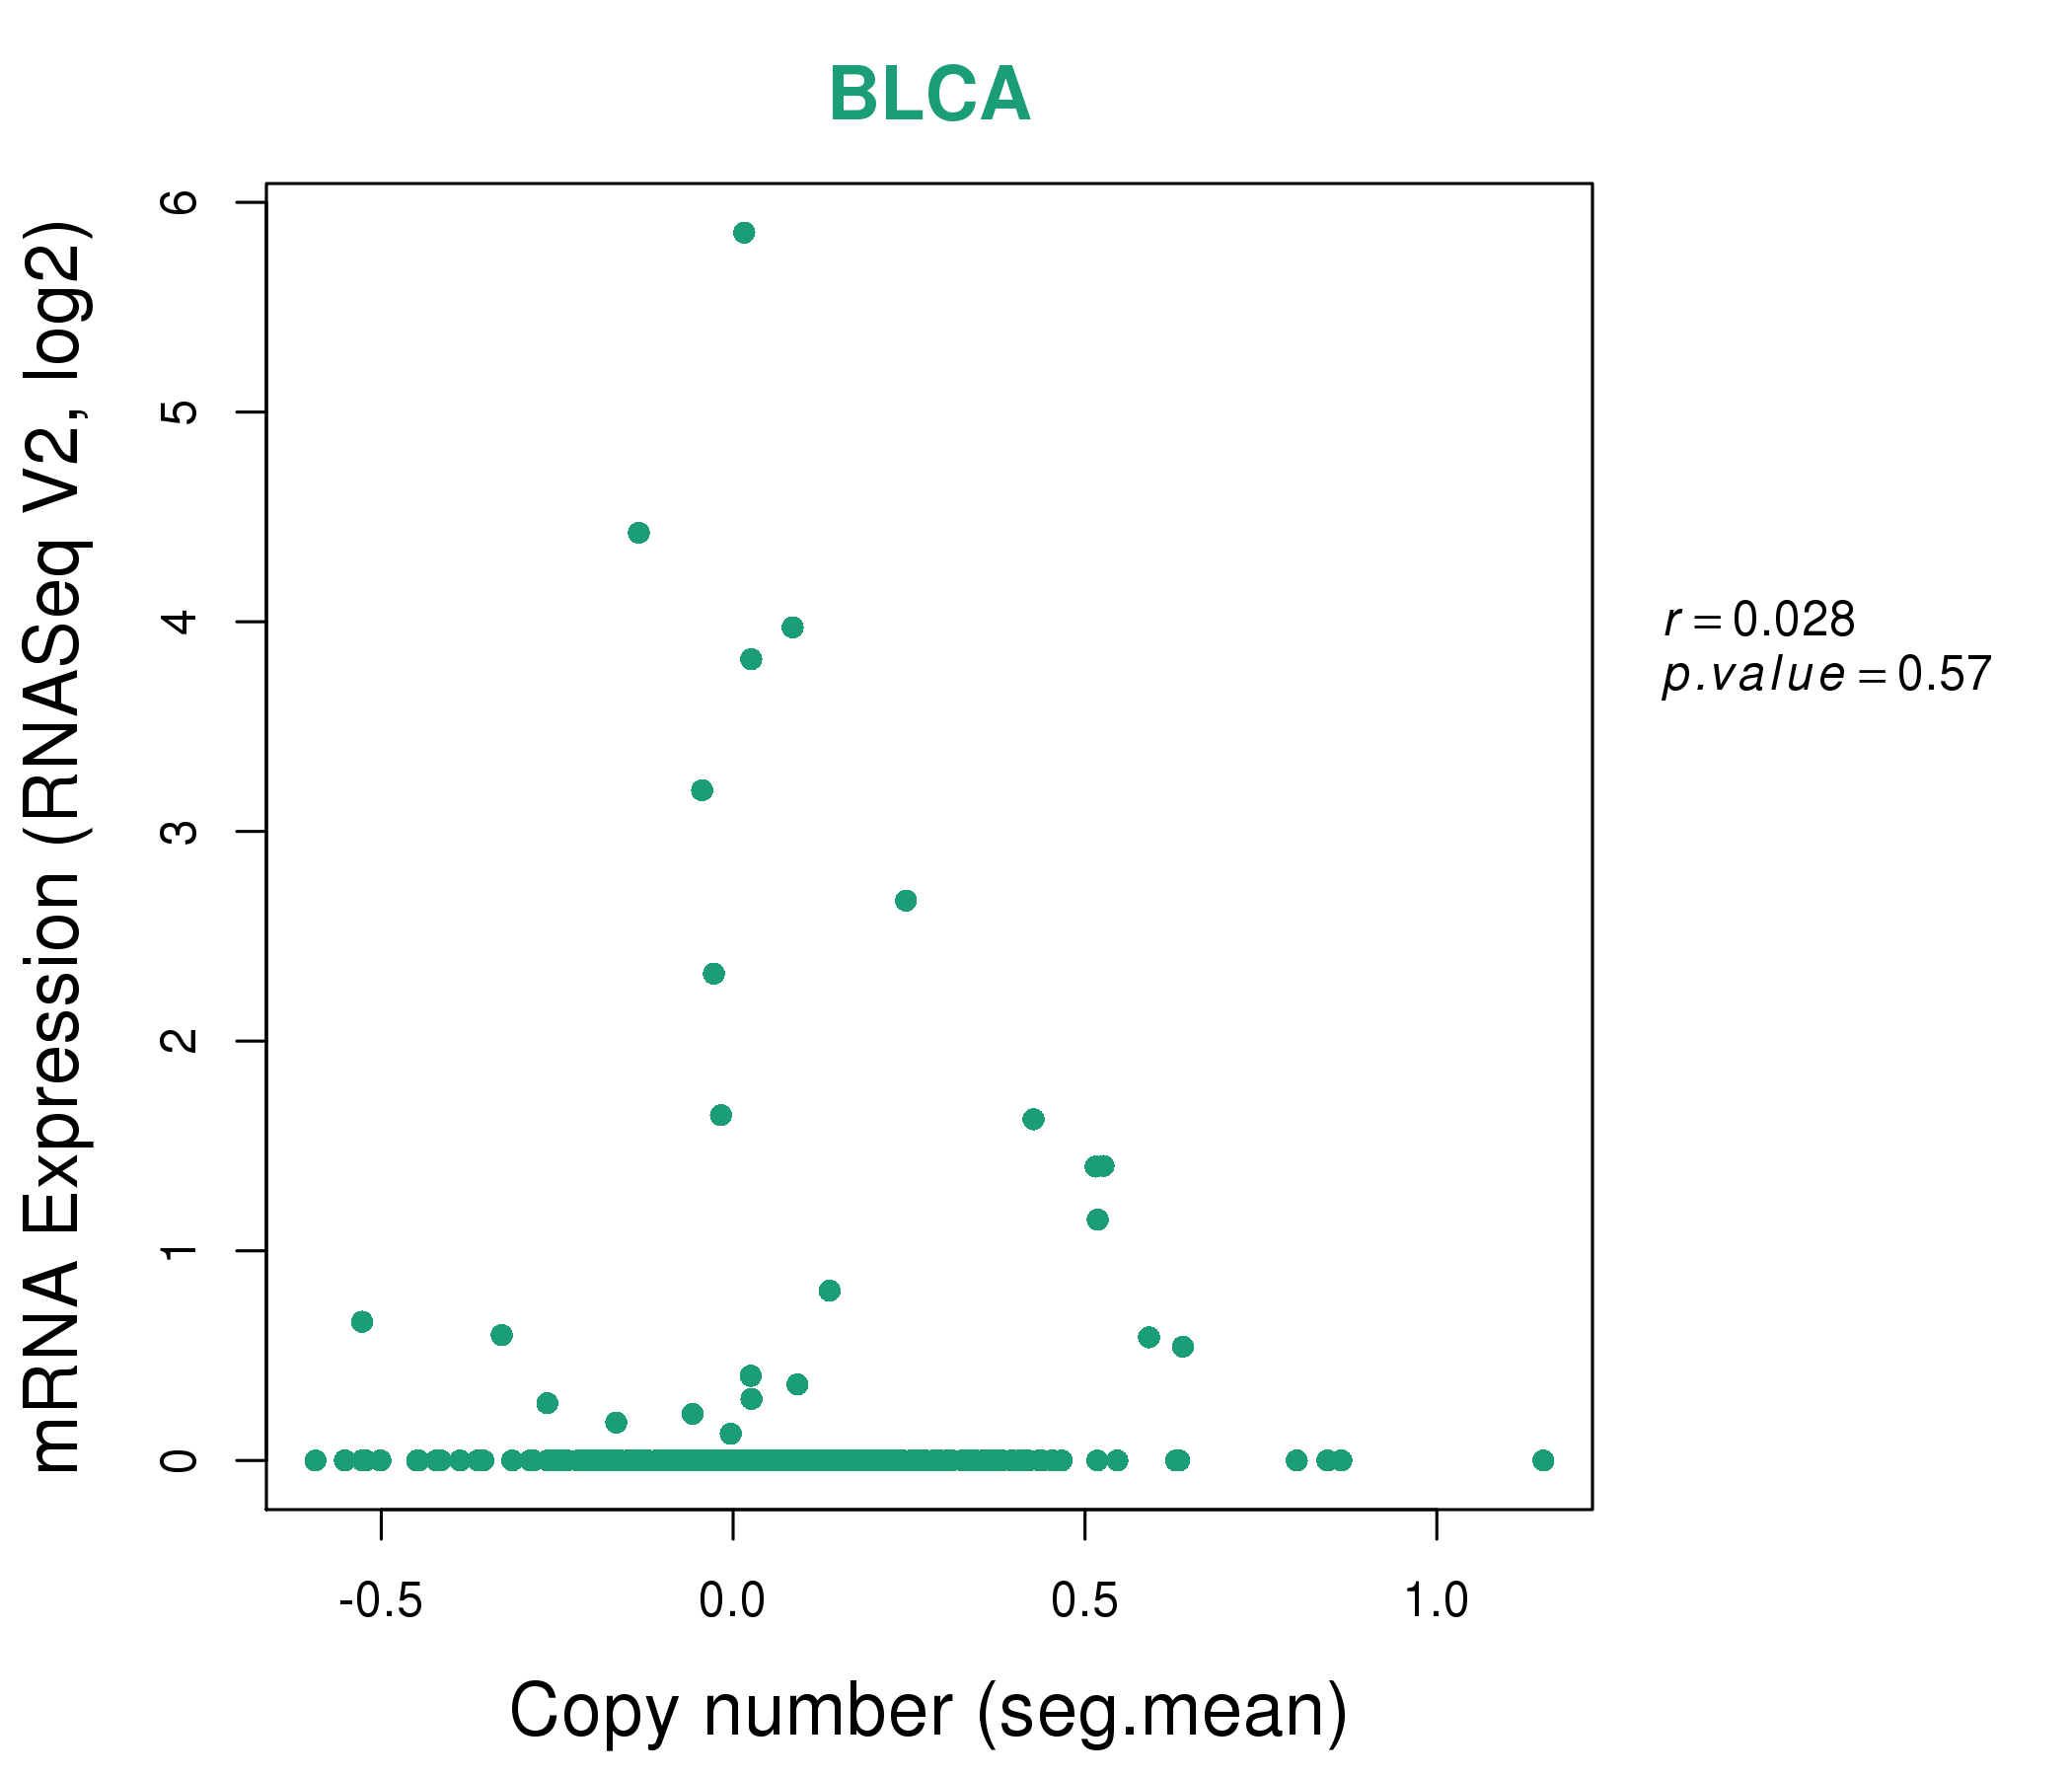
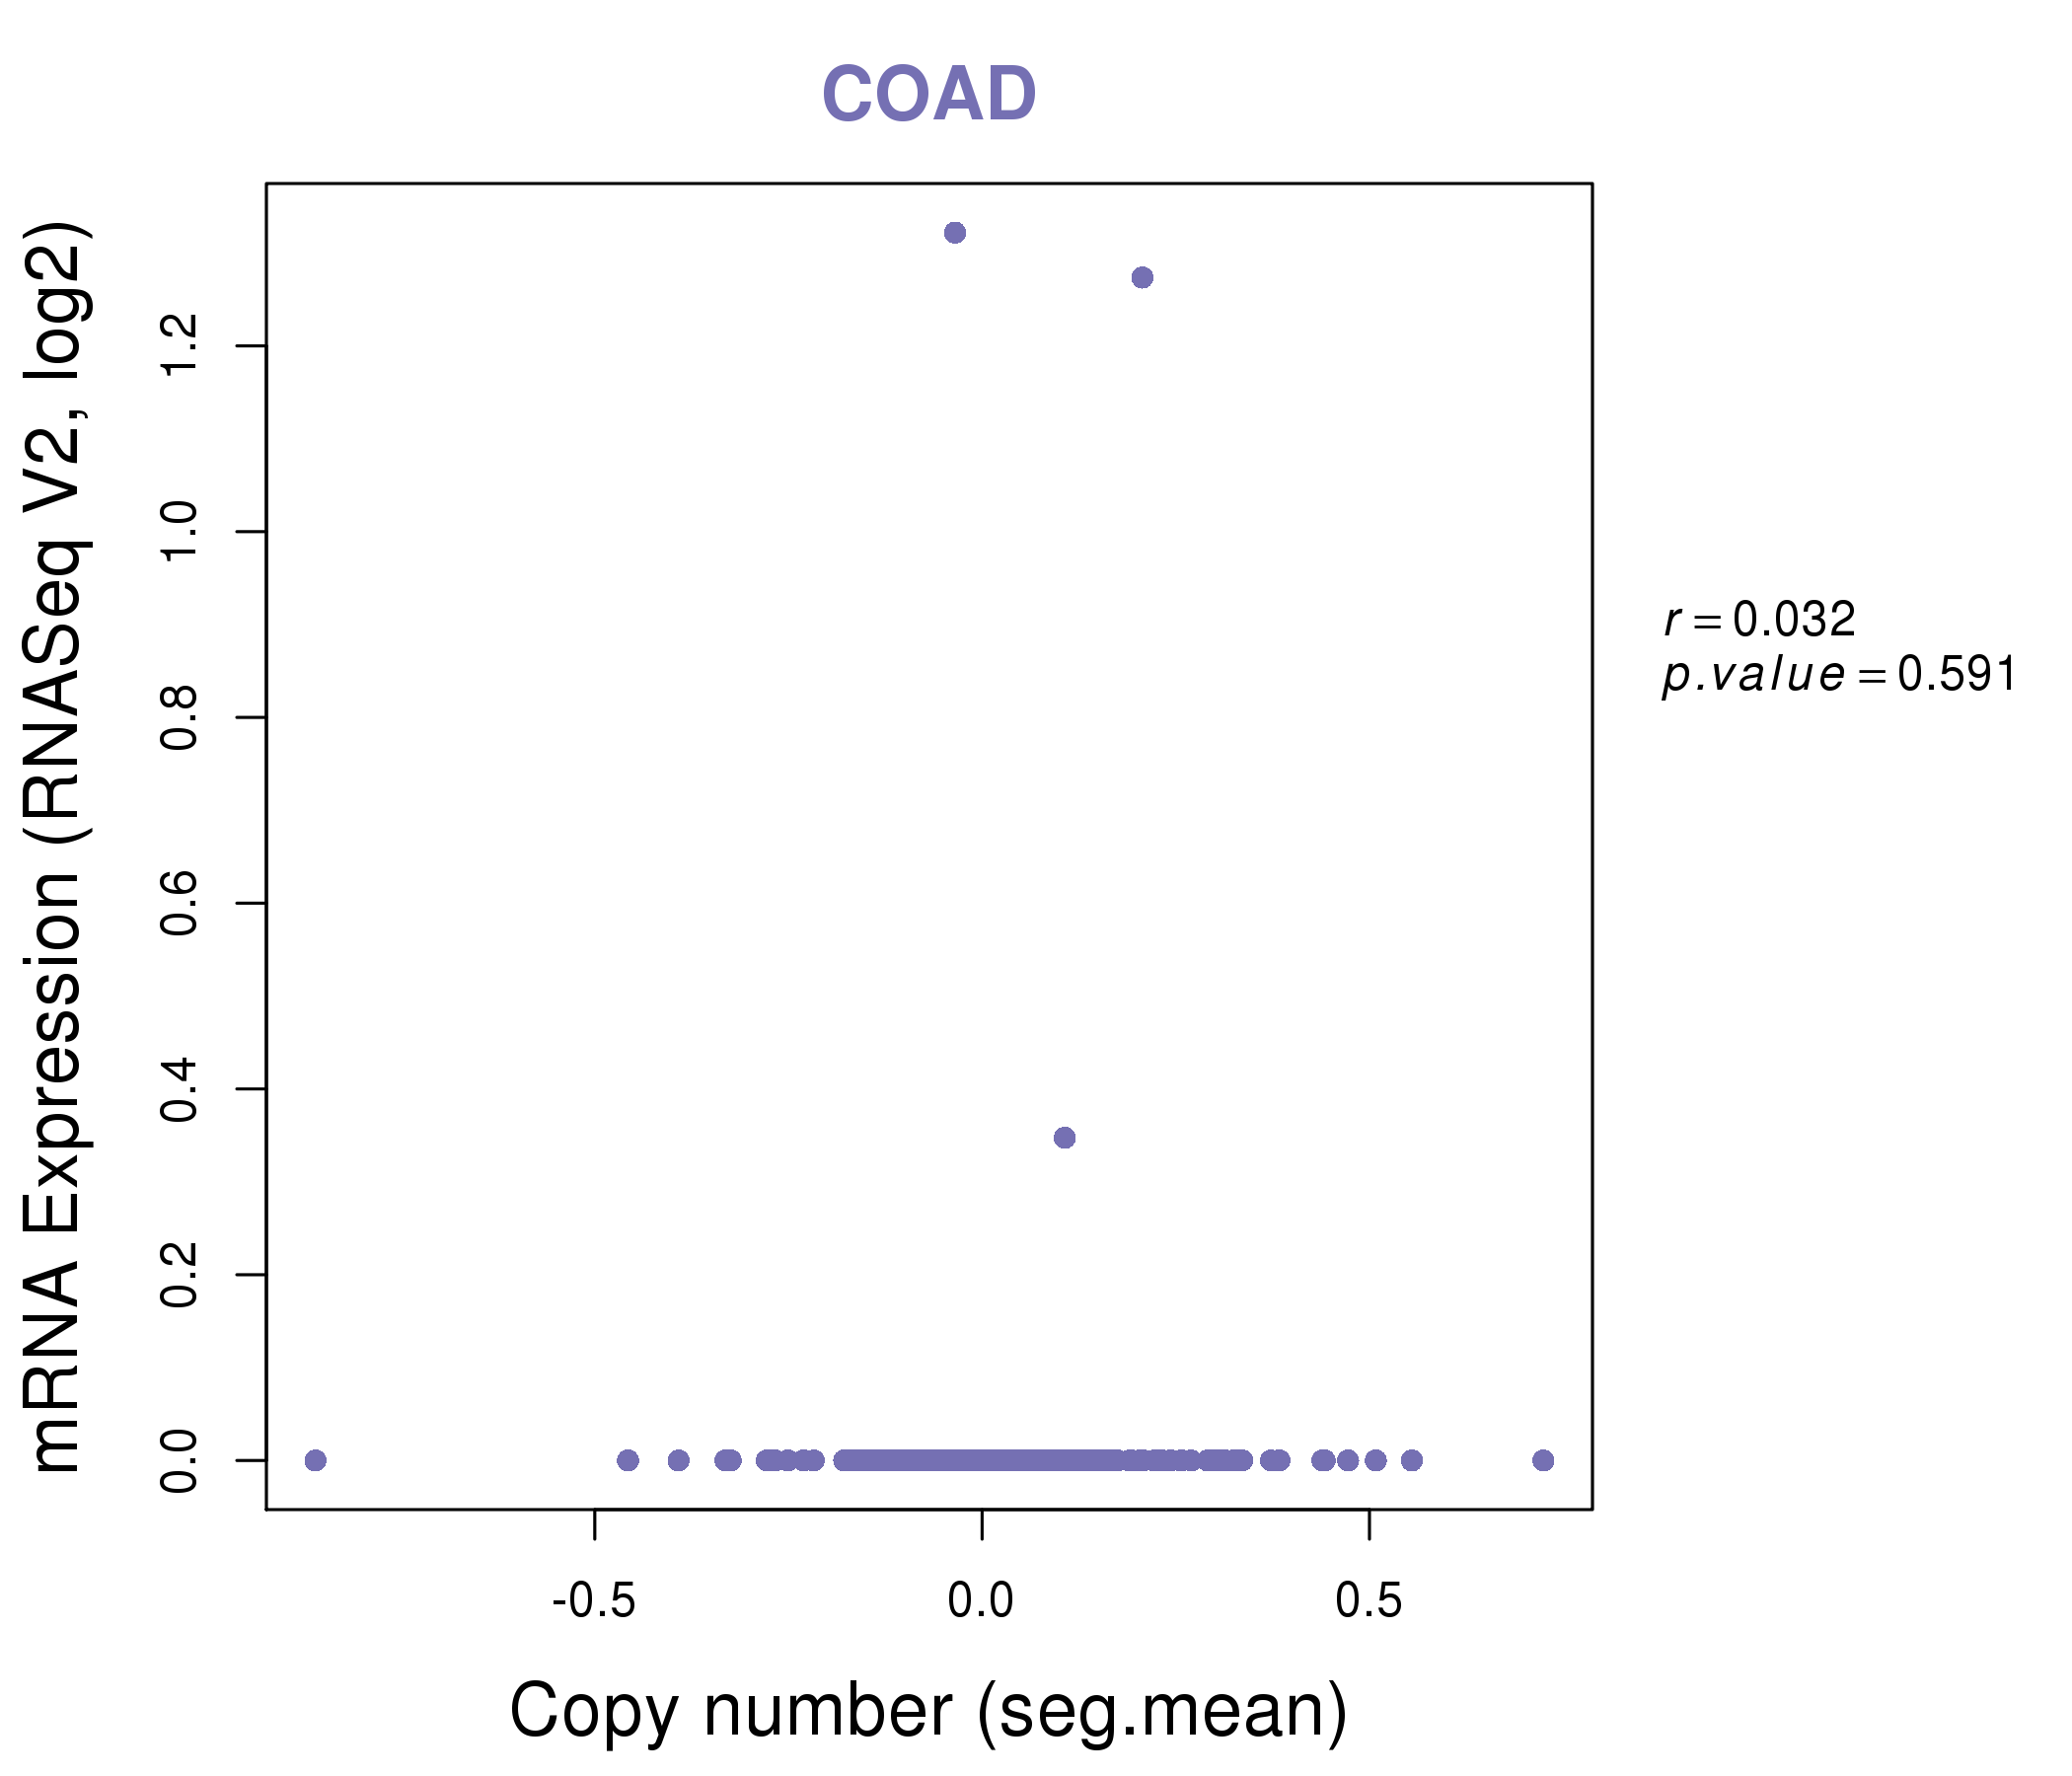
| * Copy number data were extracted from TCGA using R package TCGA-Assembler. The URLs of all public data files on TCGA DCC data server were gathered on Jan-05-2015. Function ProcessCNAData in TCGA-Assembler package was used to obtain gene-level copy number value which is calculated as the average copy number of the genomic region of a gene. |
 |
| cf) Tissue ID[Tissue type]: BLCA[Bladder Urothelial Carcinoma], BRCA[Breast invasive carcinoma], CESC[Cervical squamous cell carcinoma and endocervical adenocarcinoma], COAD[Colon adenocarcinoma], GBM[Glioblastoma multiforme], Glioma Low Grade, HNSC[Head and Neck squamous cell carcinoma], KICH[Kidney Chromophobe], KIRC[Kidney renal clear cell carcinoma], KIRP[Kidney renal papillary cell carcinoma], LAML[Acute Myeloid Leukemia], LUAD[Lung adenocarcinoma], LUSC[Lung squamous cell carcinoma], OV[Ovarian serous cystadenocarcinoma ], PAAD[Pancreatic adenocarcinoma], PRAD[Prostate adenocarcinoma], SKCM[Skin Cutaneous Melanoma], STAD[Stomach adenocarcinoma], THCA[Thyroid carcinoma], UCEC[Uterine Corpus Endometrial Carcinoma] |
| Top |
| Gene Expression for GPX5 |
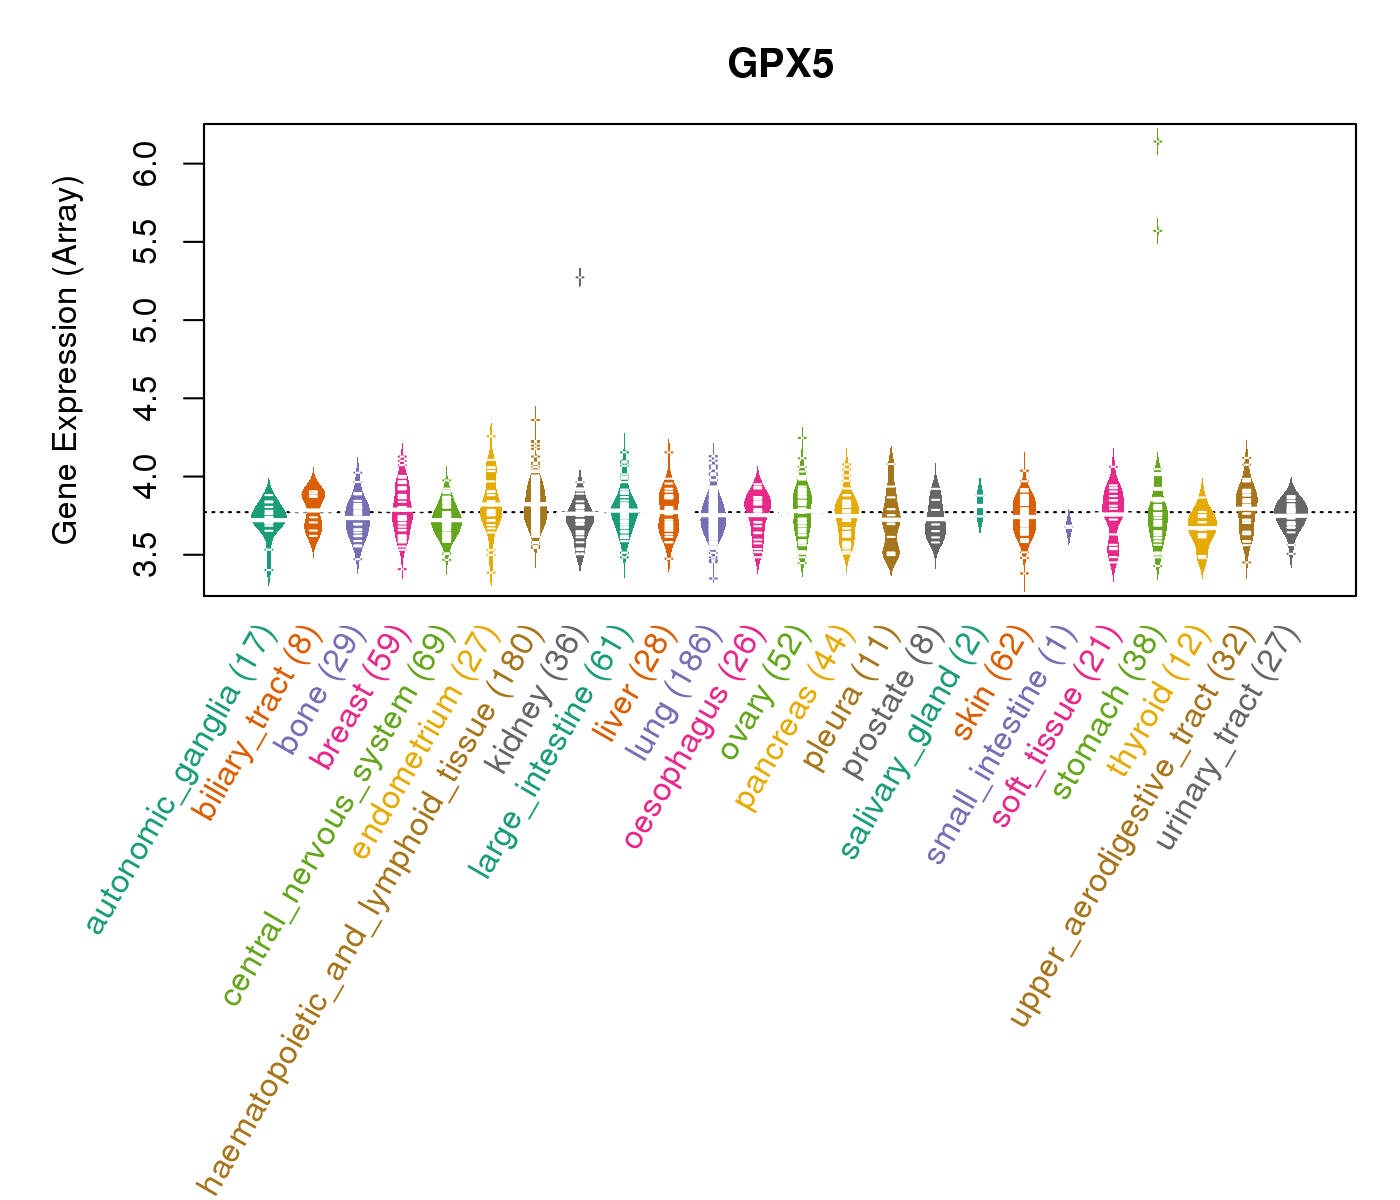
| * CCLE gene expression data were extracted from CCLE_Expression_Entrez_2012-10-18.res: Gene-centric RMA-normalized mRNA expression data. |
 |
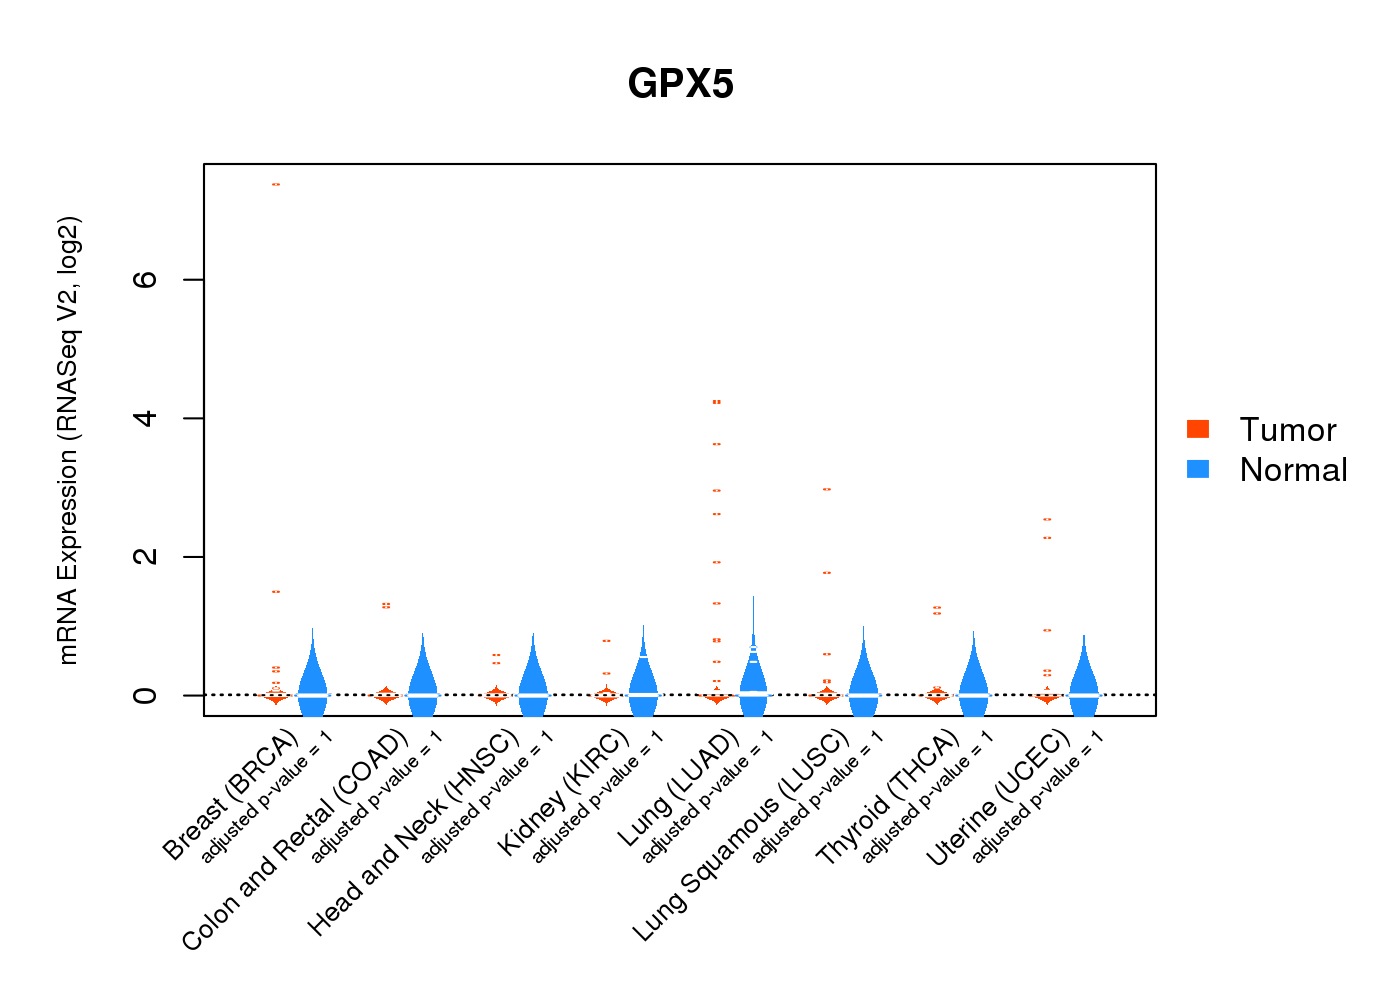
| * Normalized gene expression data of RNASeqV2 was extracted from TCGA using R package TCGA-Assembler. The URLs of all public data files on TCGA DCC data server were gathered at Jan-05-2015. Only eight cancer types have enough normal control samples for differential expression analysis. (t test, adjusted p<0.05 (using Benjamini-Hochberg FDR)) |
 |
| Top |
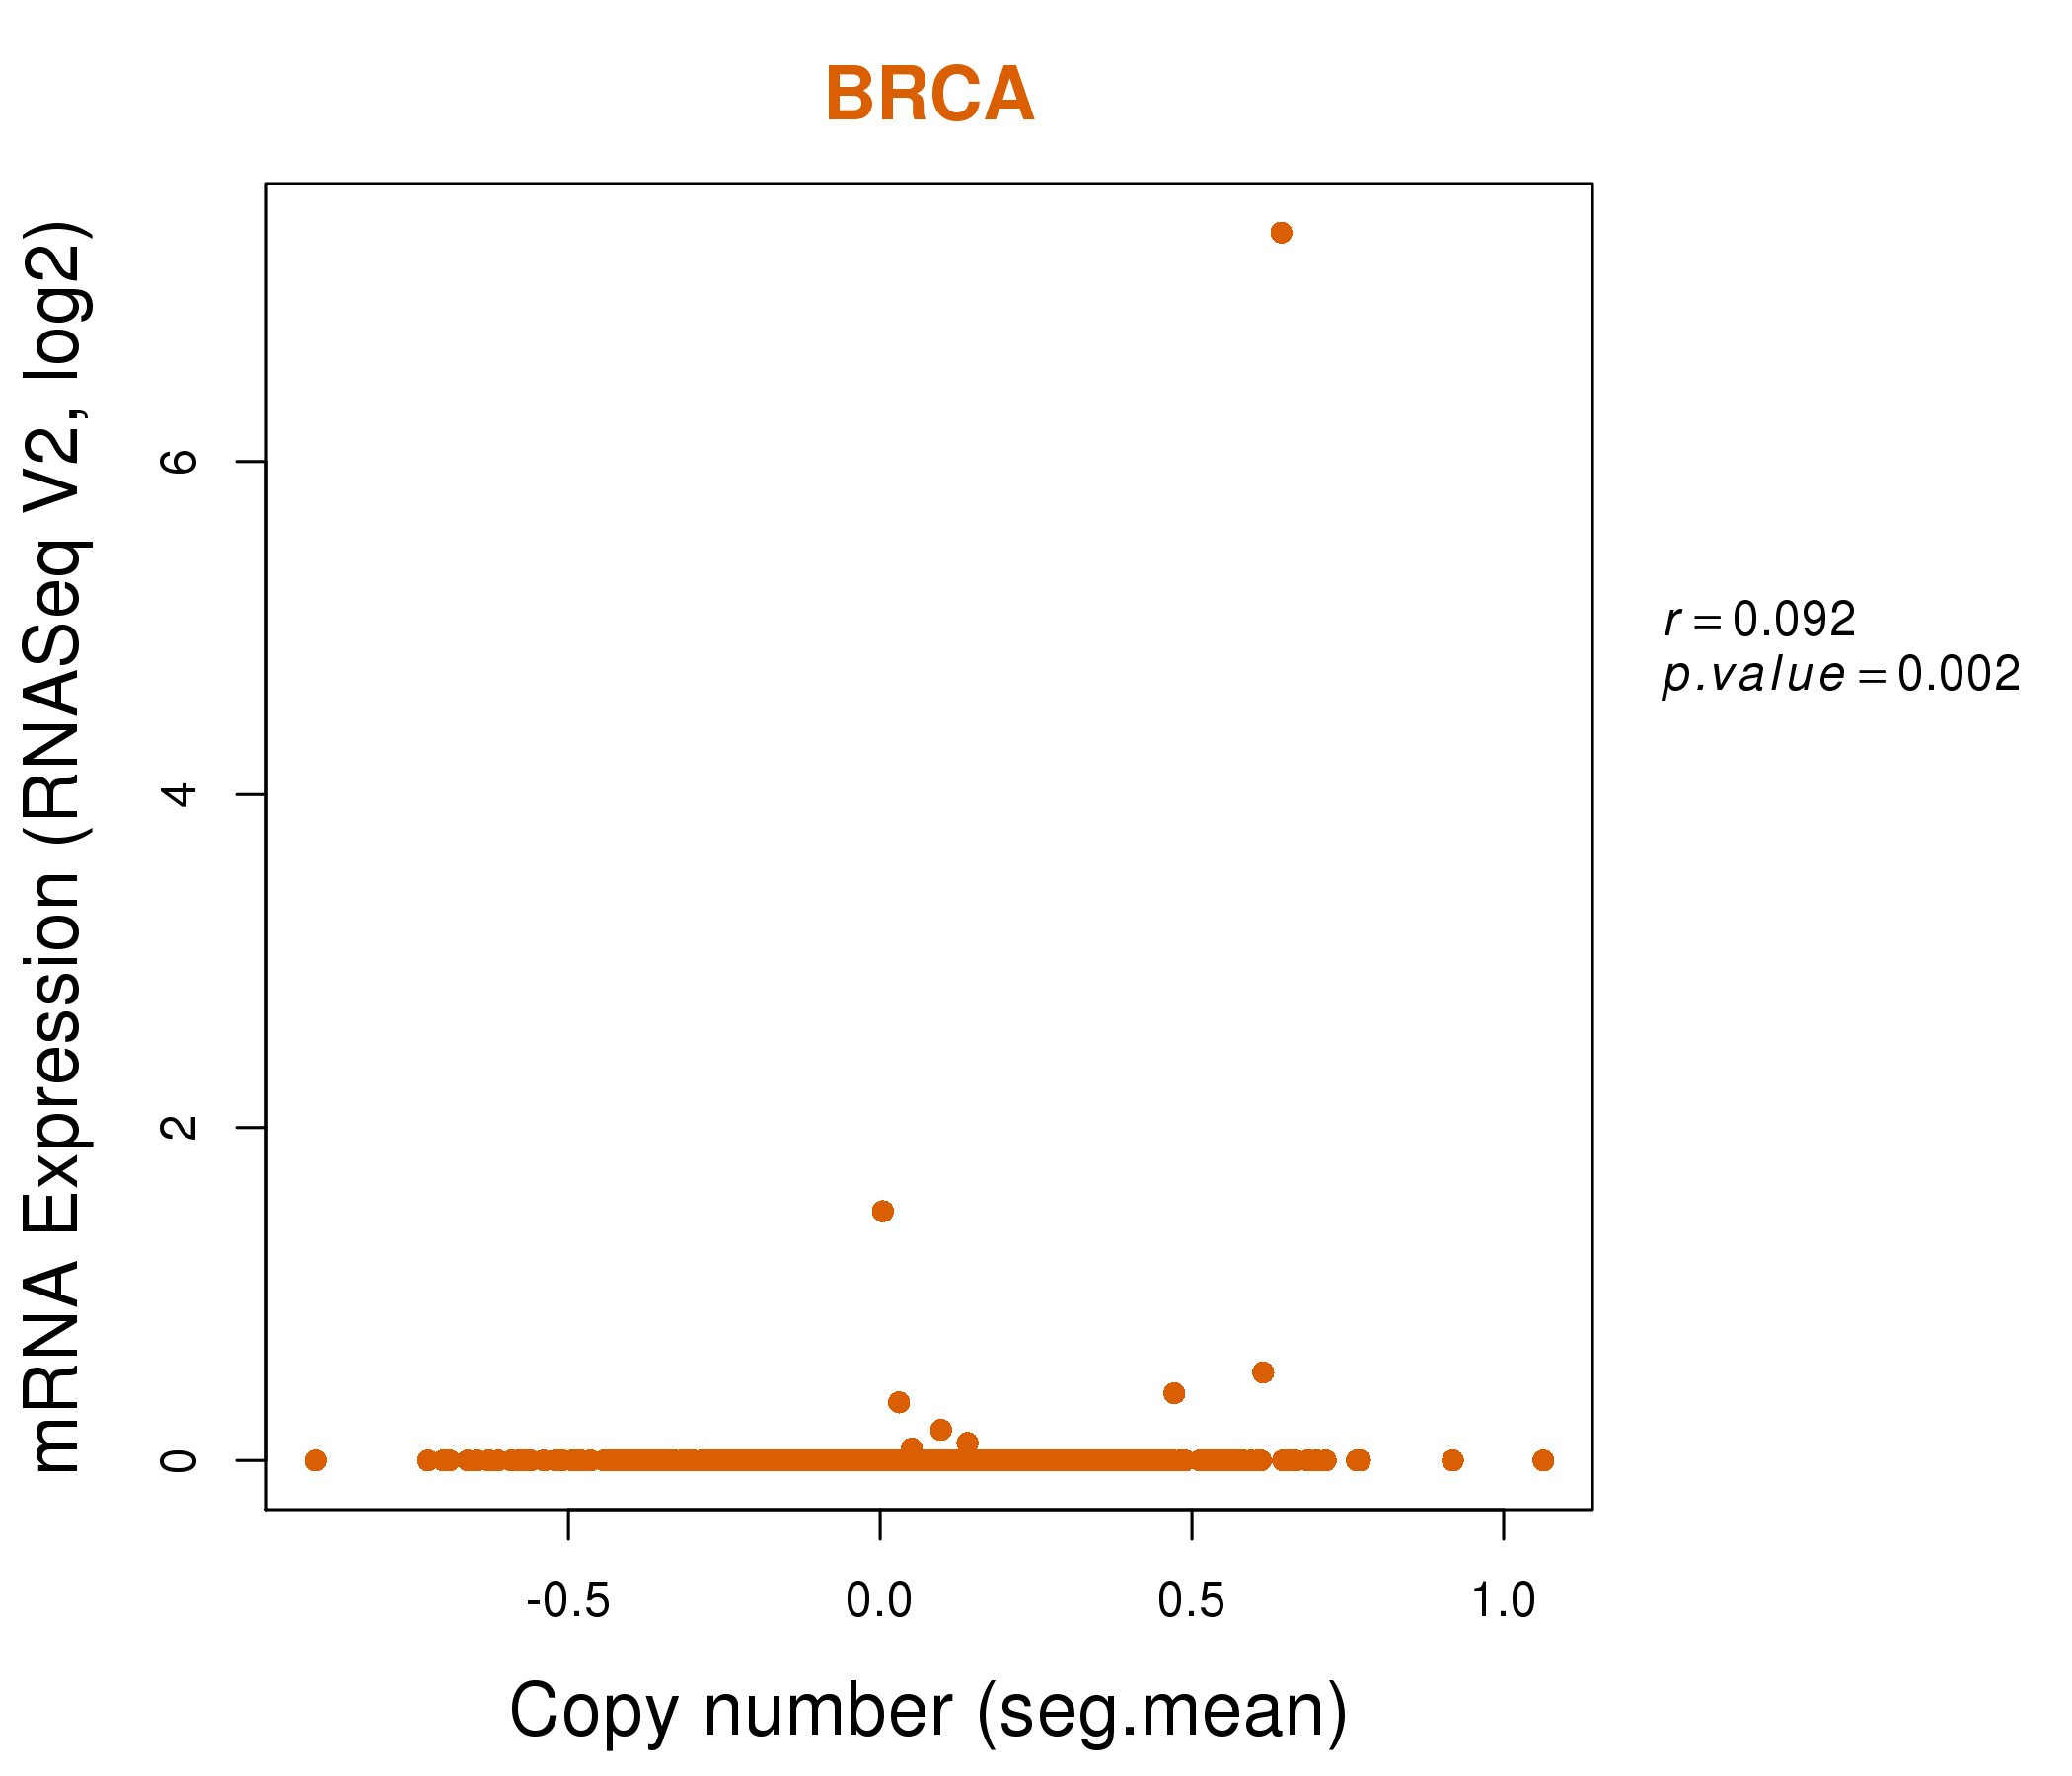
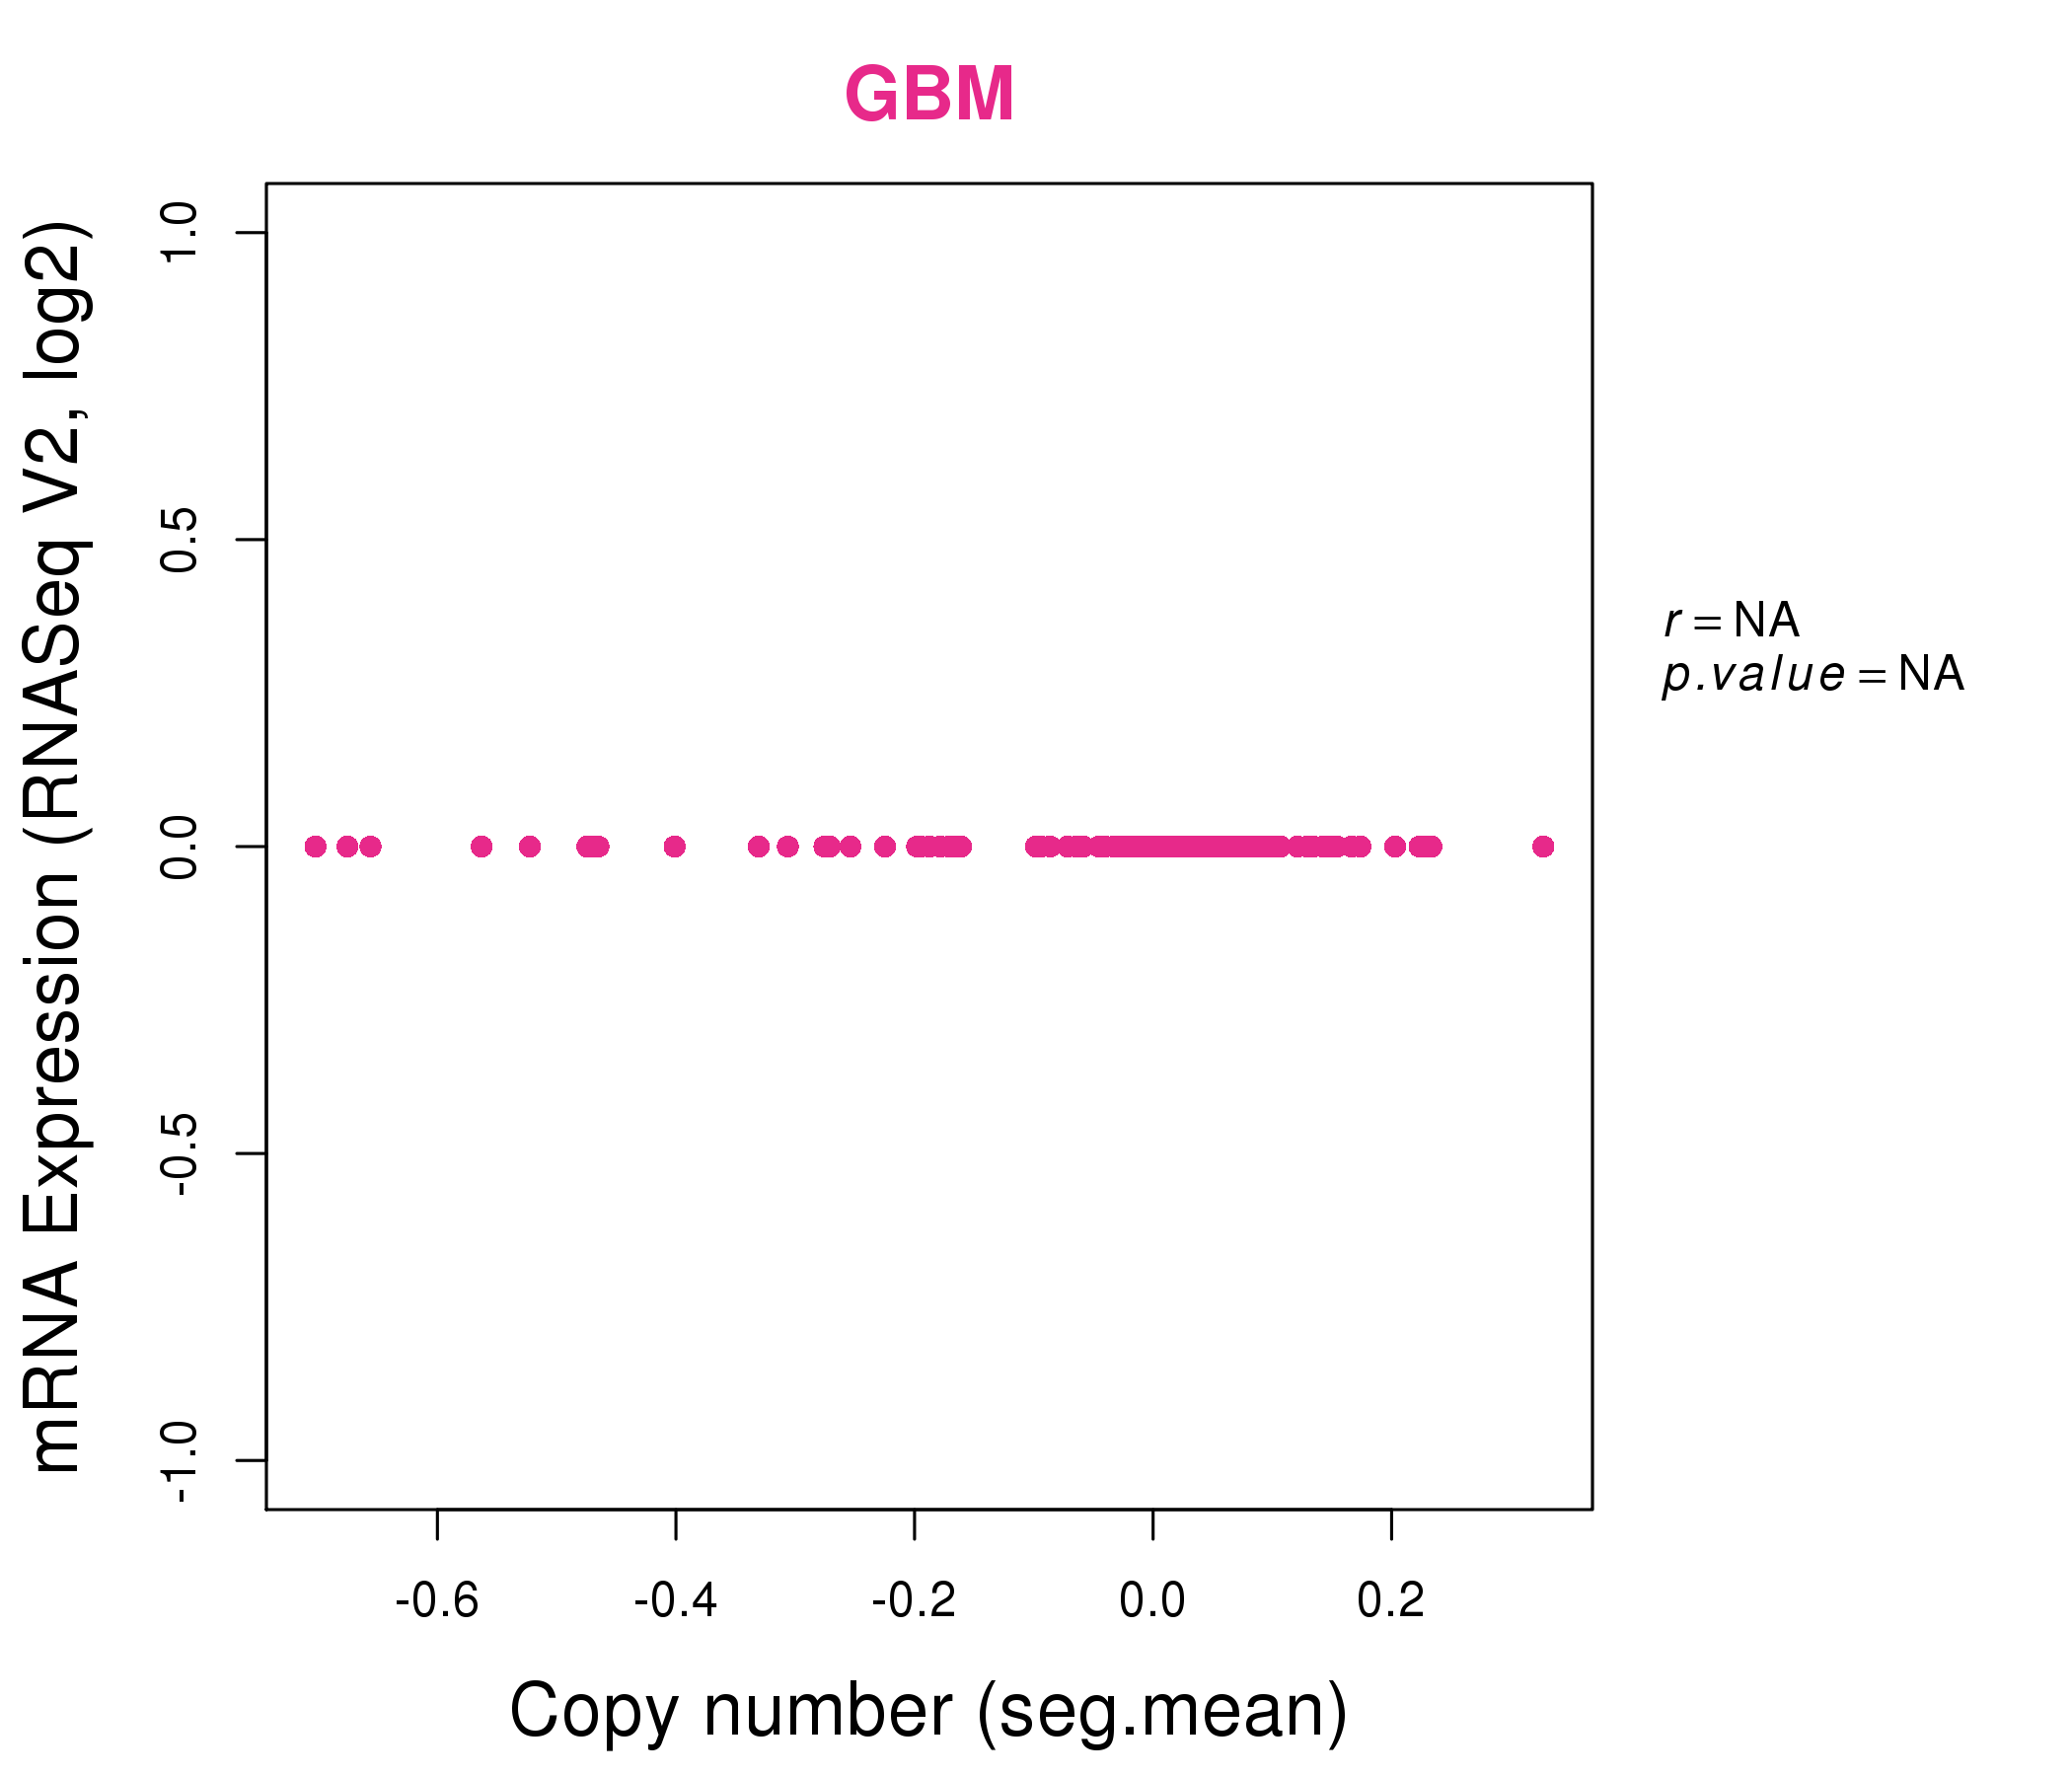
| * This plots show the correlation between CNV and gene expression. |
: Open all plots for all cancer types
 |
|
 |
|
| Top |
| Gene-Gene Network Information |
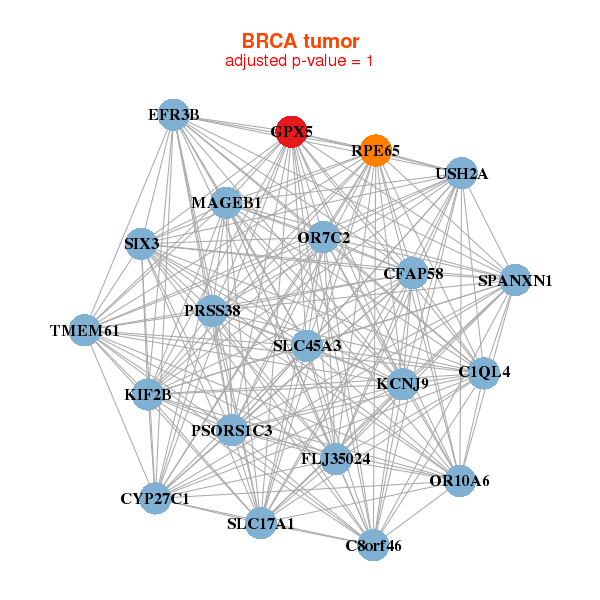
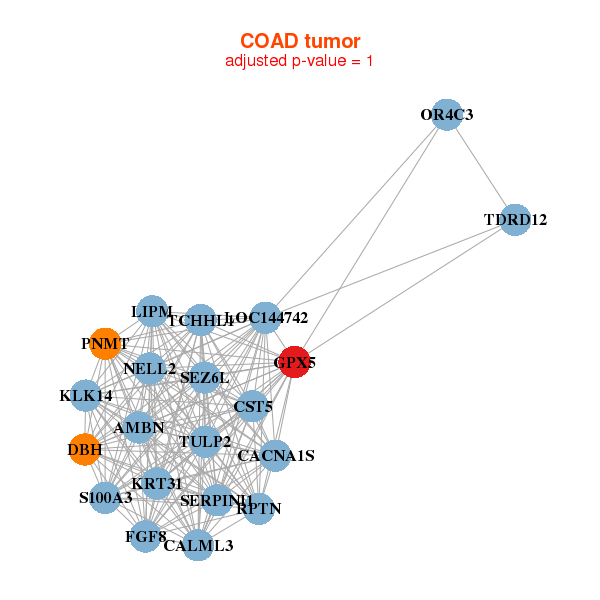
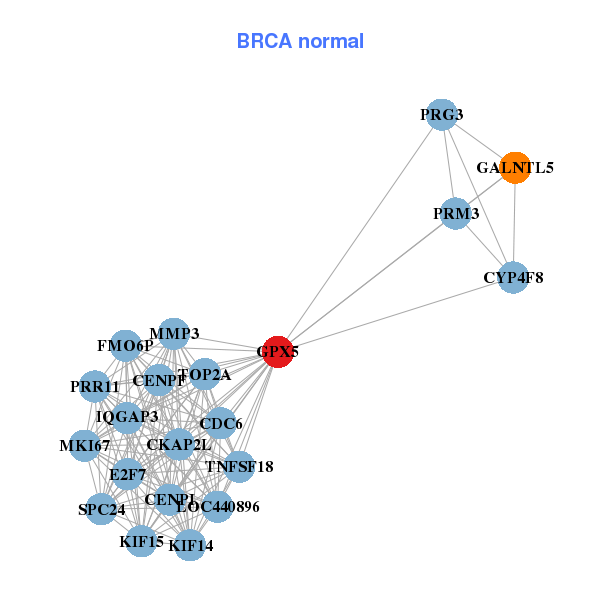
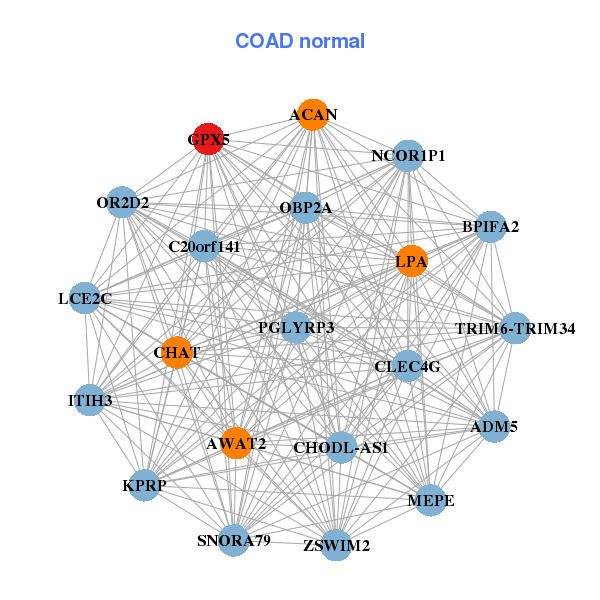
| * Co-Expression network figures were drawn using R package igraph. Only the top 20 genes with the highest correlations were shown. Red circle: input gene, orange circle: cell metabolism gene, sky circle: other gene |
: Open all plots for all cancer types
 |
| ||||
| C1QL4,C8orf46,CFAP58,CYP27C1,EFR3B,FLJ35024,GPX5, KCNJ9,KIF2B,MAGEB1,OR10A6,OR7C2,PRSS38,PSORS1C3, RPE65,SIX3,SLC17A1,SLC45A3,SPANXN1,TMEM61,USH2A | CDC6,CENPF,CENPI,CKAP2L,CYP4F8,E2F7,FMO6P, GALNTL5,GPX5,IQGAP3,KIF14,KIF15,LOC440896,MKI67, MMP3,PRG3,PRM3,PRR11,SPC24,TNFSF18,TOP2A | ||||
 |
| ||||
| AMBN,CACNA1S,CALML3,CST5,DBH,FGF8,GPX5, KLK14,KRT31,LIPM,LOC144742,NELL2,OR4C3,PNMT, RPTN,S100A3,SERPINI1,SEZ6L,TCHHL1,TDRD12,TULP2 | ACAN,AWAT2,ADM5,C20orf141,NCOR1P1,BPIFA2,CHAT, CLEC4G,GPX5,ITIH3,KPRP,LCE2C,LPA,MEPE, CHODL-AS1,OBP2A,OR2D2,PGLYRP3,SNORA79,TRIM6-TRIM34,ZSWIM2 |
| * Co-Expression network figures were drawn using R package igraph. Only the top 20 genes with the highest correlations were shown. Red circle: input gene, orange circle: cell metabolism gene, sky circle: other gene |
: Open all plots for all cancer types
| Top |
: Open all interacting genes' information including KEGG pathway for all interacting genes from DAVID
| Top |
| Pharmacological Information for GPX5 |
| DB Category | DB Name | DB's ID and Url link |
| Organism-specific databases | PharmGKB | PA28953; -. |
| Organism-specific databases | CTD | 2880; -. |
| * Gene Centered Interaction Network. |
 |
| * Drug Centered Interaction Network. |
| DrugBank ID | Target Name | Drug Groups | Generic Name | Drug Centered Network | Drug Structure |
| DB00143 | glutathione peroxidase 5 (epididymal androgen-related protein) | approved; nutraceutical | Glutathione |  |  |
| DB00515 | glutathione peroxidase 5 (epididymal androgen-related protein) | approved | Cisplatin |  |  |
| Top |
| Cross referenced IDs for GPX5 |
| * We obtained these cross-references from Uniprot database. It covers 150 different DBs, 18 categories. http://www.uniprot.org/help/cross_references_section |
: Open all cross reference information
|
Copyright © 2016-Present - The Univsersity of Texas Health Science Center at Houston @ |