|
||||||||||||||||||||
| |
| Phenotypic Information (metabolism pathway, cancer, disease, phenome) |
| |
| |
| Gene-Gene Network Information: Co-Expression Network, Interacting Genes & KEGG |
| |
|


| Gene Summary for SPCS1 |
| Top |
| Phenotypic Information for SPCS1(metabolism pathway, cancer, disease, phenome) |
| Cancer | CGAP: SPCS1 |
| Familial Cancer Database: SPCS1 | |
| * This gene is included in those cancer gene databases. |
|
|
|
|
|
|
| ||||||||||||||
Oncogene 1 | Significant driver gene in | |||||||||||||||||||
| cf) number; DB name 1 Oncogene; http://nar.oxfordjournals.org/content/35/suppl_1/D721.long, 2 Tumor Suppressor gene; https://bioinfo.uth.edu/TSGene/, 3 Cancer Gene Census; http://www.nature.com/nrc/journal/v4/n3/abs/nrc1299.html, 4 CancerGenes; http://nar.oxfordjournals.org/content/35/suppl_1/D721.long, 5 Network of Cancer Gene; http://ncg.kcl.ac.uk/index.php, 1Therapeutic Vulnerabilities in Cancer; http://cbio.mskcc.org/cancergenomics/statius/ |
| REACTOME_INTEGRATION_OF_ENERGY_METABOLISM REACTOME_METABOLISM_OF_PROTEINS | |
| OMIM | |
| Orphanet | |
| Disease | KEGG Disease: SPCS1 |
| MedGen: SPCS1 (Human Medical Genetics with Condition) | |
| ClinVar: SPCS1 | |
| Phenotype | MGI: SPCS1 (International Mouse Phenotyping Consortium) |
| PhenomicDB: SPCS1 | |
| Mutations for SPCS1 |
| * Under tables are showing count per each tissue to give us broad intuition about tissue specific mutation patterns.You can go to the detailed page for each mutation database's web site. |
| - Statistics for Tissue and Mutation type | Top |
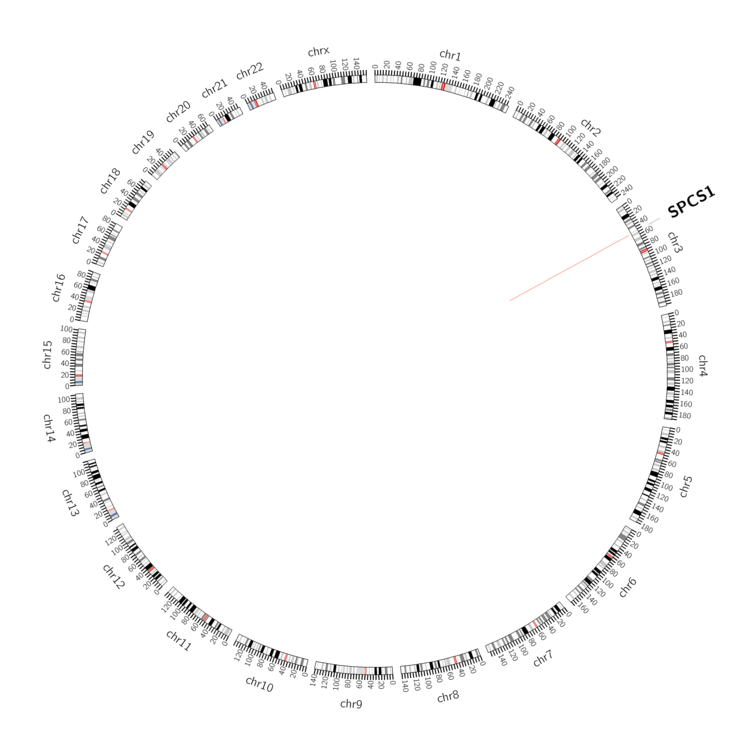 |
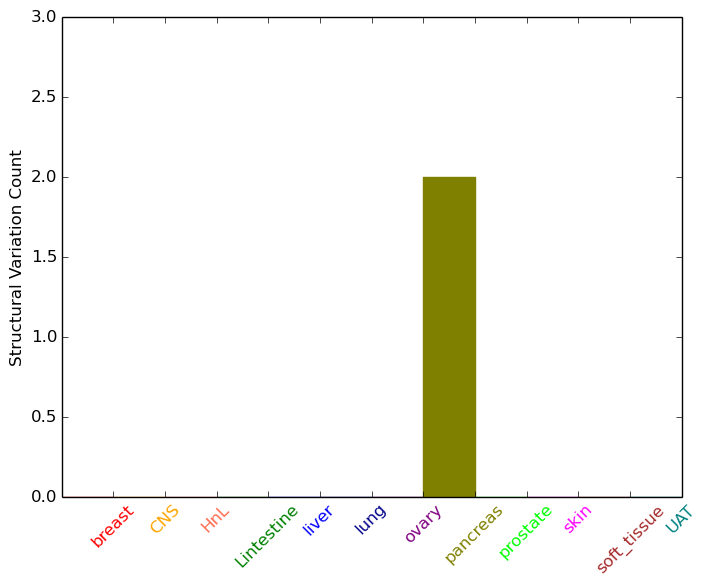
| - For Inter-chromosomal Variations |
| There's no inter-chromosomal structural variation. |
| - For Intra-chromosomal Variations |
| * Intra-chromosomal variantions includes 'intrachromosomal amplicon to amplicon', 'intrachromosomal amplicon to non-amplified dna', 'intrachromosomal deletion', 'intrachromosomal fold-back inversion', 'intrachromosomal inversion', 'intrachromosomal tandem duplication', 'Intrachromosomal unknown type', 'intrachromosomal with inverted orientation', 'intrachromosomal with non-inverted orientation'. |
 |
| Sample | Symbol_a | Chr_a | Start_a | End_a | Symbol_b | Chr_b | Start_b | End_b |
| pancreas | SPCS1 | chr3 | 52741727 | 52741747 | chr3 | 52742961 | 52742981 |
| cf) Tissue number; Tissue name (1;Breast, 2;Central_nervous_system, 3;Haematopoietic_and_lymphoid_tissue, 4;Large_intestine, 5;Liver, 6;Lung, 7;Ovary, 8;Pancreas, 9;Prostate, 10;Skin, 11;Soft_tissue, 12;Upper_aerodigestive_tract) |
| * From mRNA Sanger sequences, Chitars2.0 arranged chimeric transcripts. This table shows SPCS1 related fusion information. |
| ID | Head Gene | Tail Gene | Accession | Gene_a | qStart_a | qEnd_a | Chromosome_a | tStart_a | tEnd_a | Gene_a | qStart_a | qEnd_a | Chromosome_a | tStart_a | tEnd_a |
| BQ680964 | SPCS1 | 2 | 613 | 3 | 52740677 | 52742184 | EBNA1BP2 | 603 | 624 | 1 | 43676600 | 43676621 | |
| BI335113 | CIB1 | 1 | 162 | 15 | 90773536 | 90773698 | SPCS1 | 163 | 724 | 3 | 52740153 | 52741972 | |
| BU932269 | SPCS1 | 3 | 121 | 3 | 52740135 | 52740253 | RPL4 | 115 | 652 | 15 | 66793772 | 66795784 | |
| AI221915 | SPCS1 | 2 | 121 | 3 | 52742065 | 52742184 | NTM | 120 | 328 | 11 | 131404621 | 131404829 | |
| Top |
| There's no copy number variation information in COSMIC data for this gene. |
| Top |
|
 |
| Top |
| Stat. for Non-Synonymous SNVs (# total SNVs=6) | (# total SNVs=0) |
 | |
(# total SNVs=2) | (# total SNVs=1) |
 |  |
| Top |
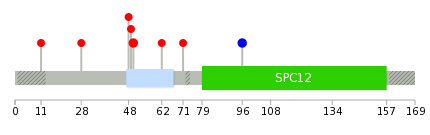
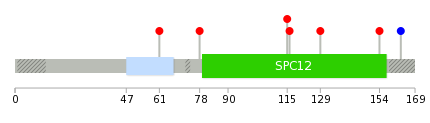
| * When you move the cursor on each content, you can see more deailed mutation information on the Tooltip. Those are primary_site,primary_histology,mutation(aa),pubmedID. |
| GRCh37 position | Mutation(aa) | Unique sampleID count |
| chr3:52740861-52740861 | p.Y50C | 2 |
| chr3:52741807-52741807 | p.K96K | 2 |
| chr3:52740666-52740666 | p.K15* | 1 |
| chr3:52740706-52740706 | p.I28T | 1 |
| chr3:52740708-52740709 | p.S31fs*13 | 1 |
| chr3:52740855-52740855 | p.T48I | 1 |
| chr3:52740858-52740858 | p.V49G | 1 |
| chr3:52741704-52741704 | p.L62R | 1 |
| chr3:52741730-52741730 | p.R71C | 1 |
| chr3:52741771-52741772 | p.T85fs*11 | 1 |
| Top |
|
 |
| Point Mutation/ Tissue ID | 1 | 2 | 3 | 4 | 5 | 6 | 7 | 8 | 9 | 10 | 11 | 12 | 13 | 14 | 15 | 16 | 17 | 18 | 19 | 20 |
| # sample | 2 | 1 | 1 | 1 | 1 | 1 | ||||||||||||||
| # mutation | 2 | 1 | 1 | 1 | 1 | 1 | ||||||||||||||
| nonsynonymous SNV | 2 | 1 | 1 | 1 | 1 | |||||||||||||||
| synonymous SNV | 1 |
| cf) Tissue ID; Tissue type (1; BLCA[Bladder Urothelial Carcinoma], 2; BRCA[Breast invasive carcinoma], 3; CESC[Cervical squamous cell carcinoma and endocervical adenocarcinoma], 4; COAD[Colon adenocarcinoma], 5; GBM[Glioblastoma multiforme], 6; Glioma Low Grade, 7; HNSC[Head and Neck squamous cell carcinoma], 8; KICH[Kidney Chromophobe], 9; KIRC[Kidney renal clear cell carcinoma], 10; KIRP[Kidney renal papillary cell carcinoma], 11; LAML[Acute Myeloid Leukemia], 12; LUAD[Lung adenocarcinoma], 13; LUSC[Lung squamous cell carcinoma], 14; OV[Ovarian serous cystadenocarcinoma ], 15; PAAD[Pancreatic adenocarcinoma], 16; PRAD[Prostate adenocarcinoma], 17; SKCM[Skin Cutaneous Melanoma], 18:STAD[Stomach adenocarcinoma], 19:THCA[Thyroid carcinoma], 20:UCEC[Uterine Corpus Endometrial Carcinoma]) |
| Top |
| * We represented just top 10 SNVs. When you move the cursor on each content, you can see more deailed mutation information on the Tooltip. Those are primary_site, primary_histology, mutation(aa), pubmedID. |
| Genomic Position | Mutation(aa) | Unique sampleID count |
| chr3:52740293 | p.Q78K | 1 |
| chr3:52740855 | p.T115I | 1 |
| chr3:52740858 | p.V116G | 1 |
| chr3:52741704 | p.L129R | 1 |
| chr3:52741778 | p.D154H | 1 |
| chr3:52741807 | p.K163K | 1 |
| chr3:52740242 | p.C61S | 1 |
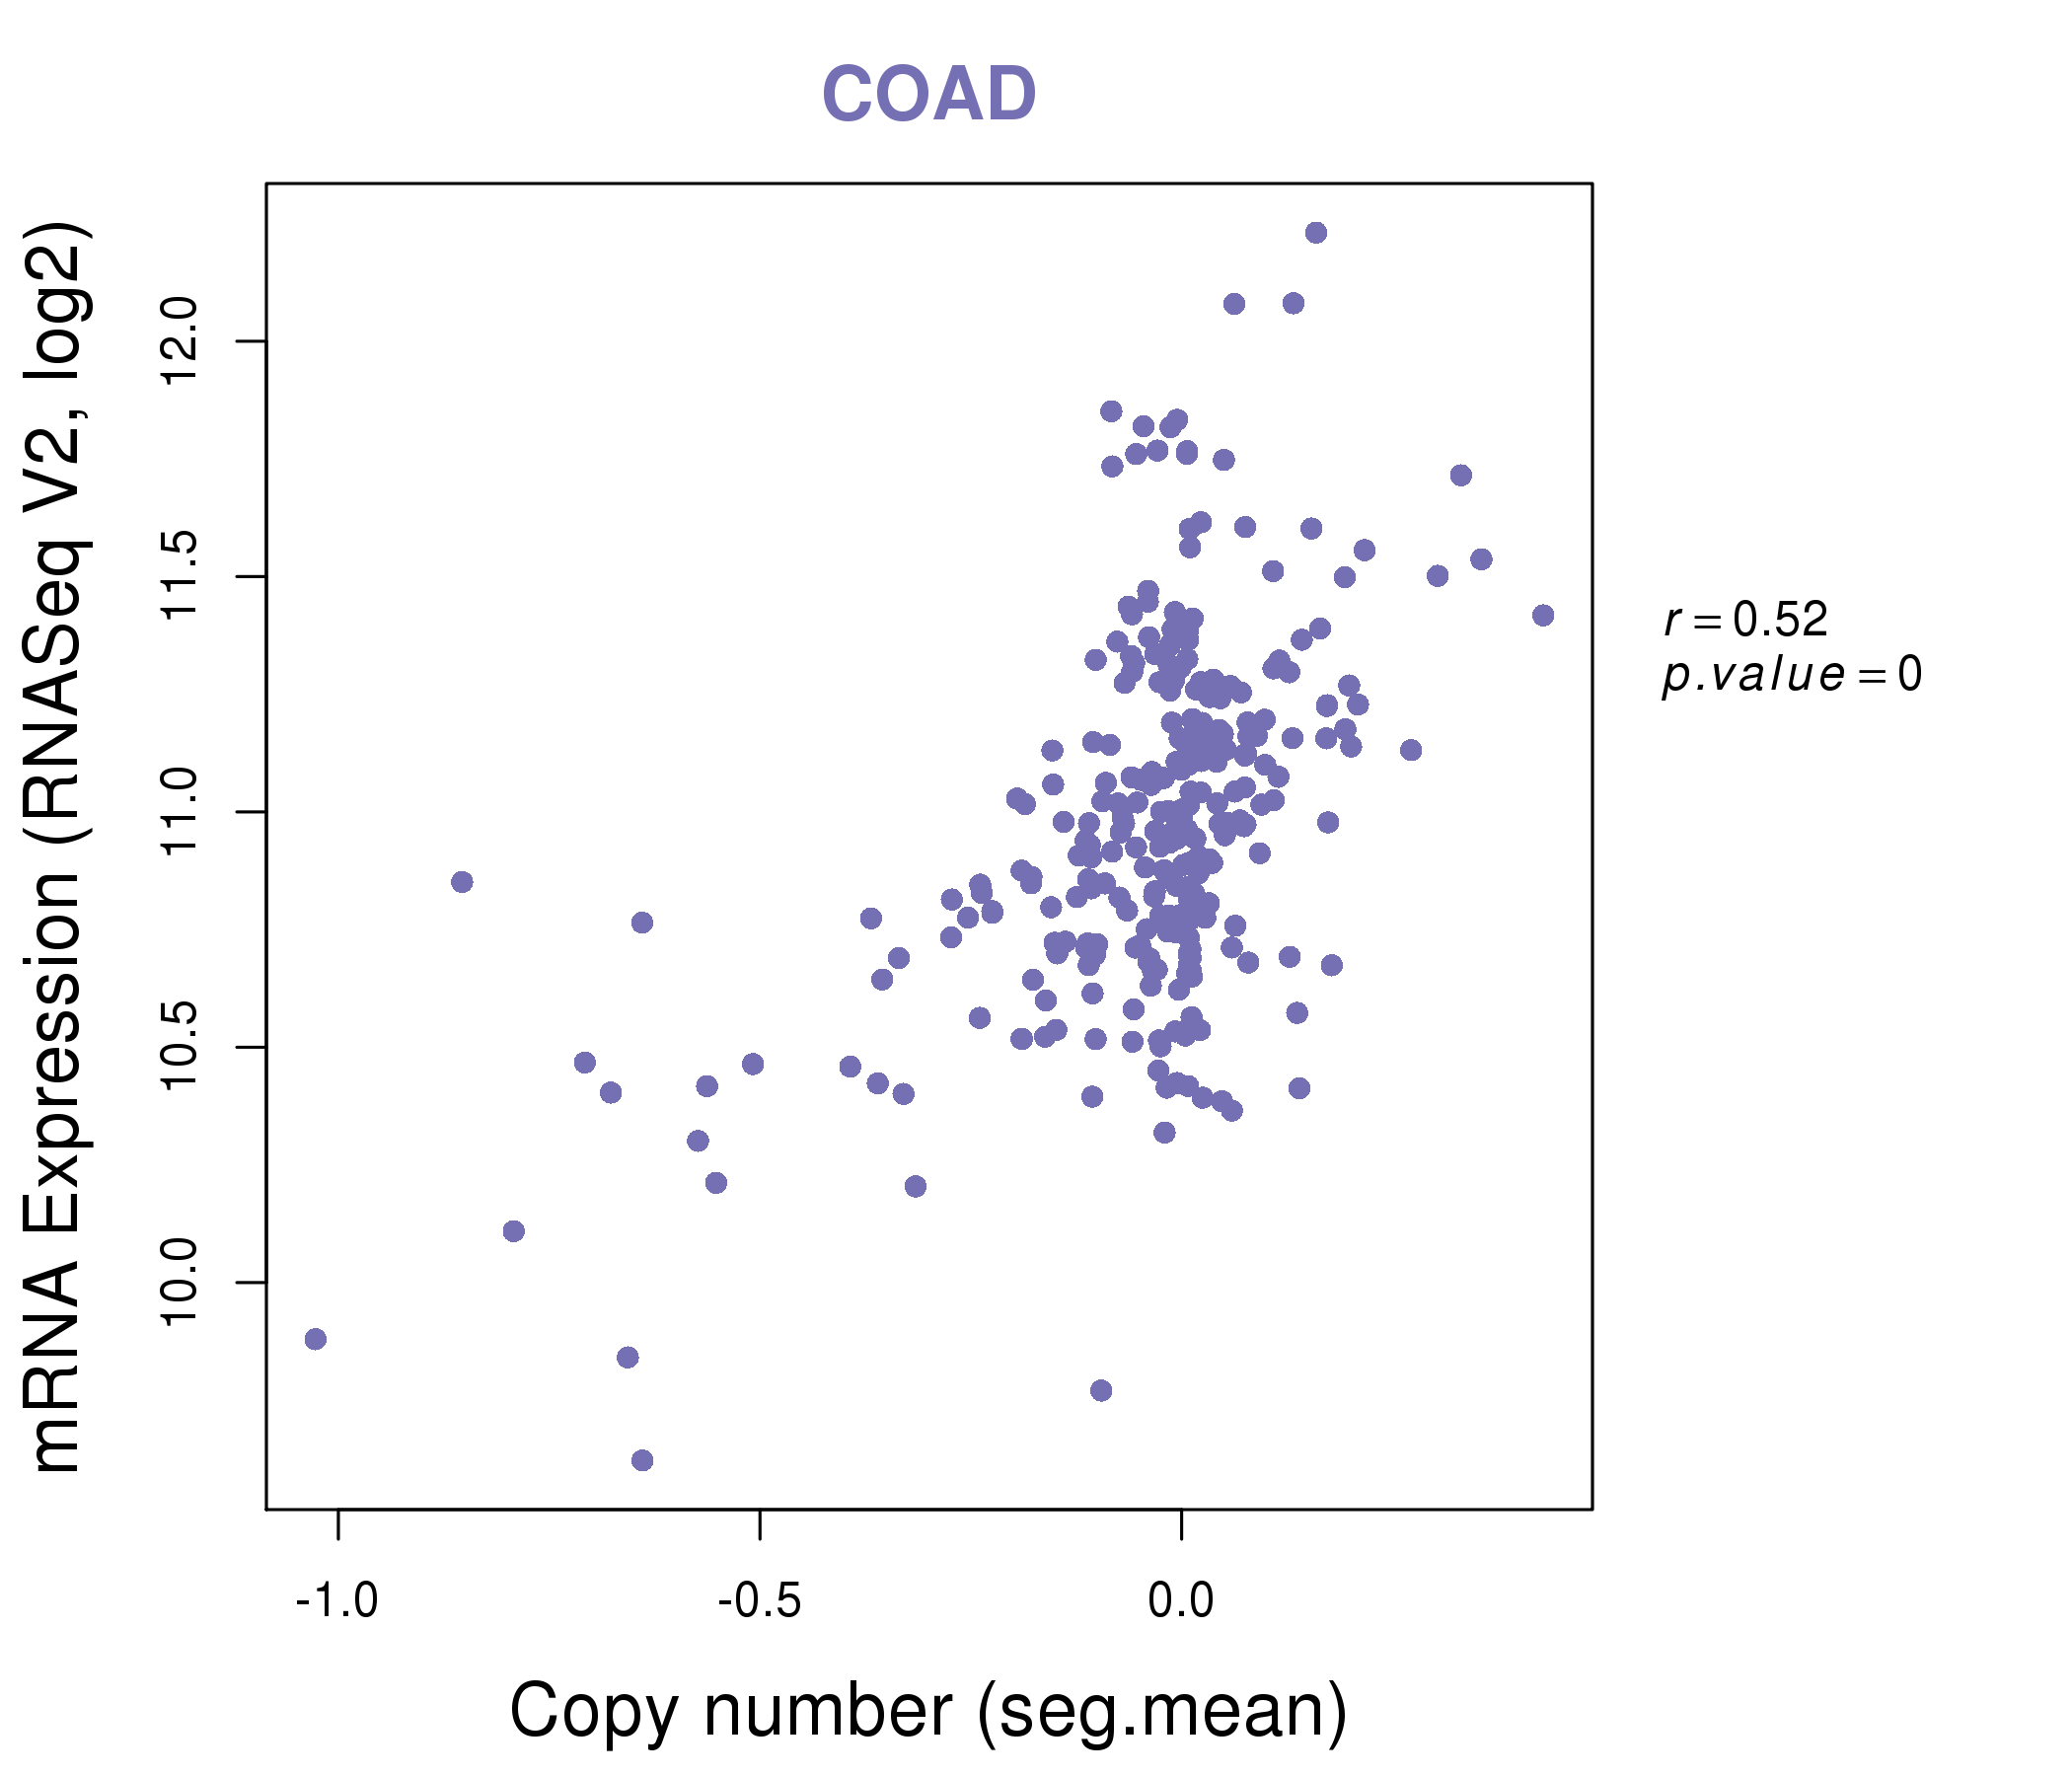
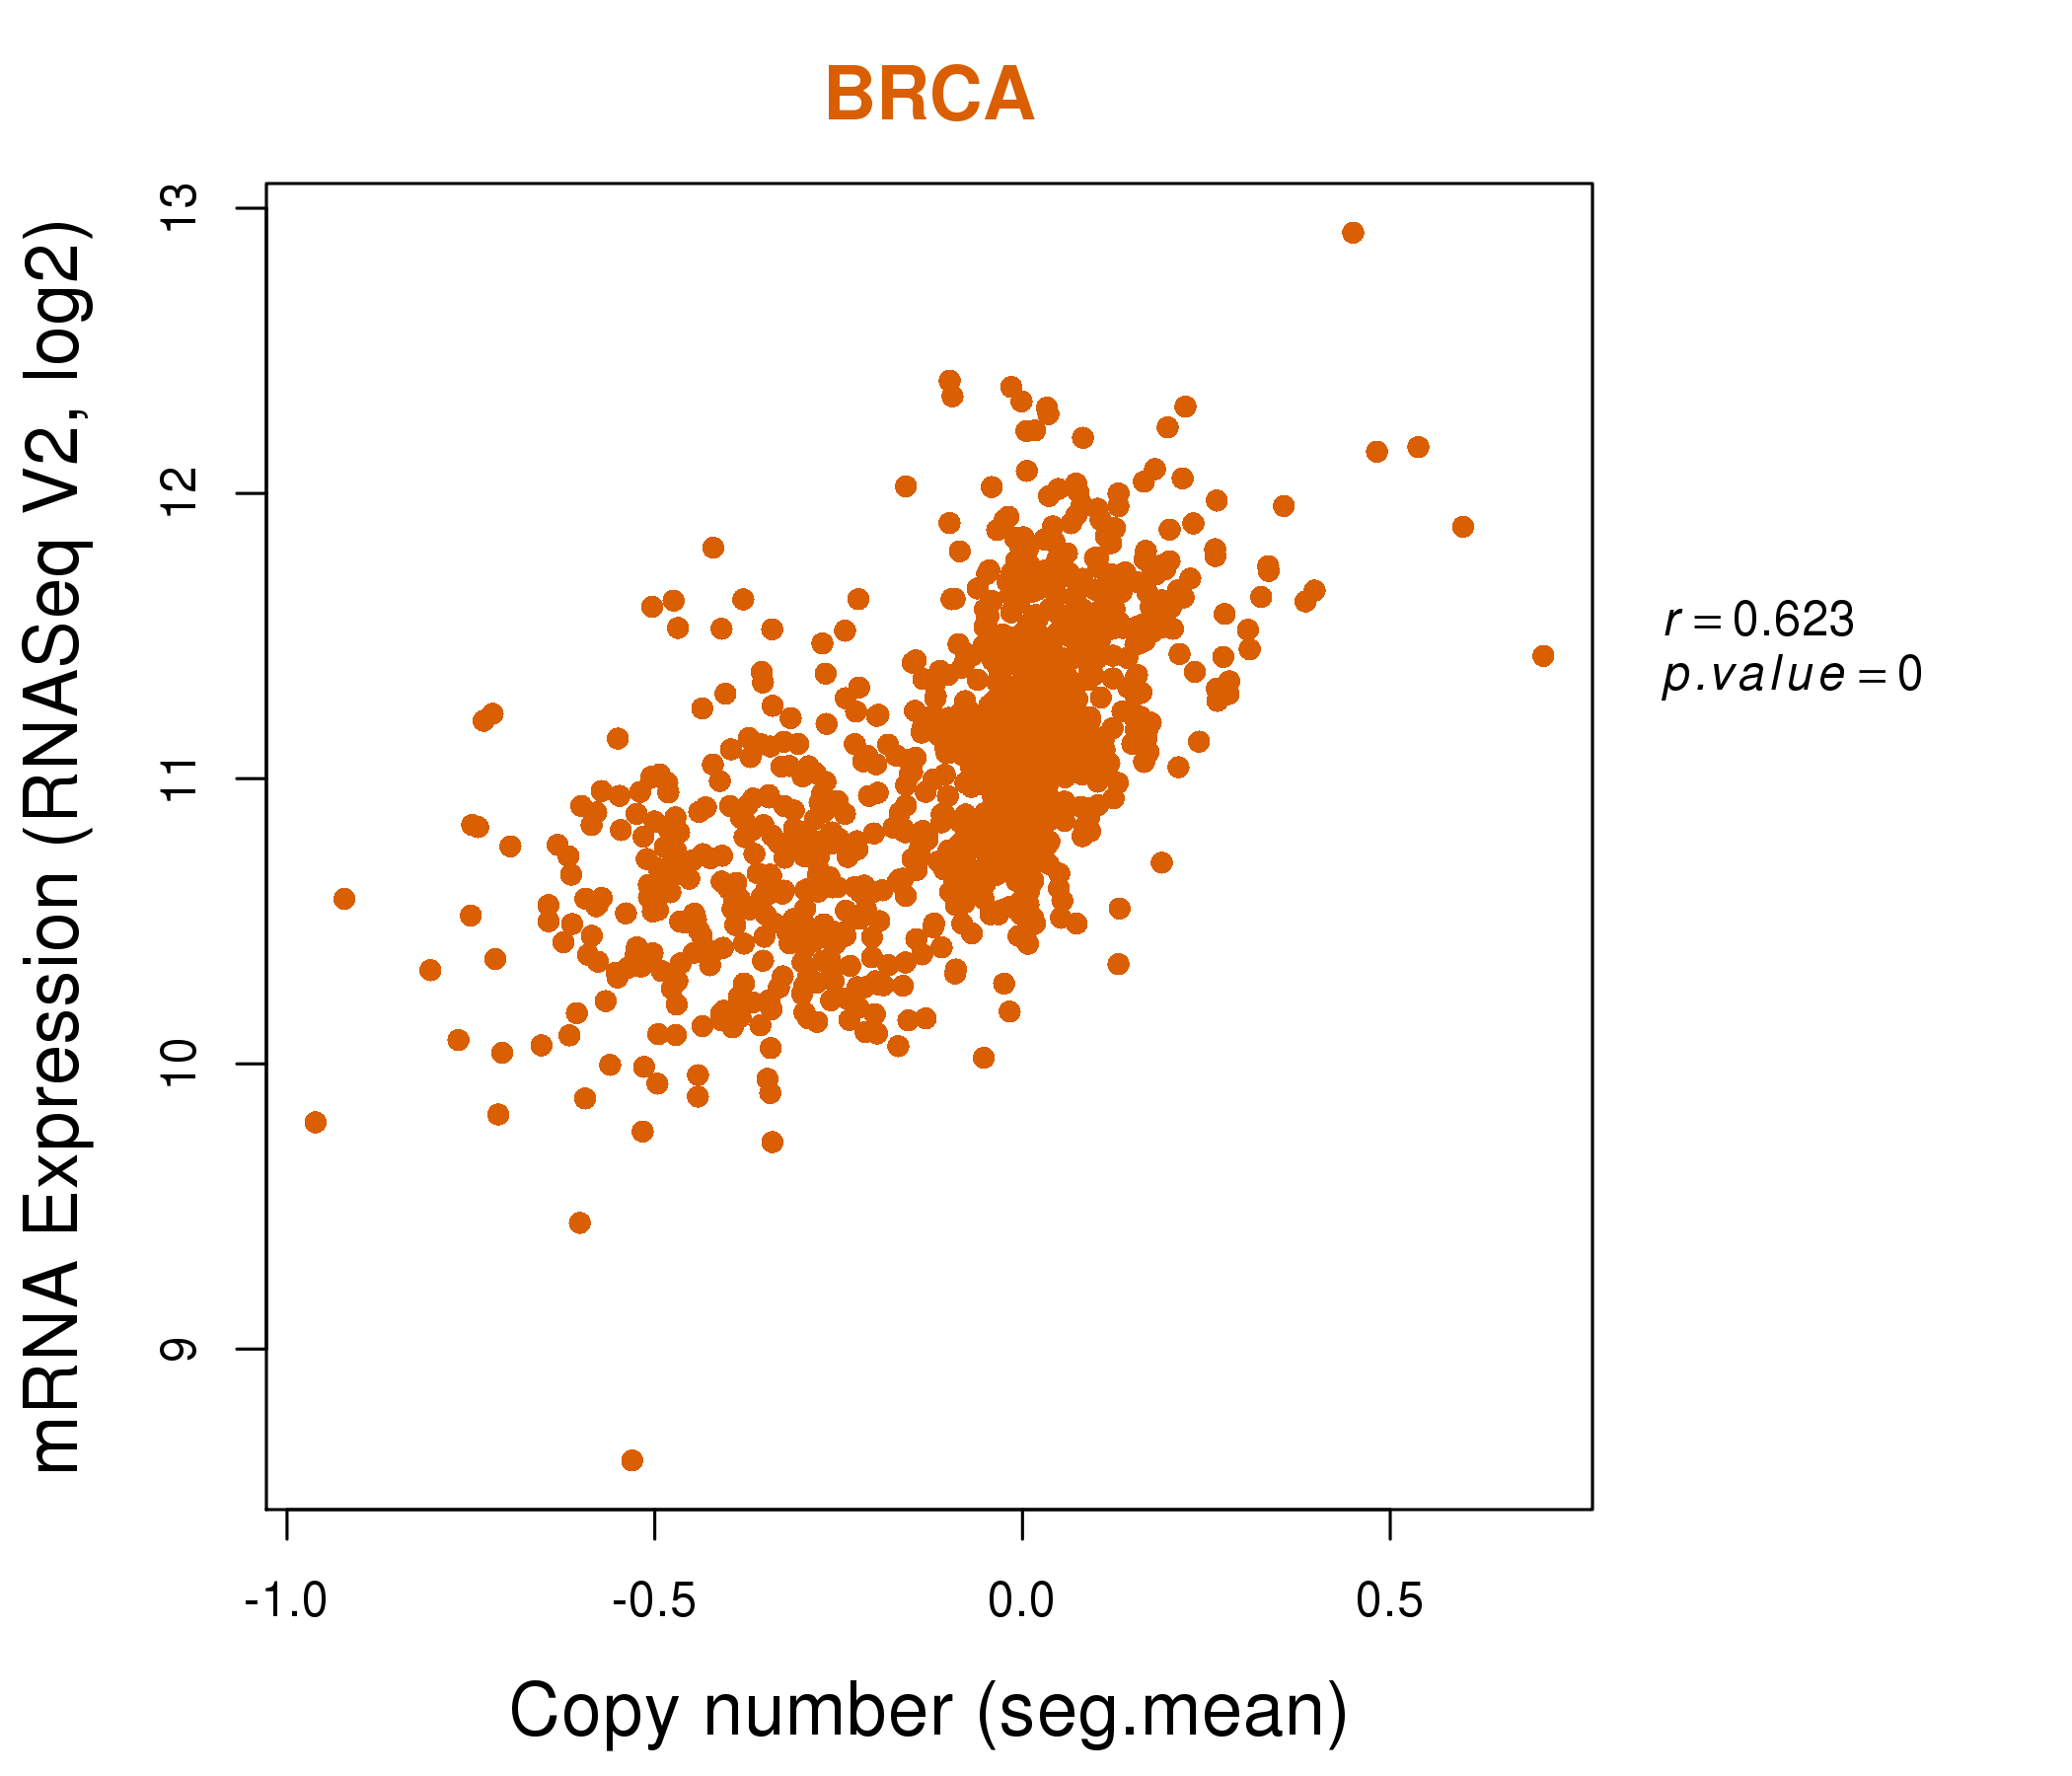
| * Copy number data were extracted from TCGA using R package TCGA-Assembler. The URLs of all public data files on TCGA DCC data server were gathered on Jan-05-2015. Function ProcessCNAData in TCGA-Assembler package was used to obtain gene-level copy number value which is calculated as the average copy number of the genomic region of a gene. |
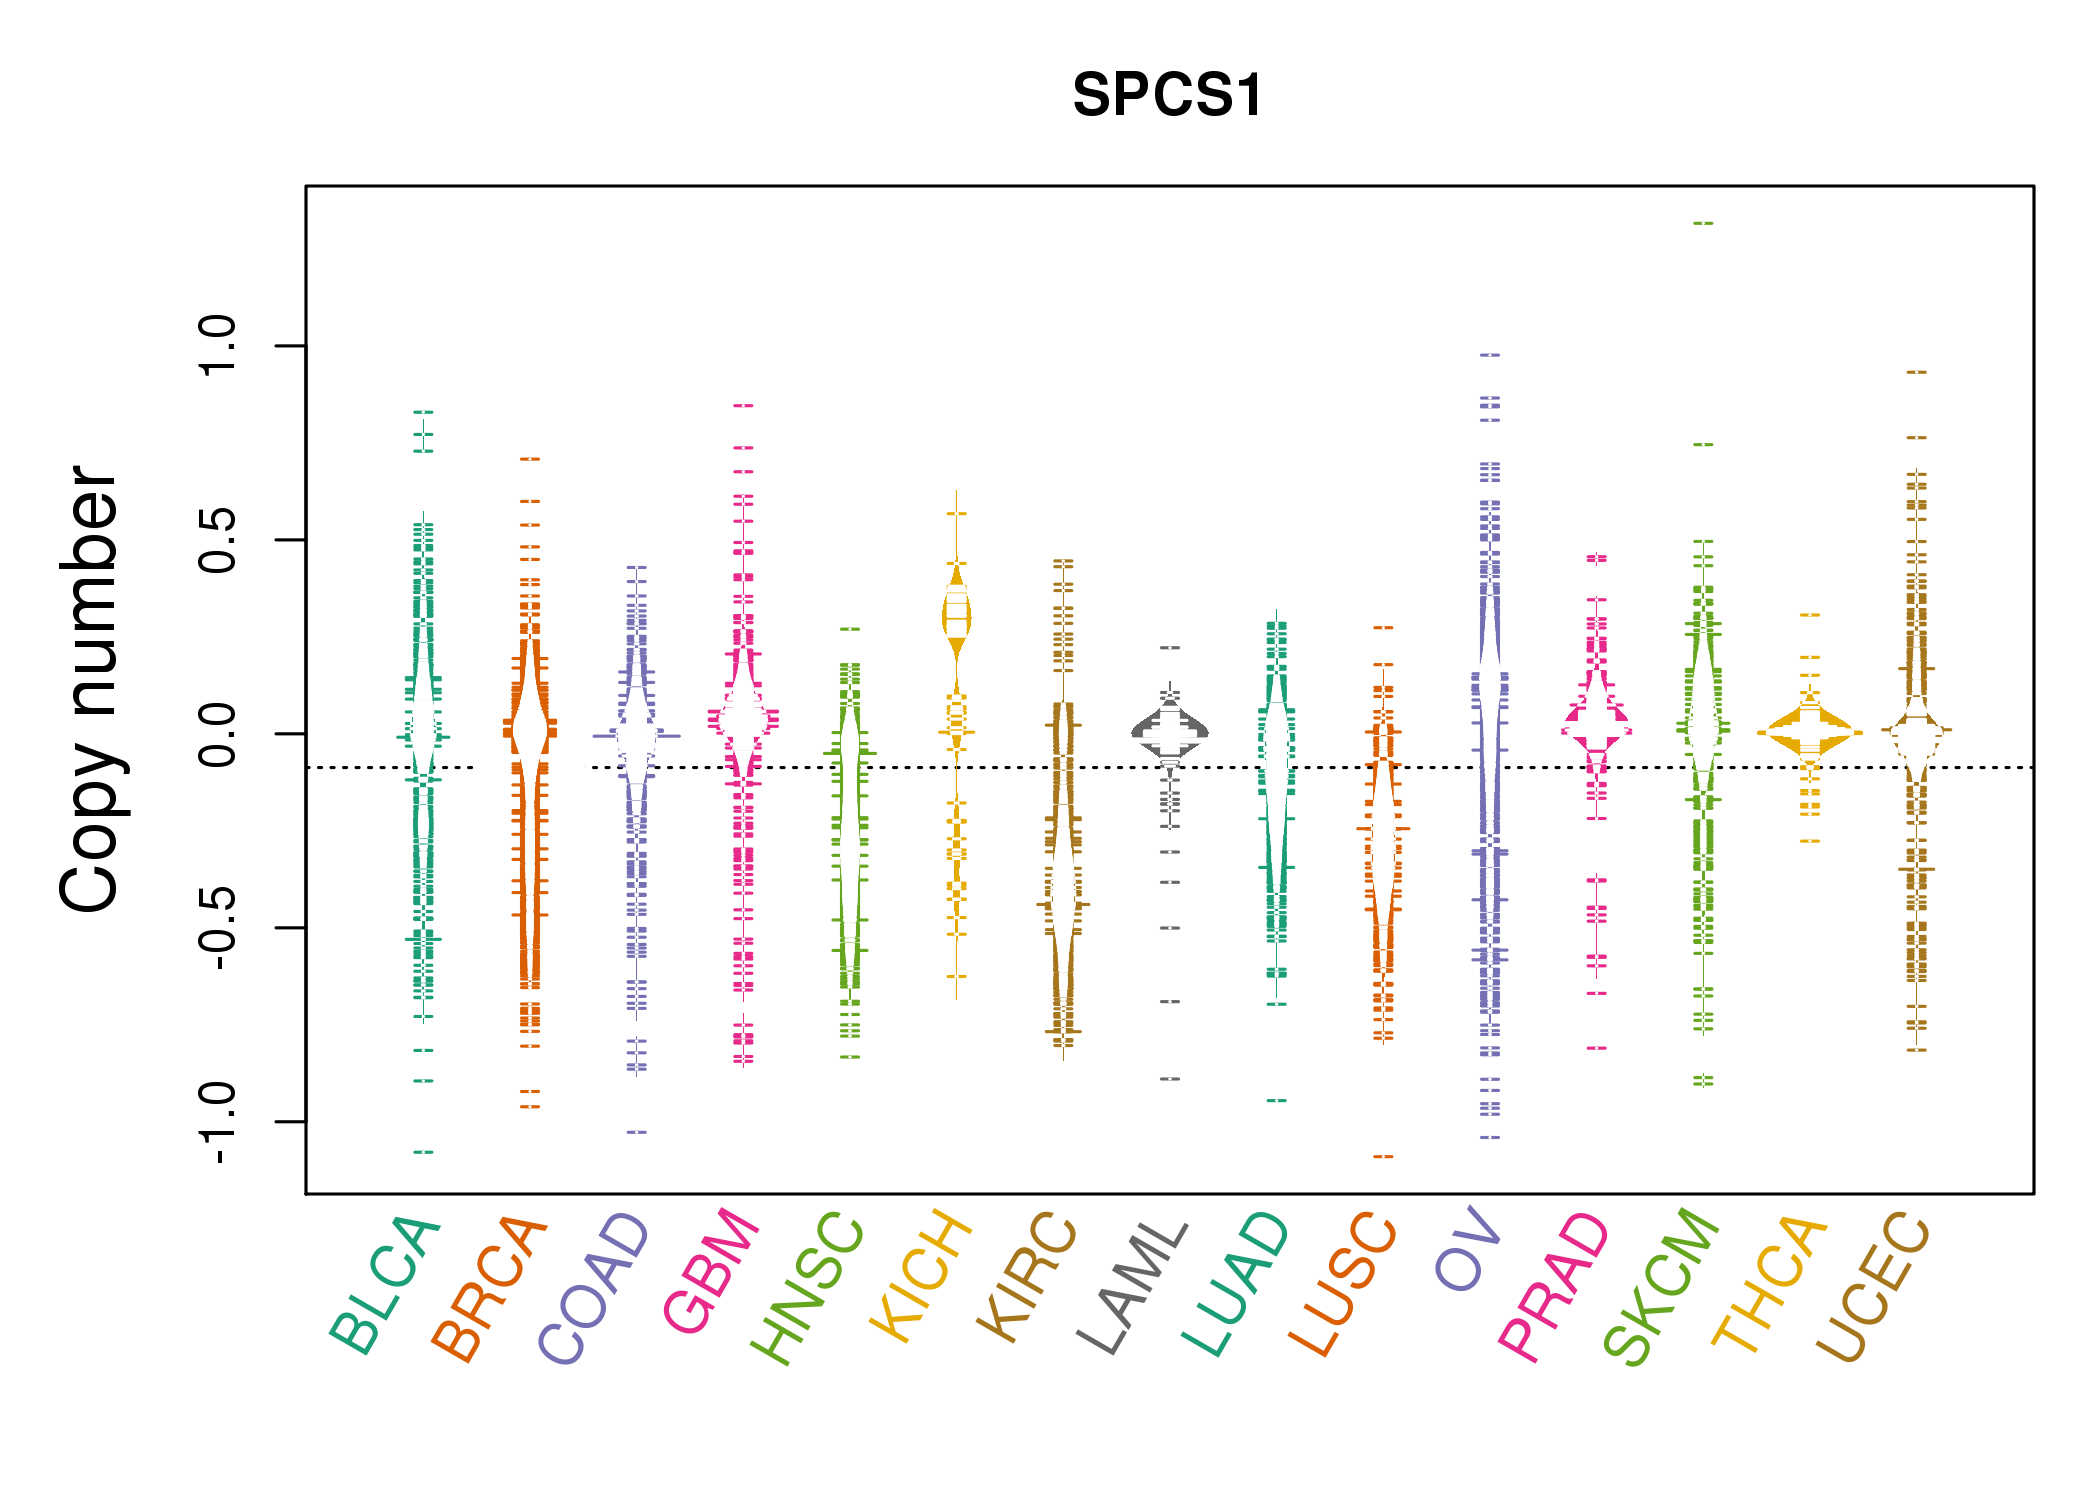 |
| cf) Tissue ID[Tissue type]: BLCA[Bladder Urothelial Carcinoma], BRCA[Breast invasive carcinoma], CESC[Cervical squamous cell carcinoma and endocervical adenocarcinoma], COAD[Colon adenocarcinoma], GBM[Glioblastoma multiforme], Glioma Low Grade, HNSC[Head and Neck squamous cell carcinoma], KICH[Kidney Chromophobe], KIRC[Kidney renal clear cell carcinoma], KIRP[Kidney renal papillary cell carcinoma], LAML[Acute Myeloid Leukemia], LUAD[Lung adenocarcinoma], LUSC[Lung squamous cell carcinoma], OV[Ovarian serous cystadenocarcinoma ], PAAD[Pancreatic adenocarcinoma], PRAD[Prostate adenocarcinoma], SKCM[Skin Cutaneous Melanoma], STAD[Stomach adenocarcinoma], THCA[Thyroid carcinoma], UCEC[Uterine Corpus Endometrial Carcinoma] |
| Top |
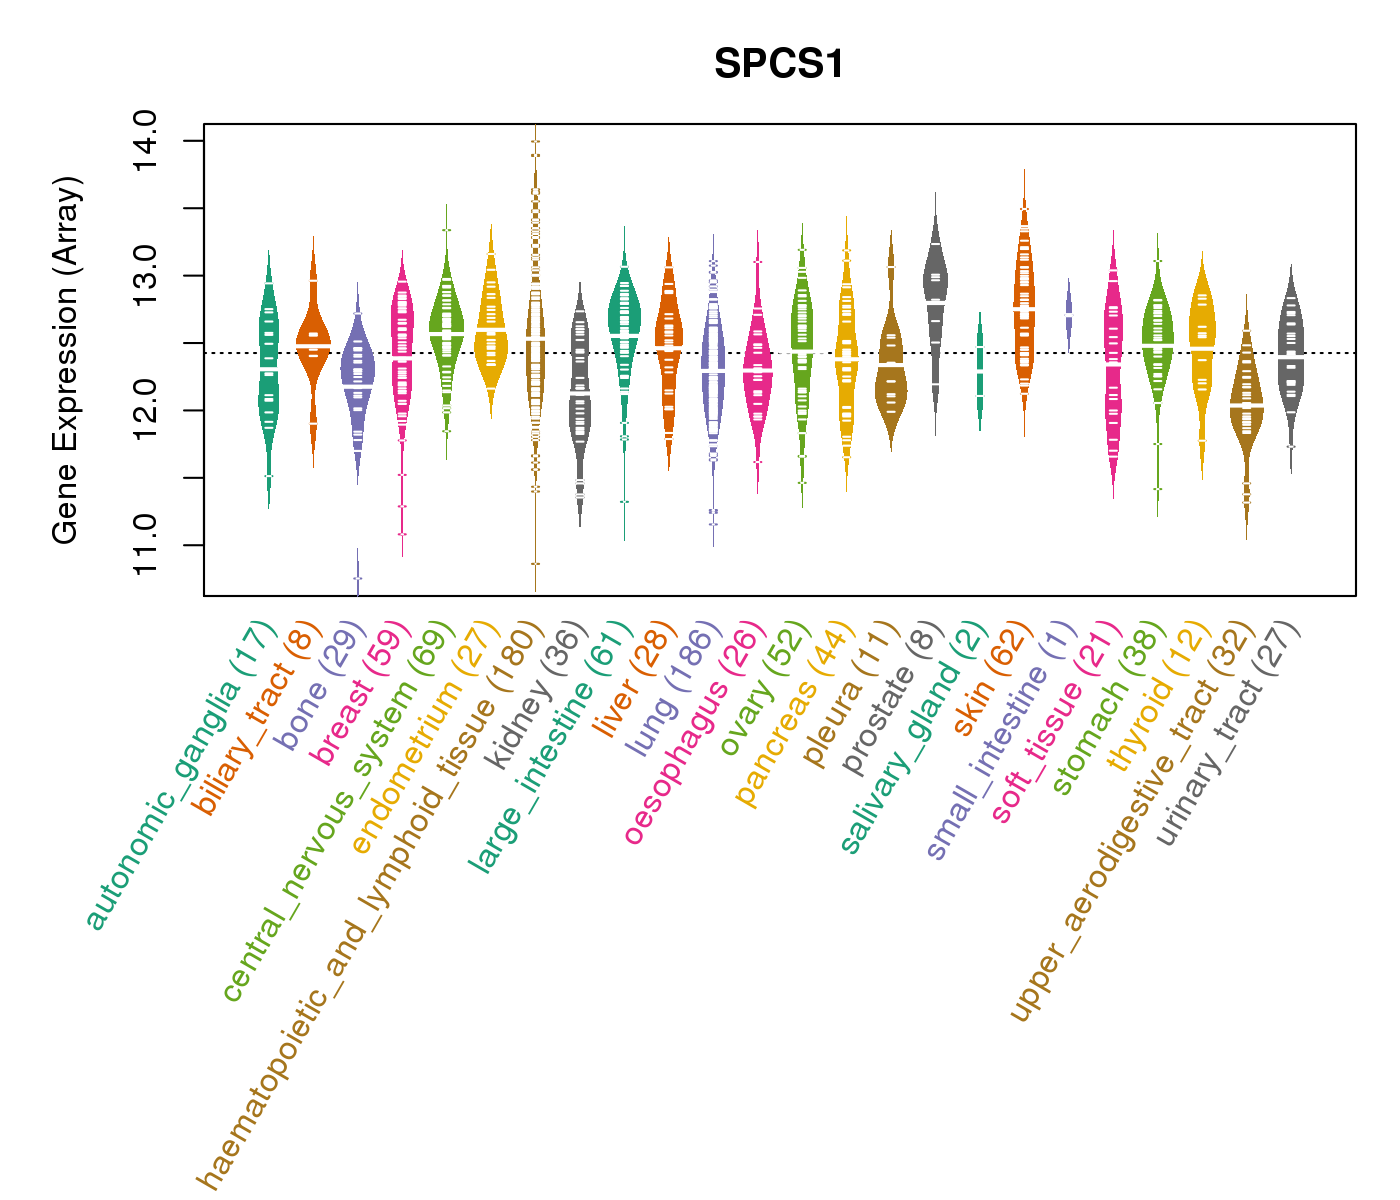
| Gene Expression for SPCS1 |
| * CCLE gene expression data were extracted from CCLE_Expression_Entrez_2012-10-18.res: Gene-centric RMA-normalized mRNA expression data. |
 |
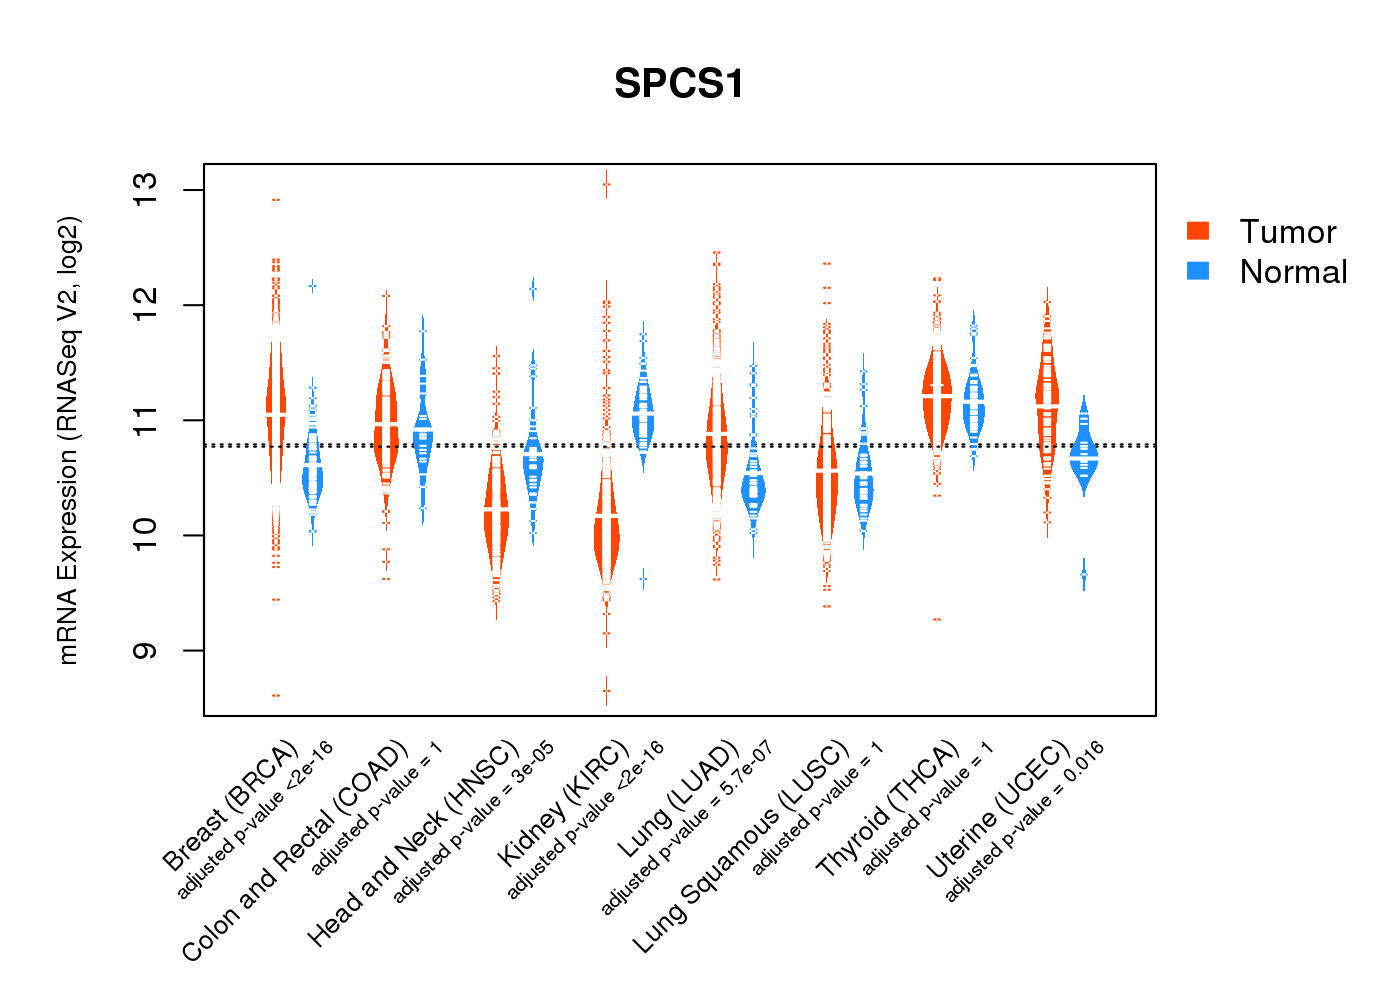
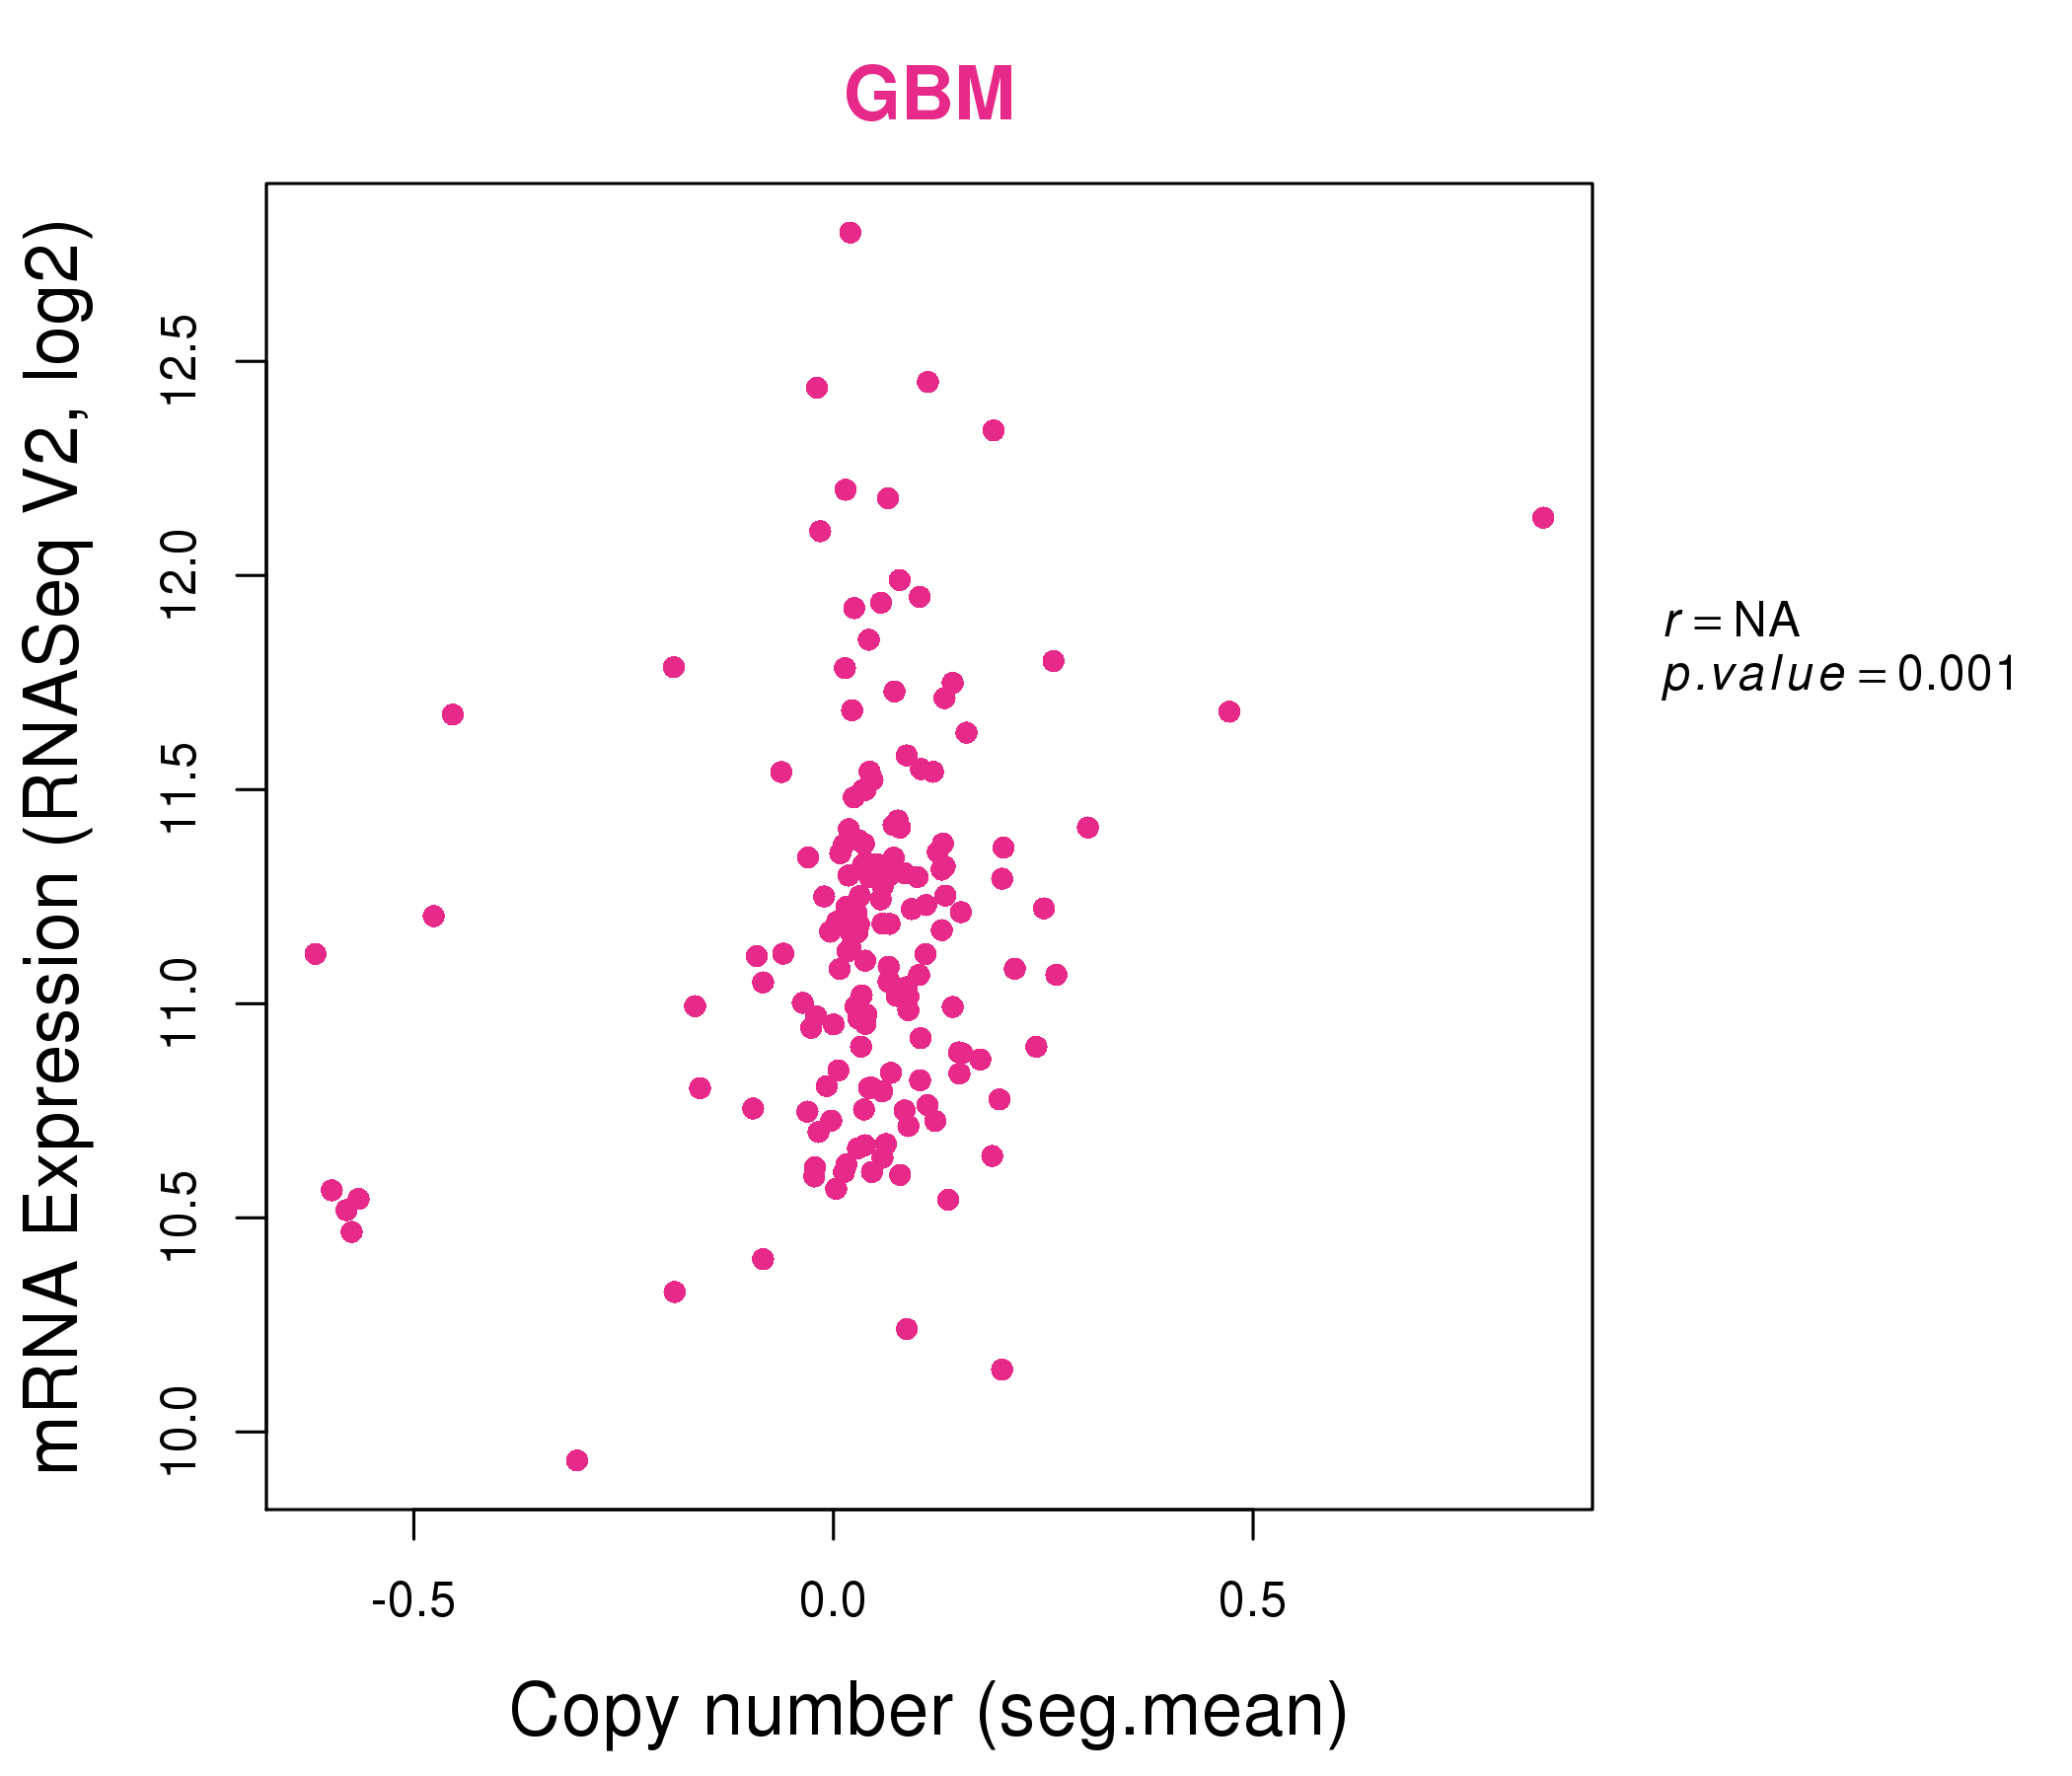
| * Normalized gene expression data of RNASeqV2 was extracted from TCGA using R package TCGA-Assembler. The URLs of all public data files on TCGA DCC data server were gathered at Jan-05-2015. Only eight cancer types have enough normal control samples for differential expression analysis. (t test, adjusted p<0.05 (using Benjamini-Hochberg FDR)) |
 |
| Top |
| * This plots show the correlation between CNV and gene expression. |
: Open all plots for all cancer types
 |
|
 |
|
| Top |
| Gene-Gene Network Information |
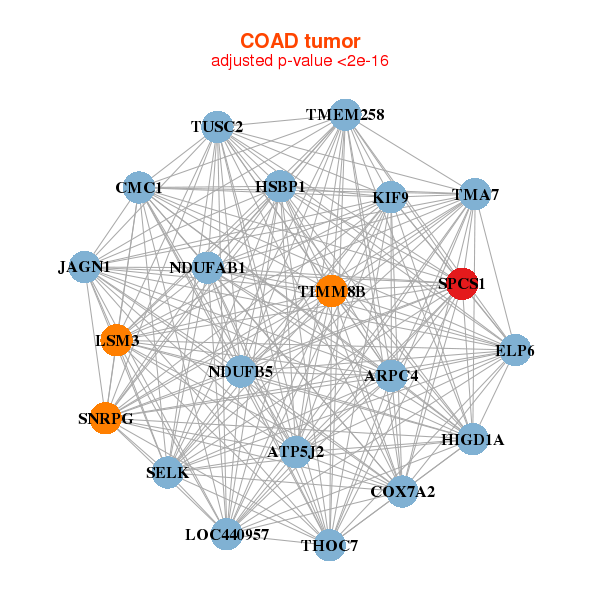
| * Co-Expression network figures were drawn using R package igraph. Only the top 20 genes with the highest correlations were shown. Red circle: input gene, orange circle: cell metabolism gene, sky circle: other gene |
: Open all plots for all cancer types
 |
|
| ABHD14A,ABHD14B,APEH,ELP6,CCDC51,CMC1,COPZ1, CYB561D2,GLT8D1,KIF9,NDUFAF3,NPRL2,PDHB,PSMD6, RFT1,SELK,SLC25A38,SPCS1,TEX264,TMEM115,TUSC2 | C14orf119,C8orf59,CETN2,CISD2,COX16,DPY30,DYNLT1, ERH,HMGN2,LSM12,MYL12B,PPA2,PSMG1,SF3B14, SPCS1,SS18L2,SUMO2,TMCO1,TMEM59,TMEM60,TMEM9B |
 |
|
| ARPC4,ATP5J2,TMEM258,ELP6,TMA7,CMC1,COX7A2, HIGD1A,HSBP1,JAGN1,KIF9,LOC440957,LSM3,NDUFAB1, NDUFB5,SELK,SNRPG,SPCS1,THOC7,TIMM8B,TUSC2 | ATG3,ATP5J2,ATP5S,C14orf2,CHCHD1,CKLF,COX7A2, DGUOK,FAM96A,GTF2B,HINT1,MRPS36,PDCD6,PGK1, PPCS,SEC11C,SERP1,SPCS1,TMEM106C,UQCR10,VPS25 |

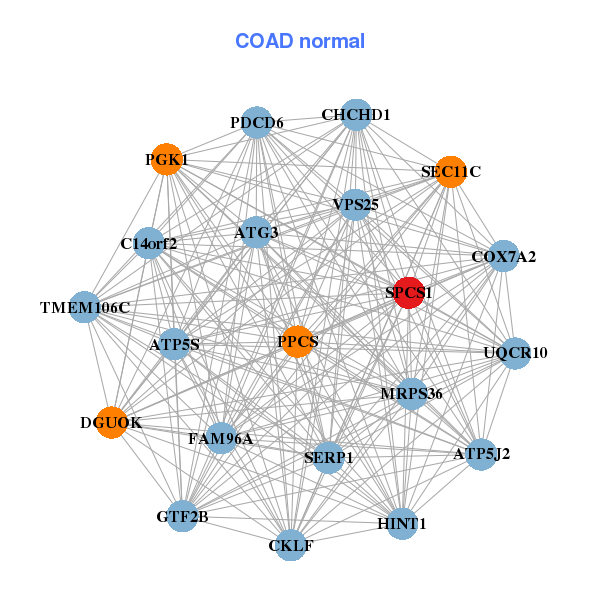
| * Co-Expression network figures were drawn using R package igraph. Only the top 20 genes with the highest correlations were shown. Red circle: input gene, orange circle: cell metabolism gene, sky circle: other gene |
: Open all plots for all cancer types
| Top |
: Open all interacting genes' information including KEGG pathway for all interacting genes from DAVID
| Top |
| Pharmacological Information for SPCS1 |
| There's no related Drug. |
| Top |
| Cross referenced IDs for SPCS1 |
| * We obtained these cross-references from Uniprot database. It covers 150 different DBs, 18 categories. http://www.uniprot.org/help/cross_references_section |
: Open all cross reference information
|
Copyright © 2016-Present - The Univsersity of Texas Health Science Center at Houston @ |