|
||||||||||||||||||||
| |
| Phenotypic Information (metabolism pathway, cancer, disease, phenome) |
| |
| |
| Gene-Gene Network Information: Co-Expression Network, Interacting Genes & KEGG |
| |
|


| Gene Summary for MCTS1 |
| Basic gene info. | Gene symbol | MCTS1 |
| Gene name | malignant T cell amplified sequence 1 | |
| Synonyms | MCT-1|MCT1 | |
| Cytomap | UCSC genome browser: Xq24 | |
| Genomic location | chrX :119737743-119755016 | |
| Type of gene | protein-coding | |
| RefGenes | NM_001137554.1, NM_014060.2, | |
| Ensembl id | ENSG00000232119 | |
| Description | malignant T-cell-amplified sequence 1multiple copies T-cell malignancies | |
| Modification date | 20141207 | |
| dbXrefs | MIM : 300587 | |
| HGNC : HGNC | ||
| HPRD : 06634 | ||
| Protein | UniProt: go to UniProt's Cross Reference DB Table | |
| Expression | CleanEX: HS_MCTS1 | |
| BioGPS: 28985 | ||
| Gene Expression Atlas: ENSG00000232119 | ||
| The Human Protein Atlas: ENSG00000232119 | ||
| Pathway | NCI Pathway Interaction Database: MCTS1 | |
| KEGG: MCTS1 | ||
| REACTOME: MCTS1 | ||
| ConsensusPathDB | ||
| Pathway Commons: MCTS1 | ||
| Metabolism | MetaCyc: MCTS1 | |
| HUMANCyc: MCTS1 | ||
| Regulation | Ensembl's Regulation: ENSG00000232119 | |
| miRBase: chrX :119,737,743-119,755,016 | ||
| TargetScan: NM_001137554 | ||
| cisRED: ENSG00000232119 | ||
| Context | iHOP: MCTS1 | |
| cancer metabolism search in PubMed: MCTS1 | ||
| UCL Cancer Institute: MCTS1 | ||
| Assigned class in ccmGDB | C | |
| Top |
| Phenotypic Information for MCTS1(metabolism pathway, cancer, disease, phenome) |
| Cancer | CGAP: MCTS1 |
| Familial Cancer Database: MCTS1 | |
| * This gene is included in those cancer gene databases. |
|
|
|
|
|
| . | ||||||||||||||
Oncogene 1 | Significant driver gene in | |||||||||||||||||||
| cf) number; DB name 1 Oncogene; http://nar.oxfordjournals.org/content/35/suppl_1/D721.long, 2 Tumor Suppressor gene; https://bioinfo.uth.edu/TSGene/, 3 Cancer Gene Census; http://www.nature.com/nrc/journal/v4/n3/abs/nrc1299.html, 4 CancerGenes; http://nar.oxfordjournals.org/content/35/suppl_1/D721.long, 5 Network of Cancer Gene; http://ncg.kcl.ac.uk/index.php, 1Therapeutic Vulnerabilities in Cancer; http://cbio.mskcc.org/cancergenomics/statius/ |
| Nat Rev Drug Discovery, 2013, 12: 829, doi: 10.1038/nrd4145 | |
| OMIM | |
| Orphanet | |
| Disease | KEGG Disease: MCTS1 |
| MedGen: MCTS1 (Human Medical Genetics with Condition) | |
| ClinVar: MCTS1 | |
| Phenotype | MGI: MCTS1 (International Mouse Phenotyping Consortium) |
| PhenomicDB: MCTS1 | |
| Mutations for MCTS1 |
| * Under tables are showing count per each tissue to give us broad intuition about tissue specific mutation patterns.You can go to the detailed page for each mutation database's web site. |
| There's no structural variation information in COSMIC data for this gene. |
| * From mRNA Sanger sequences, Chitars2.0 arranged chimeric transcripts. This table shows MCTS1 related fusion information. |
| ID | Head Gene | Tail Gene | Accession | Gene_a | qStart_a | qEnd_a | Chromosome_a | tStart_a | tEnd_a | Gene_a | qStart_a | qEnd_a | Chromosome_a | tStart_a | tEnd_a |
| Top |
| There's no copy number variation information in COSMIC data for this gene. |
| Top |
|
 |
| Top |
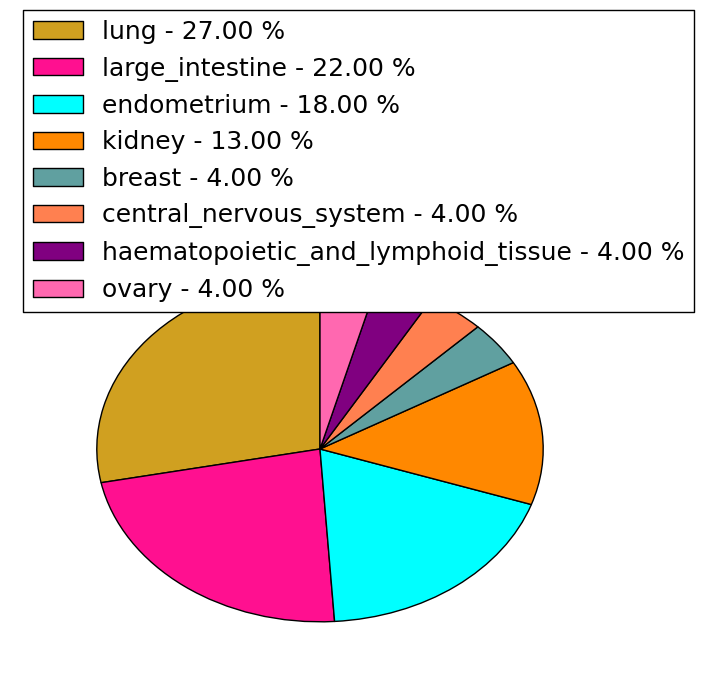
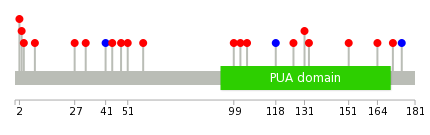
| Stat. for Non-Synonymous SNVs (# total SNVs=22) | (# total SNVs=3) |
 | 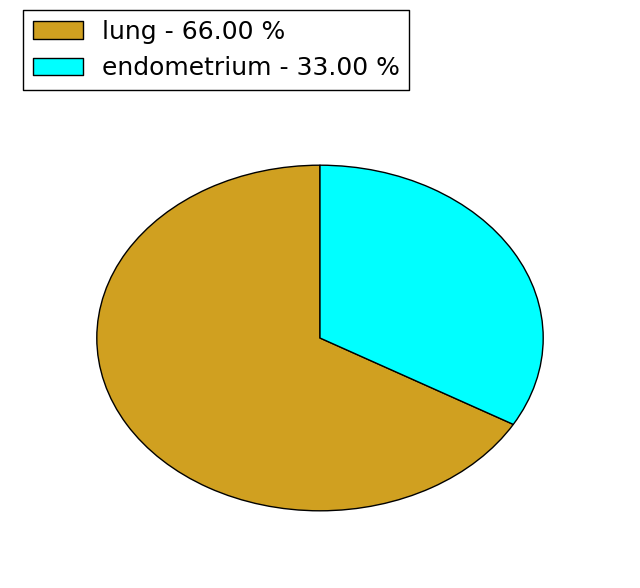 |
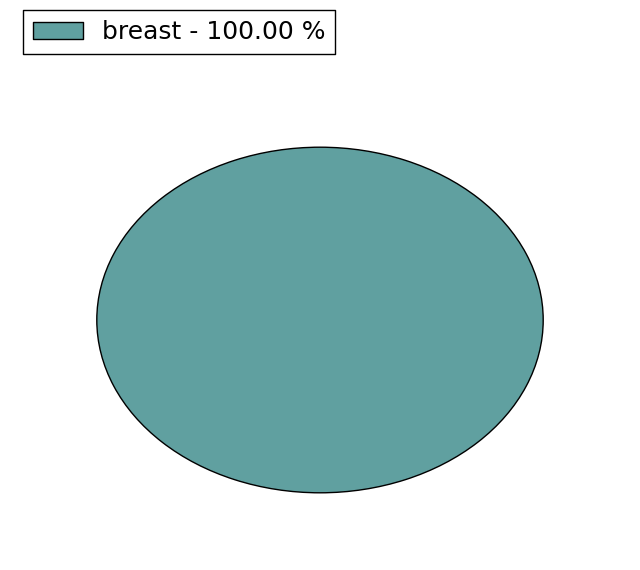
(# total SNVs=1) | (# total SNVs=0) |
 |
| Top |
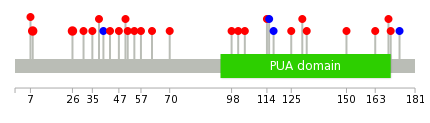
| * When you move the cursor on each content, you can see more deailed mutation information on the Tooltip. Those are primary_site,primary_histology,mutation(aa),pubmedID. |
| GRCh37 position | Mutation(aa) | Unique sampleID count |
| chr23:119739274-119739274 | p.K8N | 2 |
| chr23:119739328-119739328 | p.K26N | 2 |
| chr23:119742158-119742158 | p.P114L | 1 |
| chr23:119746083-119746083 | p.L170F | 1 |
| chr23:119739390-119739390 | p.K47I | 1 |
| chr23:119742162-119742162 | p.G115G | 1 |
| chr23:119746095-119746095 | p.L174L | 1 |
| chr23:119739399-119739399 | p.V50A | 1 |
| chr23:119742168-119742168 | p.T117T | 1 |
| chr23:119739401-119739401 | p.K51Q | 1 |
| Top |
|
 |
| Point Mutation/ Tissue ID | 1 | 2 | 3 | 4 | 5 | 6 | 7 | 8 | 9 | 10 | 11 | 12 | 13 | 14 | 15 | 16 | 17 | 18 | 19 | 20 |
| # sample | 2 | 1 | 2 | 1 | 2 | 3 | 1 | 1 | 2 | 6 | ||||||||||
| # mutation | 2 | 1 | 2 | 1 | 2 | 3 | 1 | 1 | 2 | 6 | ||||||||||
| nonsynonymous SNV | 2 | 1 | 2 | 1 | 2 | 2 | 1 | 1 | 1 | 5 | ||||||||||
| synonymous SNV | 1 | 1 | 1 |
| cf) Tissue ID; Tissue type (1; BLCA[Bladder Urothelial Carcinoma], 2; BRCA[Breast invasive carcinoma], 3; CESC[Cervical squamous cell carcinoma and endocervical adenocarcinoma], 4; COAD[Colon adenocarcinoma], 5; GBM[Glioblastoma multiforme], 6; Glioma Low Grade, 7; HNSC[Head and Neck squamous cell carcinoma], 8; KICH[Kidney Chromophobe], 9; KIRC[Kidney renal clear cell carcinoma], 10; KIRP[Kidney renal papillary cell carcinoma], 11; LAML[Acute Myeloid Leukemia], 12; LUAD[Lung adenocarcinoma], 13; LUSC[Lung squamous cell carcinoma], 14; OV[Ovarian serous cystadenocarcinoma ], 15; PAAD[Pancreatic adenocarcinoma], 16; PRAD[Prostate adenocarcinoma], 17; SKCM[Skin Cutaneous Melanoma], 18:STAD[Stomach adenocarcinoma], 19:THCA[Thyroid carcinoma], 20:UCEC[Uterine Corpus Endometrial Carcinoma]) |
| Top |
| * We represented just top 10 SNVs. When you move the cursor on each content, you can see more deailed mutation information on the Tooltip. Those are primary_site, primary_histology, mutation(aa), pubmedID. |
| Genomic Position | Mutation(aa) | Unique sampleID count |
| chrX:119744919 | p.V51A,MCTS1 | 1 |
| chrX:119739390 | p.E58K,MCTS1 | 1 |
| chrX:119746061 | p.D99H,MCTS1 | 1 |
| chrX:119739399 | p.A102T,MCTS1 | 1 |
| chrX:119746083 | p.F105S,MCTS1 | 1 |
| chrX:119739938 | p.T118T,MCTS1 | 1 |
| chrX:119746095 | p.P126L,MCTS1 | 1 |
| chrX:119738100 | p.K3N | 1 |
| chrX:119742109 | p.T131A,MCTS1 | 1 |
| chrX:119738713 | p.G2D | 1 |
| * Copy number data were extracted from TCGA using R package TCGA-Assembler. The URLs of all public data files on TCGA DCC data server were gathered on Jan-05-2015. Function ProcessCNAData in TCGA-Assembler package was used to obtain gene-level copy number value which is calculated as the average copy number of the genomic region of a gene. |
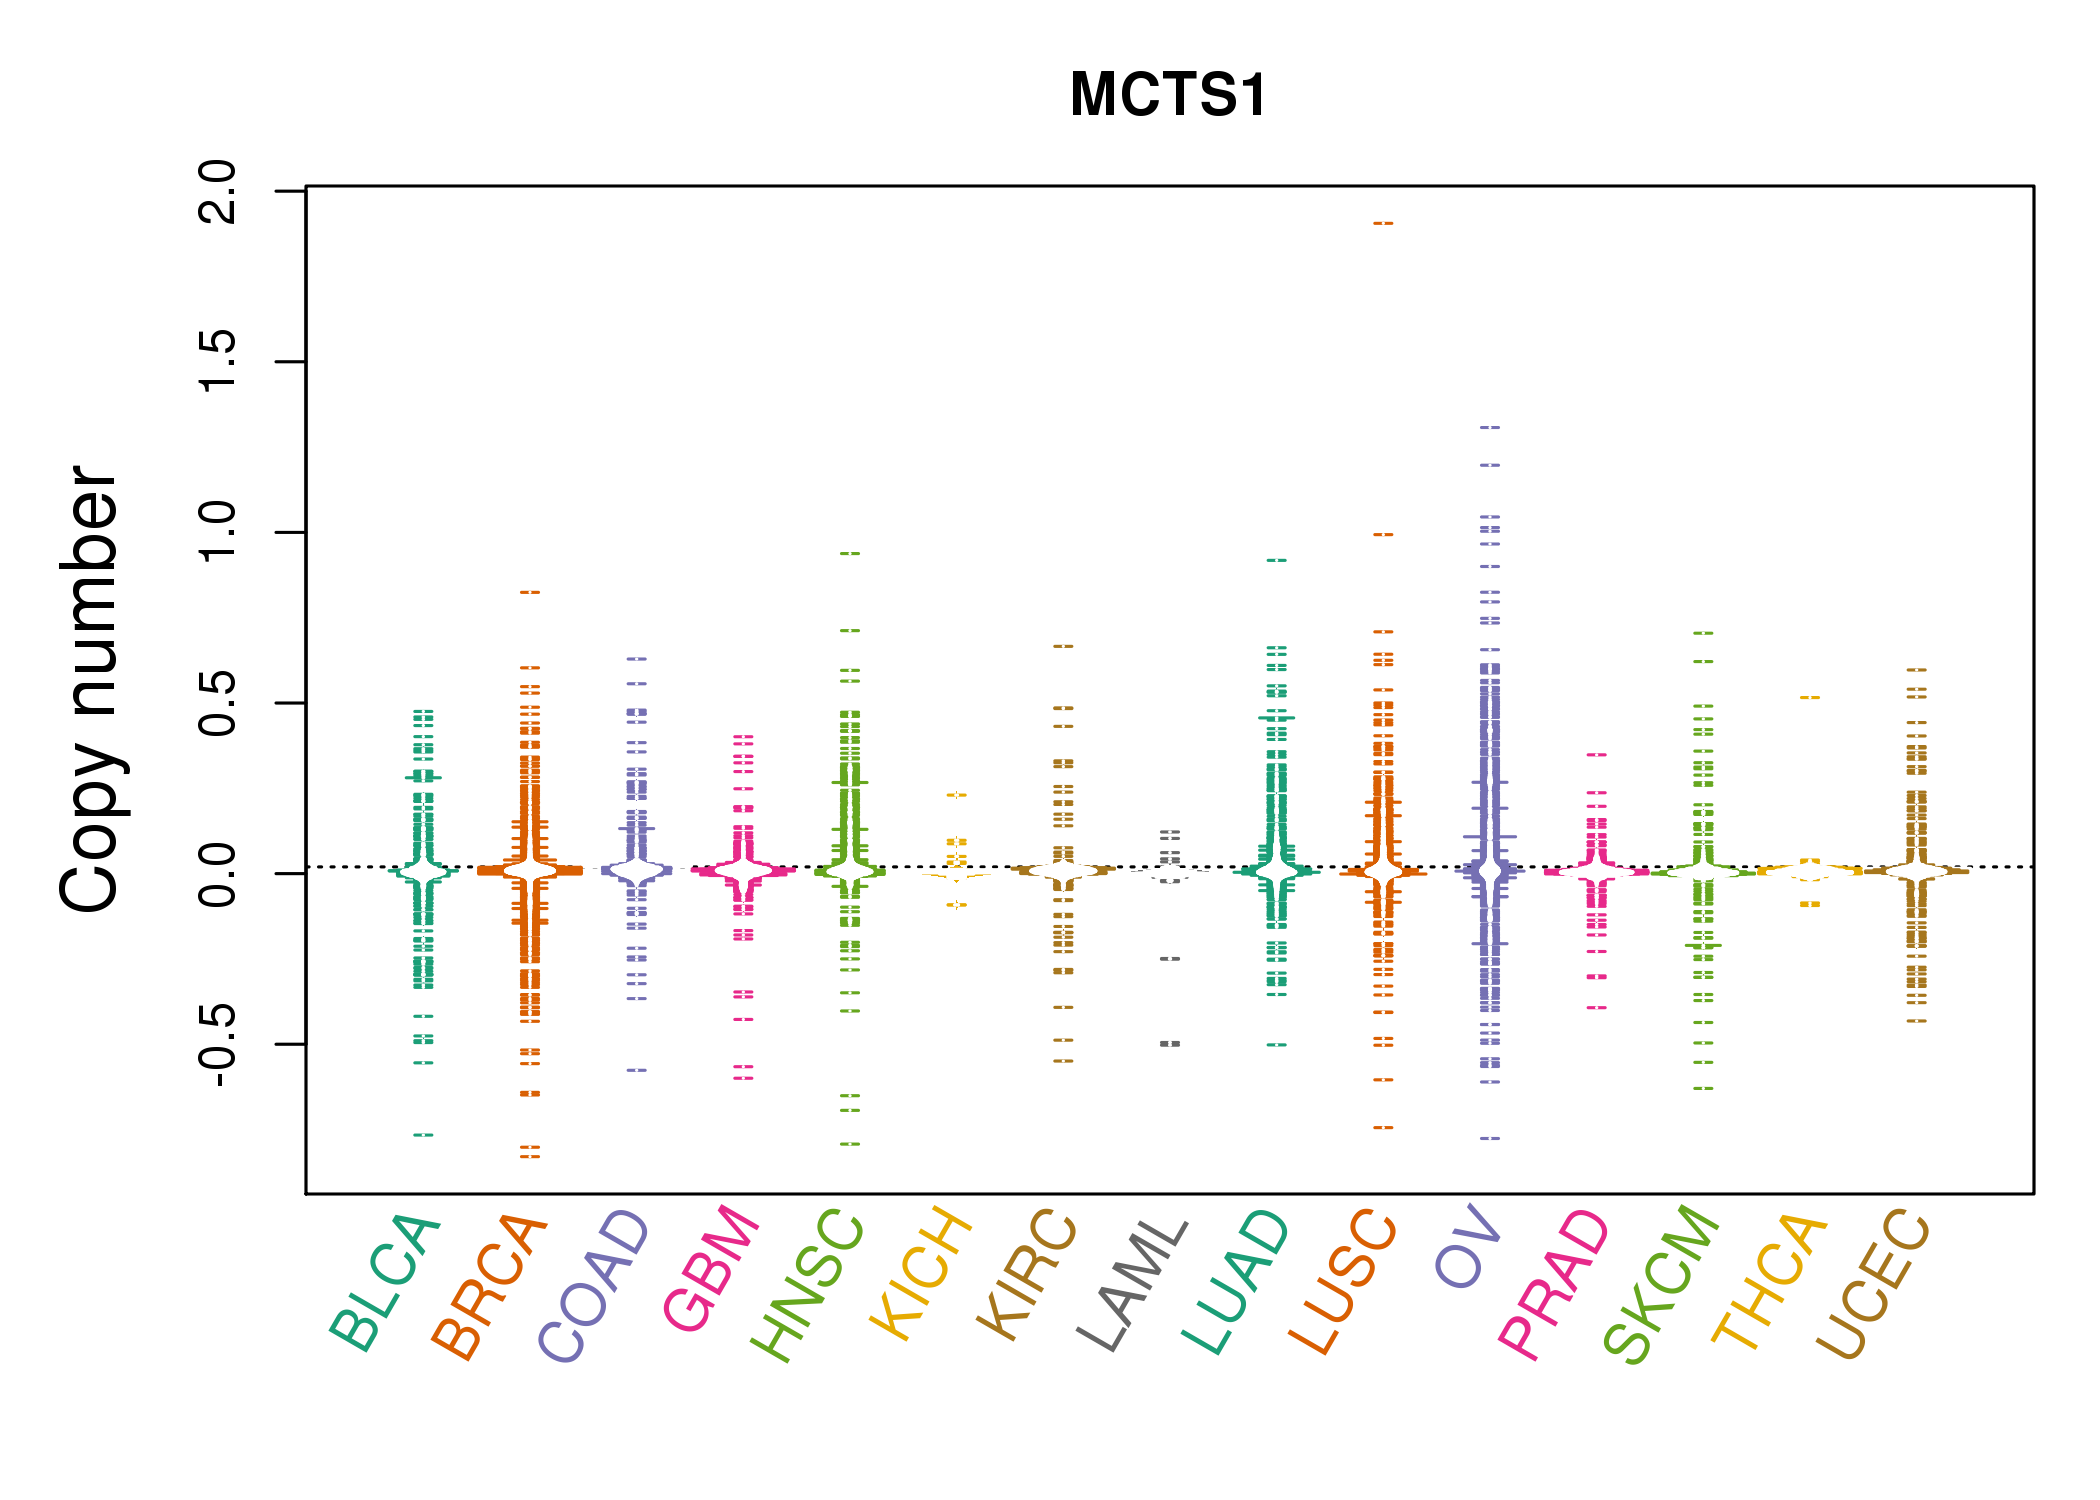 |
| cf) Tissue ID[Tissue type]: BLCA[Bladder Urothelial Carcinoma], BRCA[Breast invasive carcinoma], CESC[Cervical squamous cell carcinoma and endocervical adenocarcinoma], COAD[Colon adenocarcinoma], GBM[Glioblastoma multiforme], Glioma Low Grade, HNSC[Head and Neck squamous cell carcinoma], KICH[Kidney Chromophobe], KIRC[Kidney renal clear cell carcinoma], KIRP[Kidney renal papillary cell carcinoma], LAML[Acute Myeloid Leukemia], LUAD[Lung adenocarcinoma], LUSC[Lung squamous cell carcinoma], OV[Ovarian serous cystadenocarcinoma ], PAAD[Pancreatic adenocarcinoma], PRAD[Prostate adenocarcinoma], SKCM[Skin Cutaneous Melanoma], STAD[Stomach adenocarcinoma], THCA[Thyroid carcinoma], UCEC[Uterine Corpus Endometrial Carcinoma] |
| Top |
| Gene Expression for MCTS1 |
| * CCLE gene expression data were extracted from CCLE_Expression_Entrez_2012-10-18.res: Gene-centric RMA-normalized mRNA expression data. |
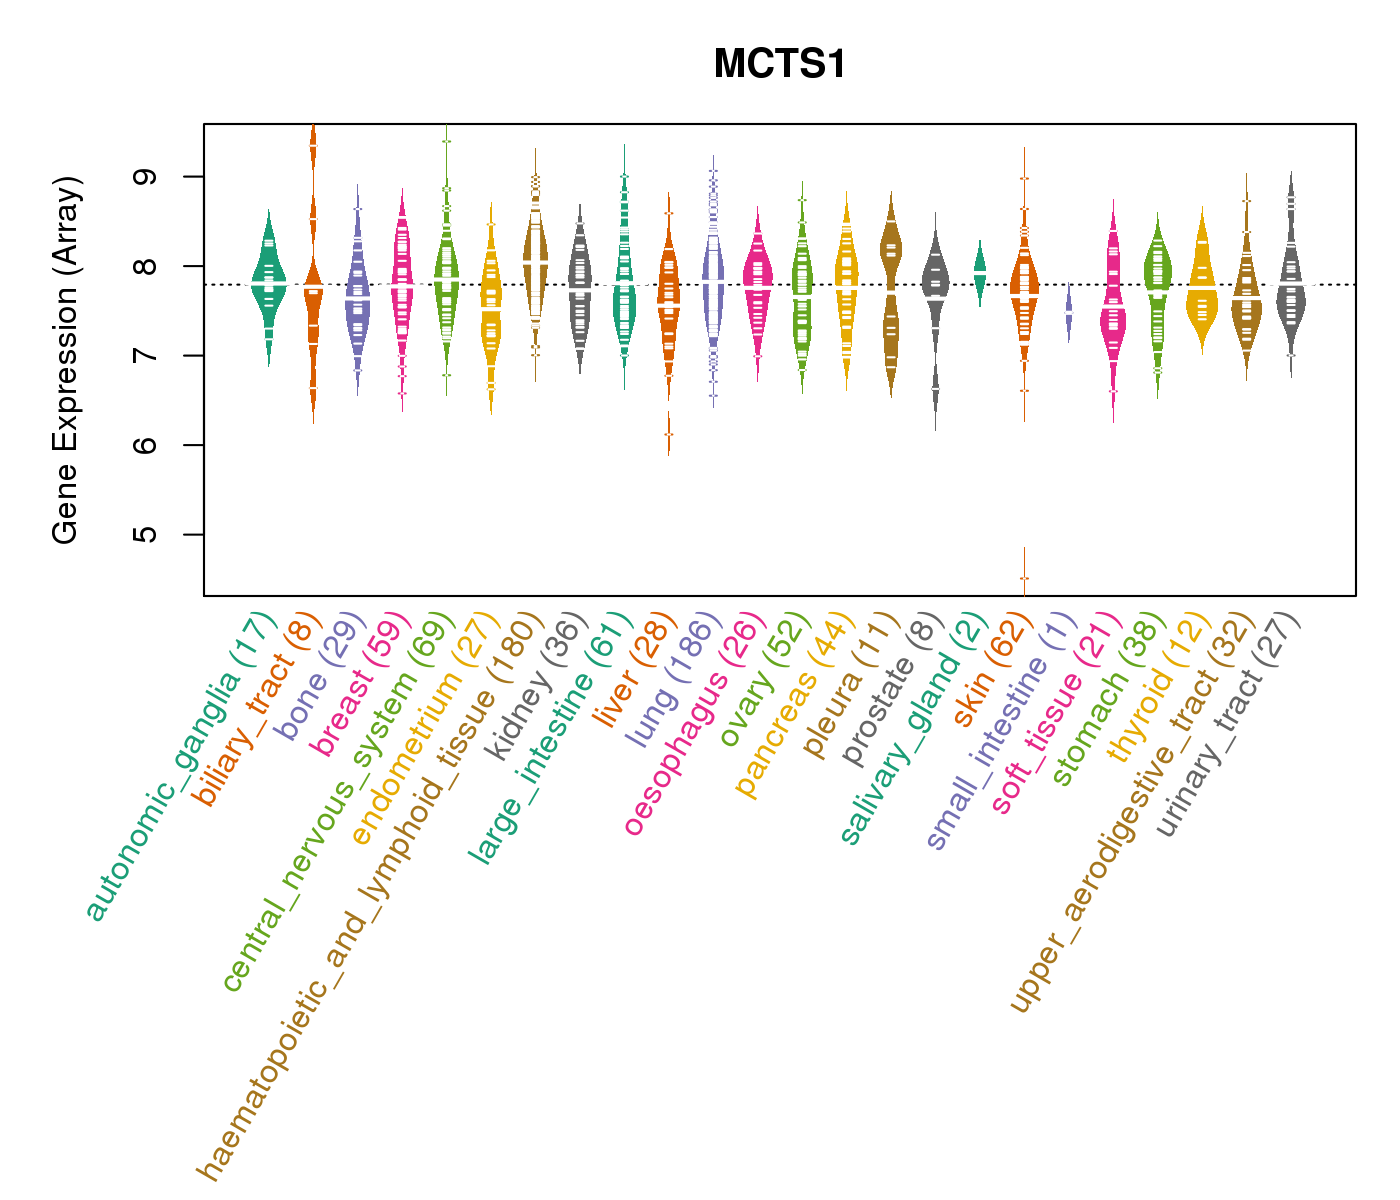 |
| * Normalized gene expression data of RNASeqV2 was extracted from TCGA using R package TCGA-Assembler. The URLs of all public data files on TCGA DCC data server were gathered at Jan-05-2015. Only eight cancer types have enough normal control samples for differential expression analysis. (t test, adjusted p<0.05 (using Benjamini-Hochberg FDR)) |
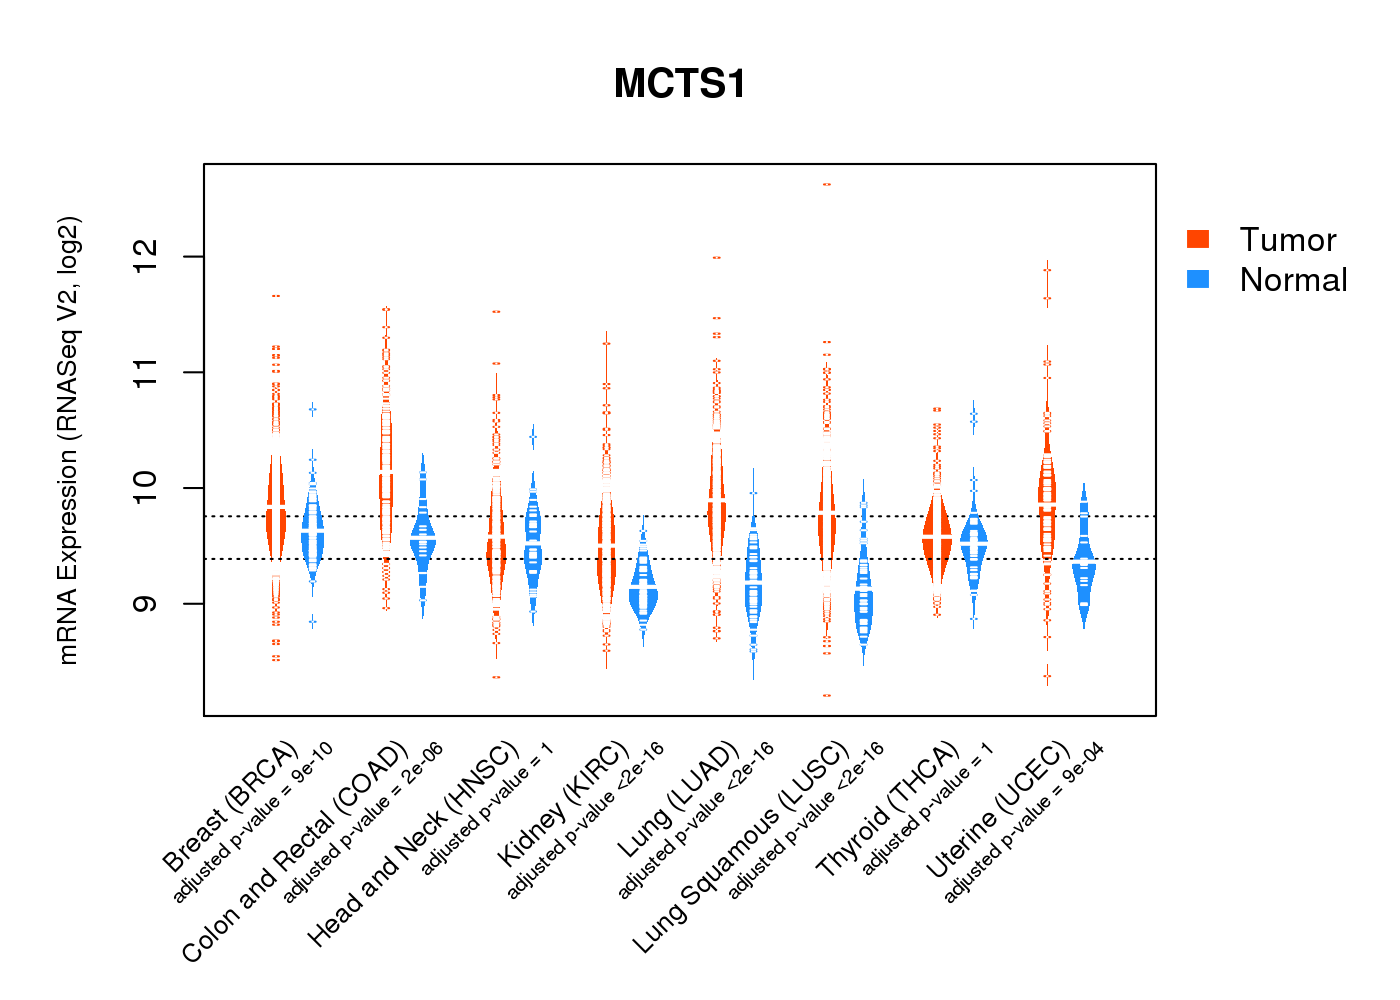 |
| Top |
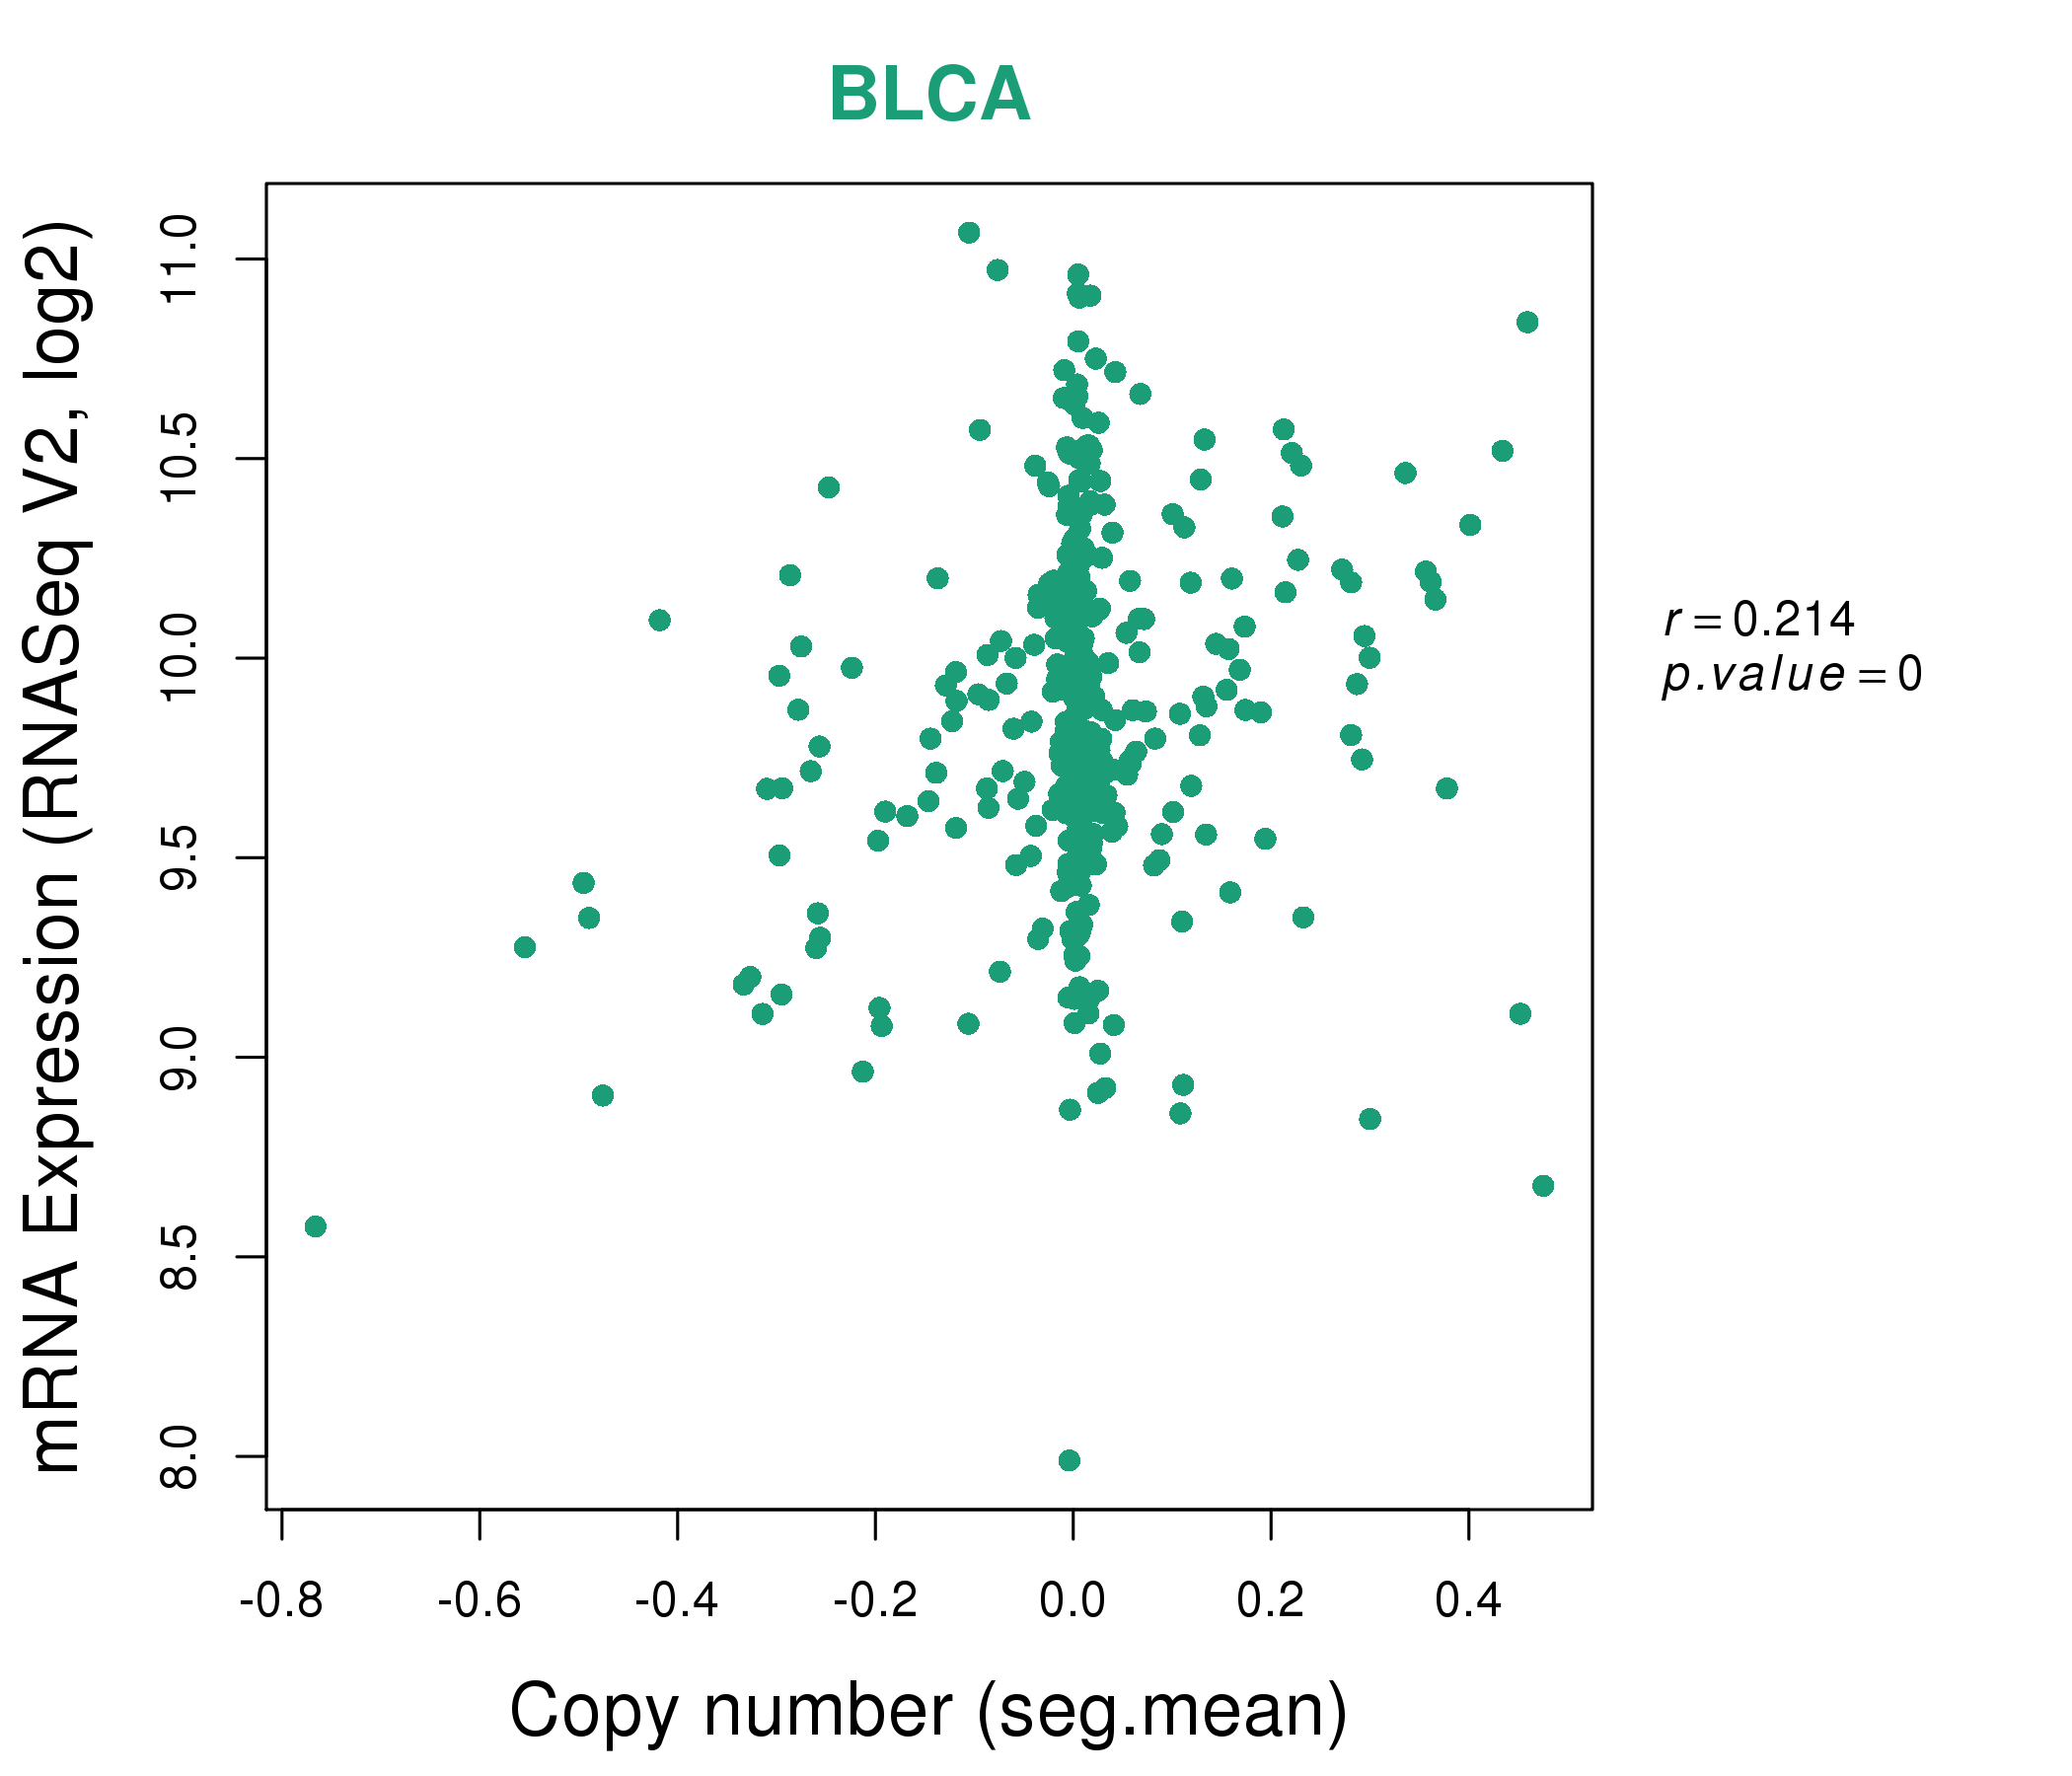
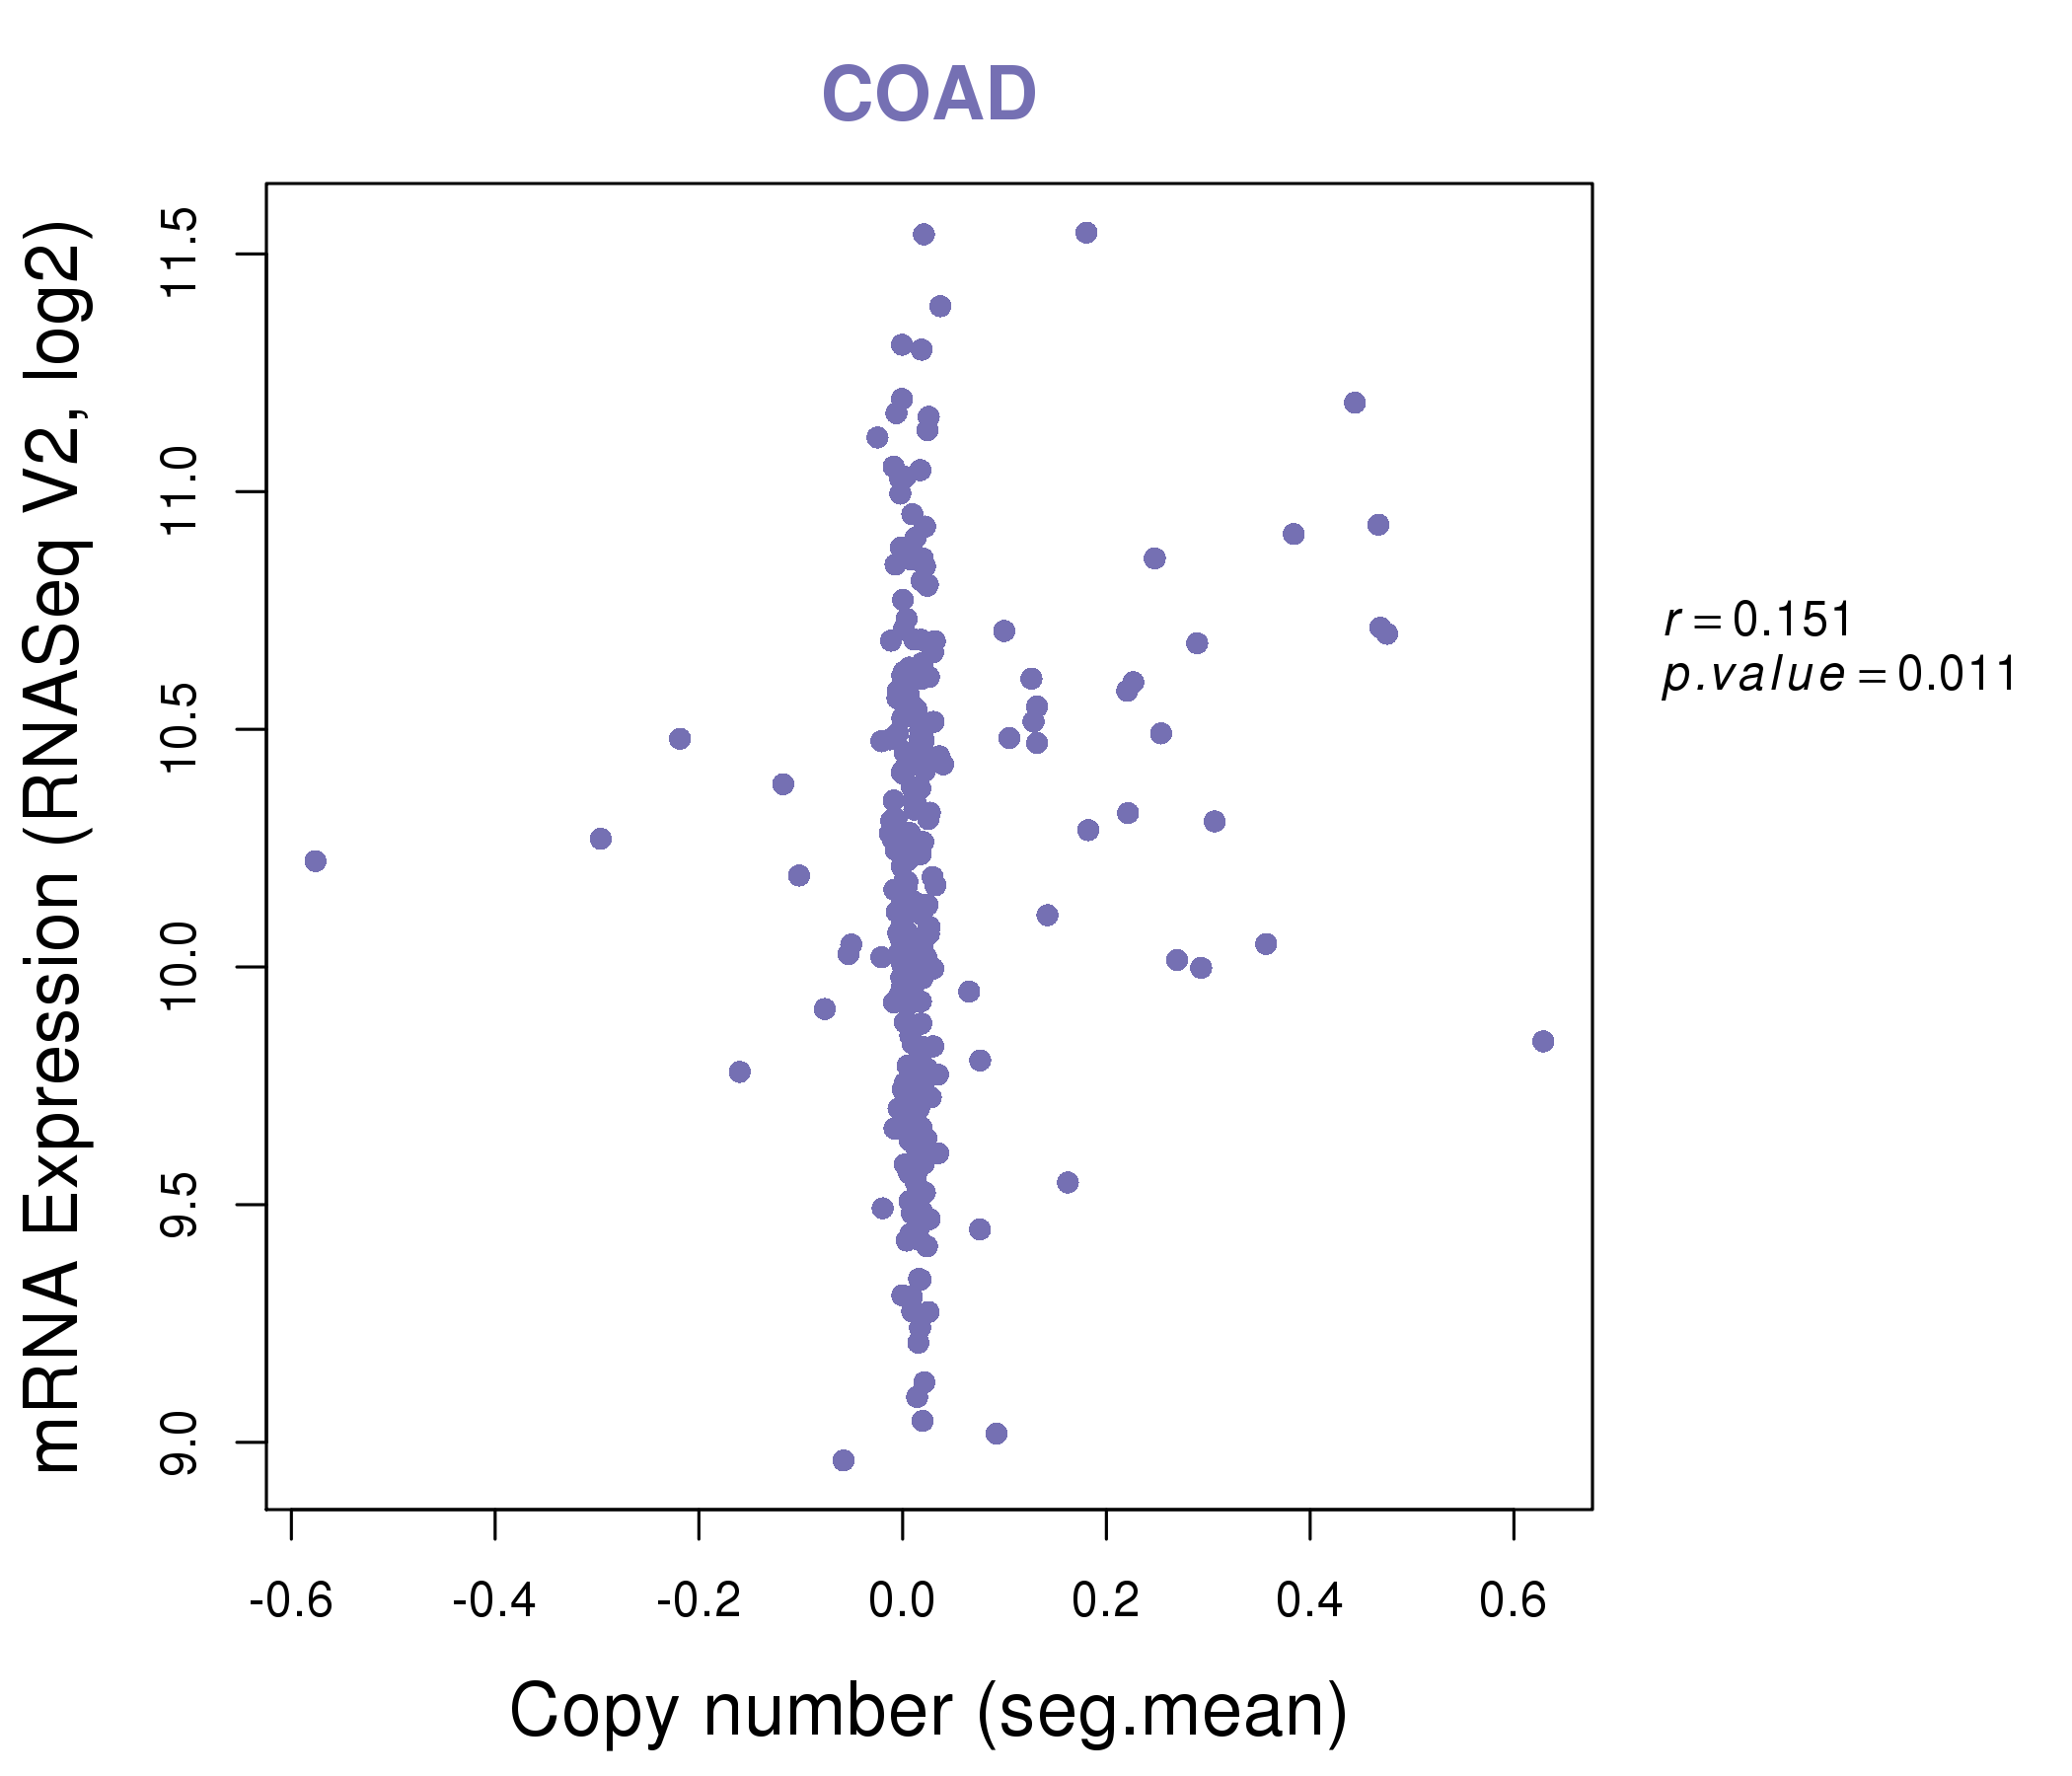
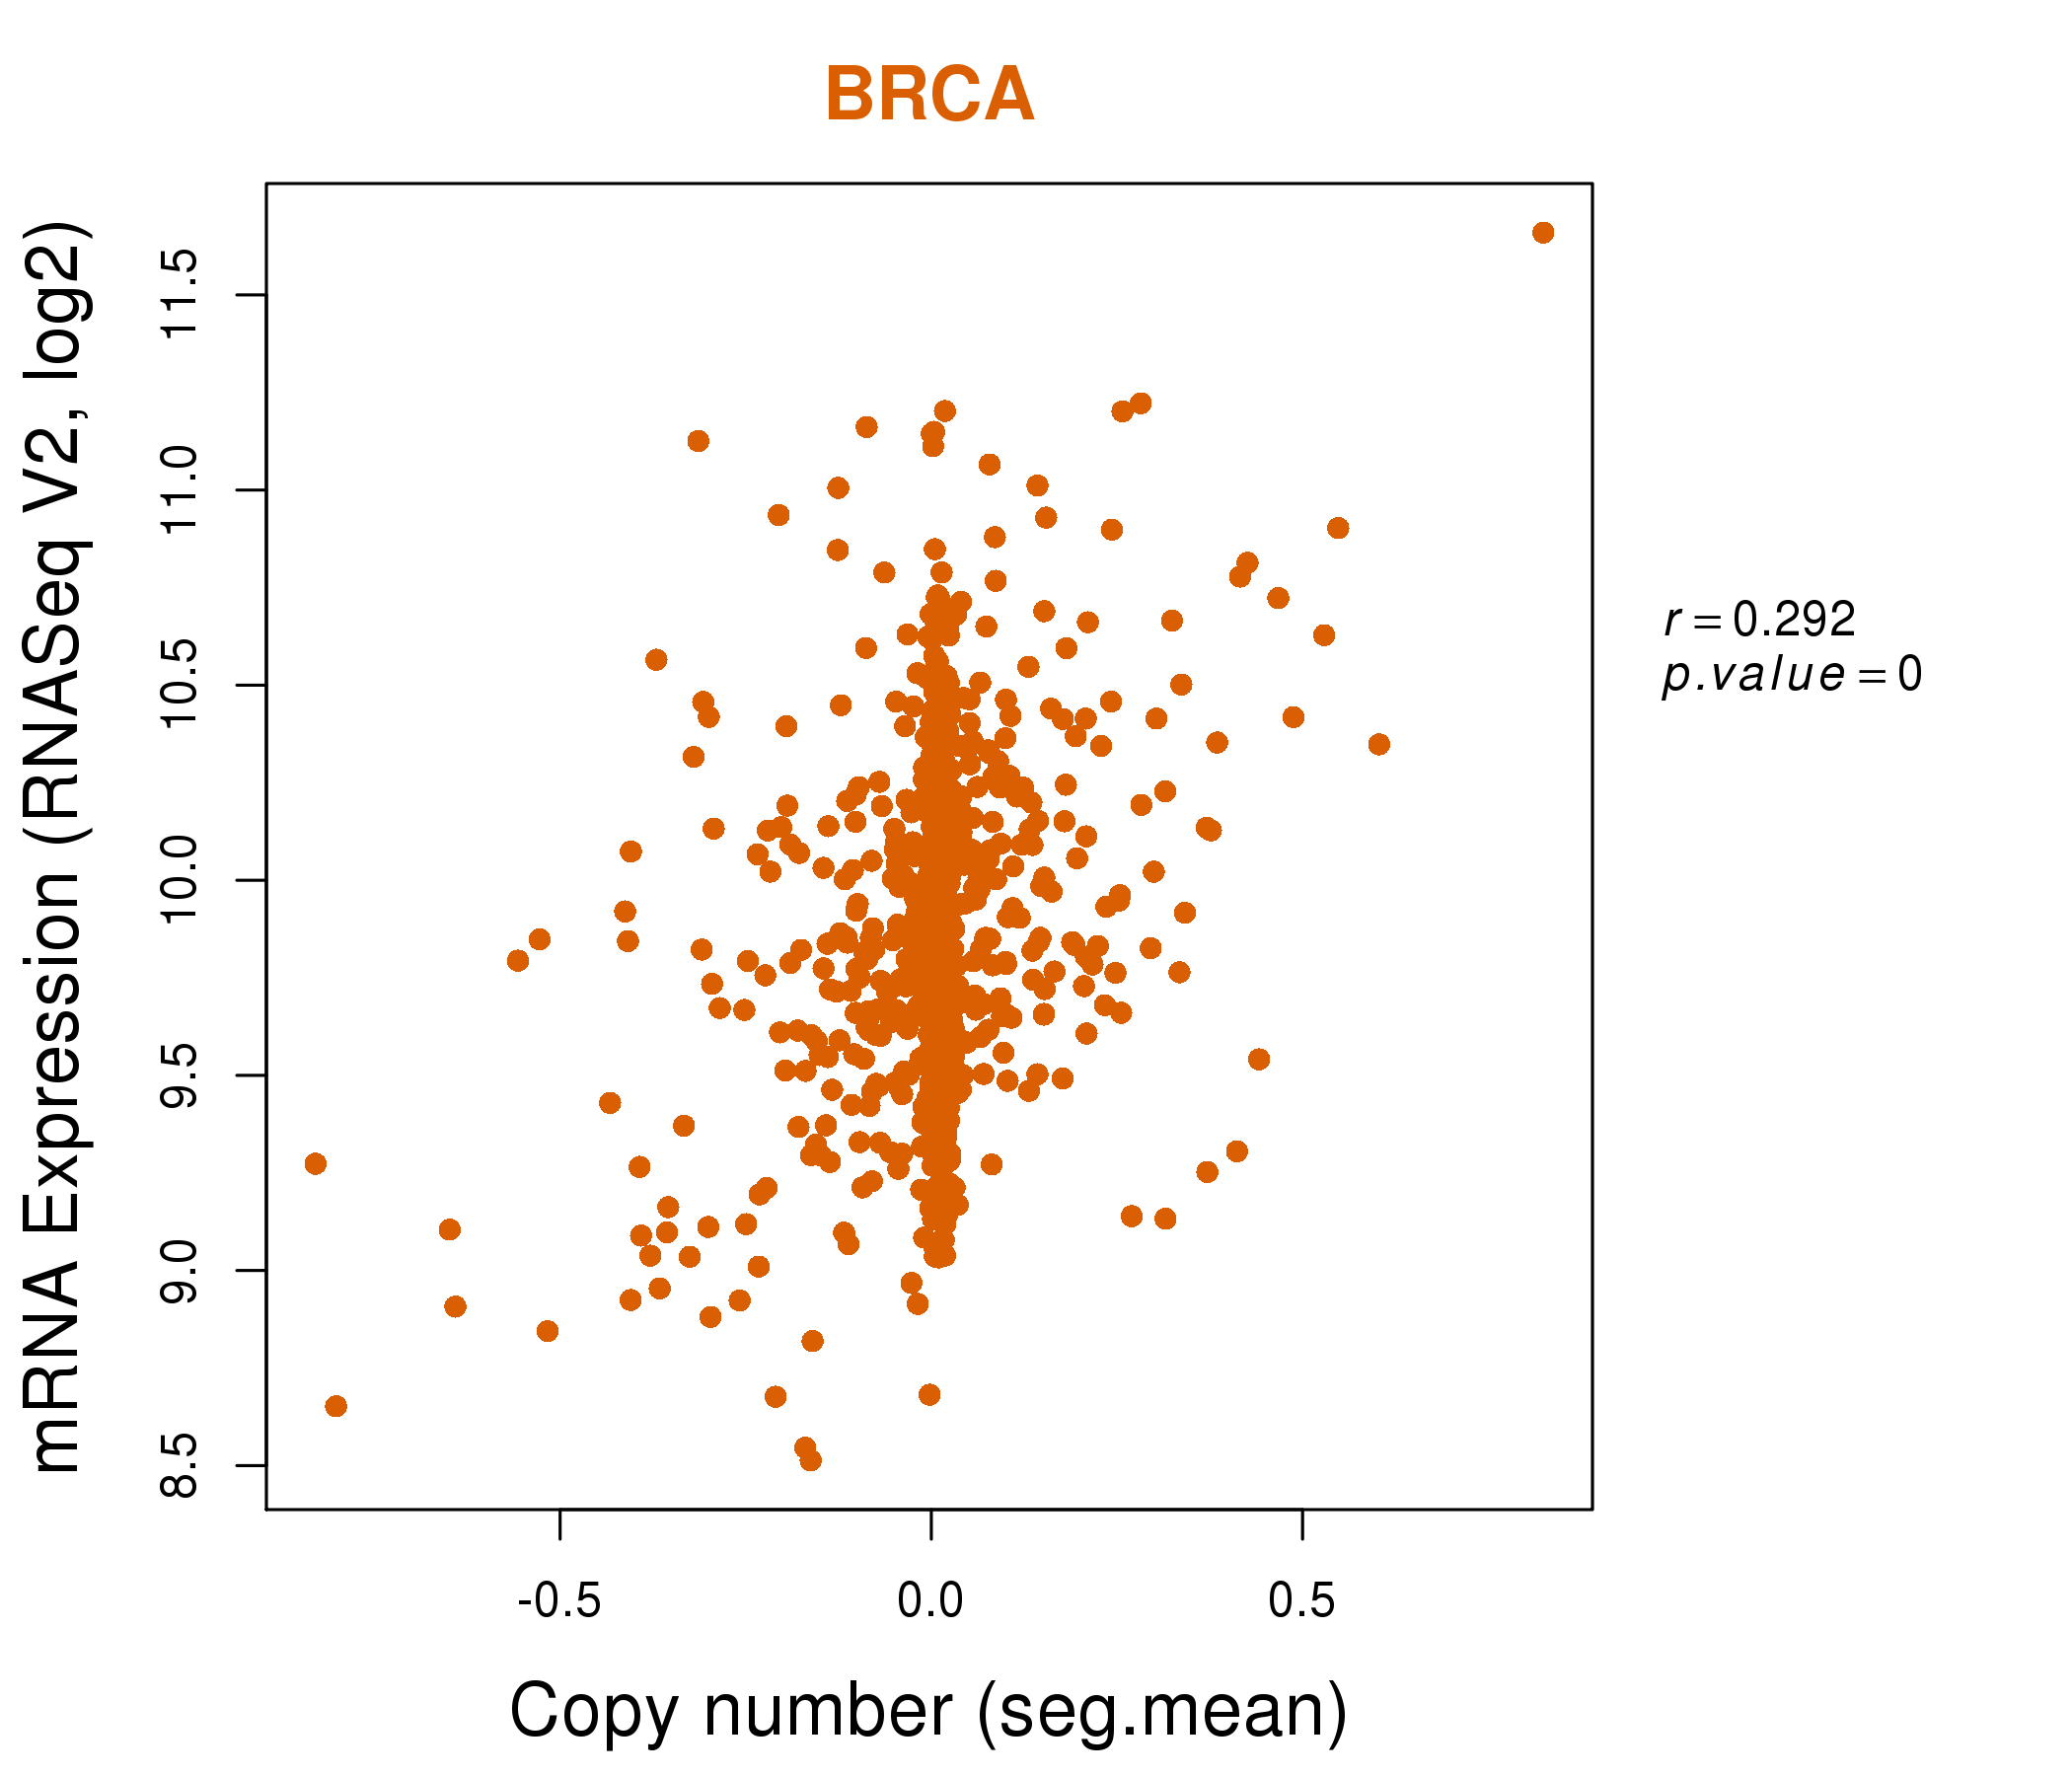
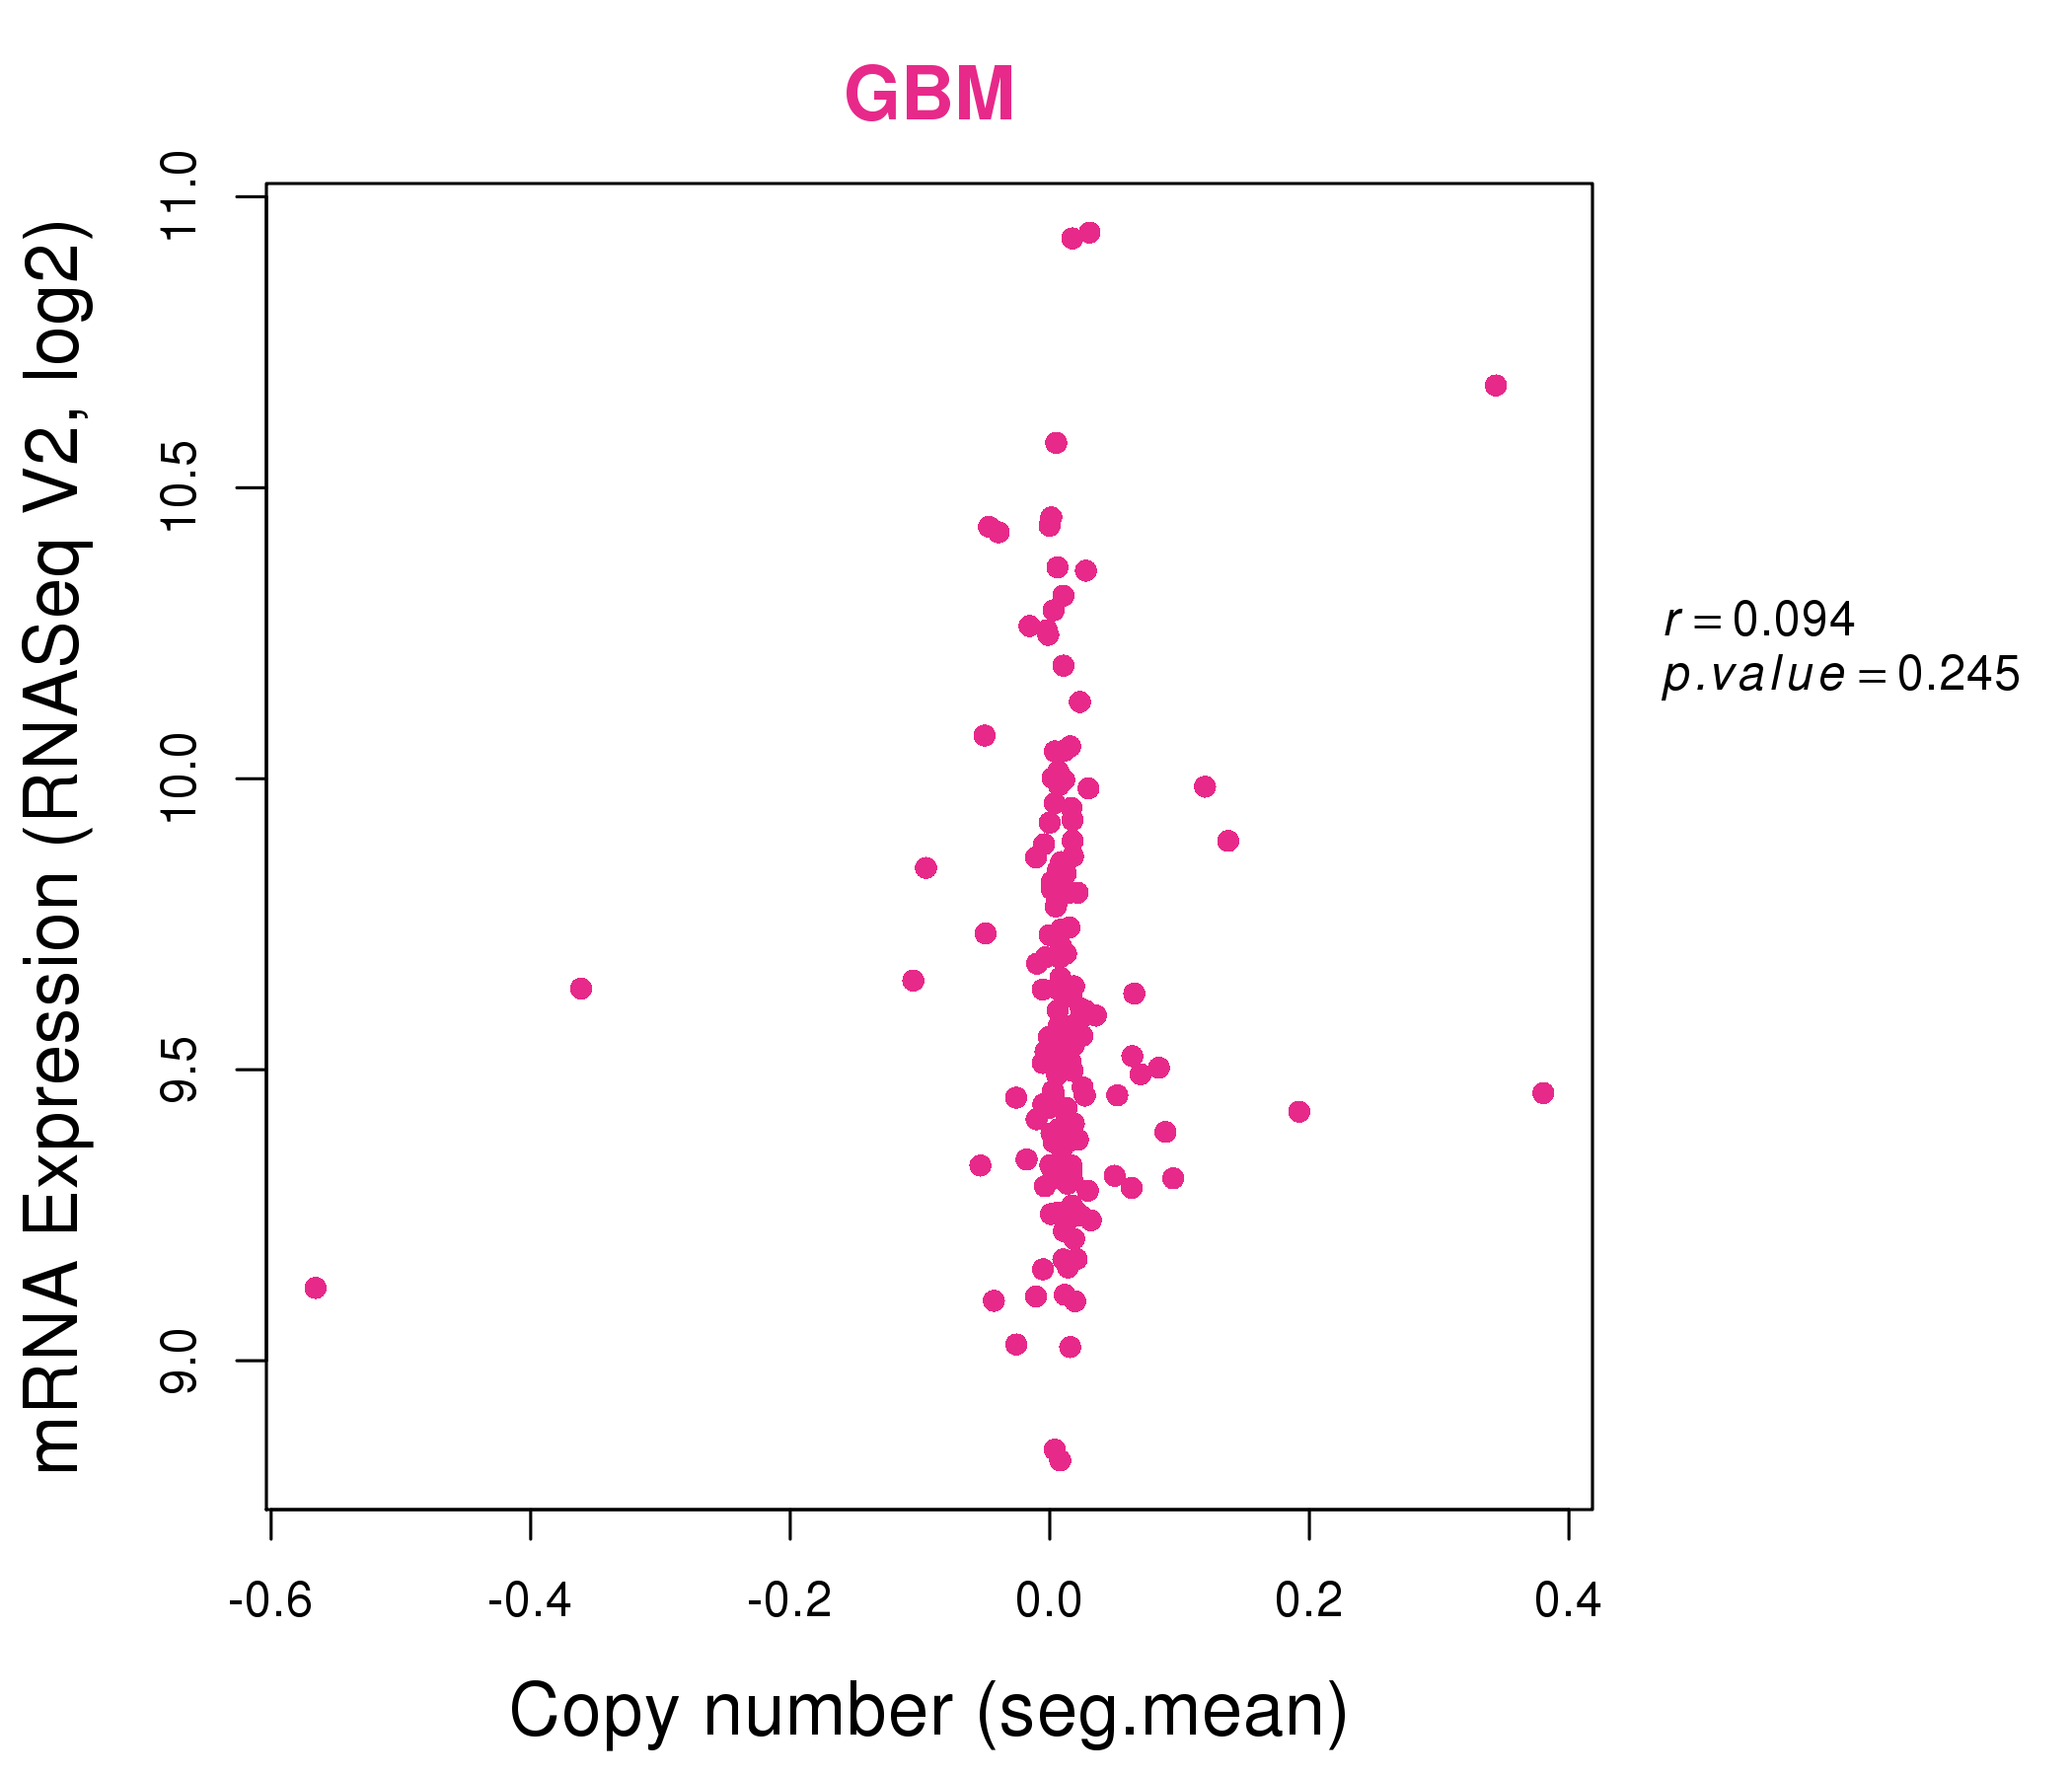
| * This plots show the correlation between CNV and gene expression. |
: Open all plots for all cancer types
 |
|
 |
|
| Top |
| Gene-Gene Network Information |
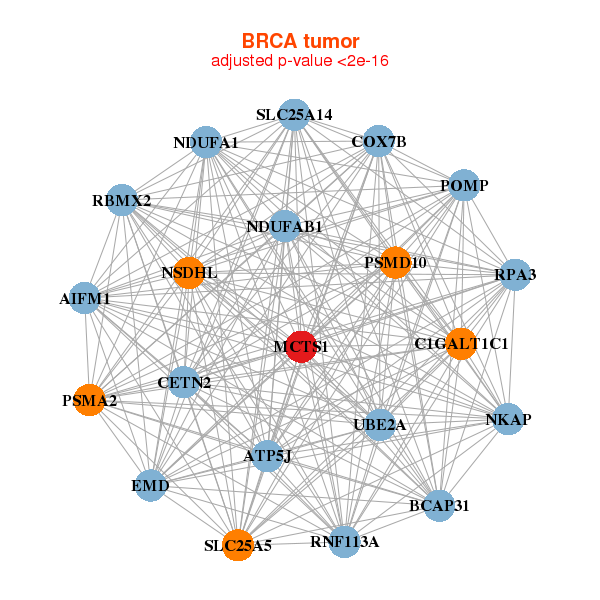
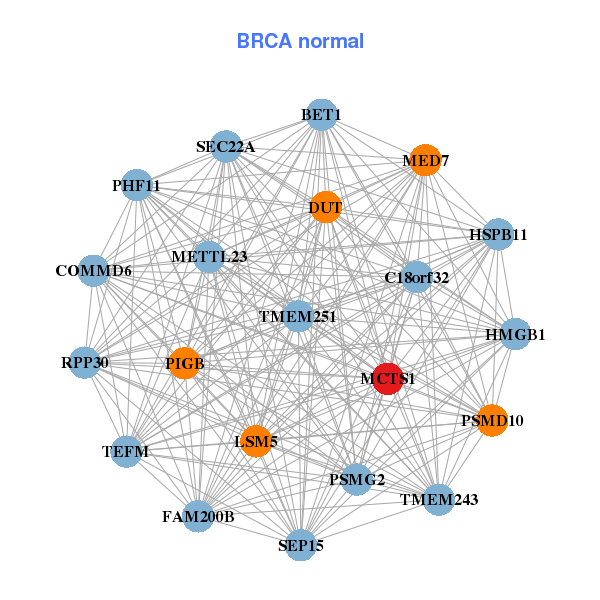
| * Co-Expression network figures were drawn using R package igraph. Only the top 20 genes with the highest correlations were shown. Red circle: input gene, orange circle: cell metabolism gene, sky circle: other gene |
: Open all plots for all cancer types
 |
|
| AIFM1,ATP5J,BCAP31,C1GALT1C1,CETN2,COX7B,EMD, MCTS1,NDUFA1,NDUFAB1,NKAP,NSDHL,POMP,PSMA2, PSMD10,RBMX2,RNF113A,RPA3,SLC25A14,SLC25A5,UBE2A | BET1,TMEM251,TEFM,METTL23,C18orf32,TMEM243,COMMD6, DUT,FAM200B,HMGB1,HSPB11,LSM5,MCTS1,MED7, PHF11,PIGB,PSMD10,PSMG2,RPP30,SEC22A,SEP15 |
 |
|
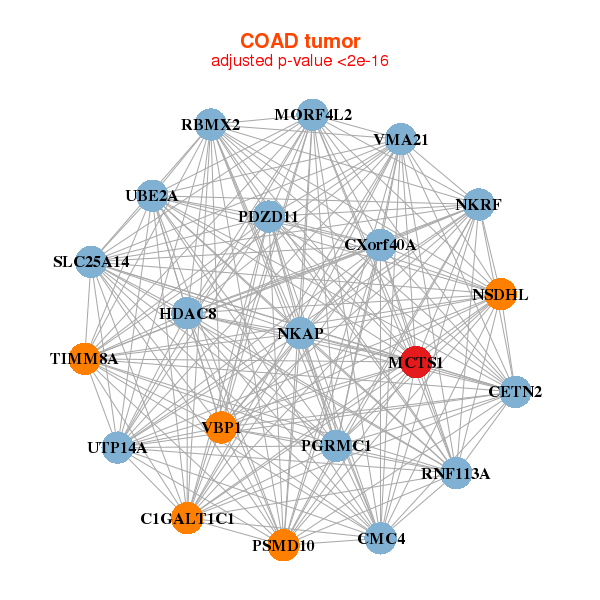
| C1GALT1C1,CETN2,CXorf40A,HDAC8,MCTS1,MORF4L2,CMC4, NKAP,NKRF,NSDHL,PDZD11,PGRMC1,PSMD10,RBMX2, RNF113A,SLC25A14,TIMM8A,UBE2A,UTP14A,VBP1,VMA21 | ATG3,LBHD1___C11orf98,C1GALT1C1,TMA7,CHCHD1,CISD2,DPM1, FKBP3,LSM6,MCTS1,MRPL42,OSTC,PSMA5,PSMC6, PTS,SCFD1,SNRPG,TOMM5,UCHL3,YWHAE,ZC3H15 |
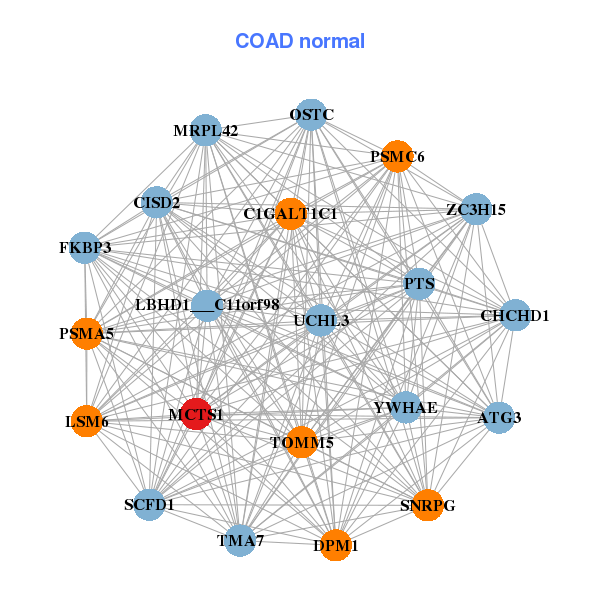
| * Co-Expression network figures were drawn using R package igraph. Only the top 20 genes with the highest correlations were shown. Red circle: input gene, orange circle: cell metabolism gene, sky circle: other gene |
: Open all plots for all cancer types
| Top |
: Open all interacting genes' information including KEGG pathway for all interacting genes from DAVID
| Top |
| Pharmacological Information for MCTS1 |
| There's no related Drug. |
| Top |
| Cross referenced IDs for MCTS1 |
| * We obtained these cross-references from Uniprot database. It covers 150 different DBs, 18 categories. http://www.uniprot.org/help/cross_references_section |
: Open all cross reference information
|
Copyright © 2016-Present - The Univsersity of Texas Health Science Center at Houston @ |