|
|||||||||||||||||||||||||||||||||||||||||||||||||||||||||||||||||||||||||||||||||||||||||||||||||||||||||||||||||||||||||||||||||||||||||||||||||||||||||||||||||||||||||||||||||||||||||||||||||||||||||||||||||||||||||||||||||||||||||||||||||||||||||||||||||||||||||||||||||||||||||||||||||||||||||||||||||||||||||||||||||||||||||||||||||||||||||||||||||||||
| |
| Phenotypic Information (metabolism pathway, cancer, disease, phenome) |
| |
| |
| Gene-Gene Network Information: Co-Expression Network, Interacting Genes & KEGG |
| |
|


| Gene Summary for ANPEP |
| Basic gene info. | Gene symbol | ANPEP |
| Gene name | alanyl (membrane) aminopeptidase | |
| Synonyms | APN|CD13|GP150|LAP1|P150|PEPN | |
| Cytomap | UCSC genome browser: 15q25-q26 | |
| Genomic location | chr15 :90328125-90358072 | |
| Type of gene | protein-coding | |
| RefGenes | NM_001150.2, | |
| Ensembl id | ENSG00000166825 | |
| Description | AP-MAP-Nalanyl aminopeptidaseaminopeptidase Maminopeptidase NhAPNmicrosomal aminopeptidasemyeloid plasma membrane glycoprotein CD13 | |
| Modification date | 20141211 | |
| dbXrefs | MIM : 151530 | |
| HGNC : HGNC | ||
| Ensembl : ENSG00000166825 | ||
| HPRD : 01055 | ||
| Vega : OTTHUMG00000149814 | ||
| Protein | UniProt: go to UniProt's Cross Reference DB Table | |
| Expression | CleanEX: HS_ANPEP | |
| BioGPS: 290 | ||
| Gene Expression Atlas: ENSG00000166825 | ||
| The Human Protein Atlas: ENSG00000166825 | ||
| Pathway | NCI Pathway Interaction Database: ANPEP | |
| KEGG: ANPEP | ||
| REACTOME: ANPEP | ||
| ConsensusPathDB | ||
| Pathway Commons: ANPEP | ||
| Metabolism | MetaCyc: ANPEP | |
| HUMANCyc: ANPEP | ||
| Regulation | Ensembl's Regulation: ENSG00000166825 | |
| miRBase: chr15 :90,328,125-90,358,072 | ||
| TargetScan: NM_001150 | ||
| cisRED: ENSG00000166825 | ||
| Context | iHOP: ANPEP | |
| cancer metabolism search in PubMed: ANPEP | ||
| UCL Cancer Institute: ANPEP | ||
| Assigned class in ccmGDB | C | |
| Top |
| Phenotypic Information for ANPEP(metabolism pathway, cancer, disease, phenome) |
| Cancer | CGAP: ANPEP |
| Familial Cancer Database: ANPEP | |
| * This gene is included in those cancer gene databases. |
|
|
|
|
|
| . | |||||||||||||||||||||||||||||||||||||||||||||||||||||||||||||||||||||||||||||||||||||||||||||||||||||||||||||||||||||||||||||||||||||||||||||||||||||||||||||||||||||||||||||||||||||||||||||||||||||||||||||||||||||||||||||||||||||||||||||||||||||||||||||||||||||||||||||||||||||||||||||||||||||||||||||||||||||||||||||||||||||||||||||||||||||||||||||||
Oncogene 1 | Significant driver gene in | ||||||||||||||||||||||||||||||||||||||||||||||||||||||||||||||||||||||||||||||||||||||||||||||||||||||||||||||||||||||||||||||||||||||||||||||||||||||||||||||||||||||||||||||||||||||||||||||||||||||||||||||||||||||||||||||||||||||||||||||||||||||||||||||||||||||||||||||||||||||||||||||||||||||||||||||||||||||||||||||||||||||||||||||||||||||||||||||||||||
| cf) number; DB name 1 Oncogene; http://nar.oxfordjournals.org/content/35/suppl_1/D721.long, 2 Tumor Suppressor gene; https://bioinfo.uth.edu/TSGene/, 3 Cancer Gene Census; http://www.nature.com/nrc/journal/v4/n3/abs/nrc1299.html, 4 CancerGenes; http://nar.oxfordjournals.org/content/35/suppl_1/D721.long, 5 Network of Cancer Gene; http://ncg.kcl.ac.uk/index.php, 1Therapeutic Vulnerabilities in Cancer; http://cbio.mskcc.org/cancergenomics/statius/ |
| KEGG_GLUTATHIONE_METABOLISM | |
| OMIM | |
| Orphanet | |
| Disease | KEGG Disease: ANPEP |
| MedGen: ANPEP (Human Medical Genetics with Condition) | |
| ClinVar: ANPEP | |
| Phenotype | MGI: ANPEP (International Mouse Phenotyping Consortium) |
| PhenomicDB: ANPEP | |
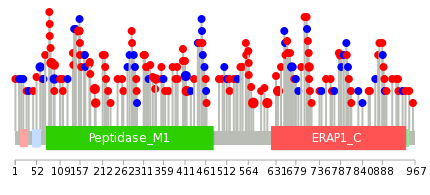
| Mutations for ANPEP |
| * Under tables are showing count per each tissue to give us broad intuition about tissue specific mutation patterns.You can go to the detailed page for each mutation database's web site. |
| There's no structural variation information in COSMIC data for this gene. |
| * From mRNA Sanger sequences, Chitars2.0 arranged chimeric transcripts. This table shows ANPEP related fusion information. |
| ID | Head Gene | Tail Gene | Accession | Gene_a | qStart_a | qEnd_a | Chromosome_a | tStart_a | tEnd_a | Gene_a | qStart_a | qEnd_a | Chromosome_a | tStart_a | tEnd_a |
| CB157580 | ANPEP | 1 | 252 | 15 | 90346505 | 90347130 | ANPEP | 248 | 622 | 15 | 90340903 | 90344722 | |
| BQ882584 | CUX1 | 20 | 216 | 7 | 101461708 | 101461904 | ANPEP | 206 | 819 | 15 | 90347120 | 90348048 | |
| Top |
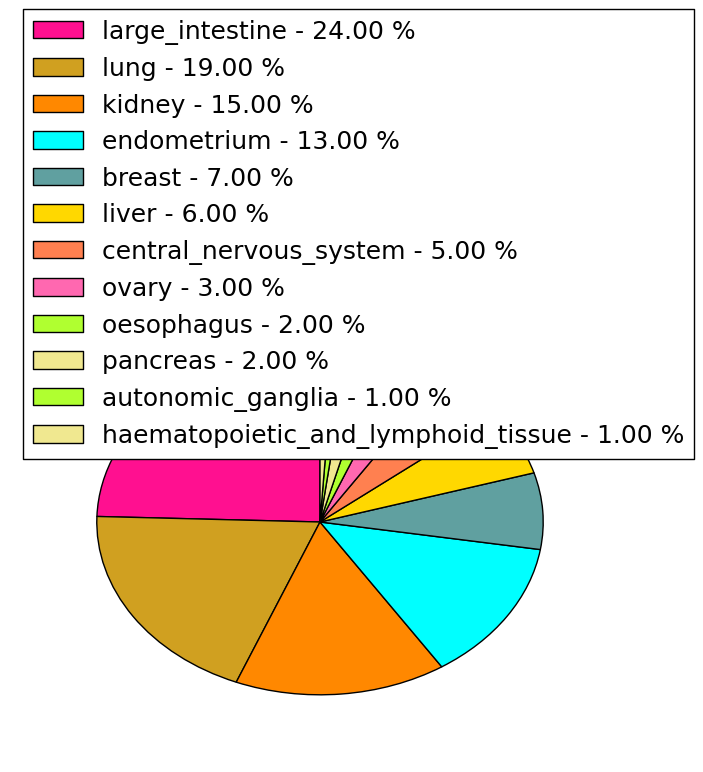
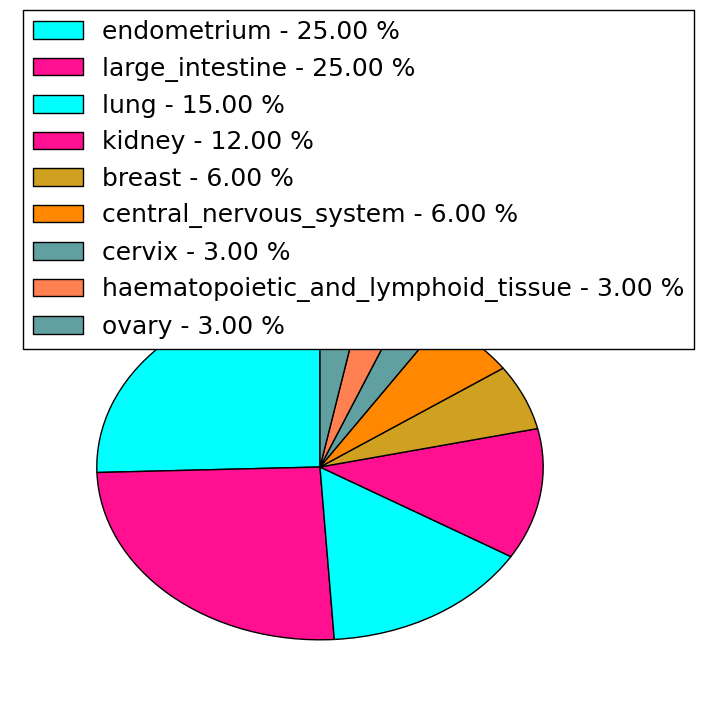
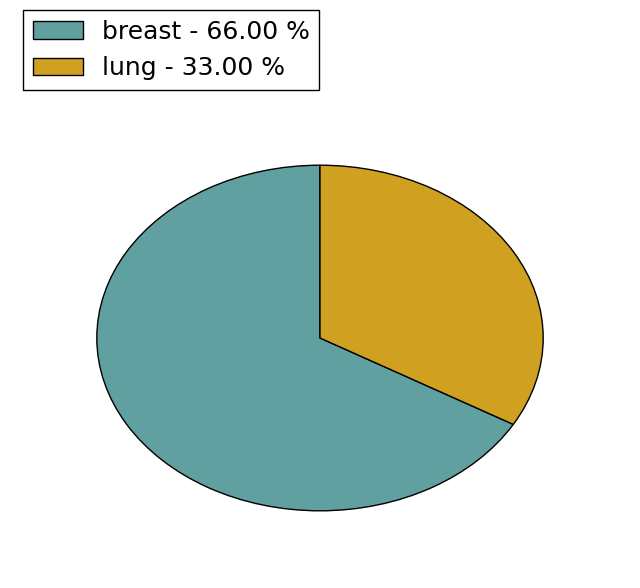
| Mutation type/ Tissue ID | brca | cns | cerv | endome | haematopo | kidn | Lintest | liver | lung | ns | ovary | pancre | prost | skin | stoma | thyro | urina | |||
| Total # sample | 1 | |||||||||||||||||||
| GAIN (# sample) | 1 | |||||||||||||||||||
| LOSS (# sample) |
| cf) Tissue ID; Tissue type (1; Breast, 2; Central_nervous_system, 3; Cervix, 4; Endometrium, 5; Haematopoietic_and_lymphoid_tissue, 6; Kidney, 7; Large_intestine, 8; Liver, 9; Lung, 10; NS, 11; Ovary, 12; Pancreas, 13; Prostate, 14; Skin, 15; Stomach, 16; Thyroid, 17; Urinary_tract) |
| Top |
|
 |
| Top |
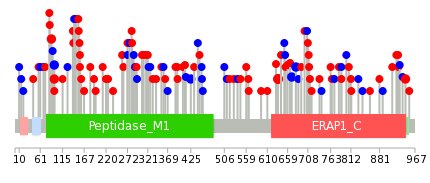
| Stat. for Non-Synonymous SNVs (# total SNVs=98) | (# total SNVs=32) |
 |  |
(# total SNVs=2) | (# total SNVs=3) |
 |  |
| Top |
| * When you move the cursor on each content, you can see more deailed mutation information on the Tooltip. Those are primary_site,primary_histology,mutation(aa),pubmedID. |
| GRCh37 position | Mutation(aa) | Unique sampleID count |
| chr15:90344681-90344681 | p.R576H | 4 |
| chr15:90342704-90342704 | p.E636K | 3 |
| chr15:90349236-90349236 | p.F193L | 3 |
| chr15:90342782-90342782 | p.D610N | 3 |
| chr15:90349552-90349552 | p.T88M | 3 |
| chr15:90347169-90347169 | p.S415F | 3 |
| chr15:90347174-90347174 | p.F413F | 3 |
| chr15:90347724-90347724 | p.S341L | 2 |
| chr15:90349346-90349346 | p.E157Q | 2 |
| chr15:90349632-90349632 | p.S61S | 2 |
| Top |
|
 |
| Point Mutation/ Tissue ID | 1 | 2 | 3 | 4 | 5 | 6 | 7 | 8 | 9 | 10 | 11 | 12 | 13 | 14 | 15 | 16 | 17 | 18 | 19 | 20 |
| # sample | 3 | 5 | 2 | 22 | 2 | 2 | 11 | 2 | 9 | 9 | 3 | 23 | 10 | 18 | ||||||
| # mutation | 4 | 5 | 2 | 21 | 2 | 2 | 10 | 2 | 9 | 9 | 3 | 29 | 11 | 20 | ||||||
| nonsynonymous SNV | 3 | 5 | 1 | 15 | 1 | 7 | 2 | 5 | 8 | 2 | 17 | 7 | 12 | |||||||
| synonymous SNV | 1 | 1 | 6 | 1 | 2 | 3 | 4 | 1 | 1 | 12 | 4 | 8 |
| cf) Tissue ID; Tissue type (1; BLCA[Bladder Urothelial Carcinoma], 2; BRCA[Breast invasive carcinoma], 3; CESC[Cervical squamous cell carcinoma and endocervical adenocarcinoma], 4; COAD[Colon adenocarcinoma], 5; GBM[Glioblastoma multiforme], 6; Glioma Low Grade, 7; HNSC[Head and Neck squamous cell carcinoma], 8; KICH[Kidney Chromophobe], 9; KIRC[Kidney renal clear cell carcinoma], 10; KIRP[Kidney renal papillary cell carcinoma], 11; LAML[Acute Myeloid Leukemia], 12; LUAD[Lung adenocarcinoma], 13; LUSC[Lung squamous cell carcinoma], 14; OV[Ovarian serous cystadenocarcinoma ], 15; PAAD[Pancreatic adenocarcinoma], 16; PRAD[Prostate adenocarcinoma], 17; SKCM[Skin Cutaneous Melanoma], 18:STAD[Stomach adenocarcinoma], 19:THCA[Thyroid carcinoma], 20:UCEC[Uterine Corpus Endometrial Carcinoma]) |
| Top |
| * We represented just top 10 SNVs. When you move the cursor on each content, you can see more deailed mutation information on the Tooltip. Those are primary_site, primary_histology, mutation(aa), pubmedID. |
| Genomic Position | Mutation(aa) | Unique sampleID count |
| chr15:90342704 | p.E636K | 3 |
| chr15:90328653 | p.A425A | 2 |
| chr15:90340926 | p.P95P | 2 |
| chr15:90342493 | p.P95H | 2 |
| chr15:90349530 | p.T944M | 2 |
| chr15:90349346 | p.T88M | 2 |
| chr15:90349531 | p.A679A | 2 |
| chr15:90349552 | p.A669A | 2 |
| chr15:90347138 | p.E157Q | 2 |
| chr15:90349567 | p.T321M | 1 |
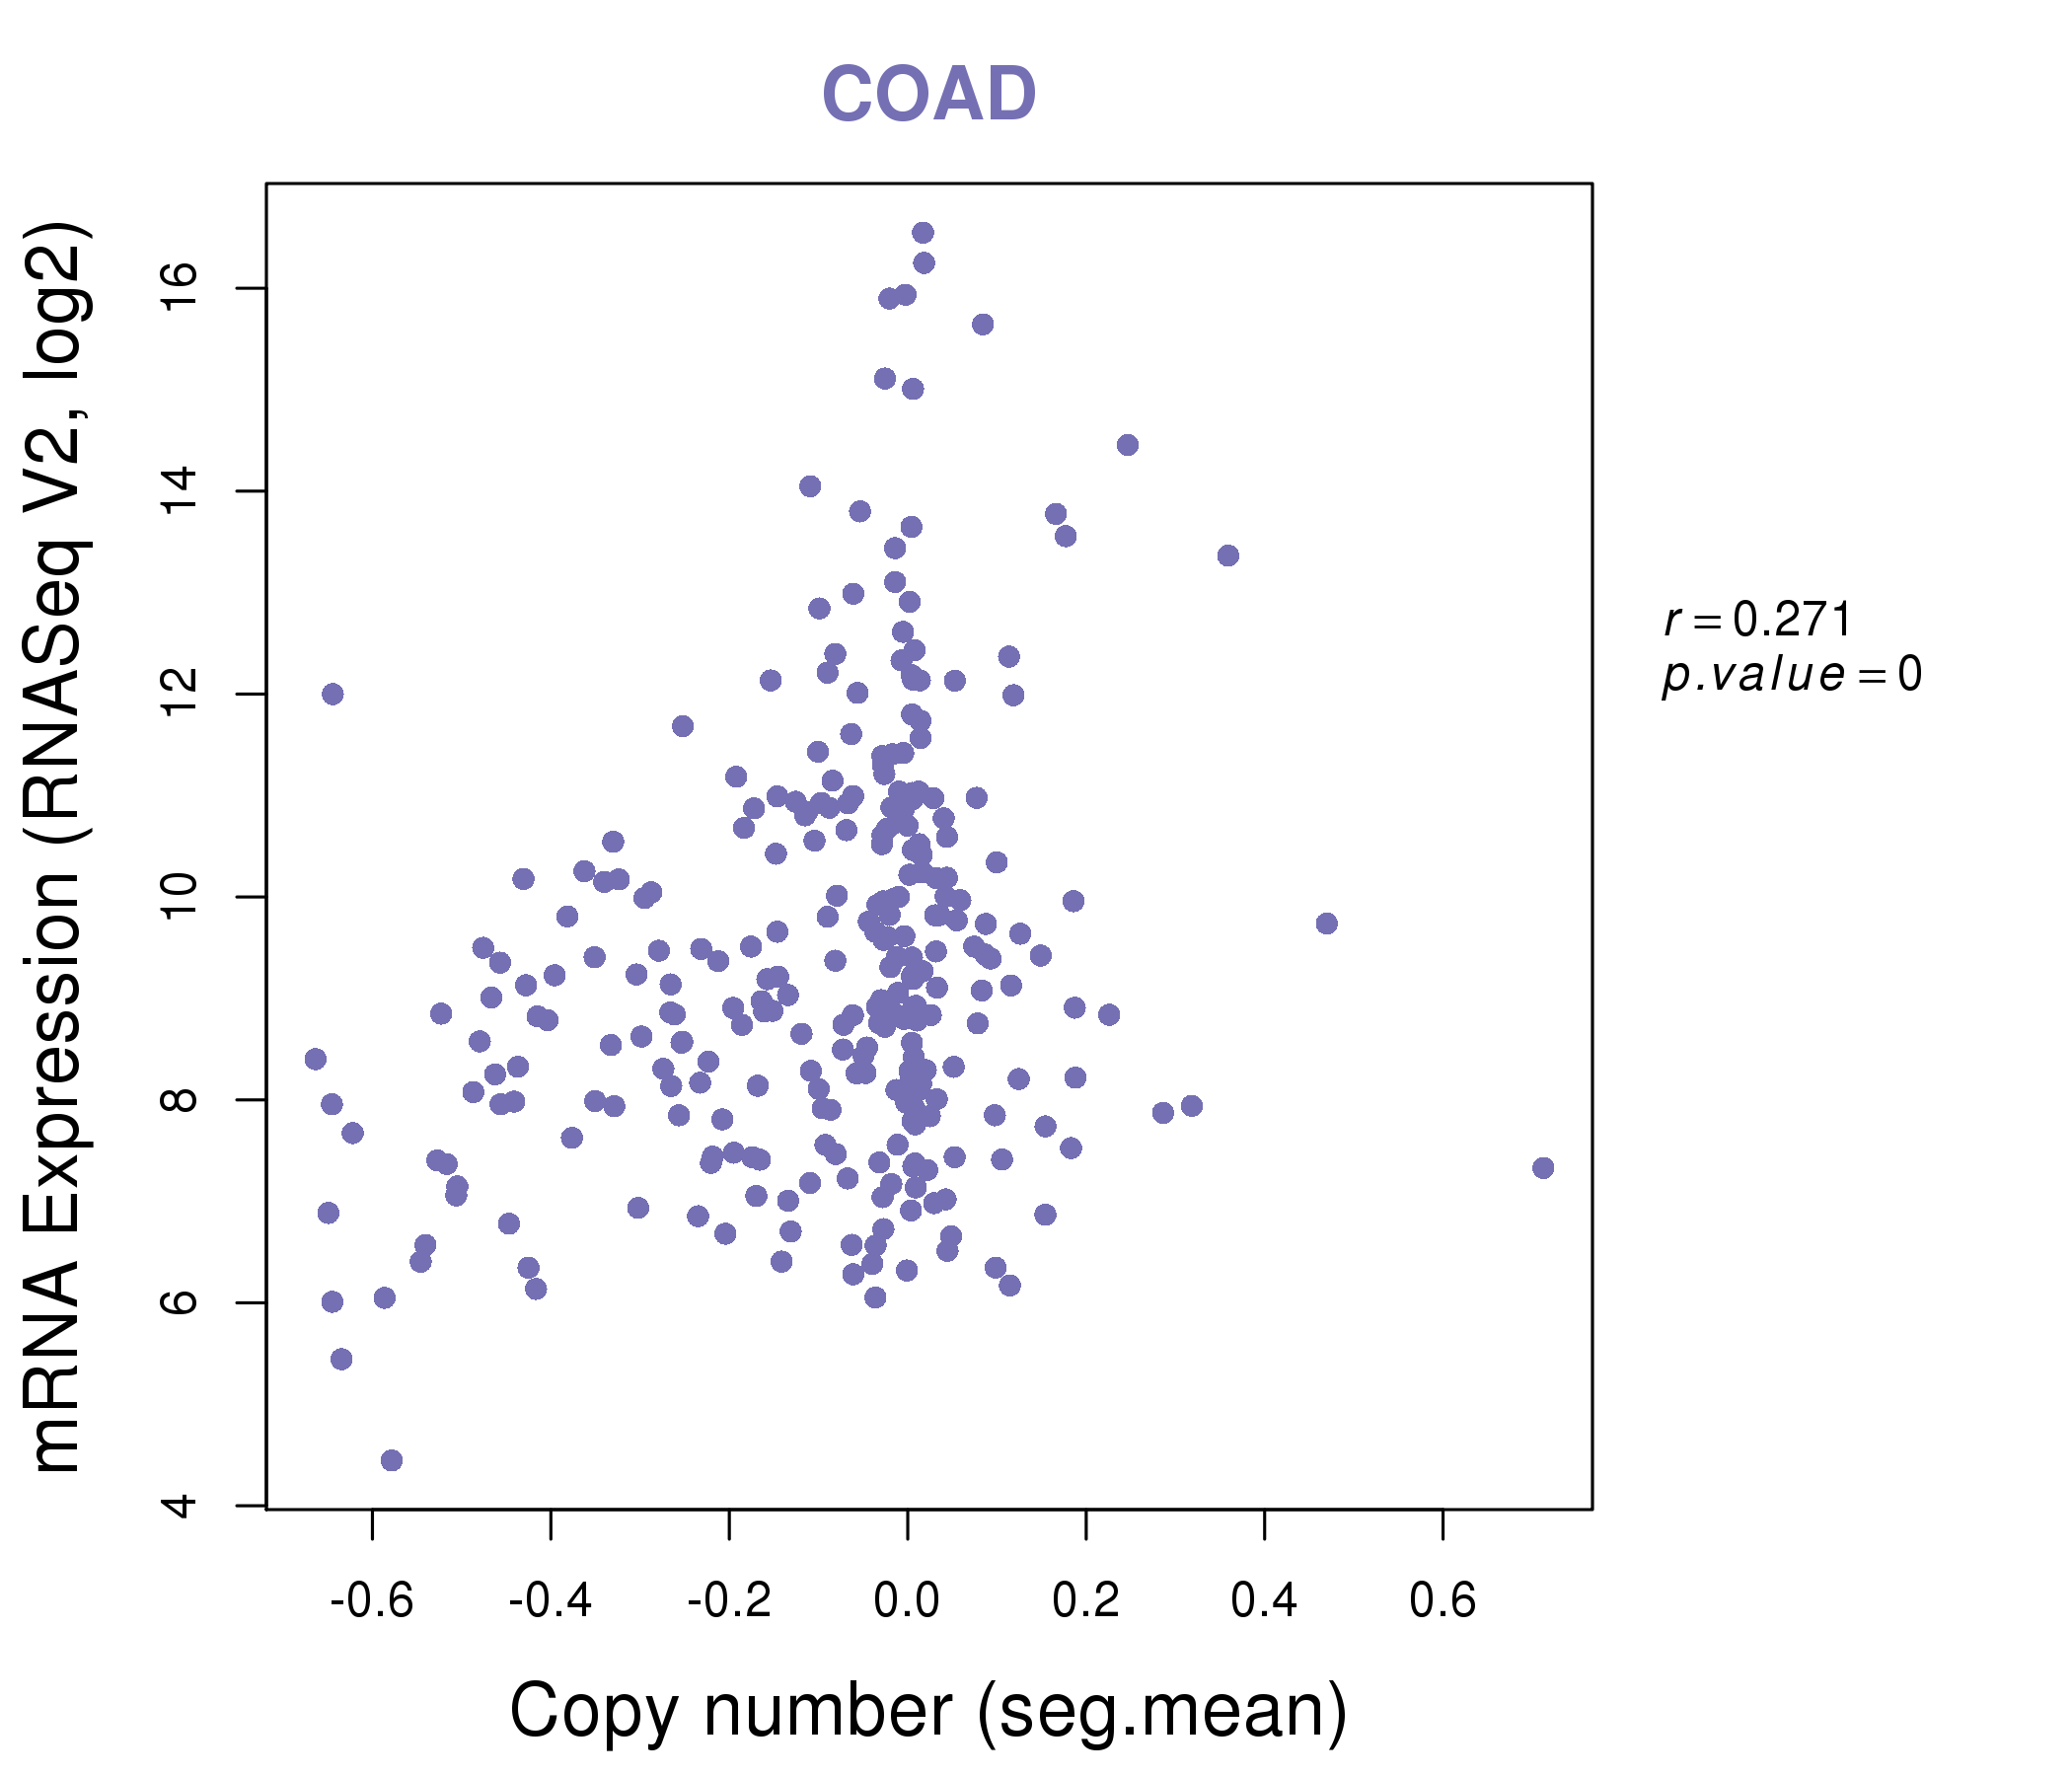
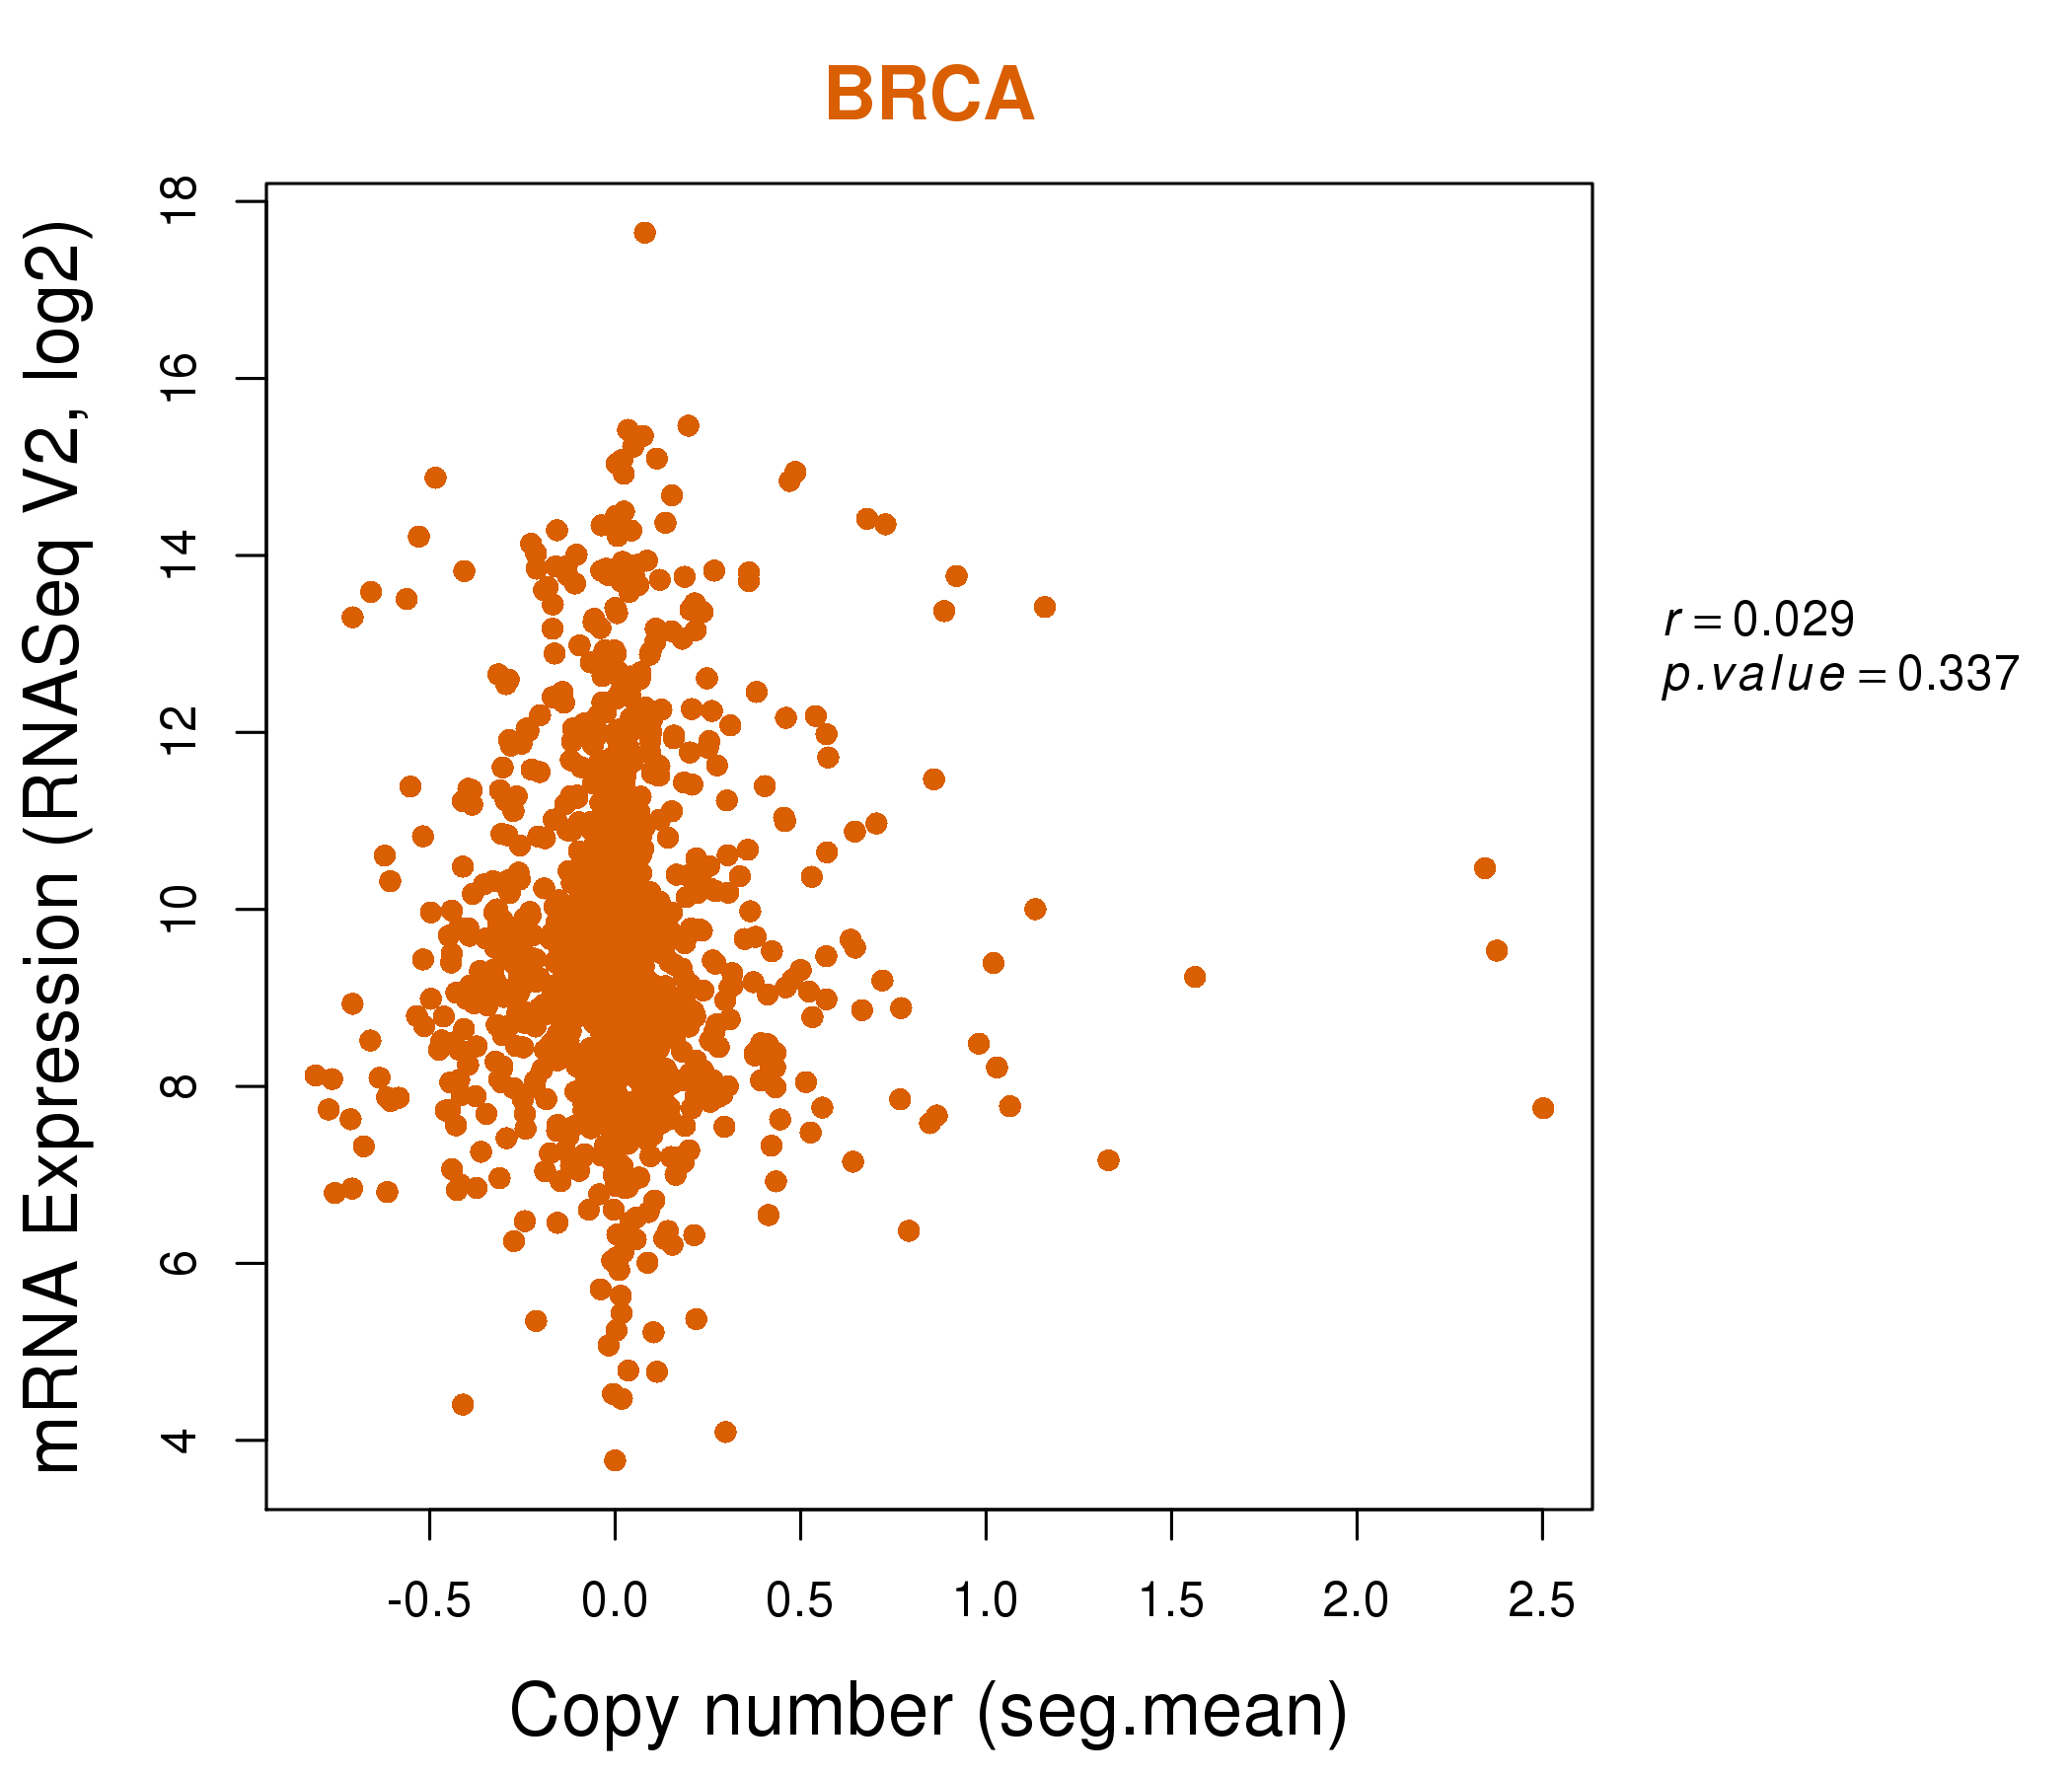
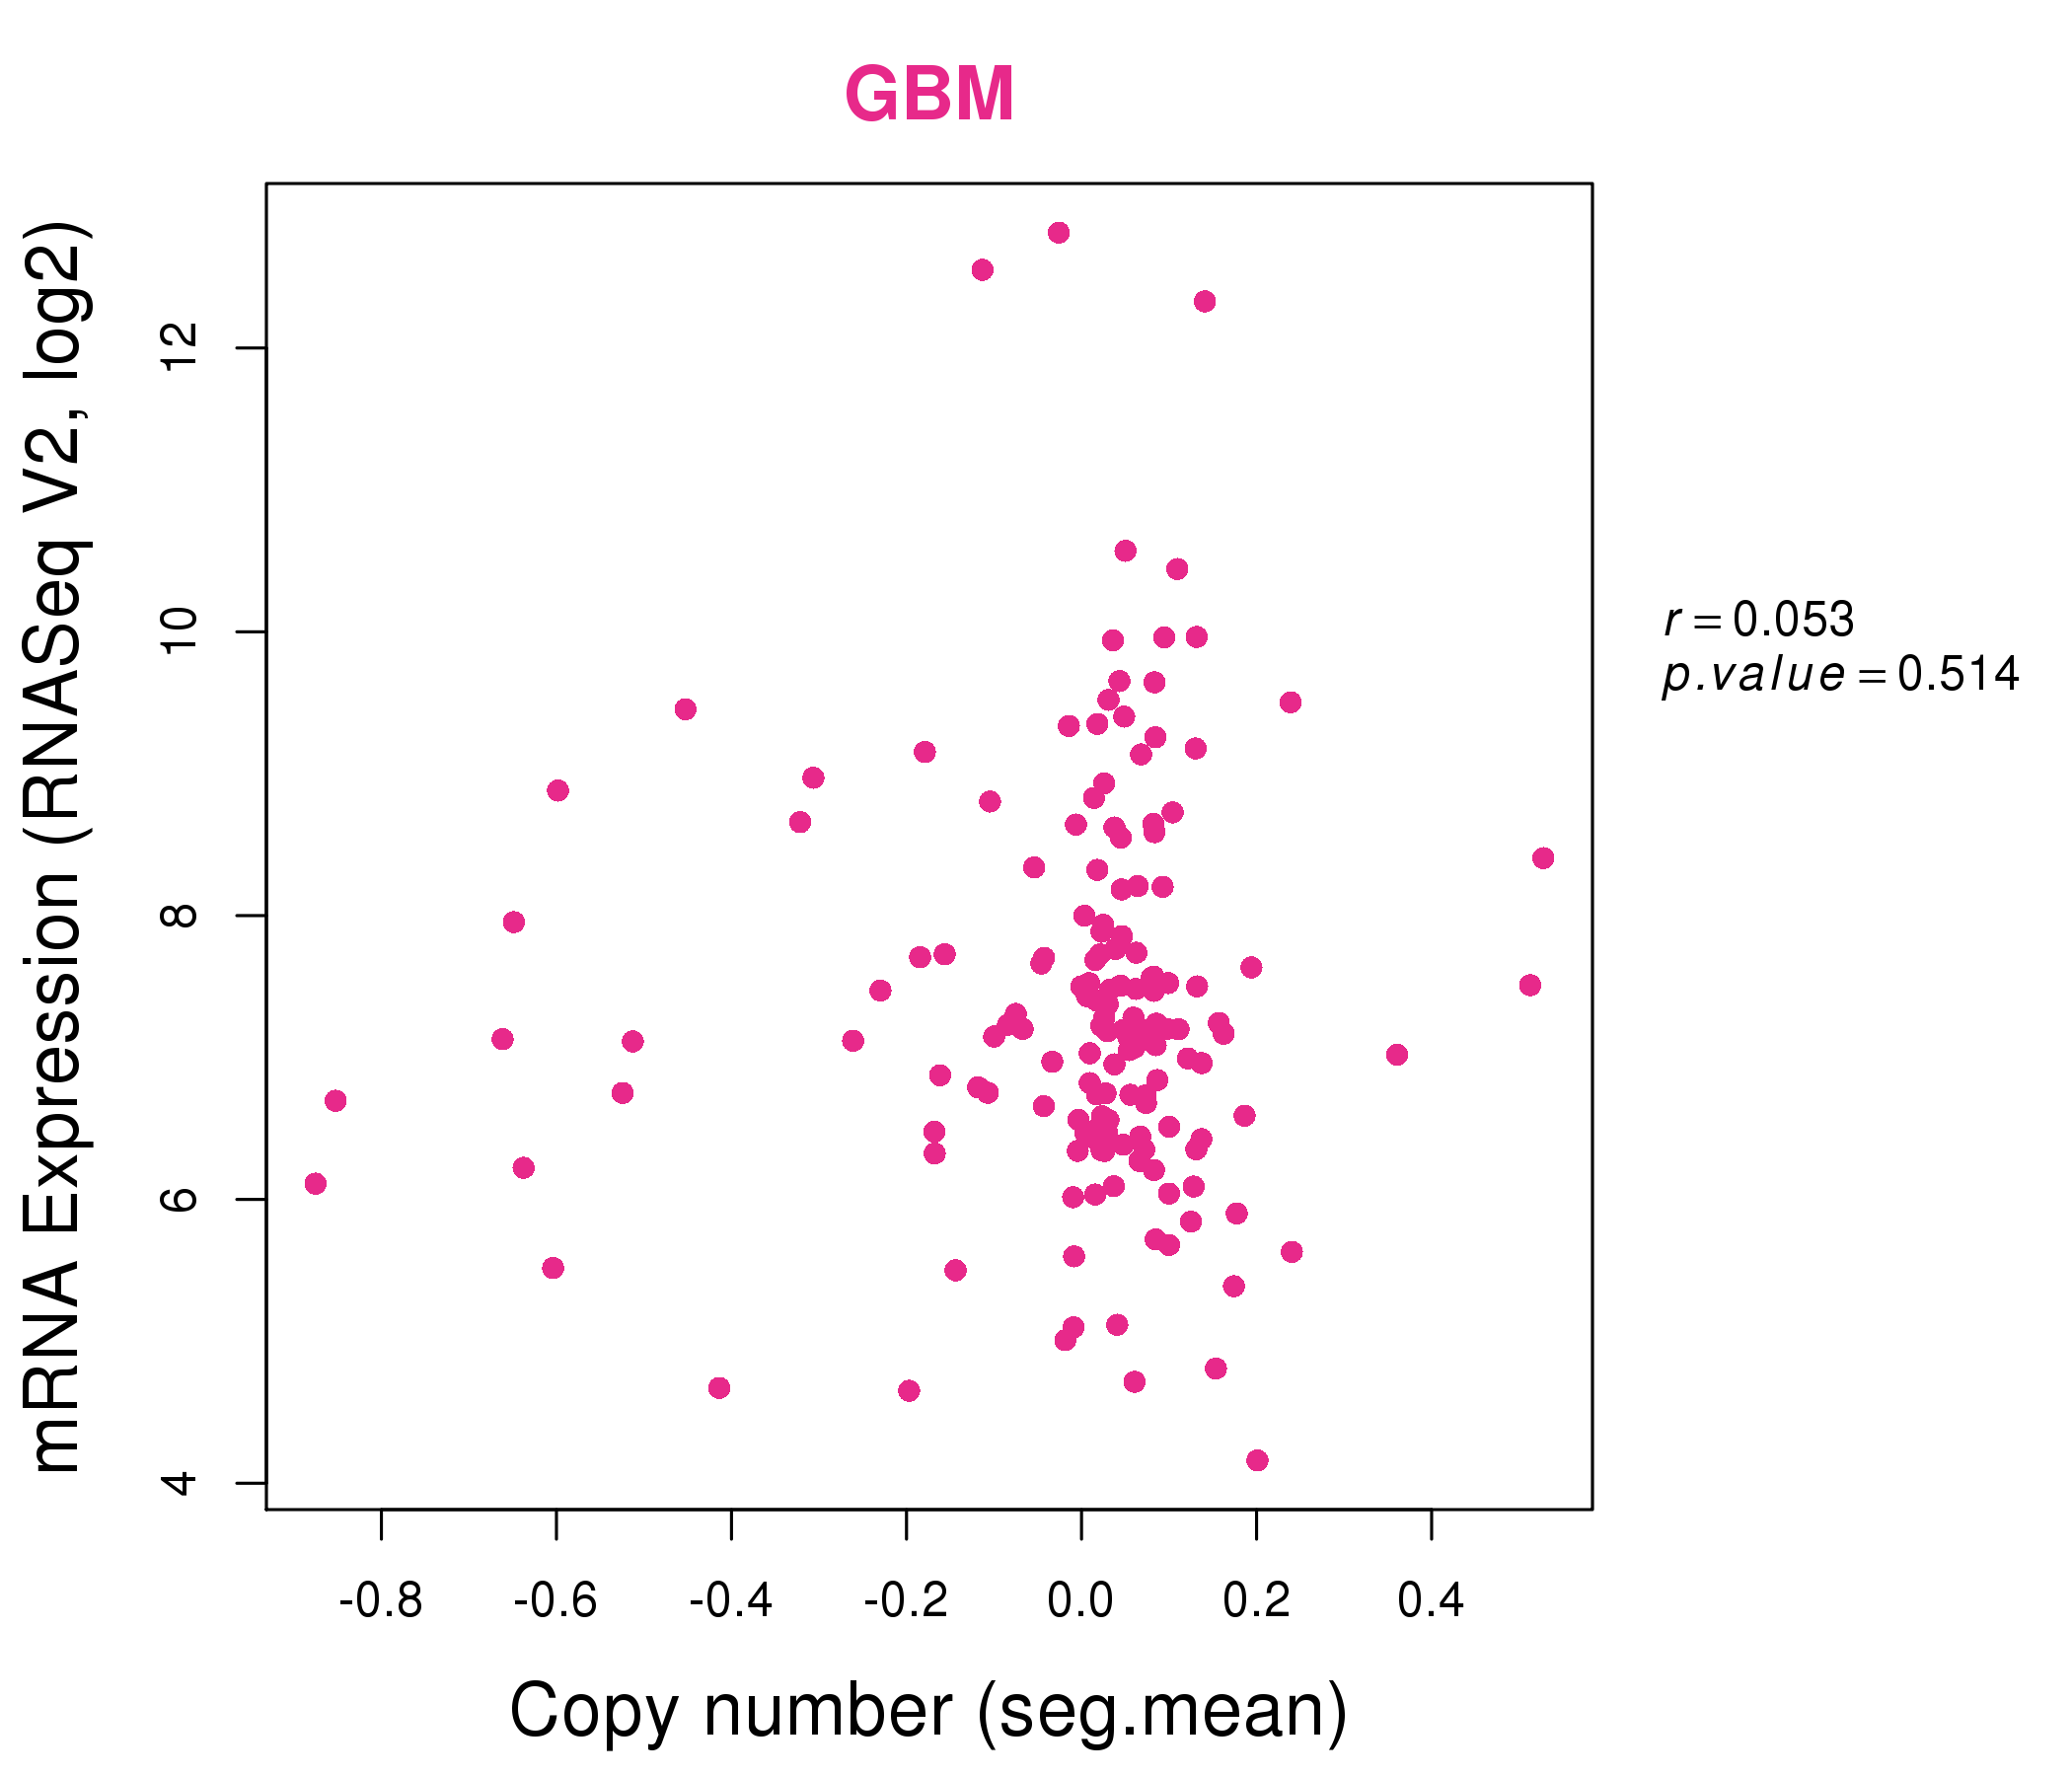
| * Copy number data were extracted from TCGA using R package TCGA-Assembler. The URLs of all public data files on TCGA DCC data server were gathered on Jan-05-2015. Function ProcessCNAData in TCGA-Assembler package was used to obtain gene-level copy number value which is calculated as the average copy number of the genomic region of a gene. |
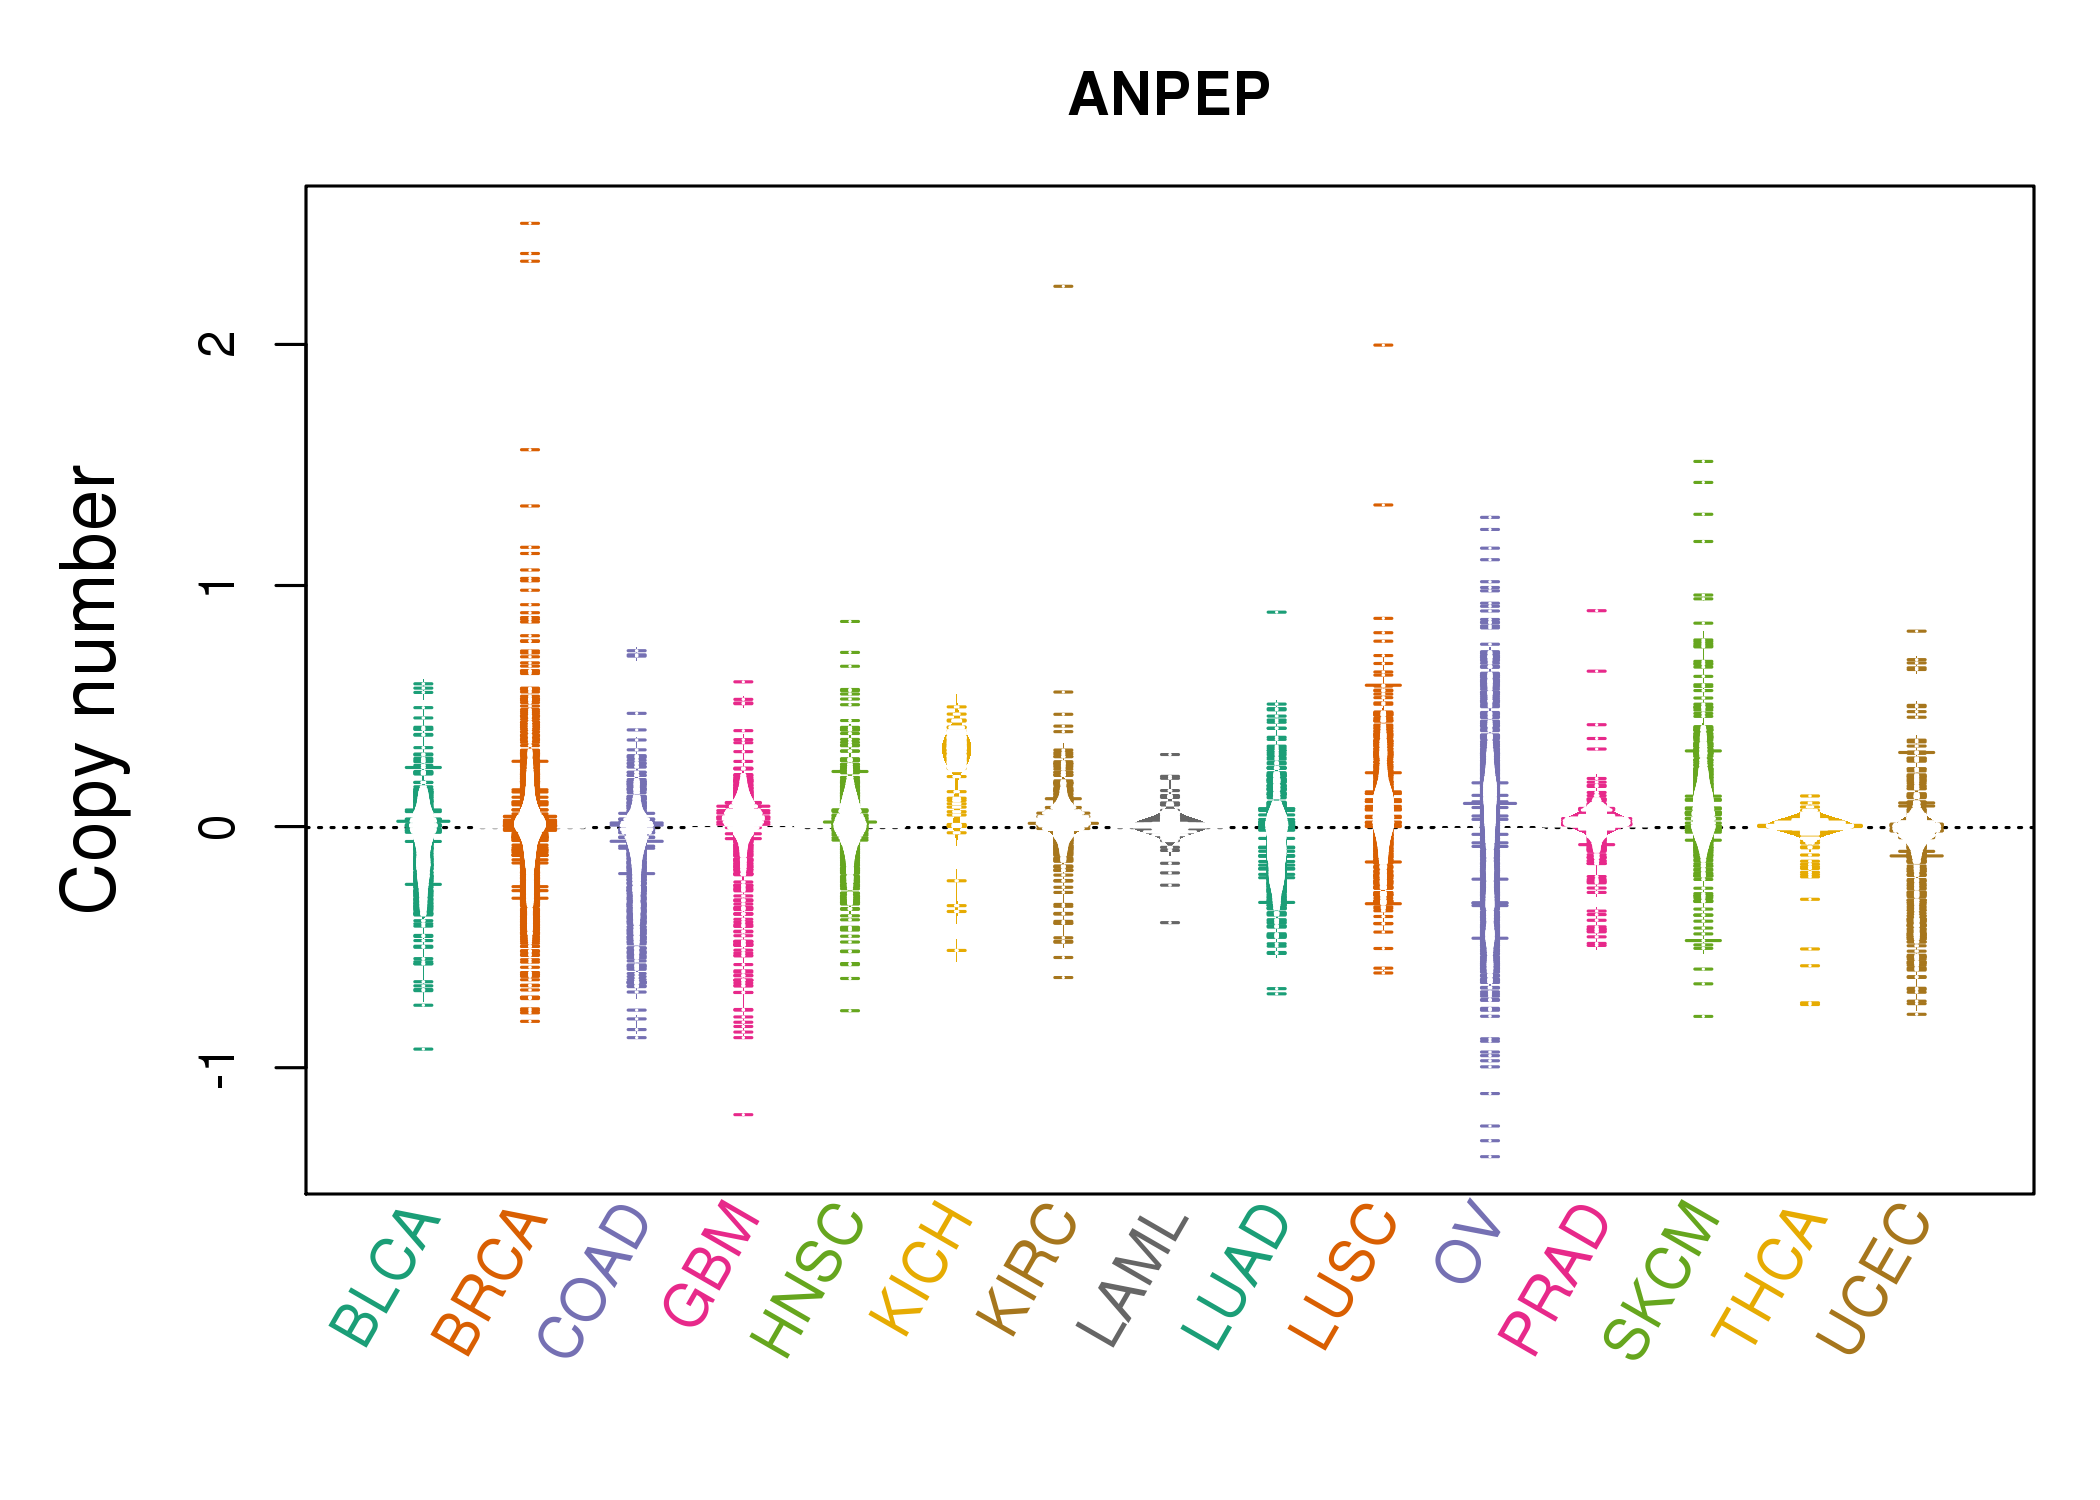 |
| cf) Tissue ID[Tissue type]: BLCA[Bladder Urothelial Carcinoma], BRCA[Breast invasive carcinoma], CESC[Cervical squamous cell carcinoma and endocervical adenocarcinoma], COAD[Colon adenocarcinoma], GBM[Glioblastoma multiforme], Glioma Low Grade, HNSC[Head and Neck squamous cell carcinoma], KICH[Kidney Chromophobe], KIRC[Kidney renal clear cell carcinoma], KIRP[Kidney renal papillary cell carcinoma], LAML[Acute Myeloid Leukemia], LUAD[Lung adenocarcinoma], LUSC[Lung squamous cell carcinoma], OV[Ovarian serous cystadenocarcinoma ], PAAD[Pancreatic adenocarcinoma], PRAD[Prostate adenocarcinoma], SKCM[Skin Cutaneous Melanoma], STAD[Stomach adenocarcinoma], THCA[Thyroid carcinoma], UCEC[Uterine Corpus Endometrial Carcinoma] |
| Top |
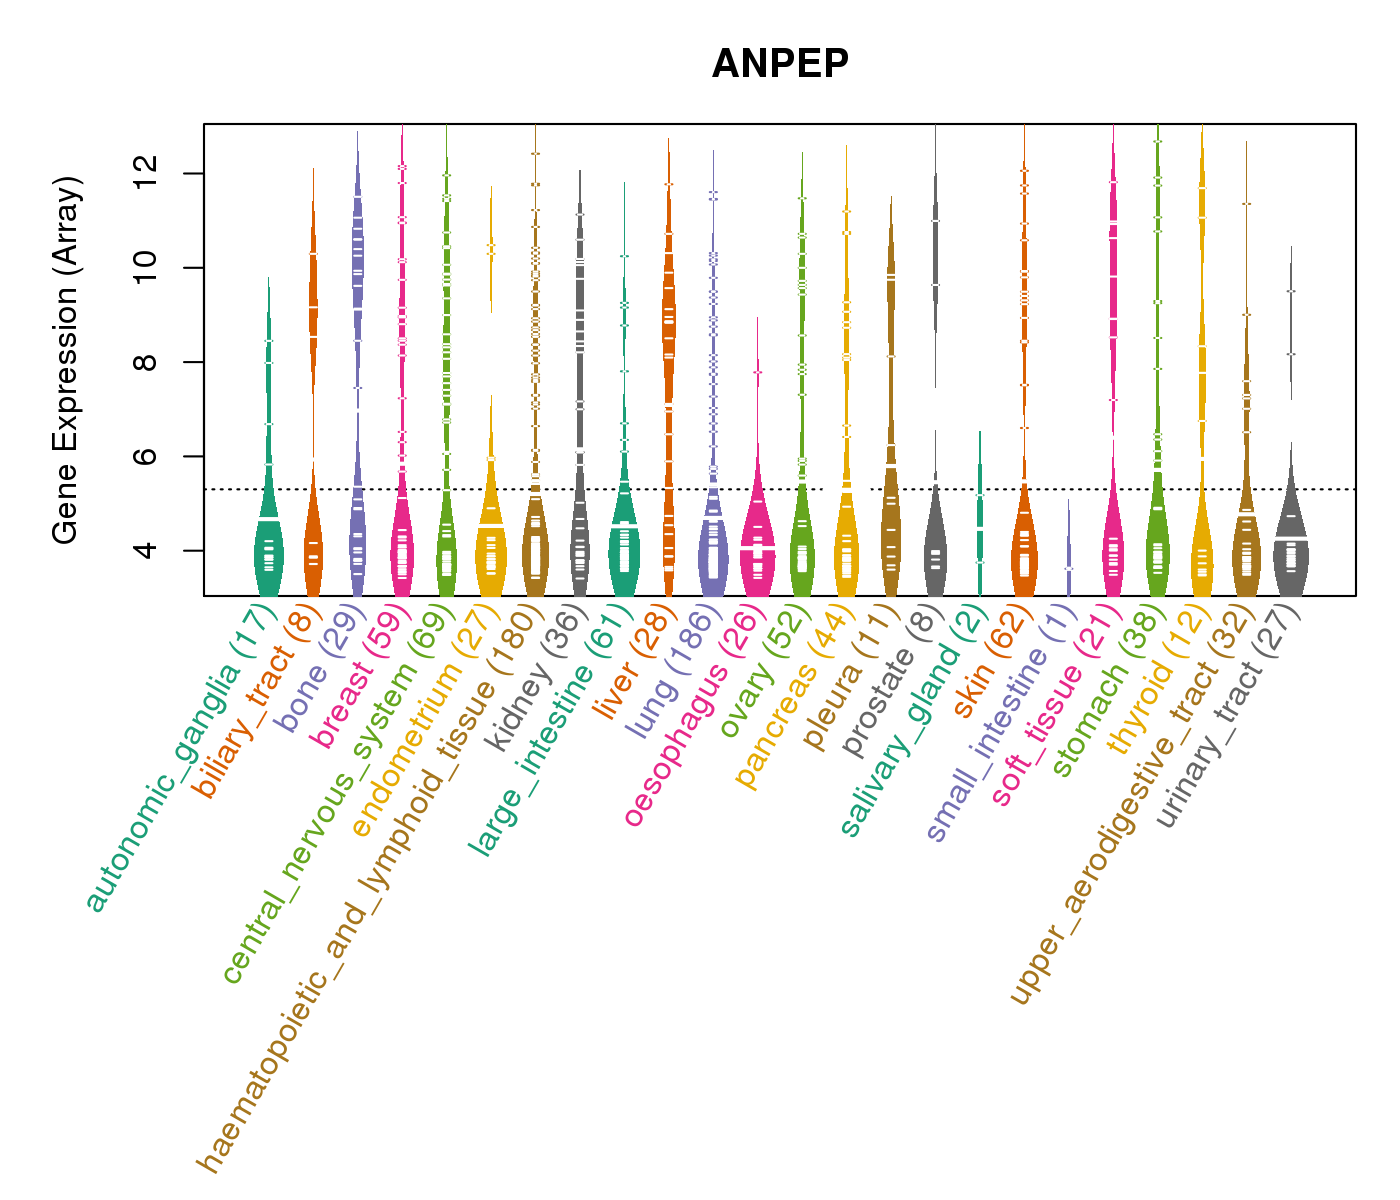
| Gene Expression for ANPEP |
| * CCLE gene expression data were extracted from CCLE_Expression_Entrez_2012-10-18.res: Gene-centric RMA-normalized mRNA expression data. |
 |
| * Normalized gene expression data of RNASeqV2 was extracted from TCGA using R package TCGA-Assembler. The URLs of all public data files on TCGA DCC data server were gathered at Jan-05-2015. Only eight cancer types have enough normal control samples for differential expression analysis. (t test, adjusted p<0.05 (using Benjamini-Hochberg FDR)) |
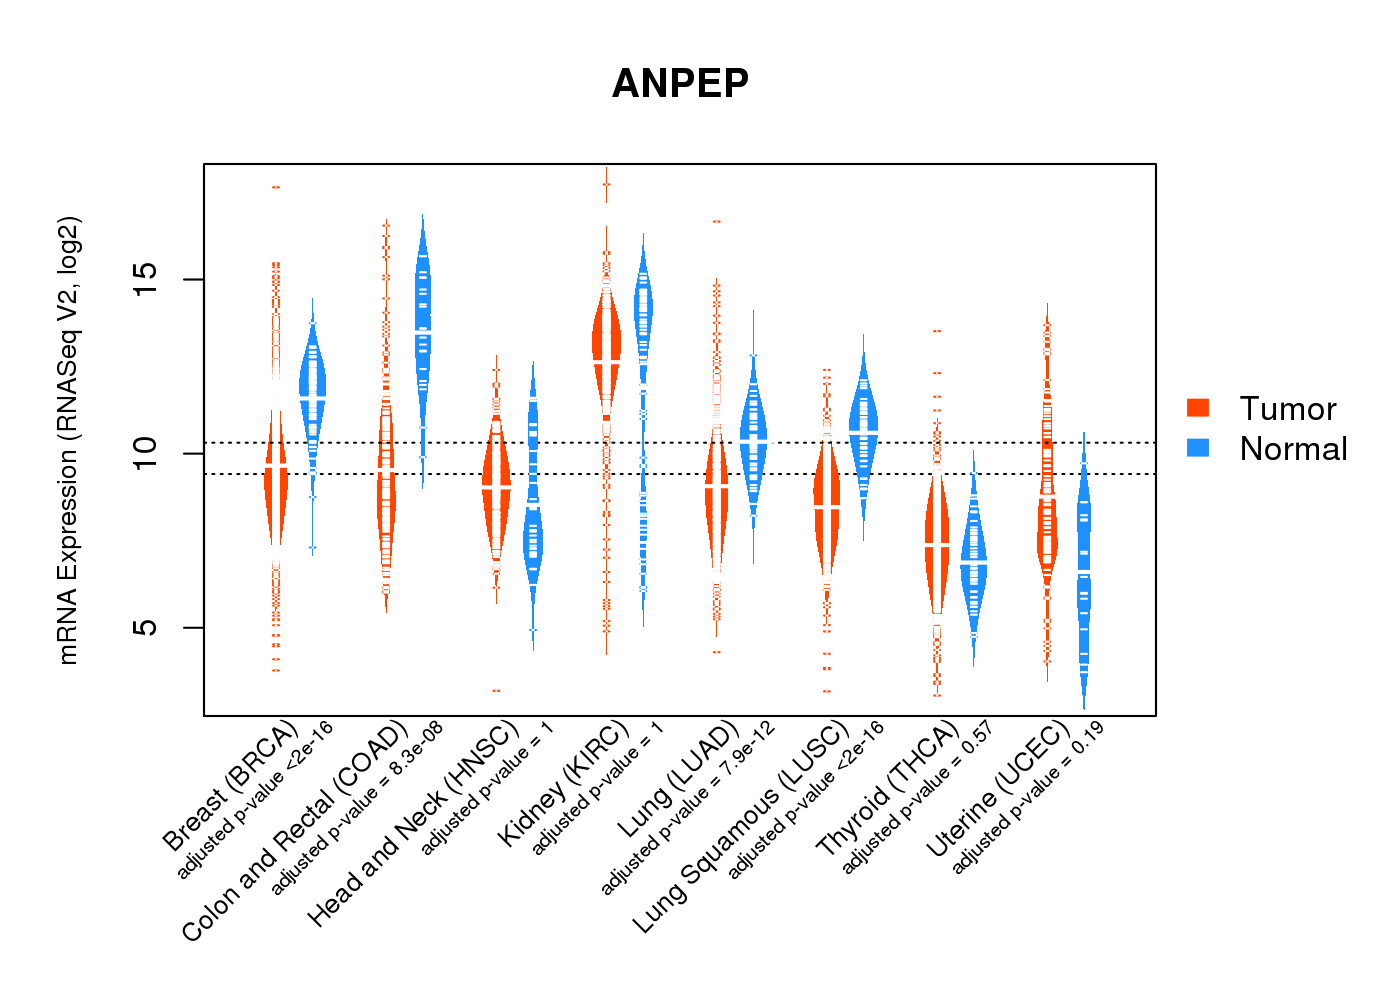 |
| Top |
| * This plots show the correlation between CNV and gene expression. |
: Open all plots for all cancer types
 |
|
 |
|
| Top |
| Gene-Gene Network Information |
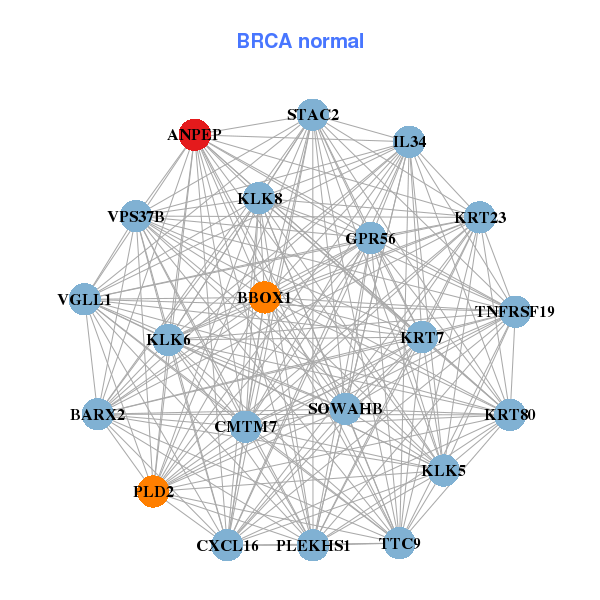
| * Co-Expression network figures were drawn using R package igraph. Only the top 20 genes with the highest correlations were shown. Red circle: input gene, orange circle: cell metabolism gene, sky circle: other gene |
: Open all plots for all cancer types
 |
| ||||
| ACOT11,ANKRD33,ANKRD55,ANPEP,ATP12A,CDR1,CNGA3, TXLNGY,EIF1AY,FAM41AY1,FOXI2,KDM5D,LDHAL6A,NCRNA00185, NETO2,PPARG,RAB40A,RGAG1,STC1,TTTY15,ZNF486 | SOWAHB,ANPEP,BARX2,BBOX1,PLEKHS1,CMTM7,CXCL16, GPR56,IL34,KLK5,KLK6,KLK8,KRT23,KRT7, KRT80,PLD2,STAC2,TNFRSF19,TTC9,VGLL1,VPS37B | ||||
 |
| ||||
| ABCG2,ACADS,ANPEP,B3GALT5,C11orf86,TMEM253,C1orf177, C1orf94,CAPN11,CYP3A4,HSD17B2,MARVELD3,NAT8,LINC00114, SULT1C2,TM4SF20,TM4SF4,TMEM92,TUBAL3,UGT1A4,UGT1A5 | ABHD6,ACE2,ANPEP,CHN2,FLVCR1,GBA3,SLC52A1, HEBP1,MEP1B,MYO1A,NAT8B,OIT3,OTC,PCK2, PKLR,PRAP1,PTGR1,SLC23A1,SLC6A4,TM4SF20,AGMO |
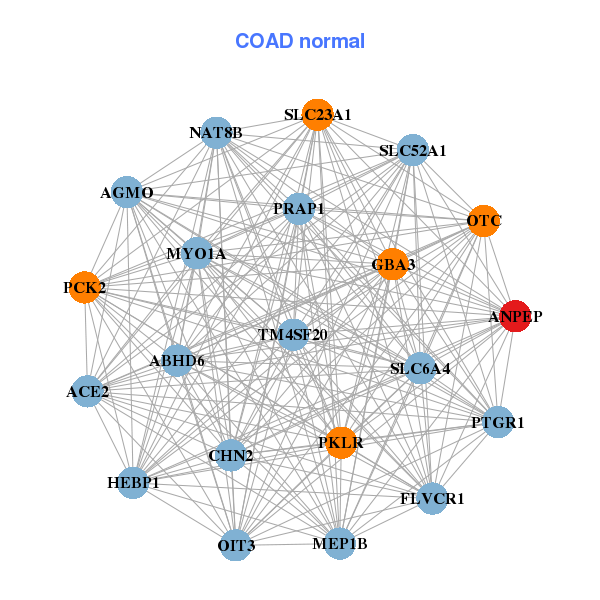
| * Co-Expression network figures were drawn using R package igraph. Only the top 20 genes with the highest correlations were shown. Red circle: input gene, orange circle: cell metabolism gene, sky circle: other gene |
: Open all plots for all cancer types
| Top |
: Open all interacting genes' information including KEGG pathway for all interacting genes from DAVID
| Top |
| Pharmacological Information for ANPEP |
| DB Category | DB Name | DB's ID and Url link |
| * Gene Centered Interaction Network. |
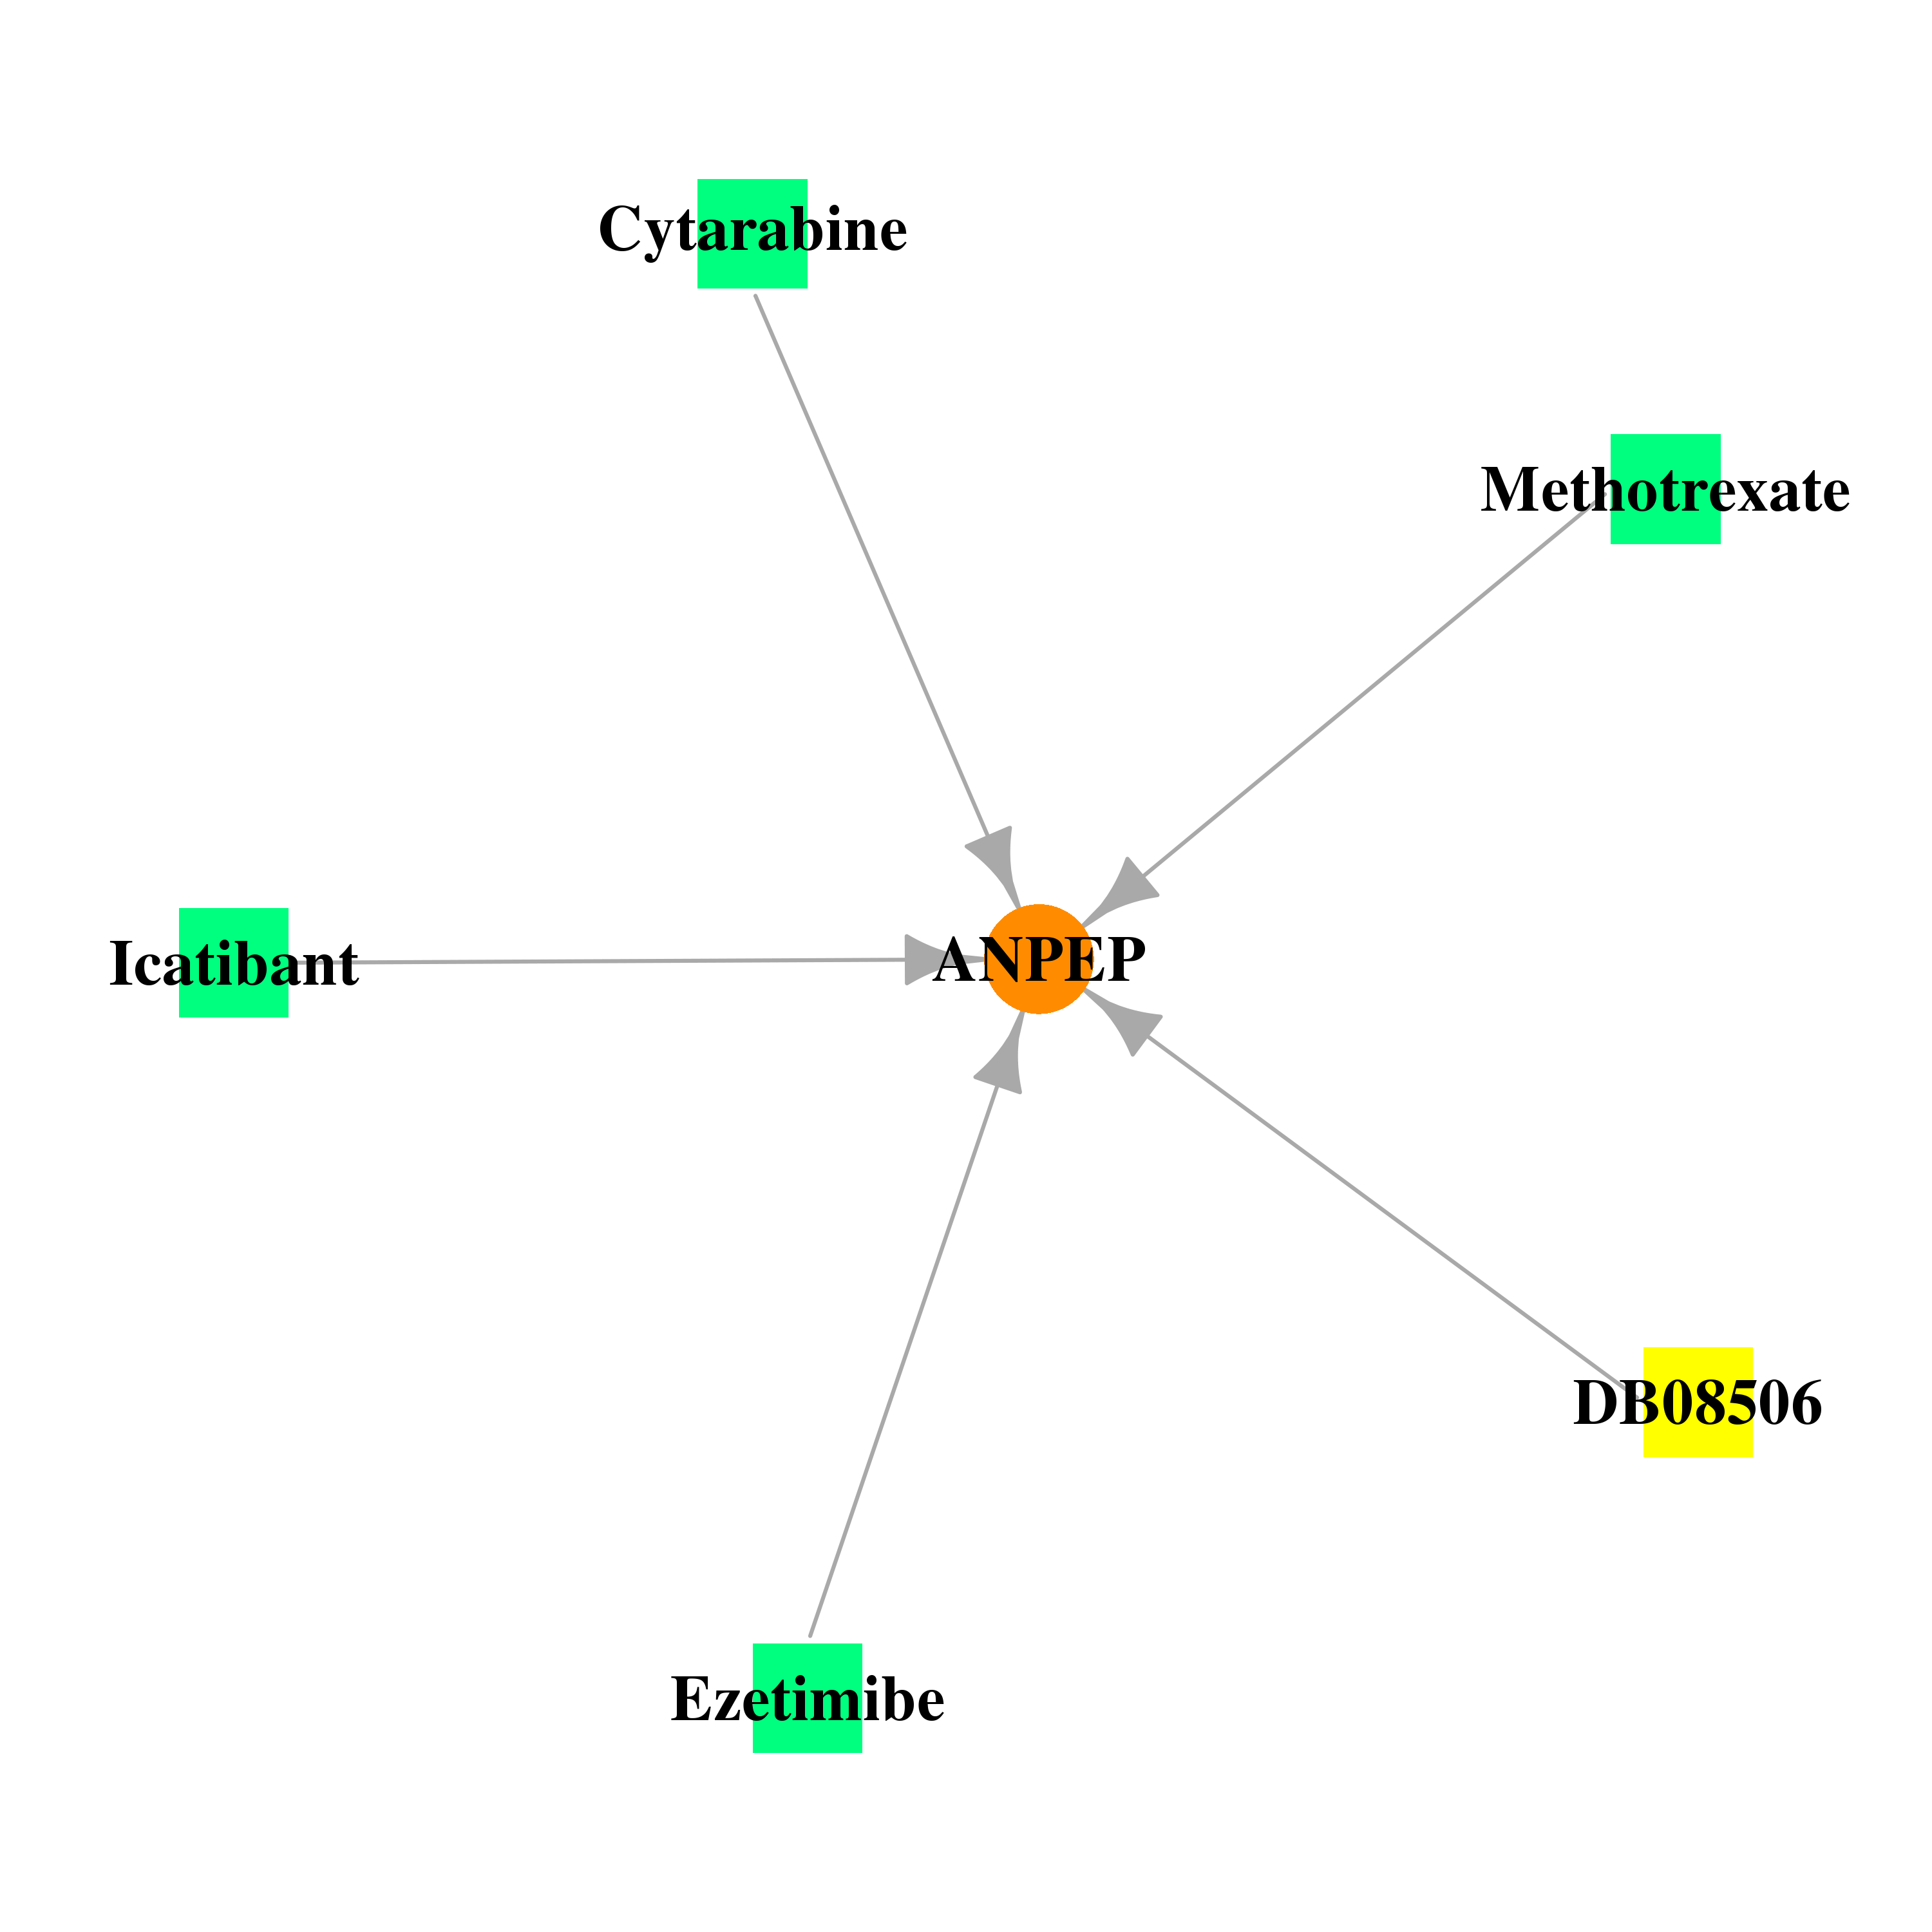 |
| * Drug Centered Interaction Network. |
| DrugBank ID | Target Name | Drug Groups | Generic Name | Drug Centered Network | Drug Structure |
| DB00973 | alanyl (membrane) aminopeptidase | approved | Ezetimibe | 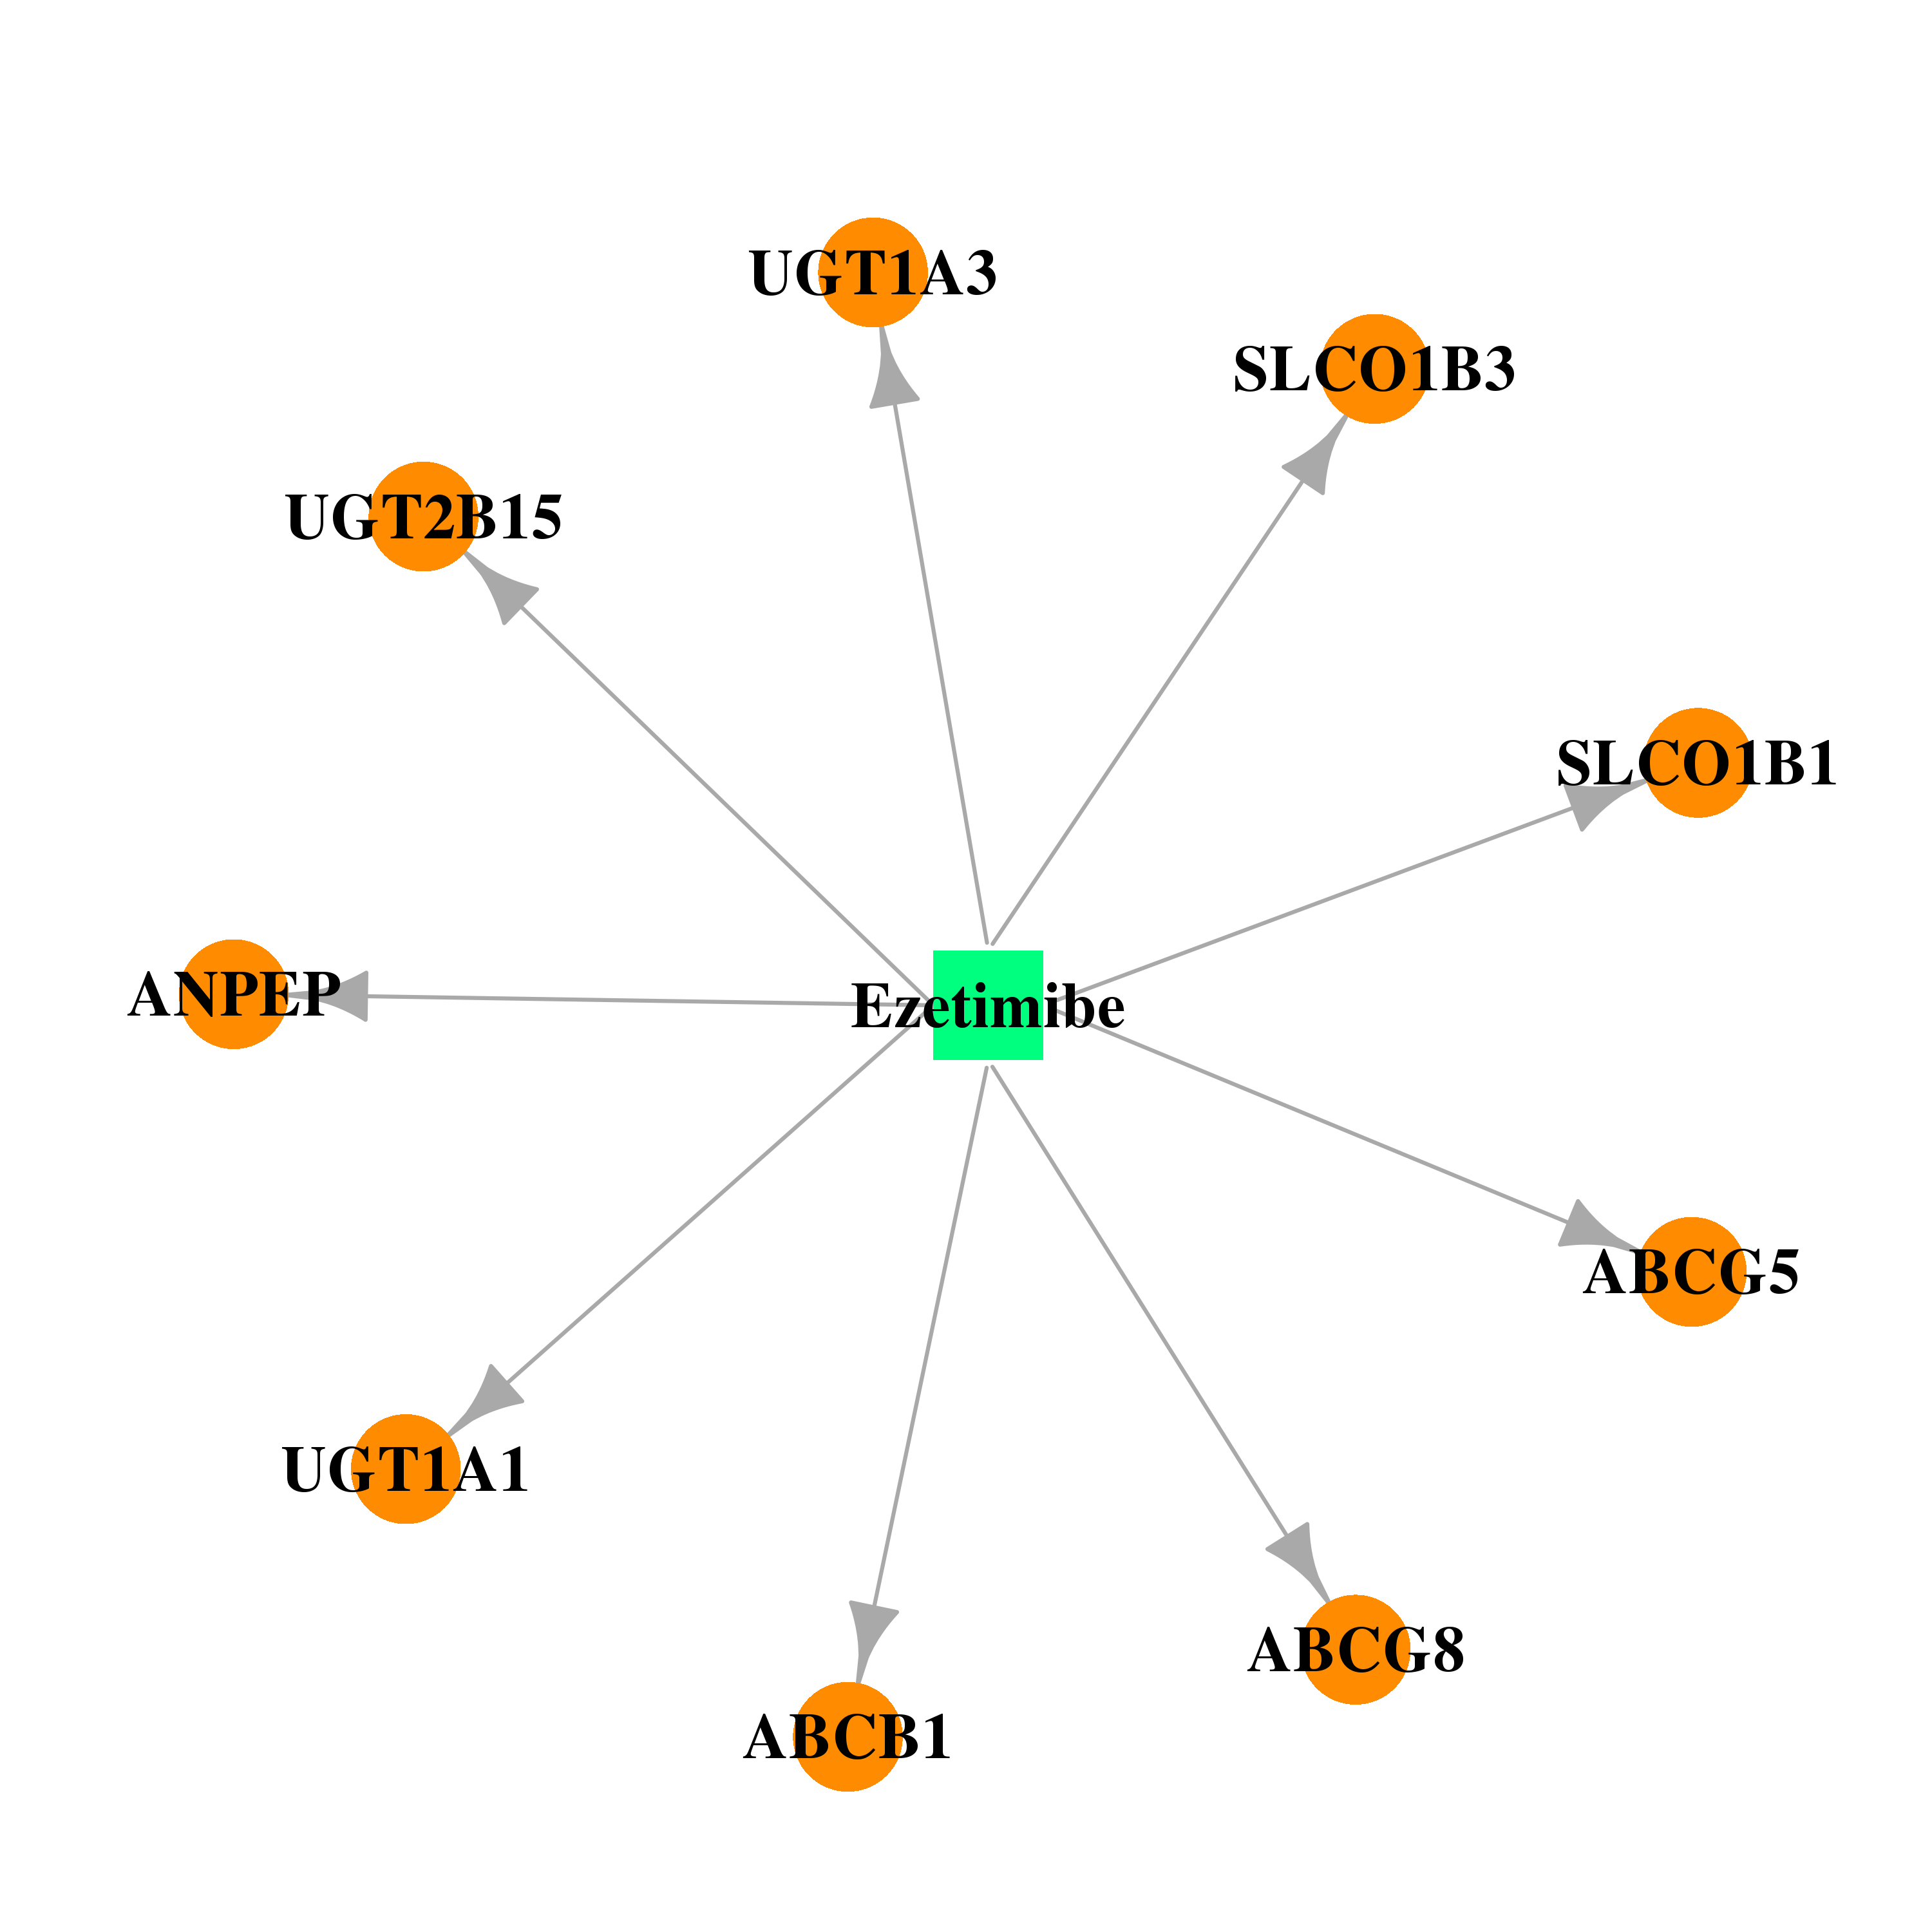 | 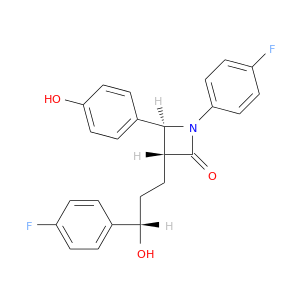 |
| DB06196 | alanyl (membrane) aminopeptidase | approved; investigational | Icatibant |  | 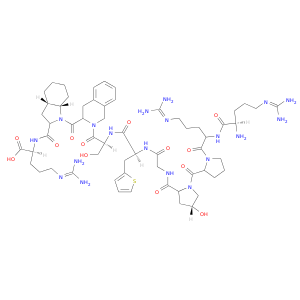 |
| DB08506 | alanyl (membrane) aminopeptidase | experimental | N-{(2S)-3-[(1R)-1-aminoethyl](hydroxy)phosphoryl-2-benzylpropanoyl}-L-phenylalanine | 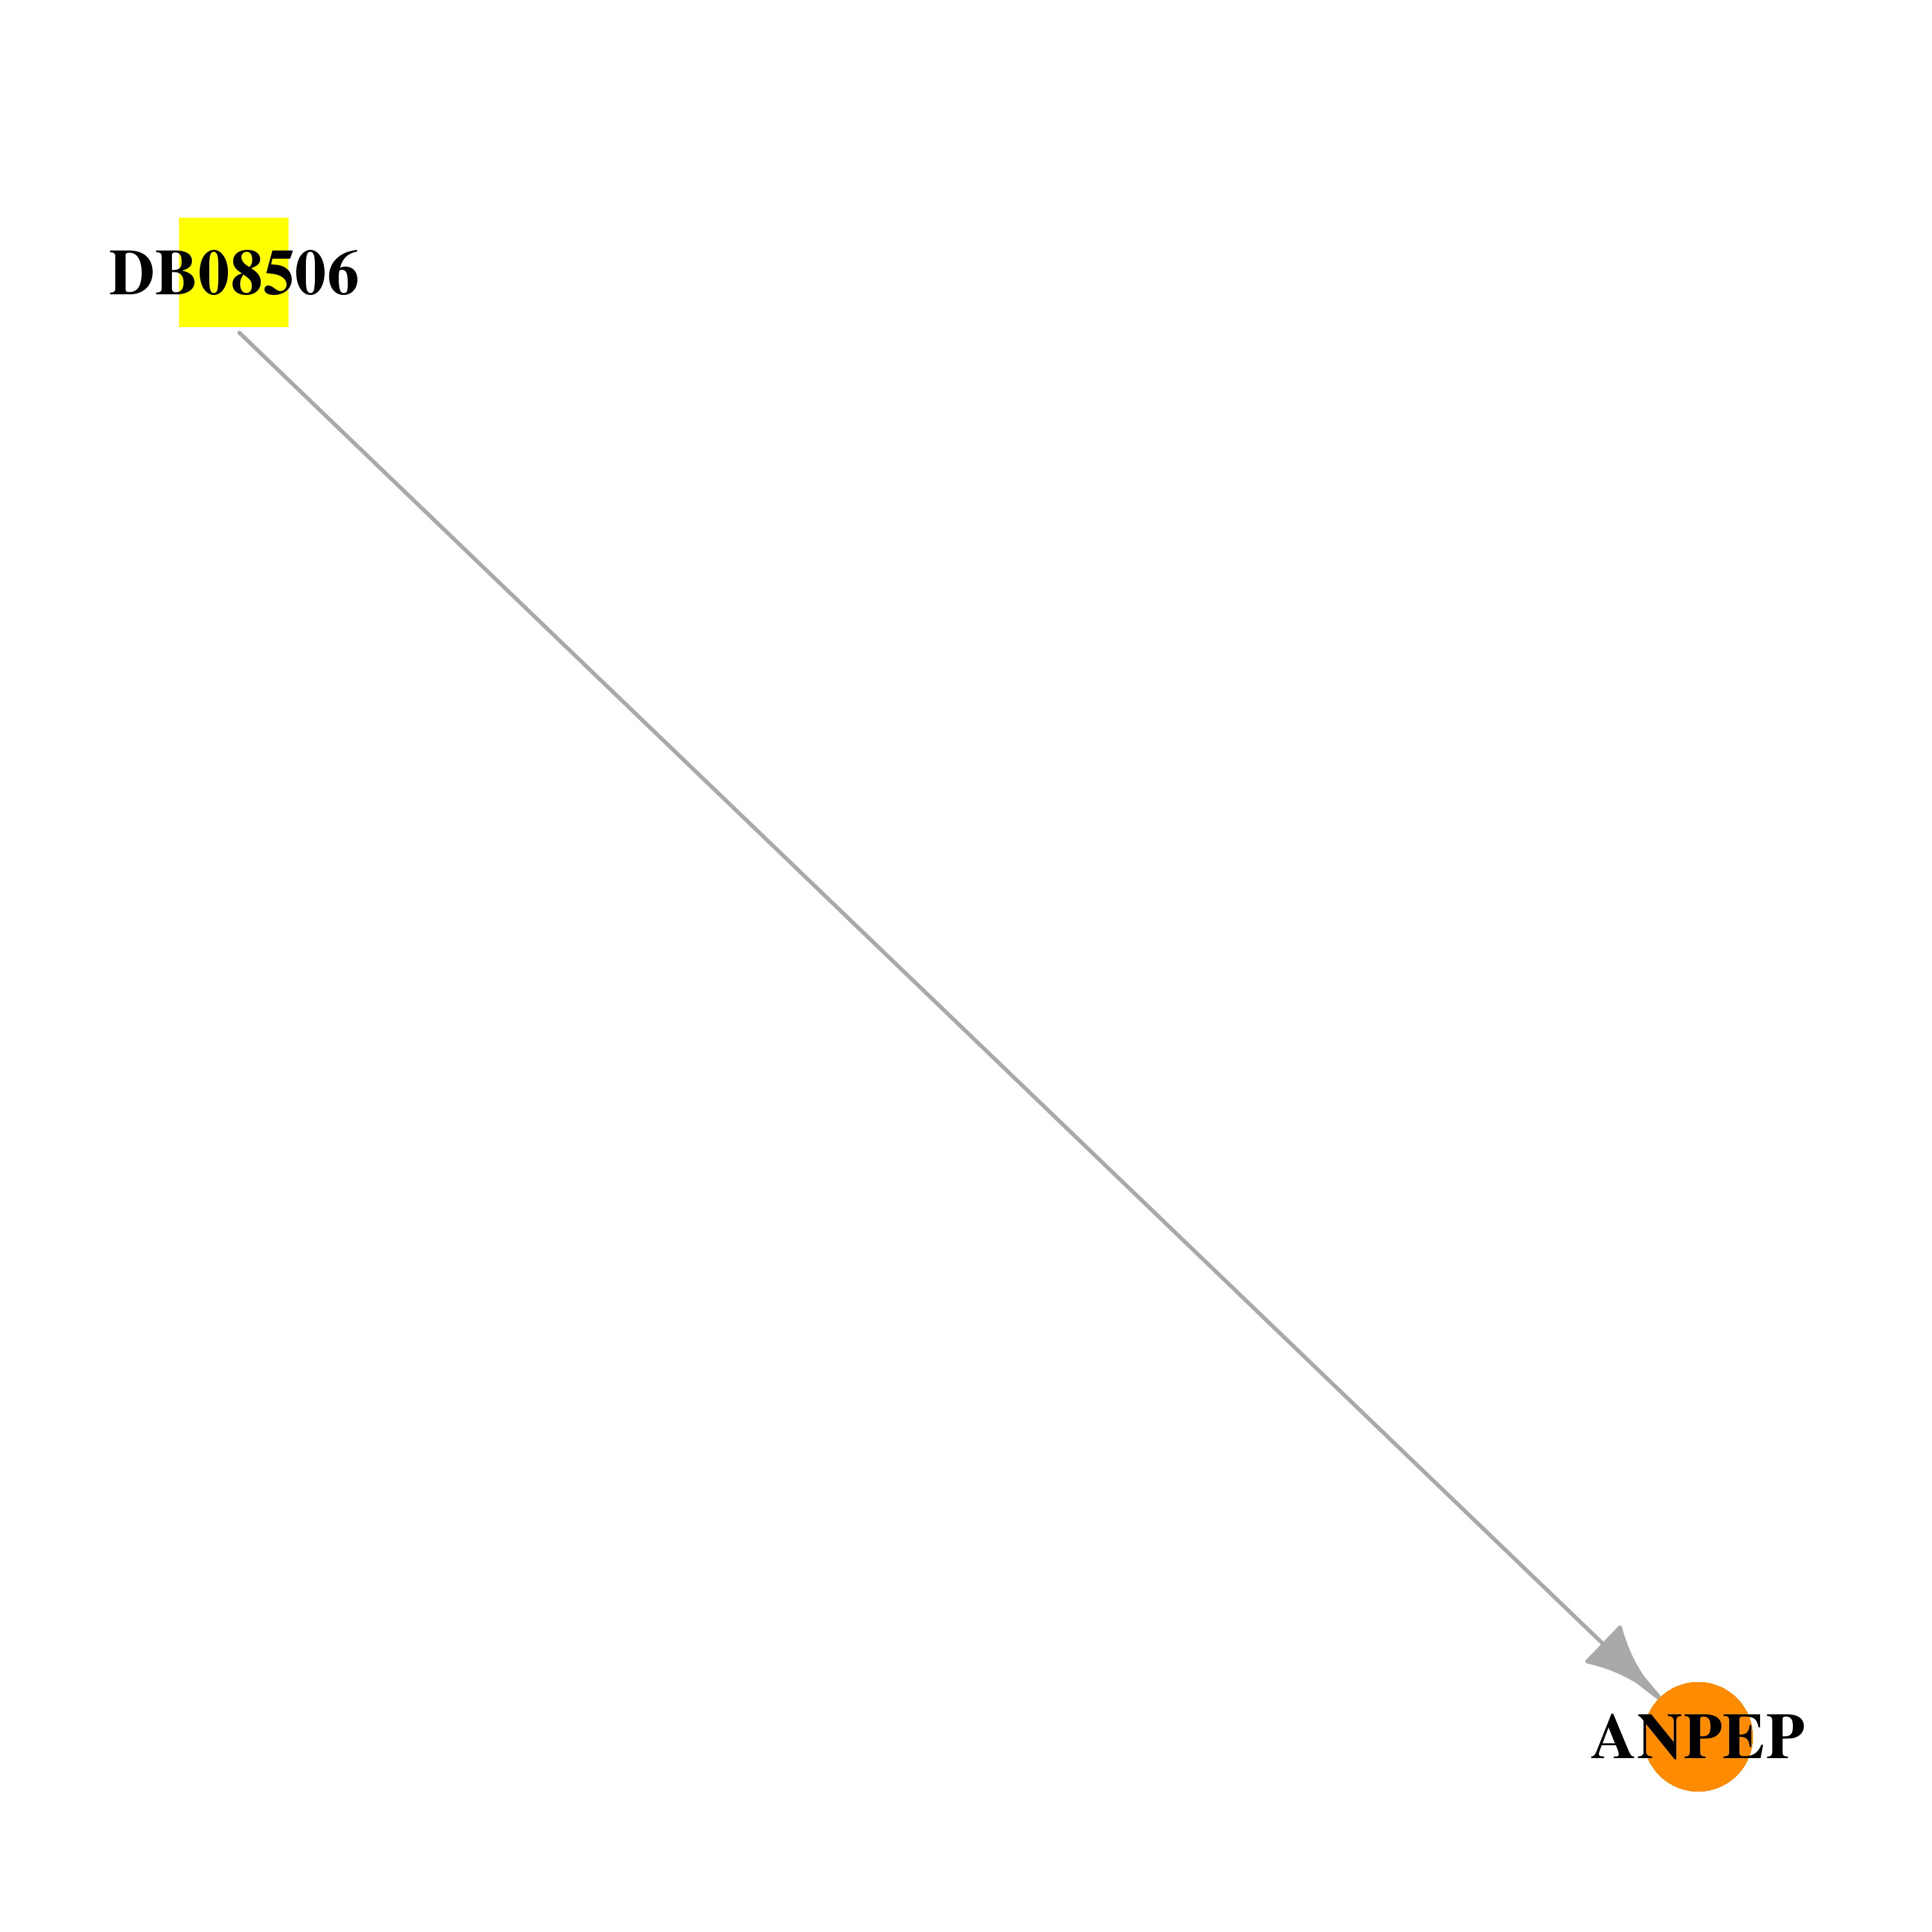 | 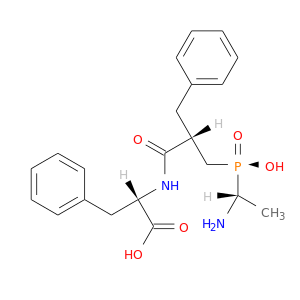 |
| DB00563 | alanyl (membrane) aminopeptidase | approved | Methotrexate |  |  |
| DB00987 | alanyl (membrane) aminopeptidase | approved; investigational | Cytarabine | 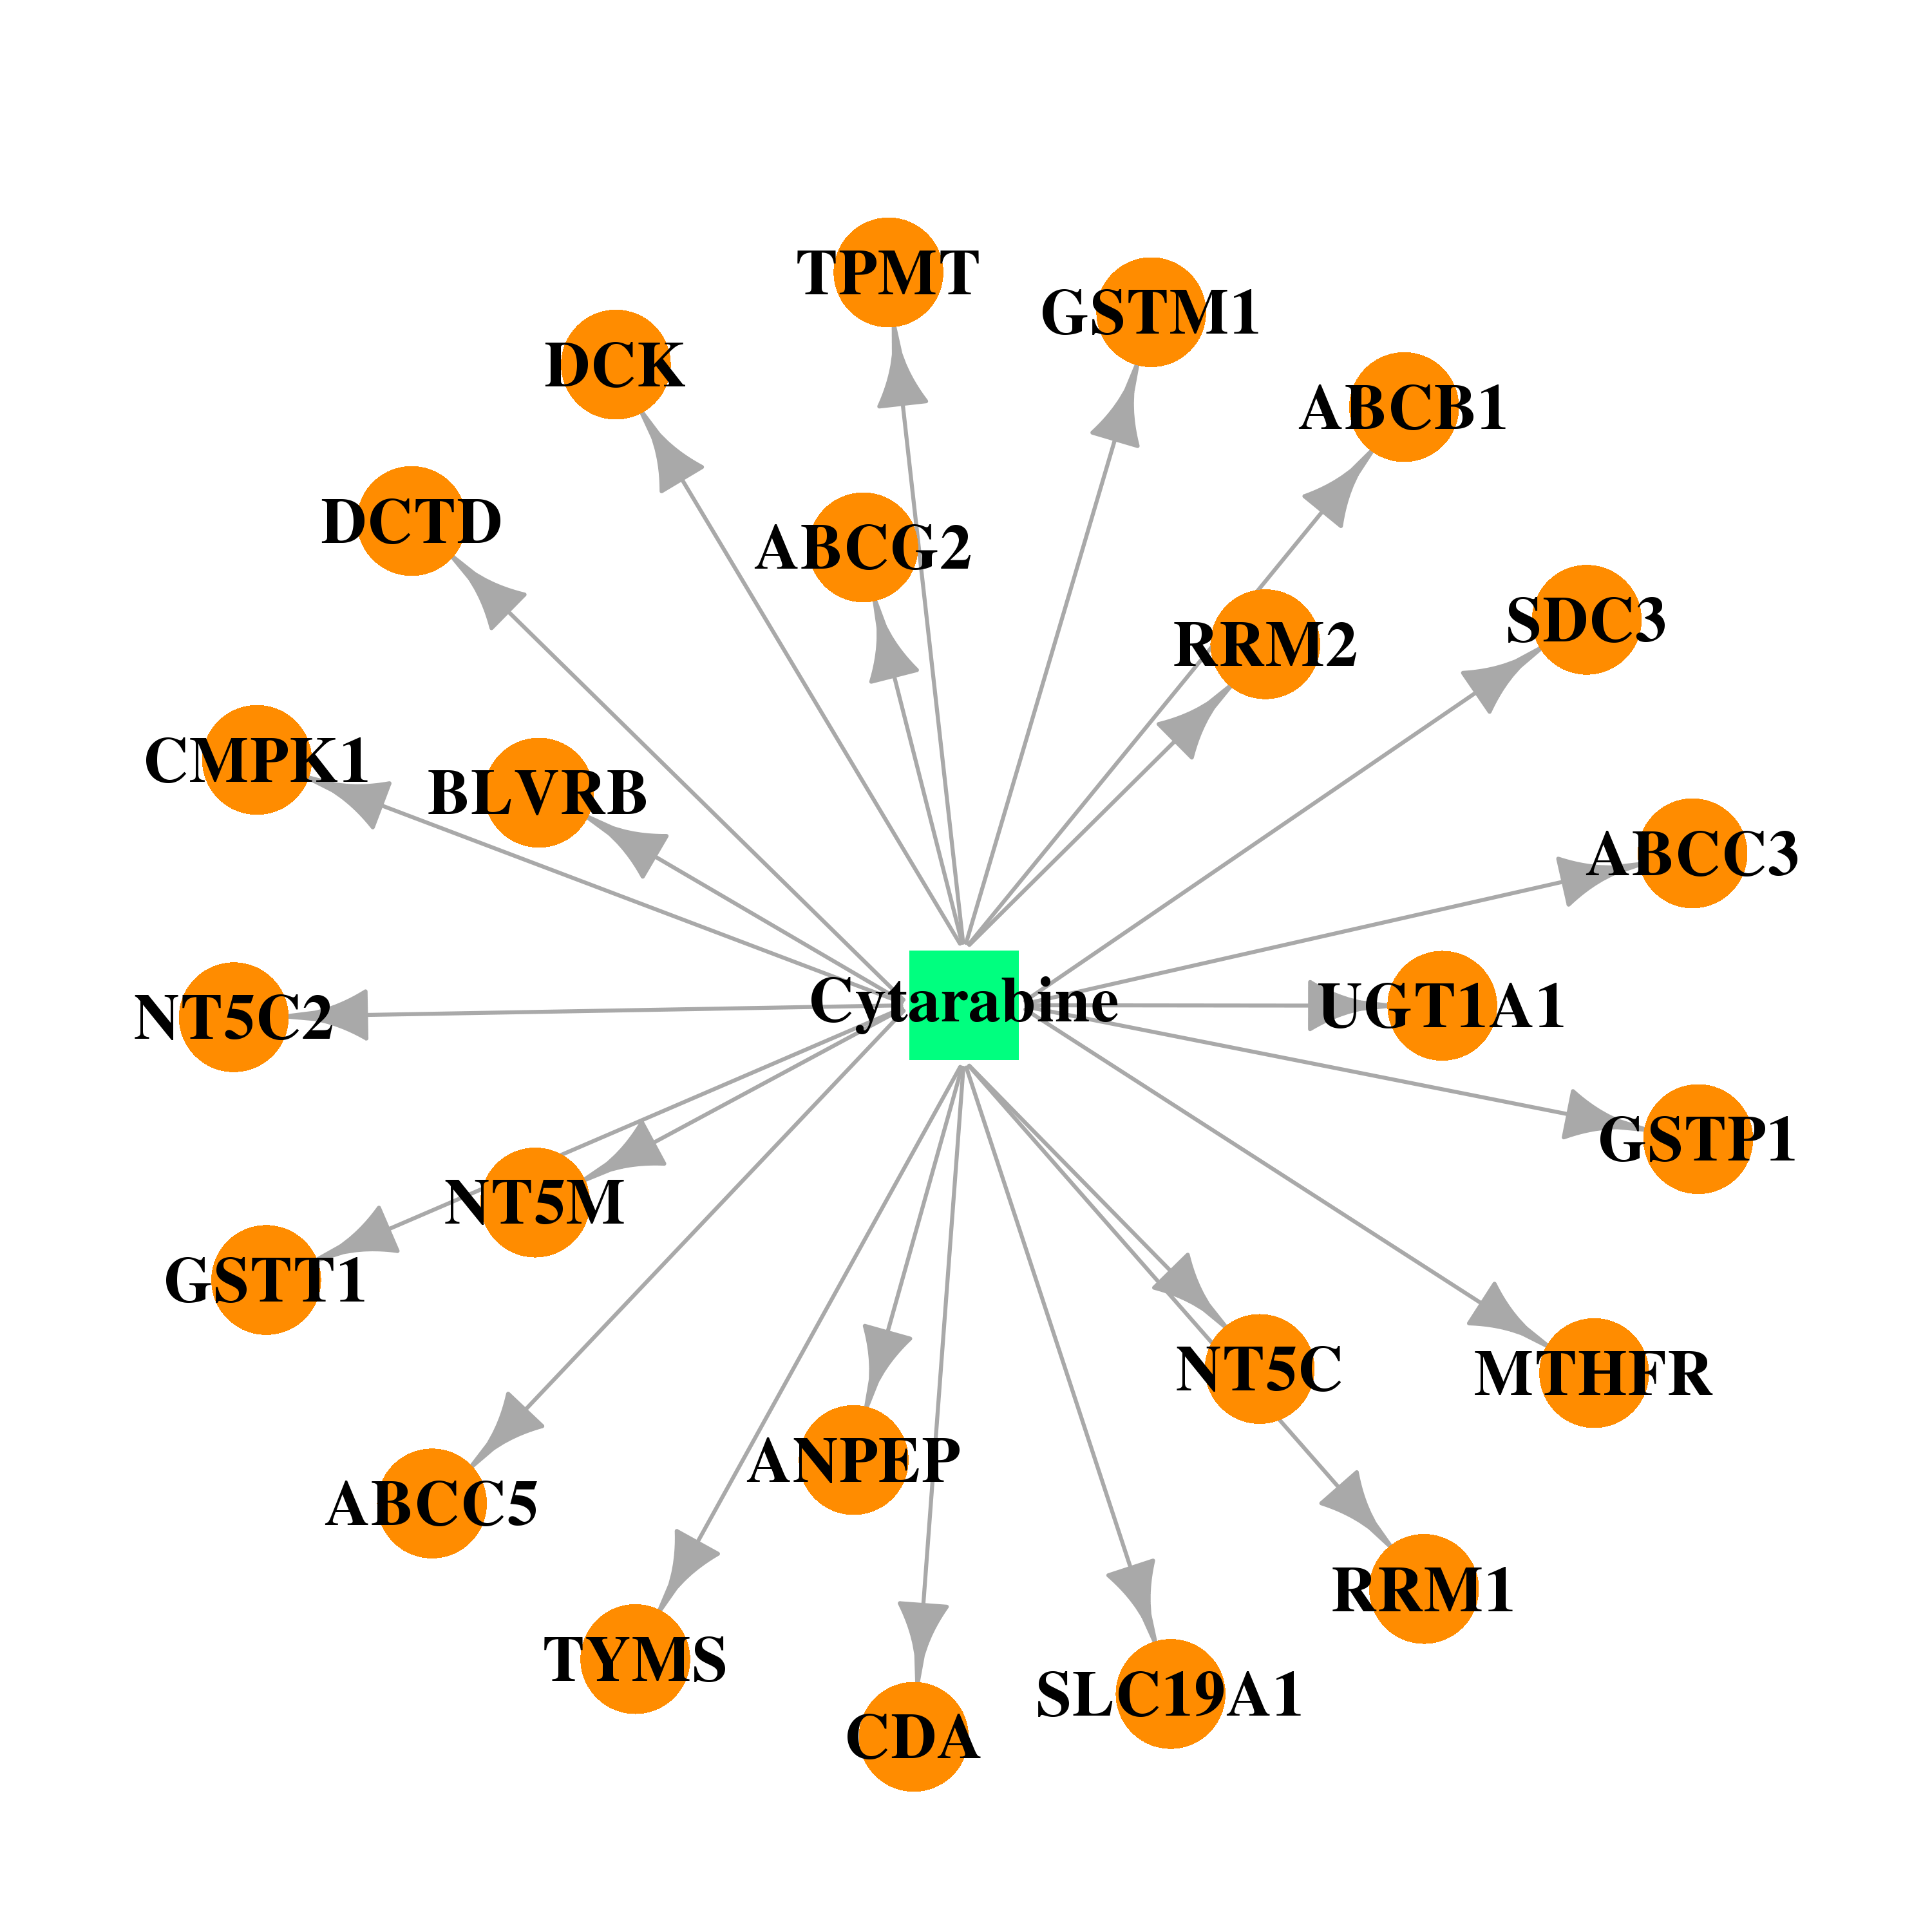 |  |
| Top |
| Cross referenced IDs for ANPEP |
| * We obtained these cross-references from Uniprot database. It covers 150 different DBs, 18 categories. http://www.uniprot.org/help/cross_references_section |
: Open all cross reference information
|
Copyright © 2016-Present - The Univsersity of Texas Health Science Center at Houston @ |