|
|||||||||||||||||||||||||||||||||||||||||||||||||||||||||||||||||||||||||||||||||||||||||||||||||||||||||||||||||||||||||||||||||||||||||||||||||||||||||||||||||||||||||||||||||||||||||||||||||||||||||||||||||||||||||||||||||||||||||||||||||||||||||||||||||||||||||||||||||||||||||||||||||||||||||||||||||||||||||||||||||||||||||||||||||||||||||||||||||||||||||||
| |
| Phenotypic Information (metabolism pathway, cancer, disease, phenome) |
| |
| |
| Gene-Gene Network Information: Co-Expression Network, Interacting Genes & KEGG |
| |
|


| Gene Summary for SLC25A4 |
| Basic gene info. | Gene symbol | SLC25A4 |
| Gene name | solute carrier family 25 (mitochondrial carrier; adenine nucleotide translocator), member 4 | |
| Synonyms | 1|AAC1|ANT|ANT 1|ANT1|MTDPS12|PEO2|PEO3|T1 | |
| Cytomap | UCSC genome browser: 4q35 | |
| Genomic location | chr4 :186064416-186071538 | |
| Type of gene | protein-coding | |
| RefGenes | NM_001151.3, | |
| Ensembl id | ENSG00000151729 | |
| Description | ADP,ATP carrier protein 1ADP,ATP carrier protein, heart/skeletal muscleADP/ATP translocase 1adenine nucleotide translocator 1 (skeletal muscle)heart/skeletal muscle ATP/ADP translocatorsolute carrier family 25 member 4 | |
| Modification date | 20141207 | |
| dbXrefs | MIM : 103220 | |
| HGNC : HGNC | ||
| Ensembl : ENSG00000151729 | ||
| HPRD : 00058 | ||
| Vega : OTTHUMG00000134299 | ||
| Protein | UniProt: go to UniProt's Cross Reference DB Table | |
| Expression | CleanEX: HS_SLC25A4 | |
| BioGPS: 291 | ||
| Gene Expression Atlas: ENSG00000151729 | ||
| The Human Protein Atlas: ENSG00000151729 | ||
| Pathway | NCI Pathway Interaction Database: SLC25A4 | |
| KEGG: SLC25A4 | ||
| REACTOME: SLC25A4 | ||
| ConsensusPathDB | ||
| Pathway Commons: SLC25A4 | ||
| Metabolism | MetaCyc: SLC25A4 | |
| HUMANCyc: SLC25A4 | ||
| Regulation | Ensembl's Regulation: ENSG00000151729 | |
| miRBase: chr4 :186,064,416-186,071,538 | ||
| TargetScan: NM_001151 | ||
| cisRED: ENSG00000151729 | ||
| Context | iHOP: SLC25A4 | |
| cancer metabolism search in PubMed: SLC25A4 | ||
| UCL Cancer Institute: SLC25A4 | ||
| Assigned class in ccmGDB | C | |
| Top |
| Phenotypic Information for SLC25A4(metabolism pathway, cancer, disease, phenome) |
| Cancer | CGAP: SLC25A4 |
| Familial Cancer Database: SLC25A4 | |
| * This gene is included in those cancer gene databases. |
|
|
|
|
|
|
| |||||||||||||||||||||||||||||||||||||||||||||||||||||||||||||||||||||||||||||||||||||||||||||||||||||||||||||||||||||||||||||||||||||||||||||||||||||||||||||||||||||||||||||||||||||||||||||||||||||||||||||||||||||||||||||||||||||||||||||||||||||||||||||||||||||||||||||||||||||||||||||||||||||||||||||||||||||||||||||||||||||||||||||||||||||||||||||||||||||
Oncogene 1 | Significant driver gene in | ||||||||||||||||||||||||||||||||||||||||||||||||||||||||||||||||||||||||||||||||||||||||||||||||||||||||||||||||||||||||||||||||||||||||||||||||||||||||||||||||||||||||||||||||||||||||||||||||||||||||||||||||||||||||||||||||||||||||||||||||||||||||||||||||||||||||||||||||||||||||||||||||||||||||||||||||||||||||||||||||||||||||||||||||||||||||||||||||||||||||||
| cf) number; DB name 1 Oncogene; http://nar.oxfordjournals.org/content/35/suppl_1/D721.long, 2 Tumor Suppressor gene; https://bioinfo.uth.edu/TSGene/, 3 Cancer Gene Census; http://www.nature.com/nrc/journal/v4/n3/abs/nrc1299.html, 4 CancerGenes; http://nar.oxfordjournals.org/content/35/suppl_1/D721.long, 5 Network of Cancer Gene; http://ncg.kcl.ac.uk/index.php, 1Therapeutic Vulnerabilities in Cancer; http://cbio.mskcc.org/cancergenomics/statius/ |
| REACTOME_INTEGRATION_OF_ENERGY_METABOLISM REACTOME_METABOLISM_OF_PROTEINS | |
| Mutations for SLC25A4 |
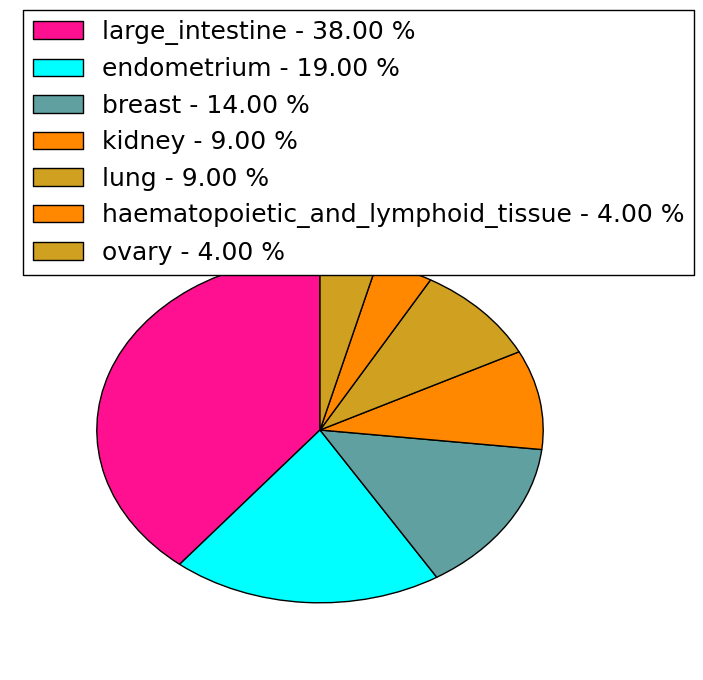
| * Under tables are showing count per each tissue to give us broad intuition about tissue specific mutation patterns.You can go to the detailed page for each mutation database's web site. |
| There's no structural variation information in COSMIC data for this gene. |
| * From mRNA Sanger sequences, Chitars2.0 arranged chimeric transcripts. This table shows SLC25A4 related fusion information. |
| ID | Head Gene | Tail Gene | Accession | Gene_a | qStart_a | qEnd_a | Chromosome_a | tStart_a | tEnd_a | Gene_a | qStart_a | qEnd_a | Chromosome_a | tStart_a | tEnd_a |
| N45527 | SLC25A4 | 2 | 271 | 4 | 186068524 | 186068790 | POGZ | 268 | 442 | 1 | 151418819 | 151418993 | |
| Top |
| Mutation type/ Tissue ID | brca | cns | cerv | endome | haematopo | kidn | Lintest | liver | lung | ns | ovary | pancre | prost | skin | stoma | thyro | urina | |||
| Total # sample | 1 | |||||||||||||||||||
| GAIN (# sample) | ||||||||||||||||||||
| LOSS (# sample) | 1 |
| cf) Tissue ID; Tissue type (1; Breast, 2; Central_nervous_system, 3; Cervix, 4; Endometrium, 5; Haematopoietic_and_lymphoid_tissue, 6; Kidney, 7; Large_intestine, 8; Liver, 9; Lung, 10; NS, 11; Ovary, 12; Pancreas, 13; Prostate, 14; Skin, 15; Stomach, 16; Thyroid, 17; Urinary_tract) |
| Top |
|
 |
| Top |
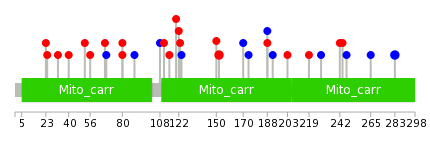
| Stat. for Non-Synonymous SNVs (# total SNVs=21) | (# total SNVs=8) |
 |  |
(# total SNVs=1) | (# total SNVs=0) |
 |
| Top |
| * When you move the cursor on each content, you can see more deailed mutation information on the Tooltip. Those are primary_site,primary_histology,mutation(aa),pubmedID. |
| GRCh37 position | Mutation(aa) | Unique sampleID count |
| chr4:186066261-186066261 | p.R152H | 2 |
| chr4:186068077-186068077 | p.G283G | 2 |
| chr4:186066254-186066254 | p.A150T | 1 |
| chr4:186067045-186067045 | p.R244Q | 1 |
| chr4:186066073-186066073 | p.F89F | 1 |
| chr4:186067969-186067969 | p.A247A | 1 |
| chr4:186064595-186064595 | p.K23N | 1 |
| chr4:186066130-186066130 | p.Q108Q | 1 |
| chr4:186066316-186066316 | p.L170L | 1 |
| chr4:186064596-186064596 | p.T24S | 1 |
| Top |
|
 |
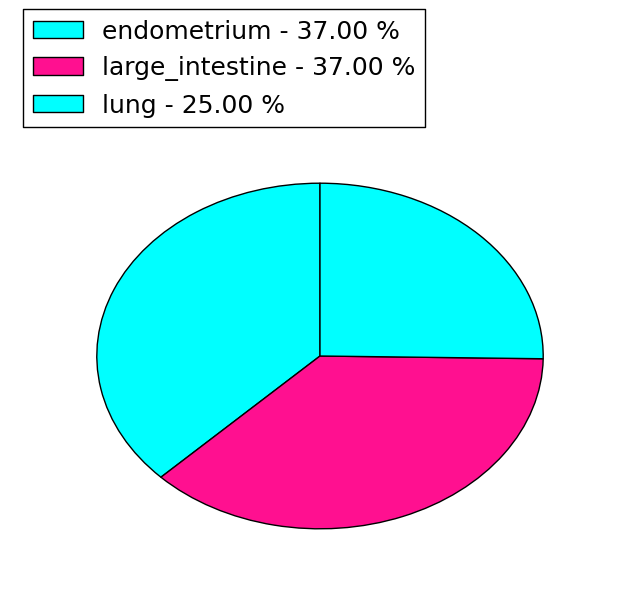
| Point Mutation/ Tissue ID | 1 | 2 | 3 | 4 | 5 | 6 | 7 | 8 | 9 | 10 | 11 | 12 | 13 | 14 | 15 | 16 | 17 | 18 | 19 | 20 |
| # sample | 1 | 6 | 2 | 1 | 1 | 1 | 3 | 5 | ||||||||||||
| # mutation | 1 | 5 | 2 | 1 | 1 | 1 | 3 | 7 | ||||||||||||
| nonsynonymous SNV | 1 | 3 | 2 | 1 | 2 | 4 | ||||||||||||||
| synonymous SNV | 2 | 1 | 1 | 1 | 3 |
| cf) Tissue ID; Tissue type (1; BLCA[Bladder Urothelial Carcinoma], 2; BRCA[Breast invasive carcinoma], 3; CESC[Cervical squamous cell carcinoma and endocervical adenocarcinoma], 4; COAD[Colon adenocarcinoma], 5; GBM[Glioblastoma multiforme], 6; Glioma Low Grade, 7; HNSC[Head and Neck squamous cell carcinoma], 8; KICH[Kidney Chromophobe], 9; KIRC[Kidney renal clear cell carcinoma], 10; KIRP[Kidney renal papillary cell carcinoma], 11; LAML[Acute Myeloid Leukemia], 12; LUAD[Lung adenocarcinoma], 13; LUSC[Lung squamous cell carcinoma], 14; OV[Ovarian serous cystadenocarcinoma ], 15; PAAD[Pancreatic adenocarcinoma], 16; PRAD[Prostate adenocarcinoma], 17; SKCM[Skin Cutaneous Melanoma], 18:STAD[Stomach adenocarcinoma], 19:THCA[Thyroid carcinoma], 20:UCEC[Uterine Corpus Endometrial Carcinoma]) |
| Top |
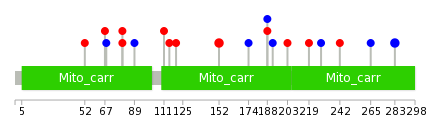
| * We represented just top 10 SNVs. When you move the cursor on each content, you can see more deailed mutation information on the Tooltip. Those are primary_site, primary_histology, mutation(aa), pubmedID. |
| Genomic Position | Mutation(aa) | Unique sampleID count |
| chr4:186068077 | p.G283G | 2 |
| chr4:186066261 | p.R152H | 2 |
| chr4:186066328 | p.S219R | 1 |
| chr4:186065961 | p.S228S | 1 |
| chr4:186066369 | p.K52R | 1 |
| chr4:186066006 | p.F67S | 1 |
| chr4:186066370 | p.S242C | 1 |
| chr4:186066010 | p.L68L | 1 |
| chr4:186066382 | p.E265E | 1 |
| chr4:186066044 | p.R80C | 1 |
| * Copy number data were extracted from TCGA using R package TCGA-Assembler. The URLs of all public data files on TCGA DCC data server were gathered on Jan-05-2015. Function ProcessCNAData in TCGA-Assembler package was used to obtain gene-level copy number value which is calculated as the average copy number of the genomic region of a gene. |
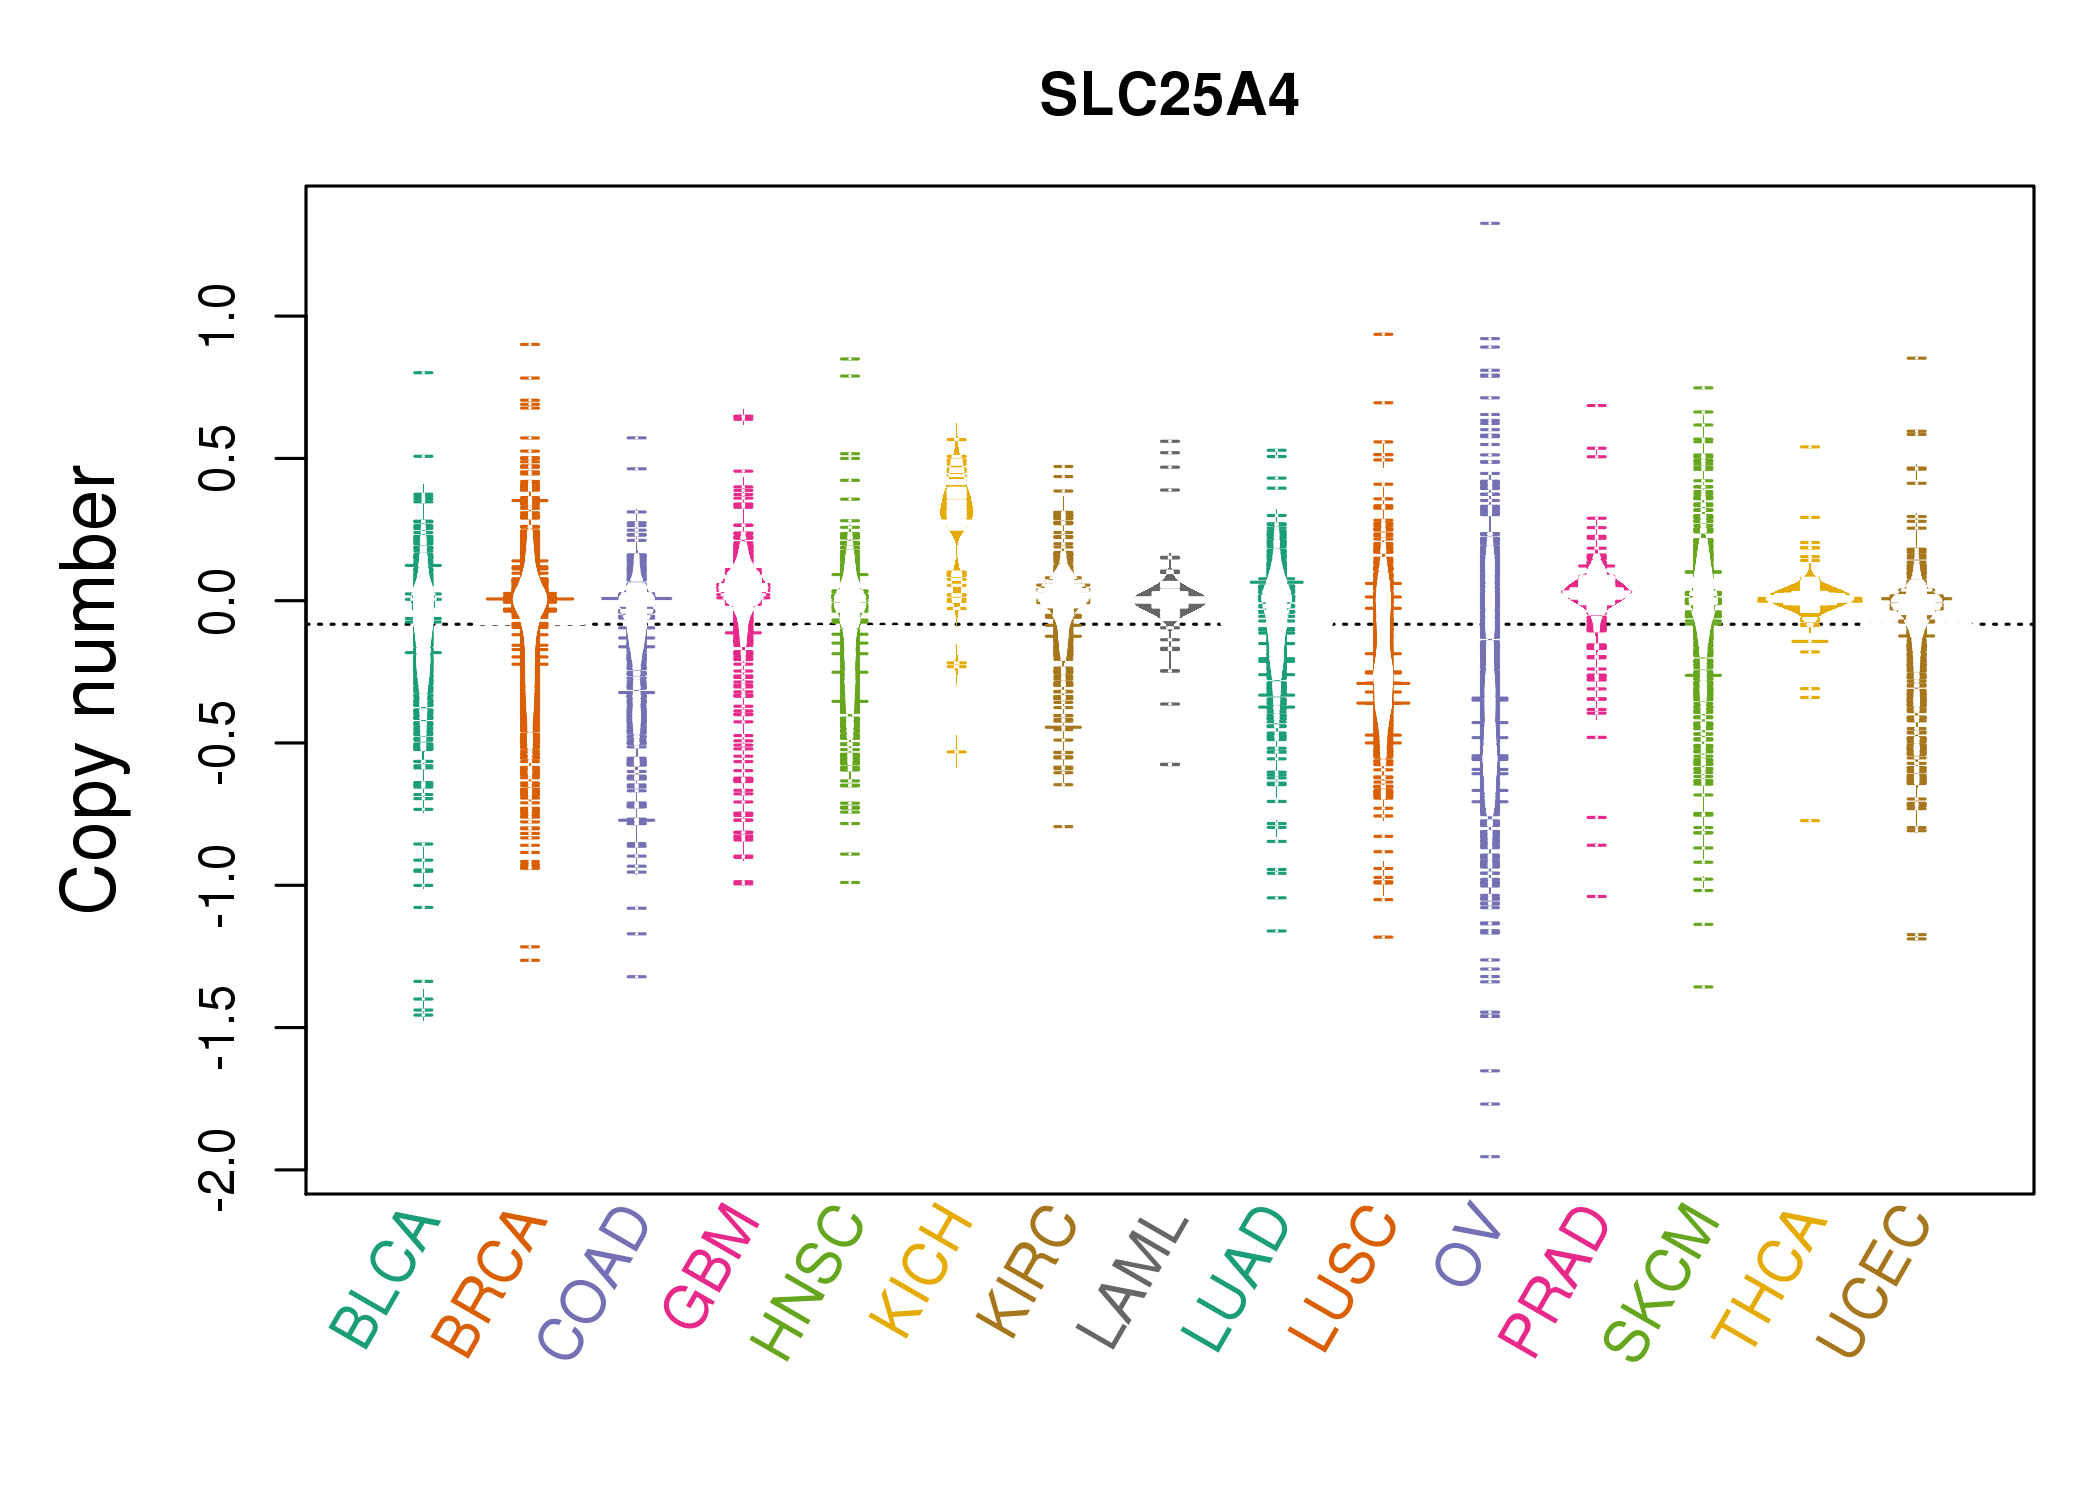 |
| cf) Tissue ID[Tissue type]: BLCA[Bladder Urothelial Carcinoma], BRCA[Breast invasive carcinoma], CESC[Cervical squamous cell carcinoma and endocervical adenocarcinoma], COAD[Colon adenocarcinoma], GBM[Glioblastoma multiforme], Glioma Low Grade, HNSC[Head and Neck squamous cell carcinoma], KICH[Kidney Chromophobe], KIRC[Kidney renal clear cell carcinoma], KIRP[Kidney renal papillary cell carcinoma], LAML[Acute Myeloid Leukemia], LUAD[Lung adenocarcinoma], LUSC[Lung squamous cell carcinoma], OV[Ovarian serous cystadenocarcinoma ], PAAD[Pancreatic adenocarcinoma], PRAD[Prostate adenocarcinoma], SKCM[Skin Cutaneous Melanoma], STAD[Stomach adenocarcinoma], THCA[Thyroid carcinoma], UCEC[Uterine Corpus Endometrial Carcinoma] |
| Top |
| Gene Expression for SLC25A4 |
| * CCLE gene expression data were extracted from CCLE_Expression_Entrez_2012-10-18.res: Gene-centric RMA-normalized mRNA expression data. |
 |
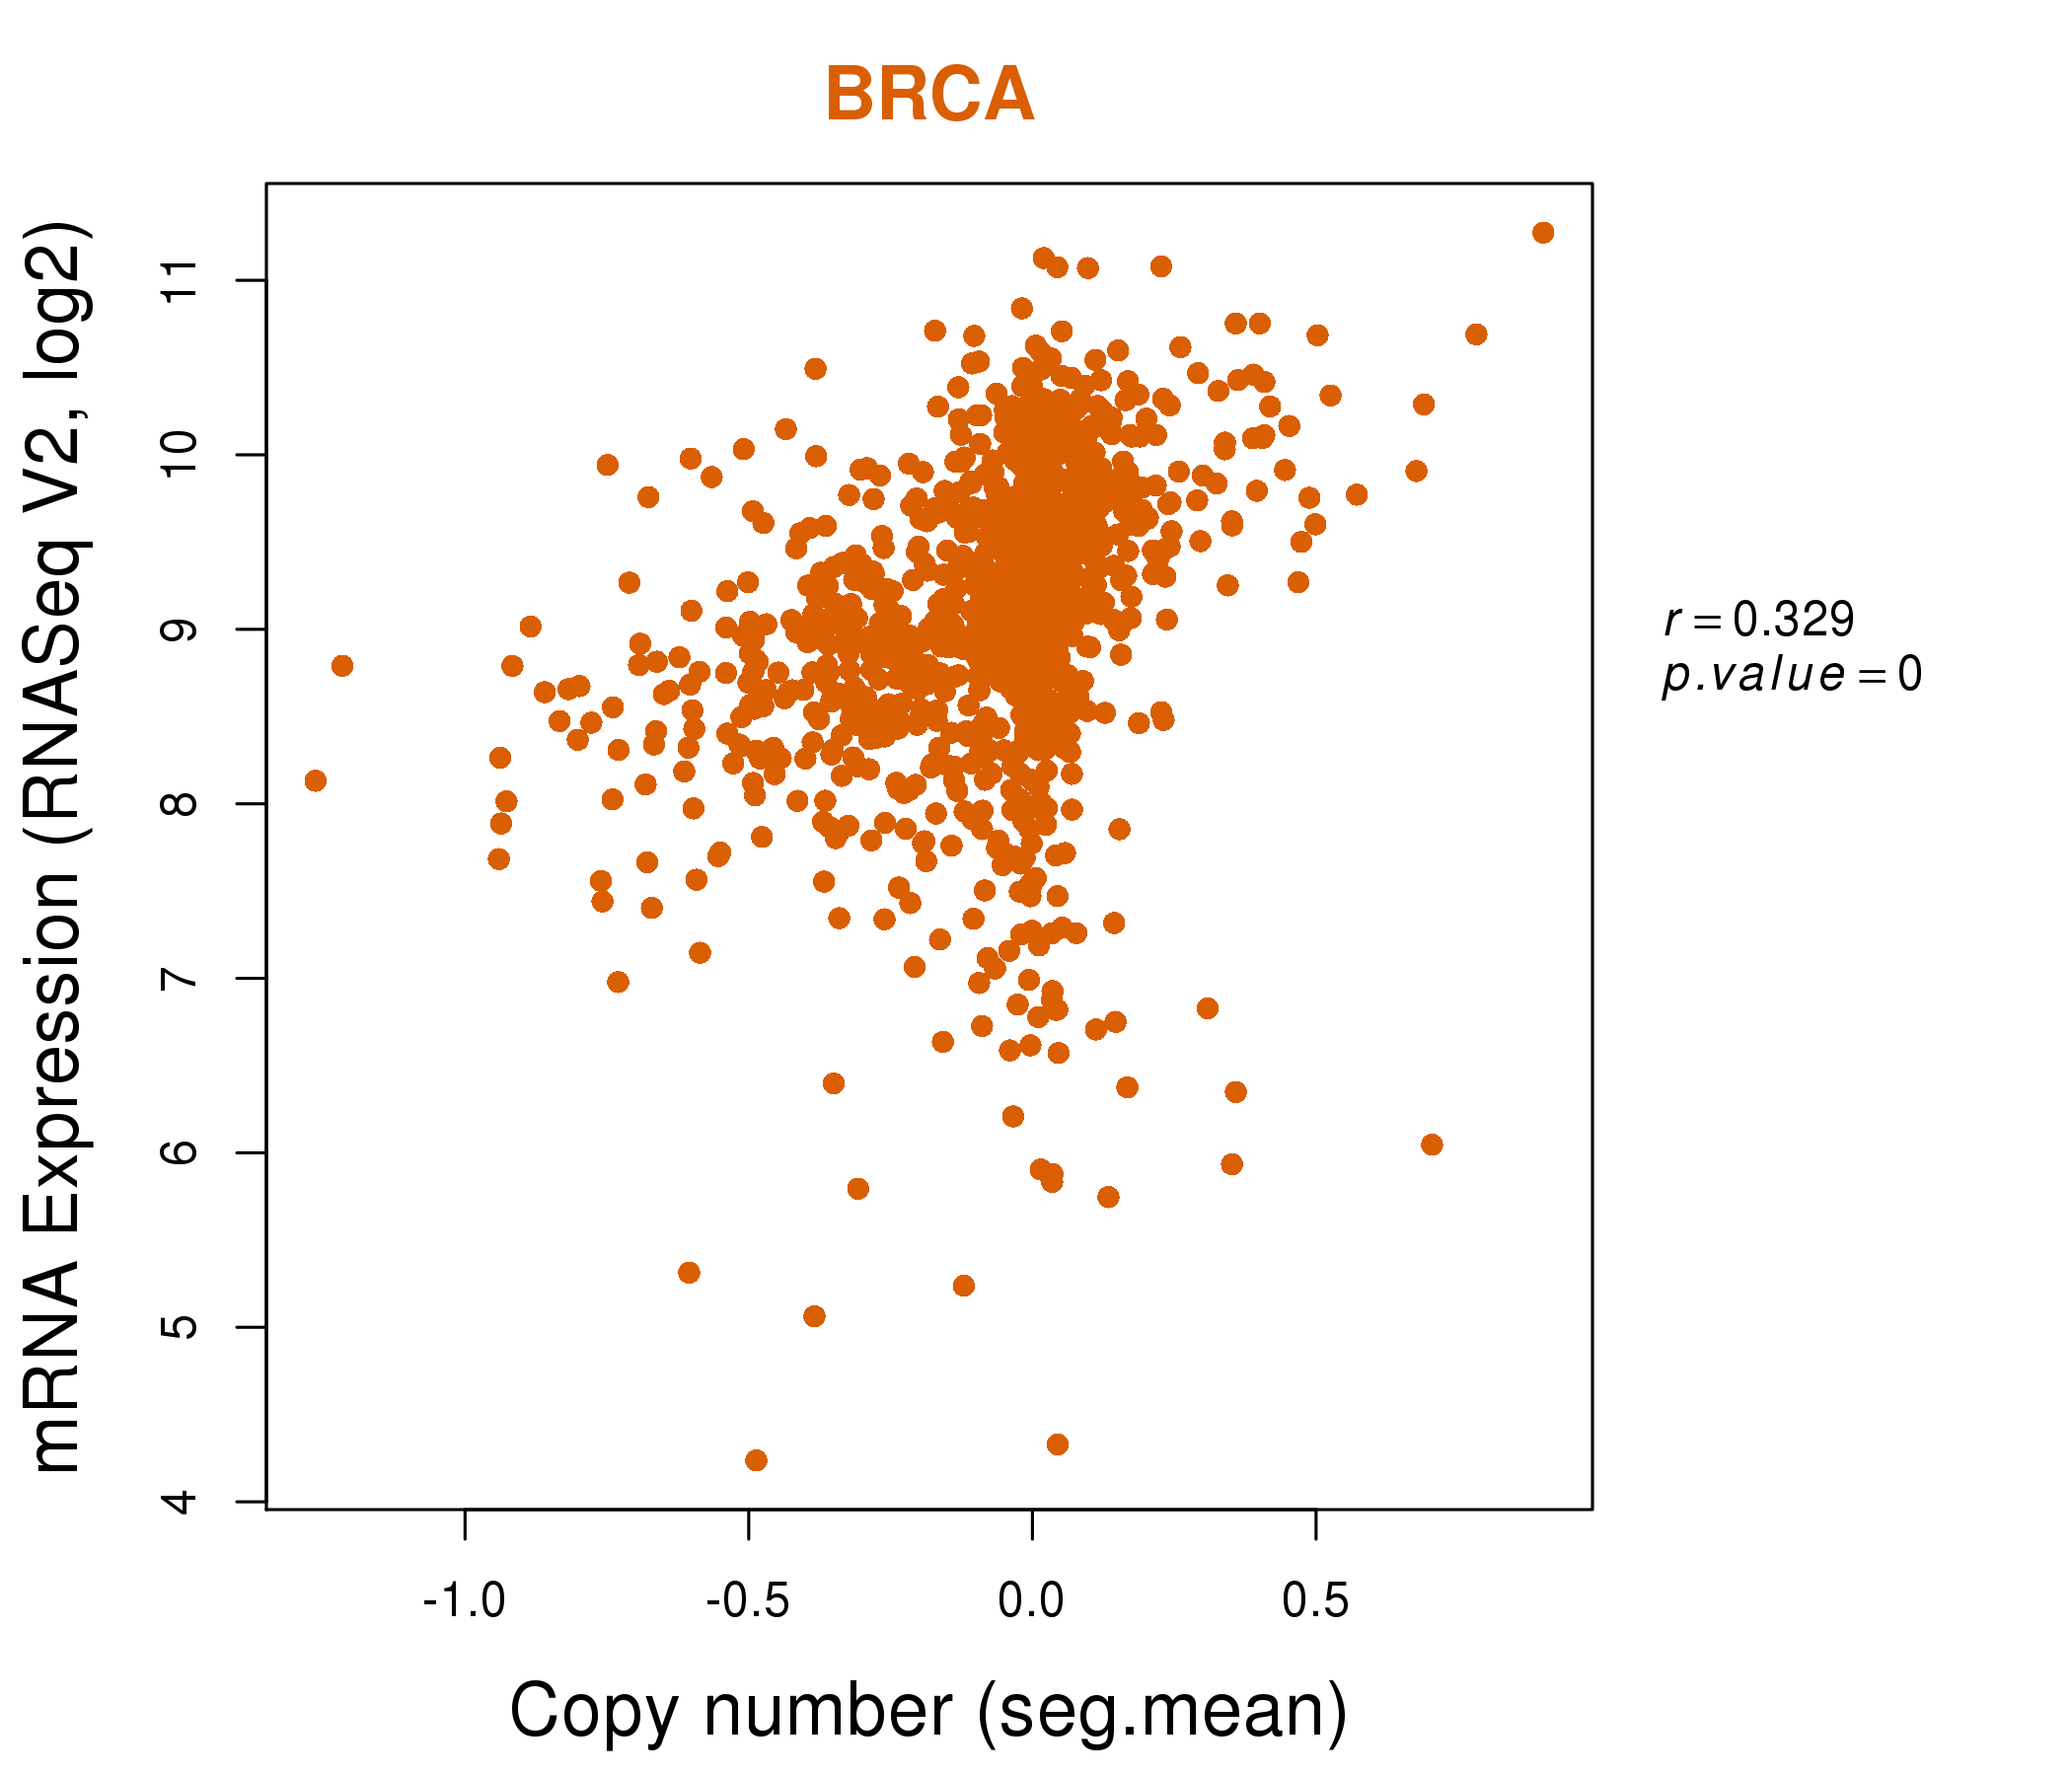
| * Normalized gene expression data of RNASeqV2 was extracted from TCGA using R package TCGA-Assembler. The URLs of all public data files on TCGA DCC data server were gathered at Jan-05-2015. Only eight cancer types have enough normal control samples for differential expression analysis. (t test, adjusted p<0.05 (using Benjamini-Hochberg FDR)) |
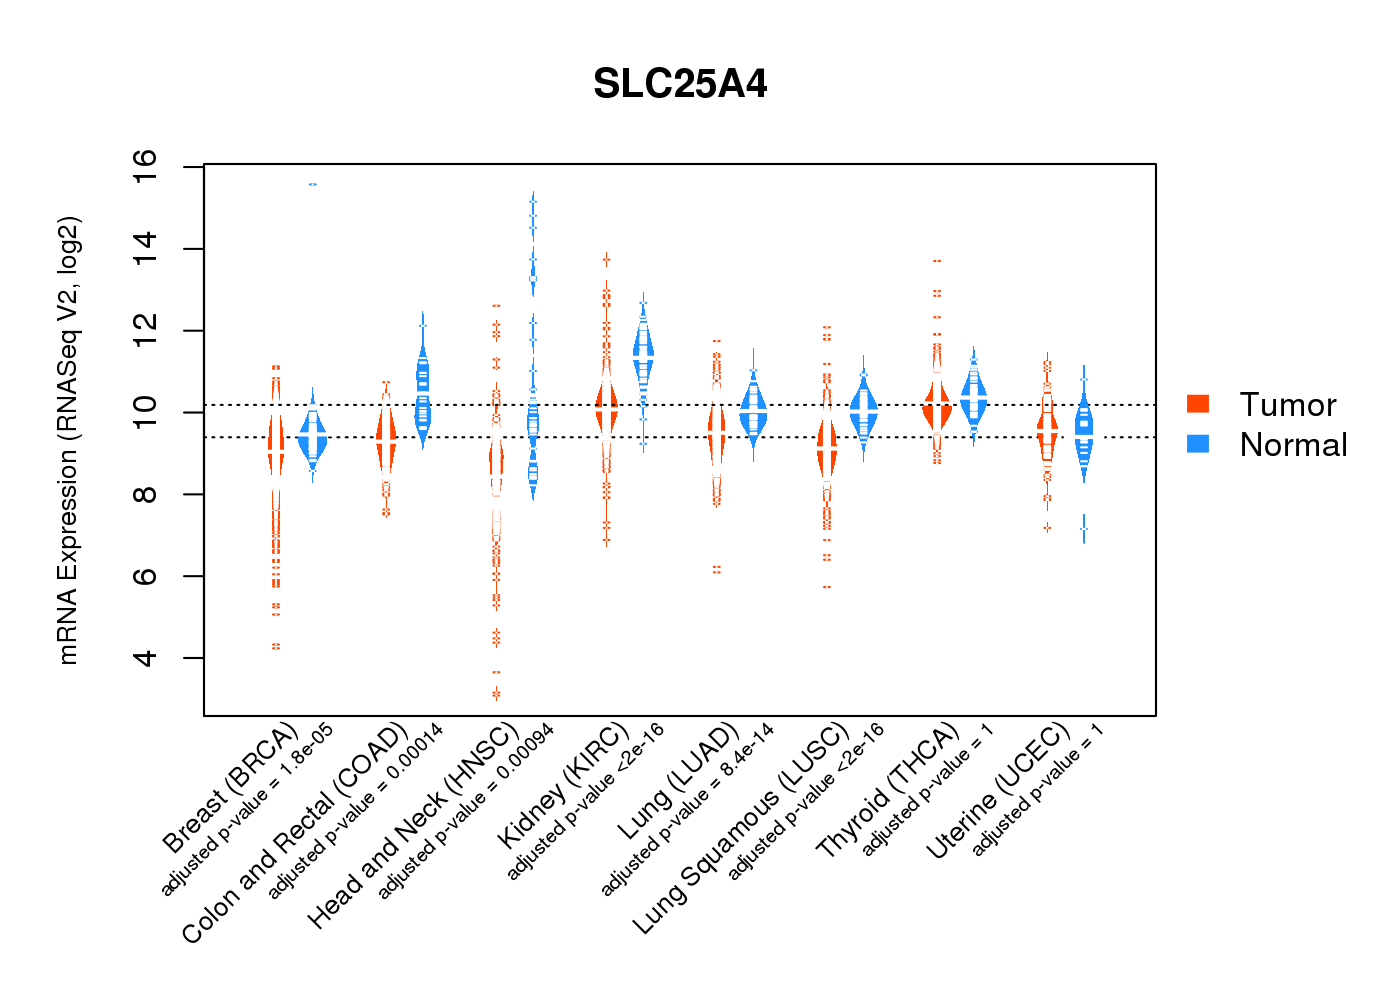 |
| Top |
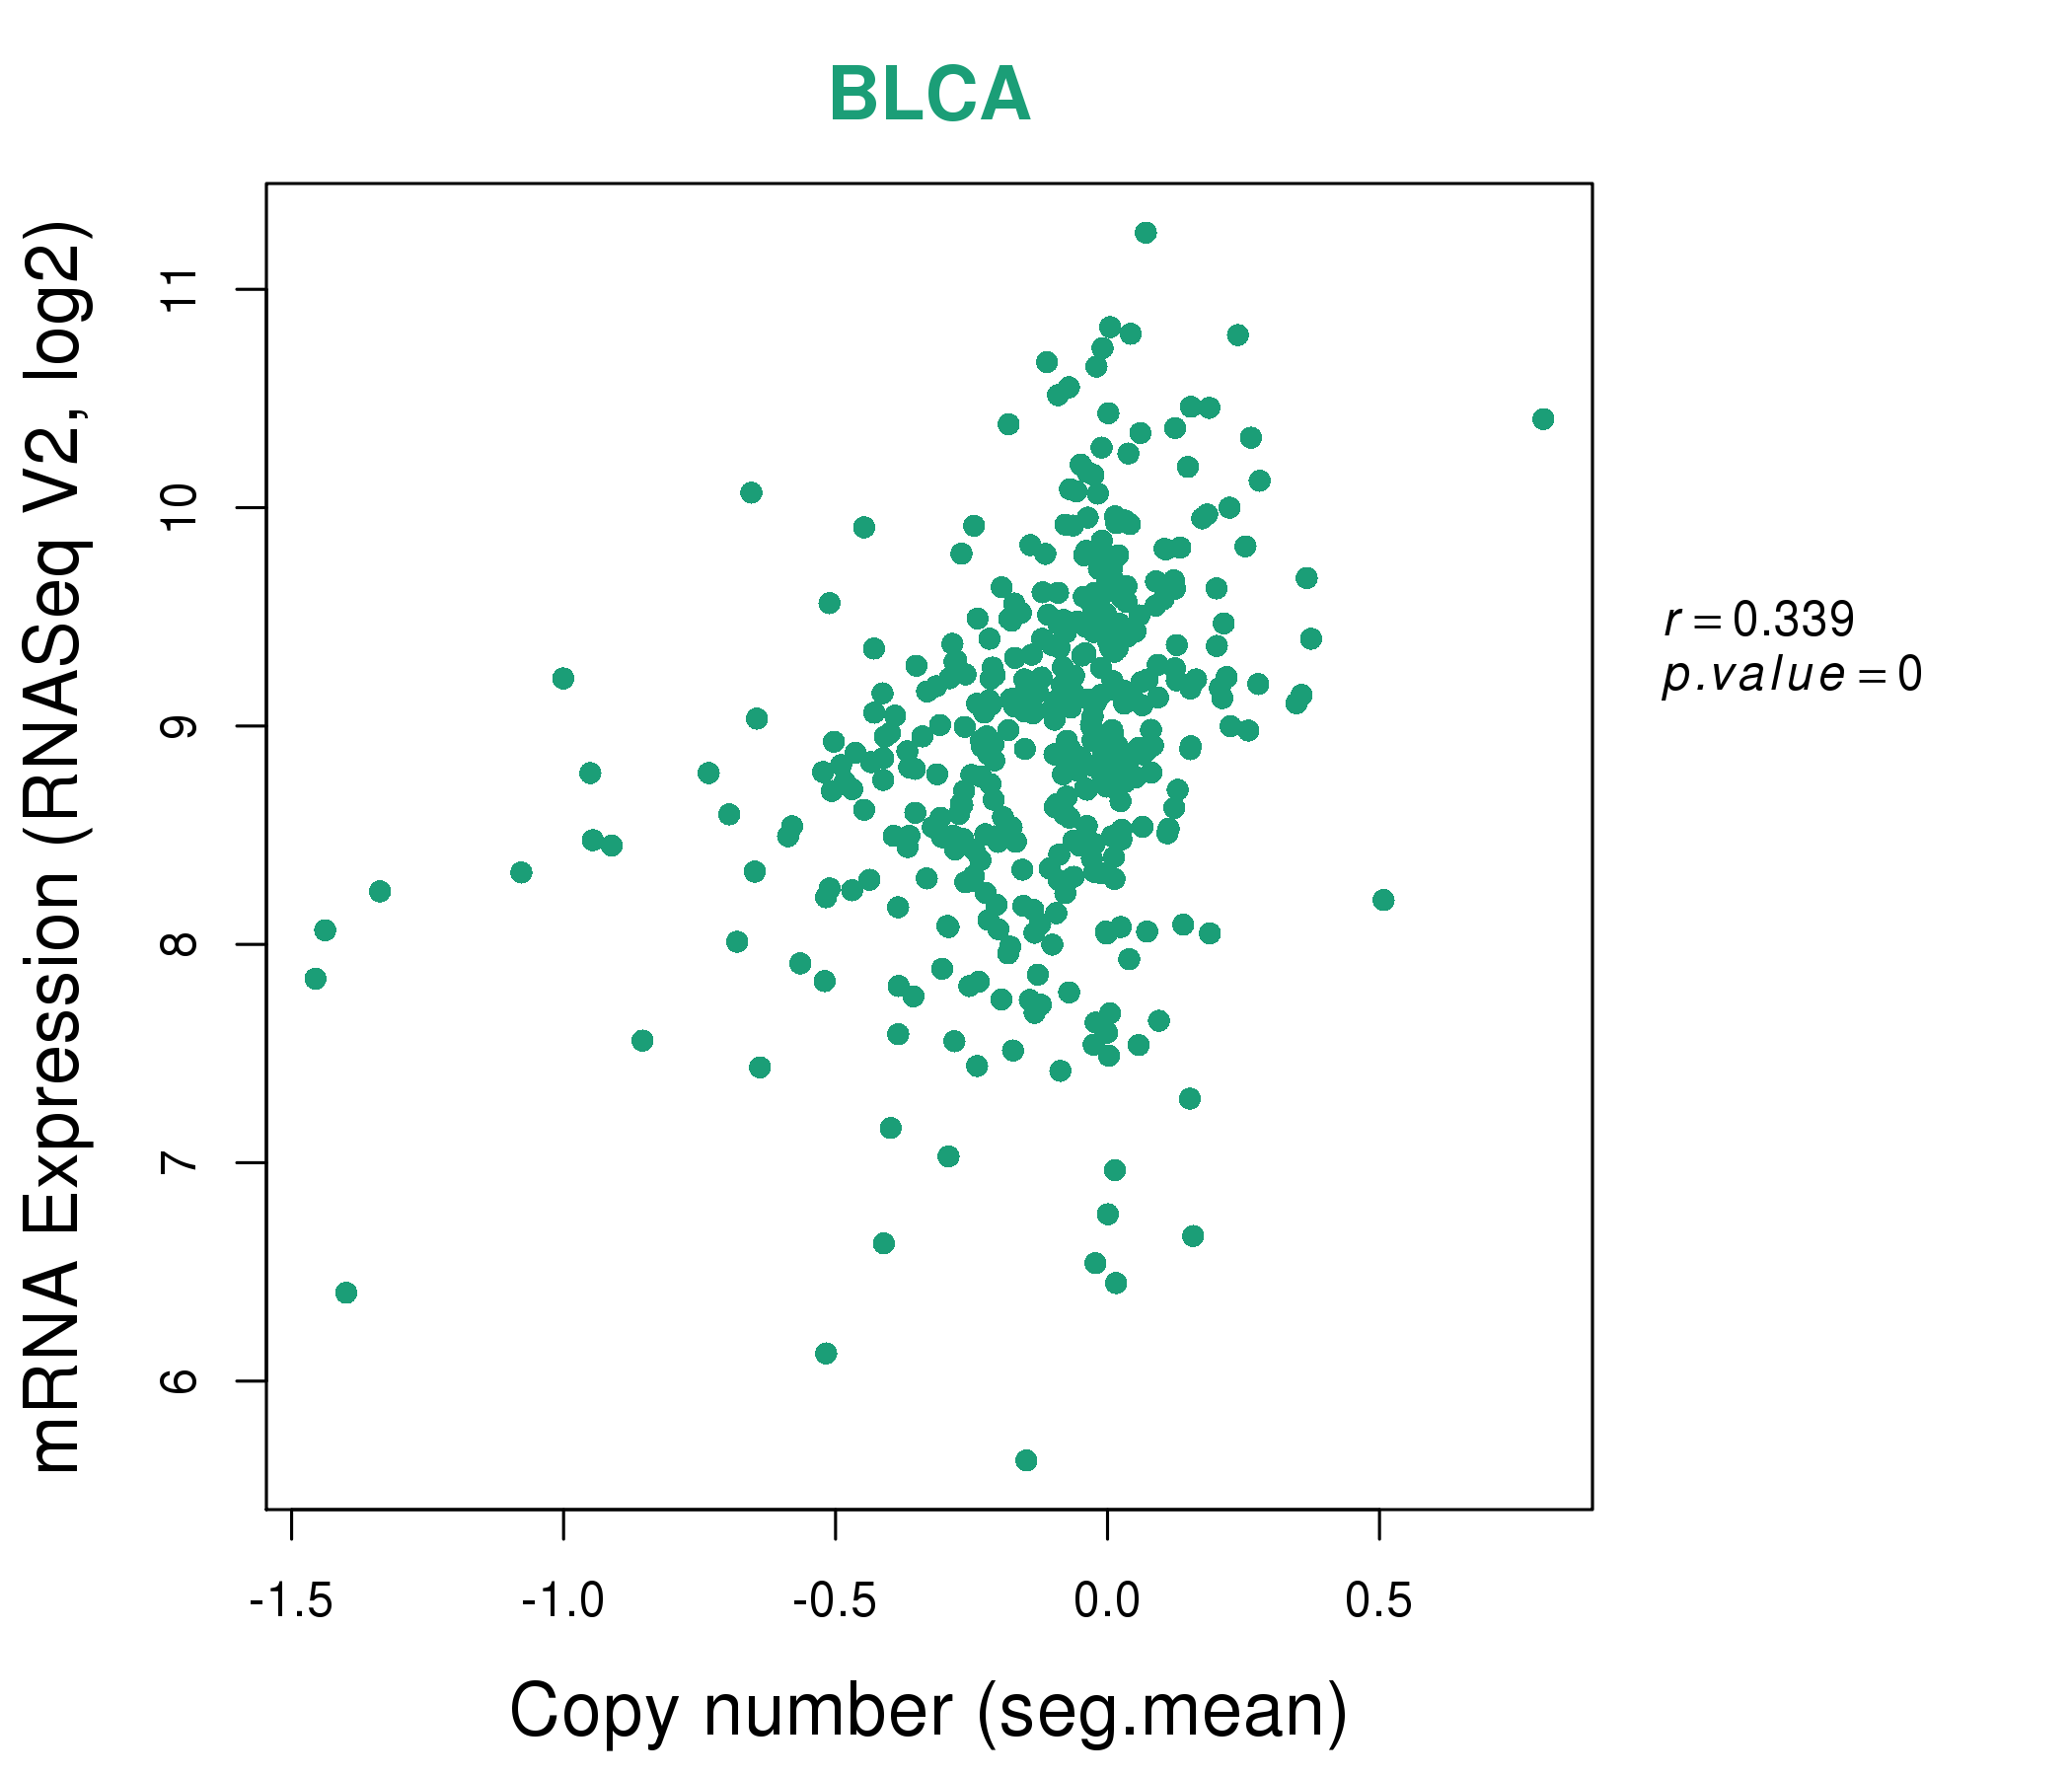
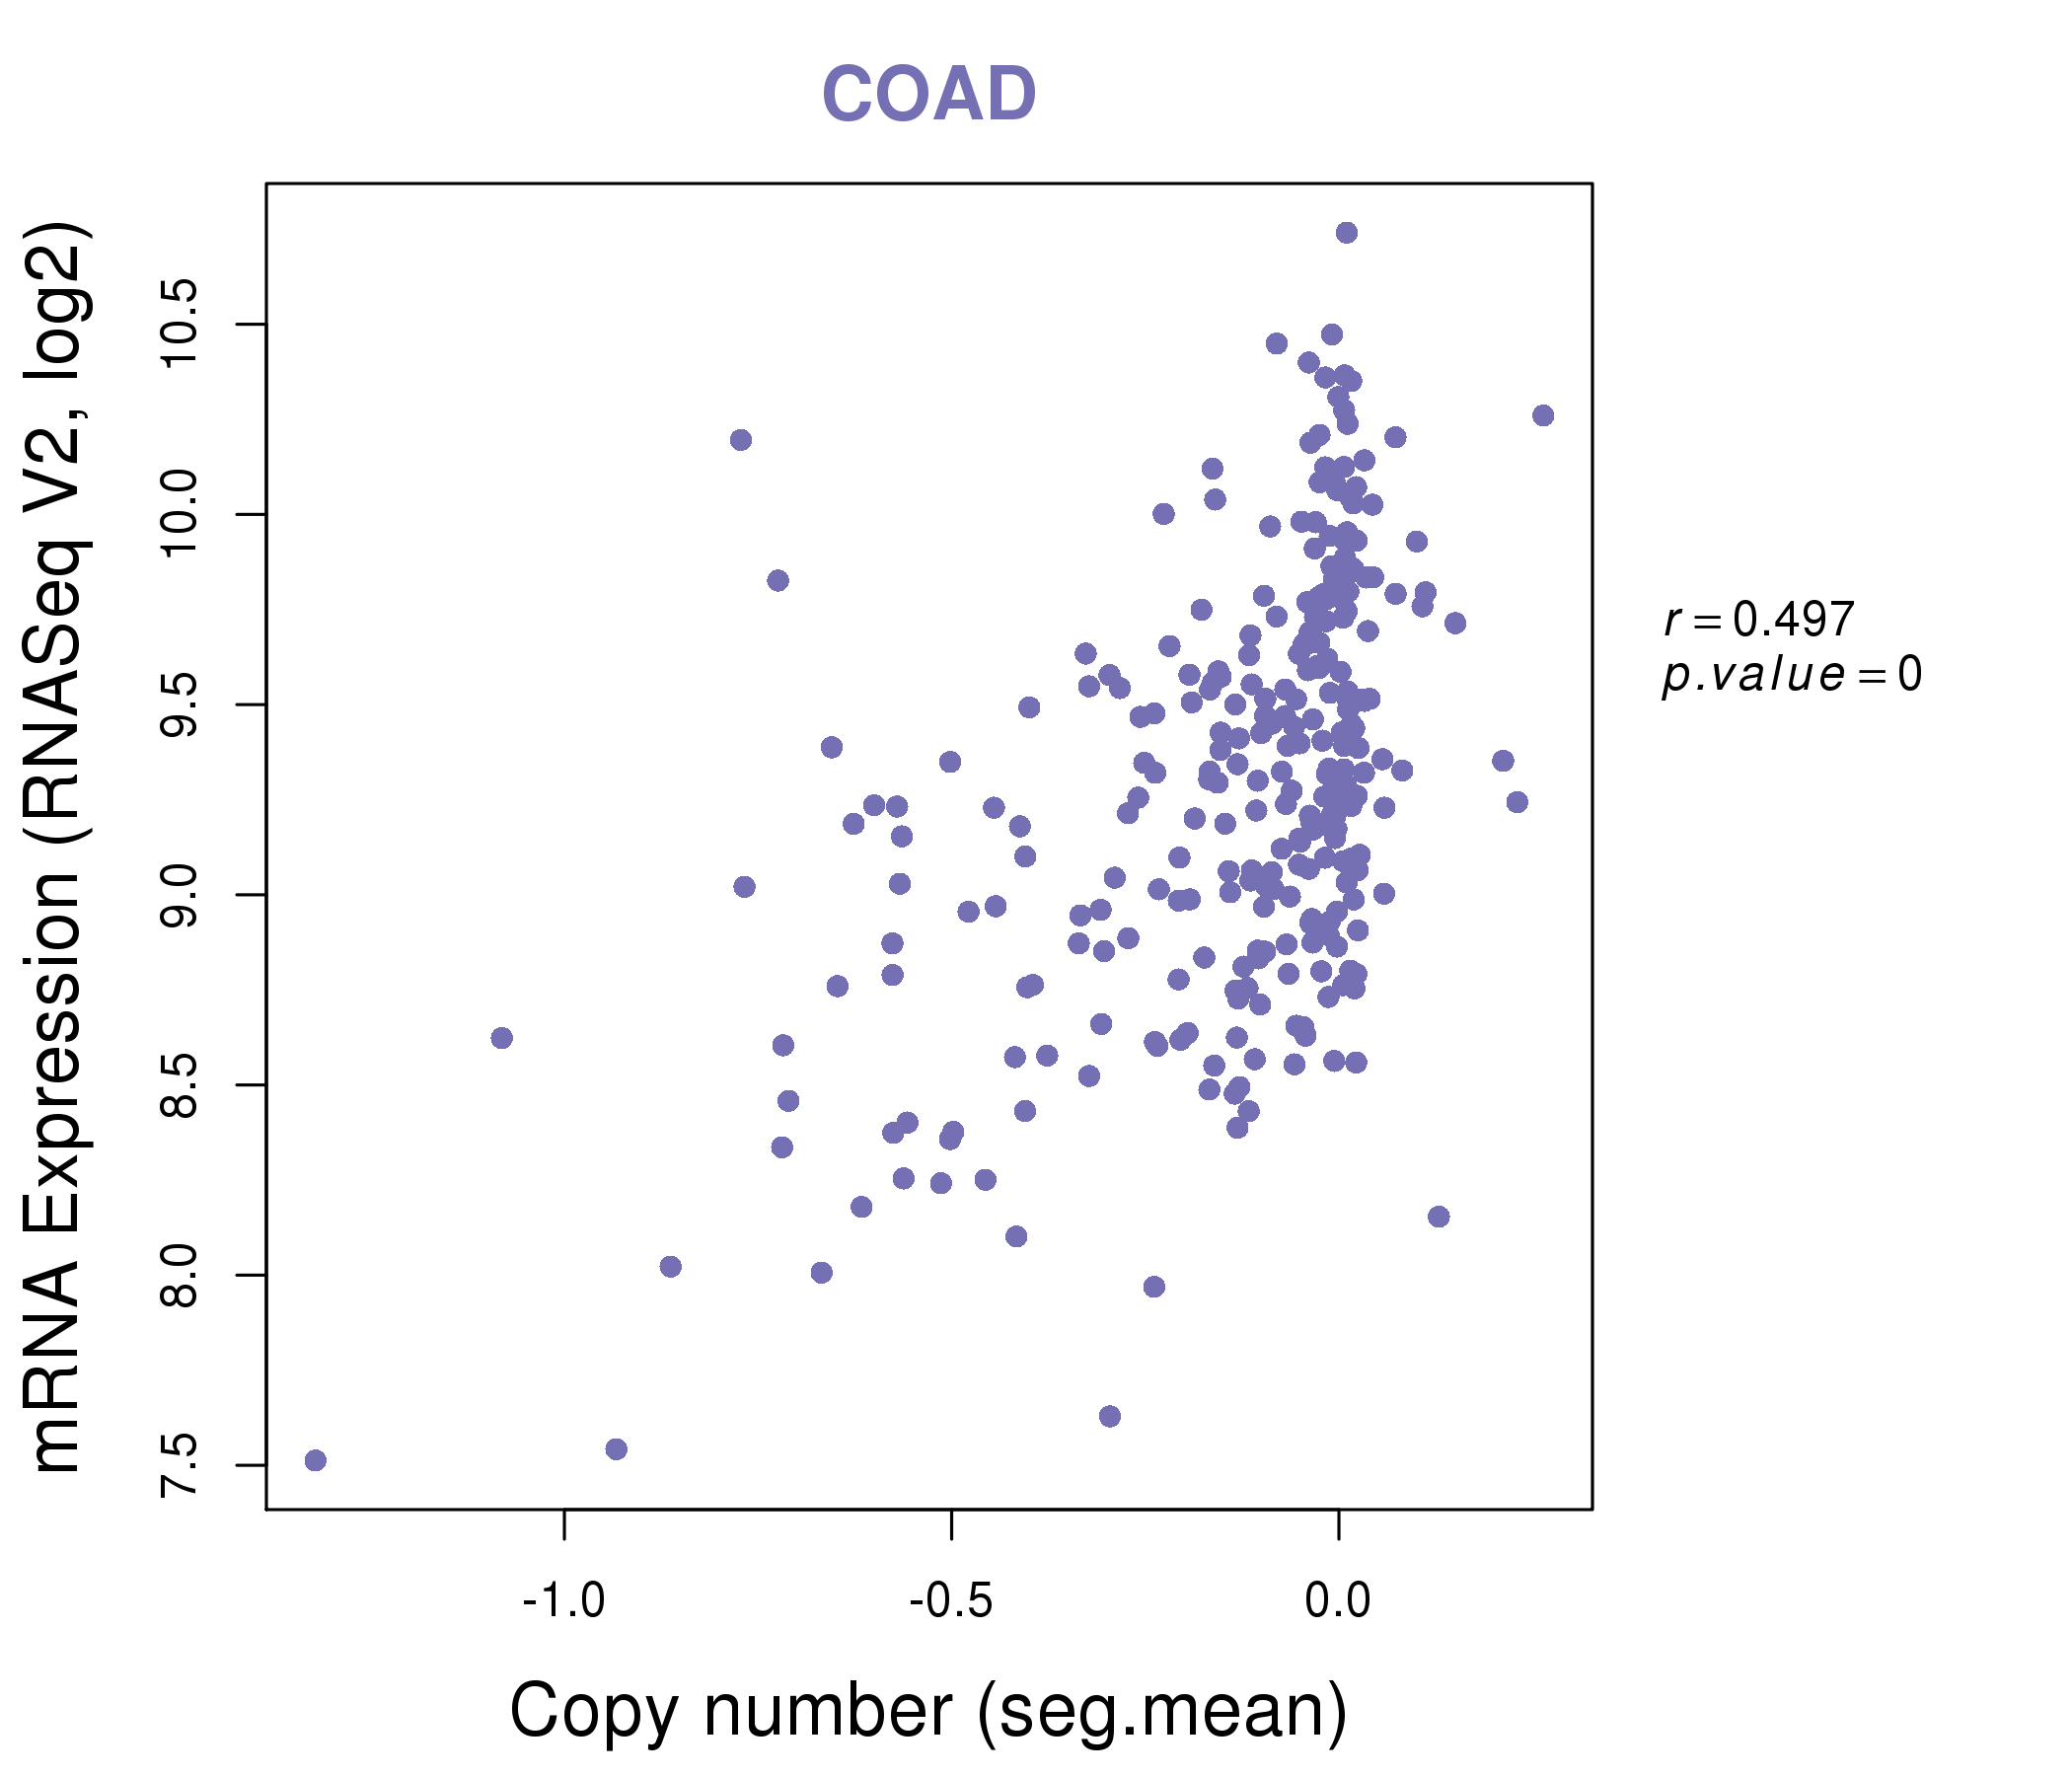
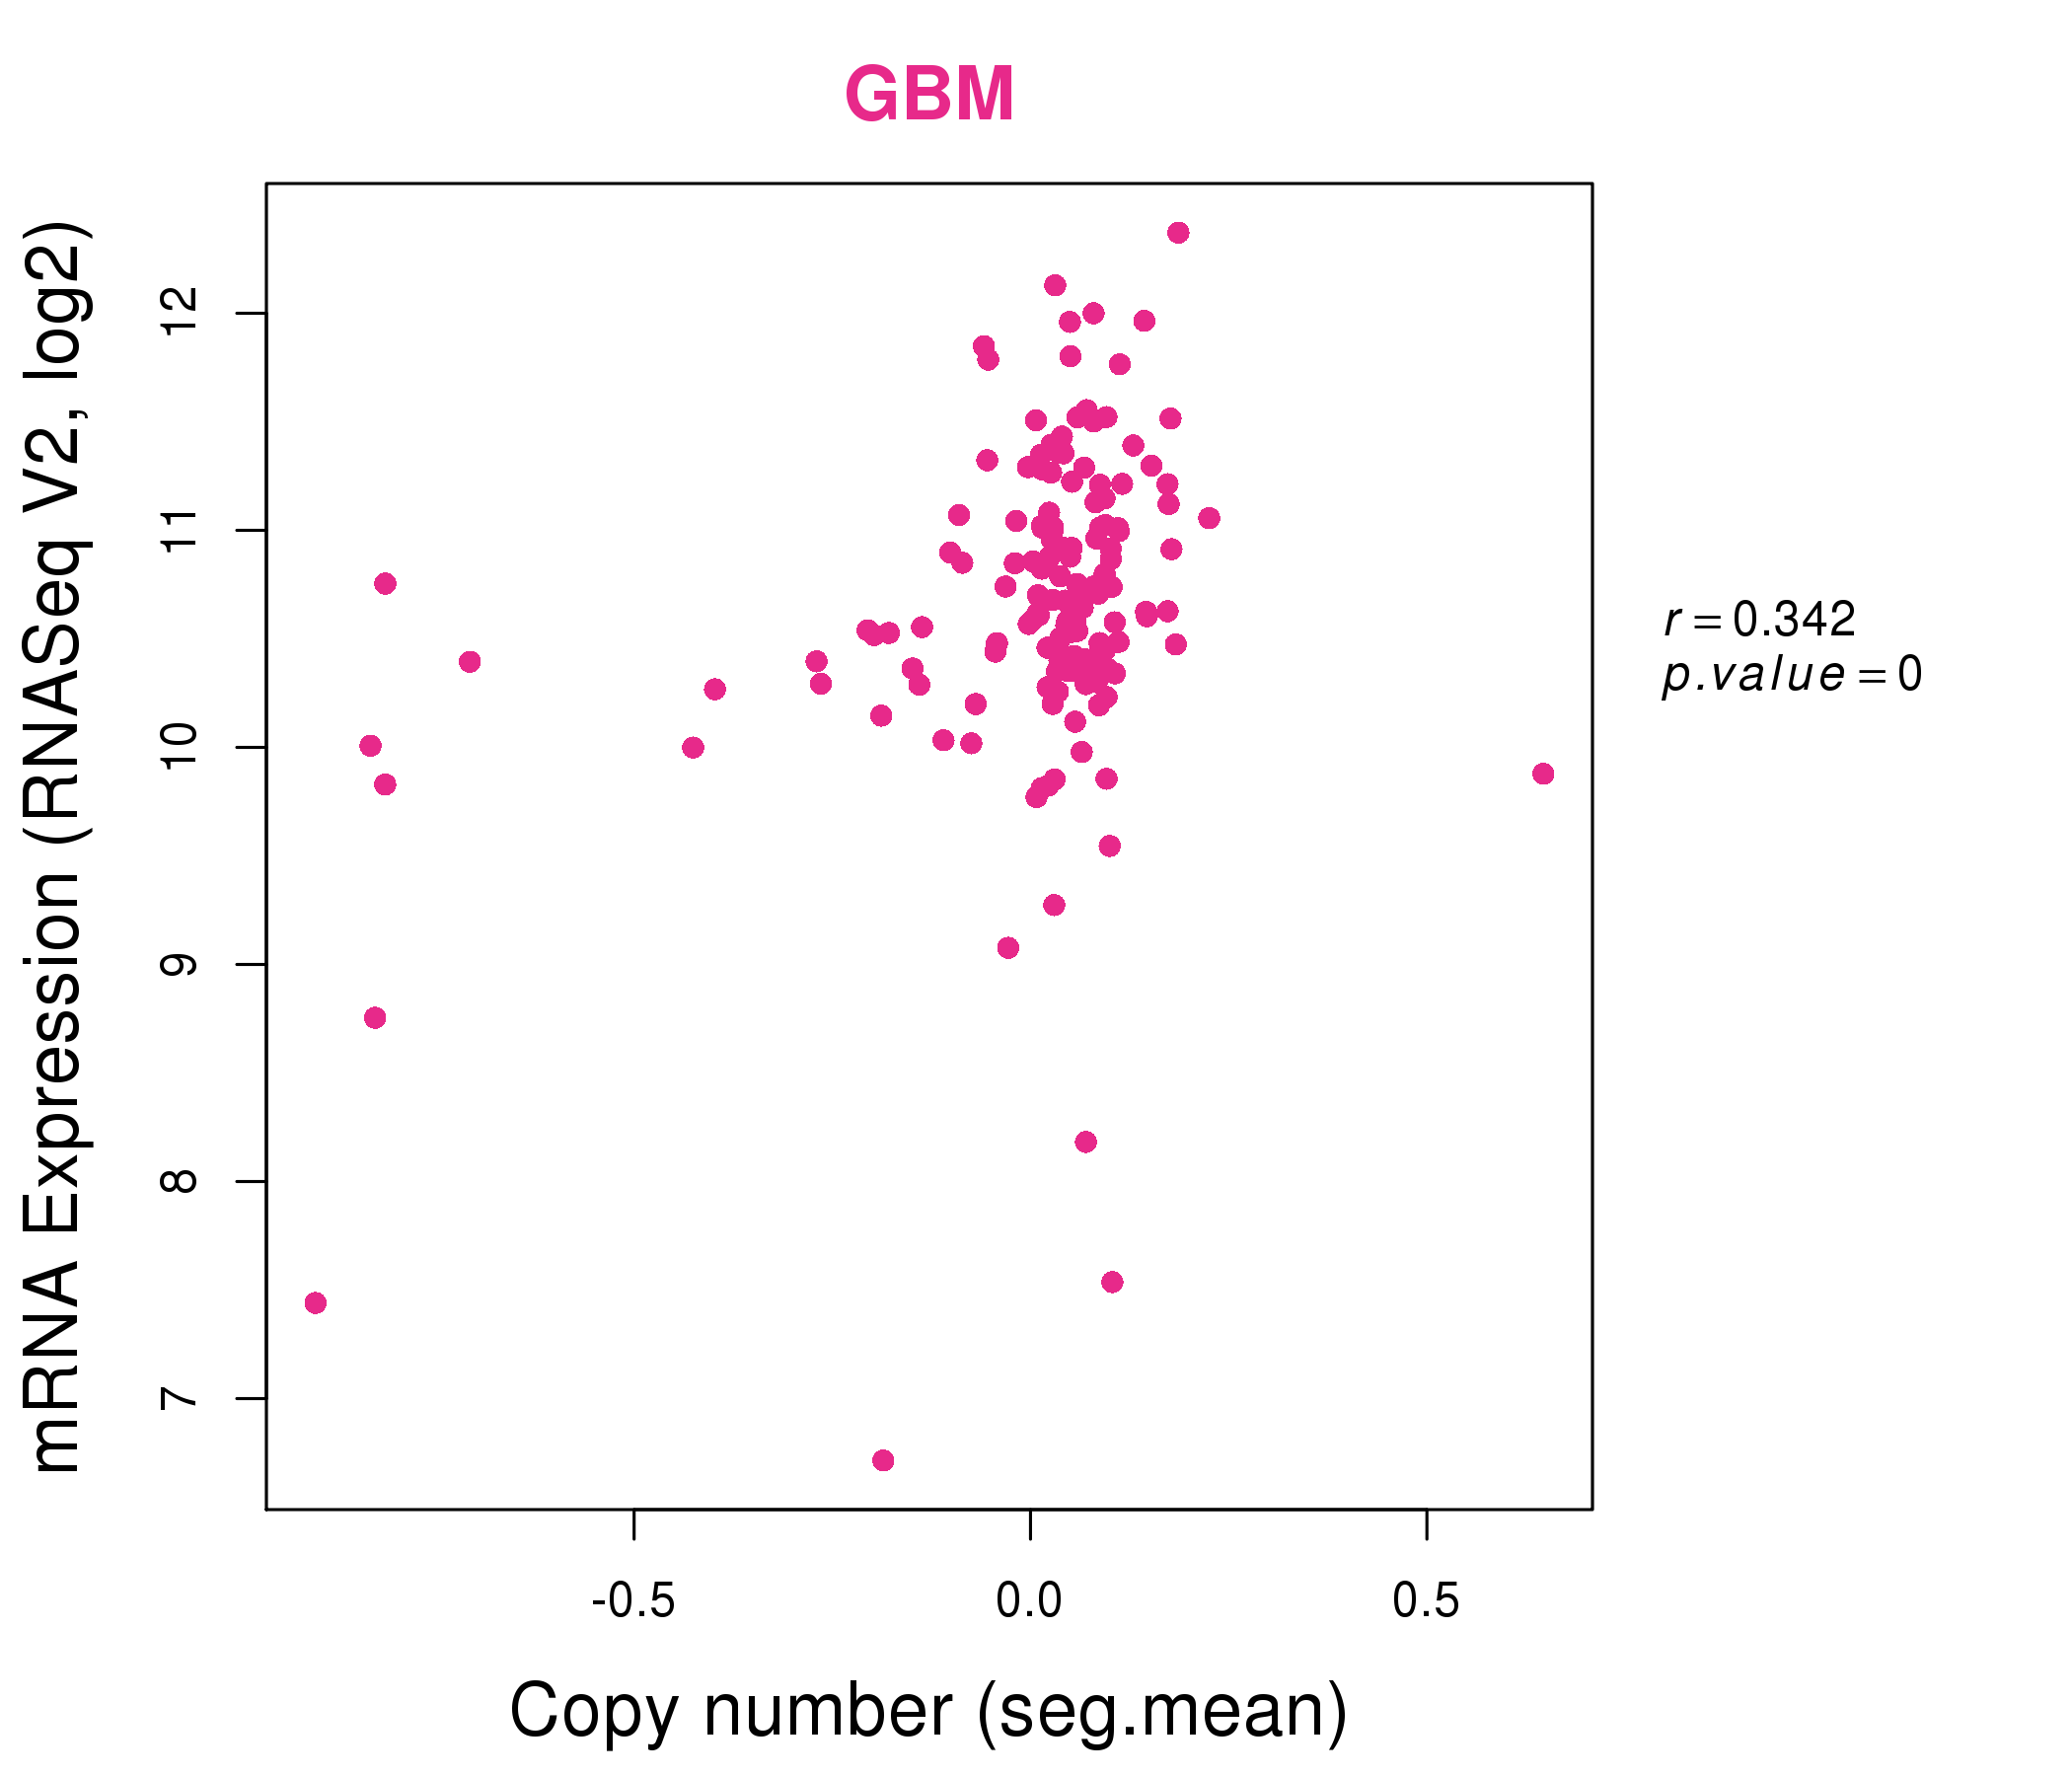
| * This plots show the correlation between CNV and gene expression. |
: Open all plots for all cancer types
 |
|
 |
|
| Top |
| Gene-Gene Network Information |
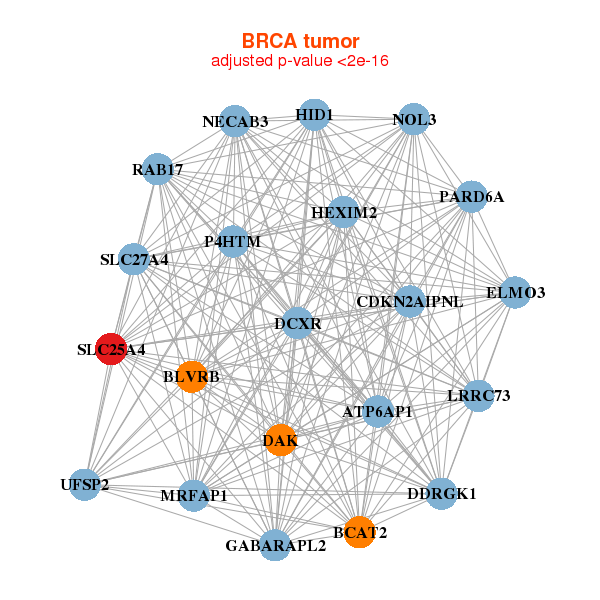
| * Co-Expression network figures were drawn using R package igraph. Only the top 20 genes with the highest correlations were shown. Red circle: input gene, orange circle: cell metabolism gene, sky circle: other gene |
: Open all plots for all cancer types
 |
| ||||
| ATP6AP1,BCAT2,BLVRB,HID1,LRRC73,CDKN2AIPNL,DAK, DCXR,DDRGK1,ELMO3,GABARAPL2,HEXIM2,MRFAP1,NECAB3, NOL3,P4HTM,PARD6A,RAB17,SLC25A4,SLC27A4,UFSP2 | ABRA,ART1,C10orf71,CACNG1,DHRS7C,ENO3,FBP2, FBXO40,FITM1,HSPB3,MB,MYBPH,MYL3,MYO18B, MYOZ1,MYPN,PYGM,SLC25A4,TMEM38A,TNNC2,TRIM54 | ||||
 |
| ||||
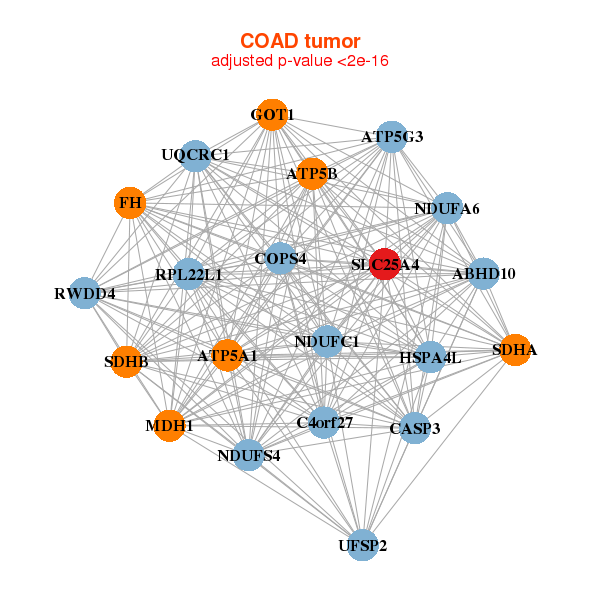
| ABHD10,ATP5A1,ATP5B,ATP5G3,C4orf27,CASP3,COPS4, FH,GOT1,HSPA4L,MDH1,NDUFA6,NDUFC1,NDUFS4, RPL22L1,RWDD4,SDHA,SDHB,SLC25A4,UFSP2,UQCRC1 | BAG2,CPED1,CAB39L,CCDC69,CFL2,DSTN,MORN5, MSRB3,MXRA7,PDLIM3,PDLIM4,PLN,PPP1R14A,PPP3CB, PSD,PTPLA,RAB12,REEP1,SLC25A4,SLMAP,TEAD2 |

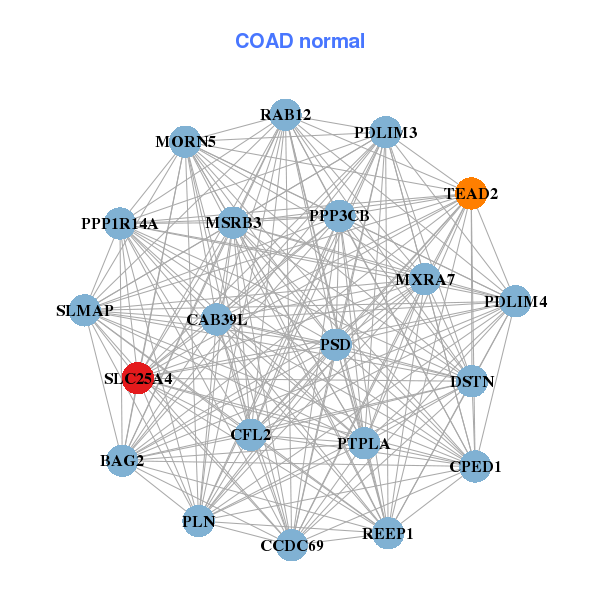
| * Co-Expression network figures were drawn using R package igraph. Only the top 20 genes with the highest correlations were shown. Red circle: input gene, orange circle: cell metabolism gene, sky circle: other gene |
: Open all plots for all cancer types
| Top |
: Open all interacting genes' information including KEGG pathway for all interacting genes from DAVID
| Top |
| Pharmacological Information for SLC25A4 |
| DB Category | DB Name | DB's ID and Url link |
| * Gene Centered Interaction Network. |
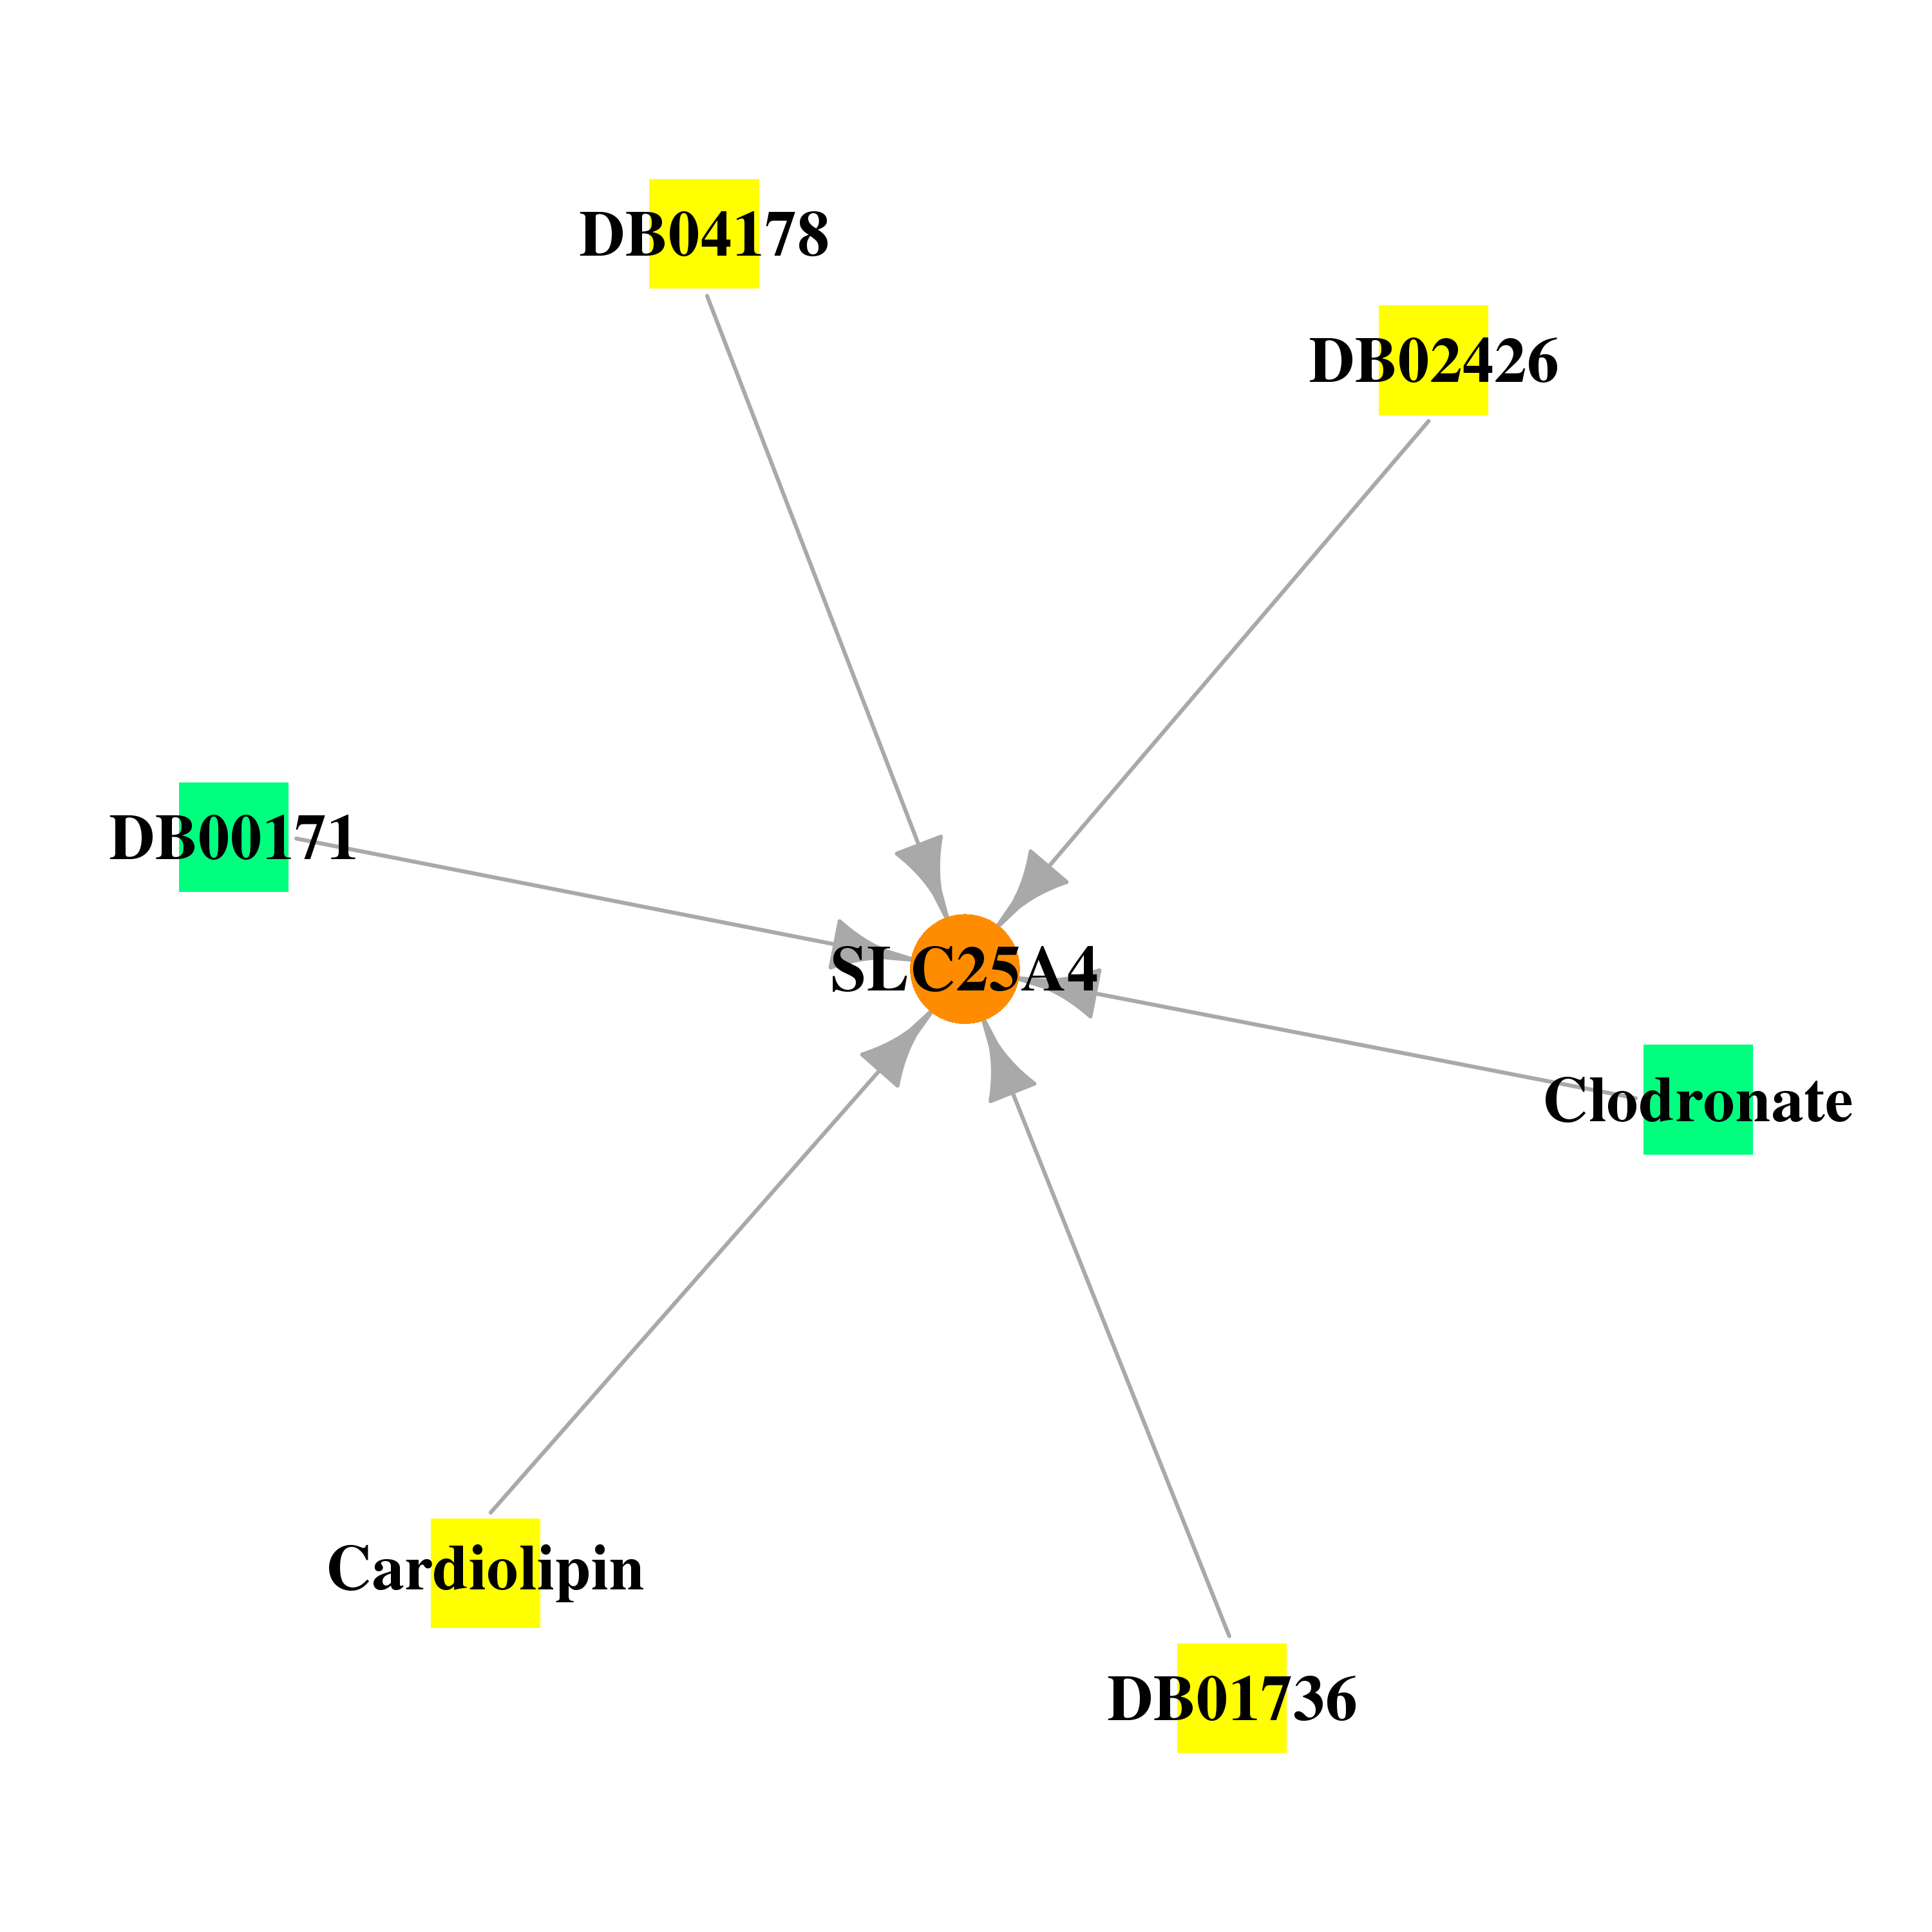 |
| * Drug Centered Interaction Network. |
| DrugBank ID | Target Name | Drug Groups | Generic Name | Drug Centered Network | Drug Structure |
| DB00171 | solute carrier family 25 (mitochondrial carrier; adenine nucleotide translocator), member 4 | approved; nutraceutical | Adenosine triphosphate |  |  |
| DB00720 | solute carrier family 25 (mitochondrial carrier; adenine nucleotide translocator), member 4 | approved; investigational | Clodronate | 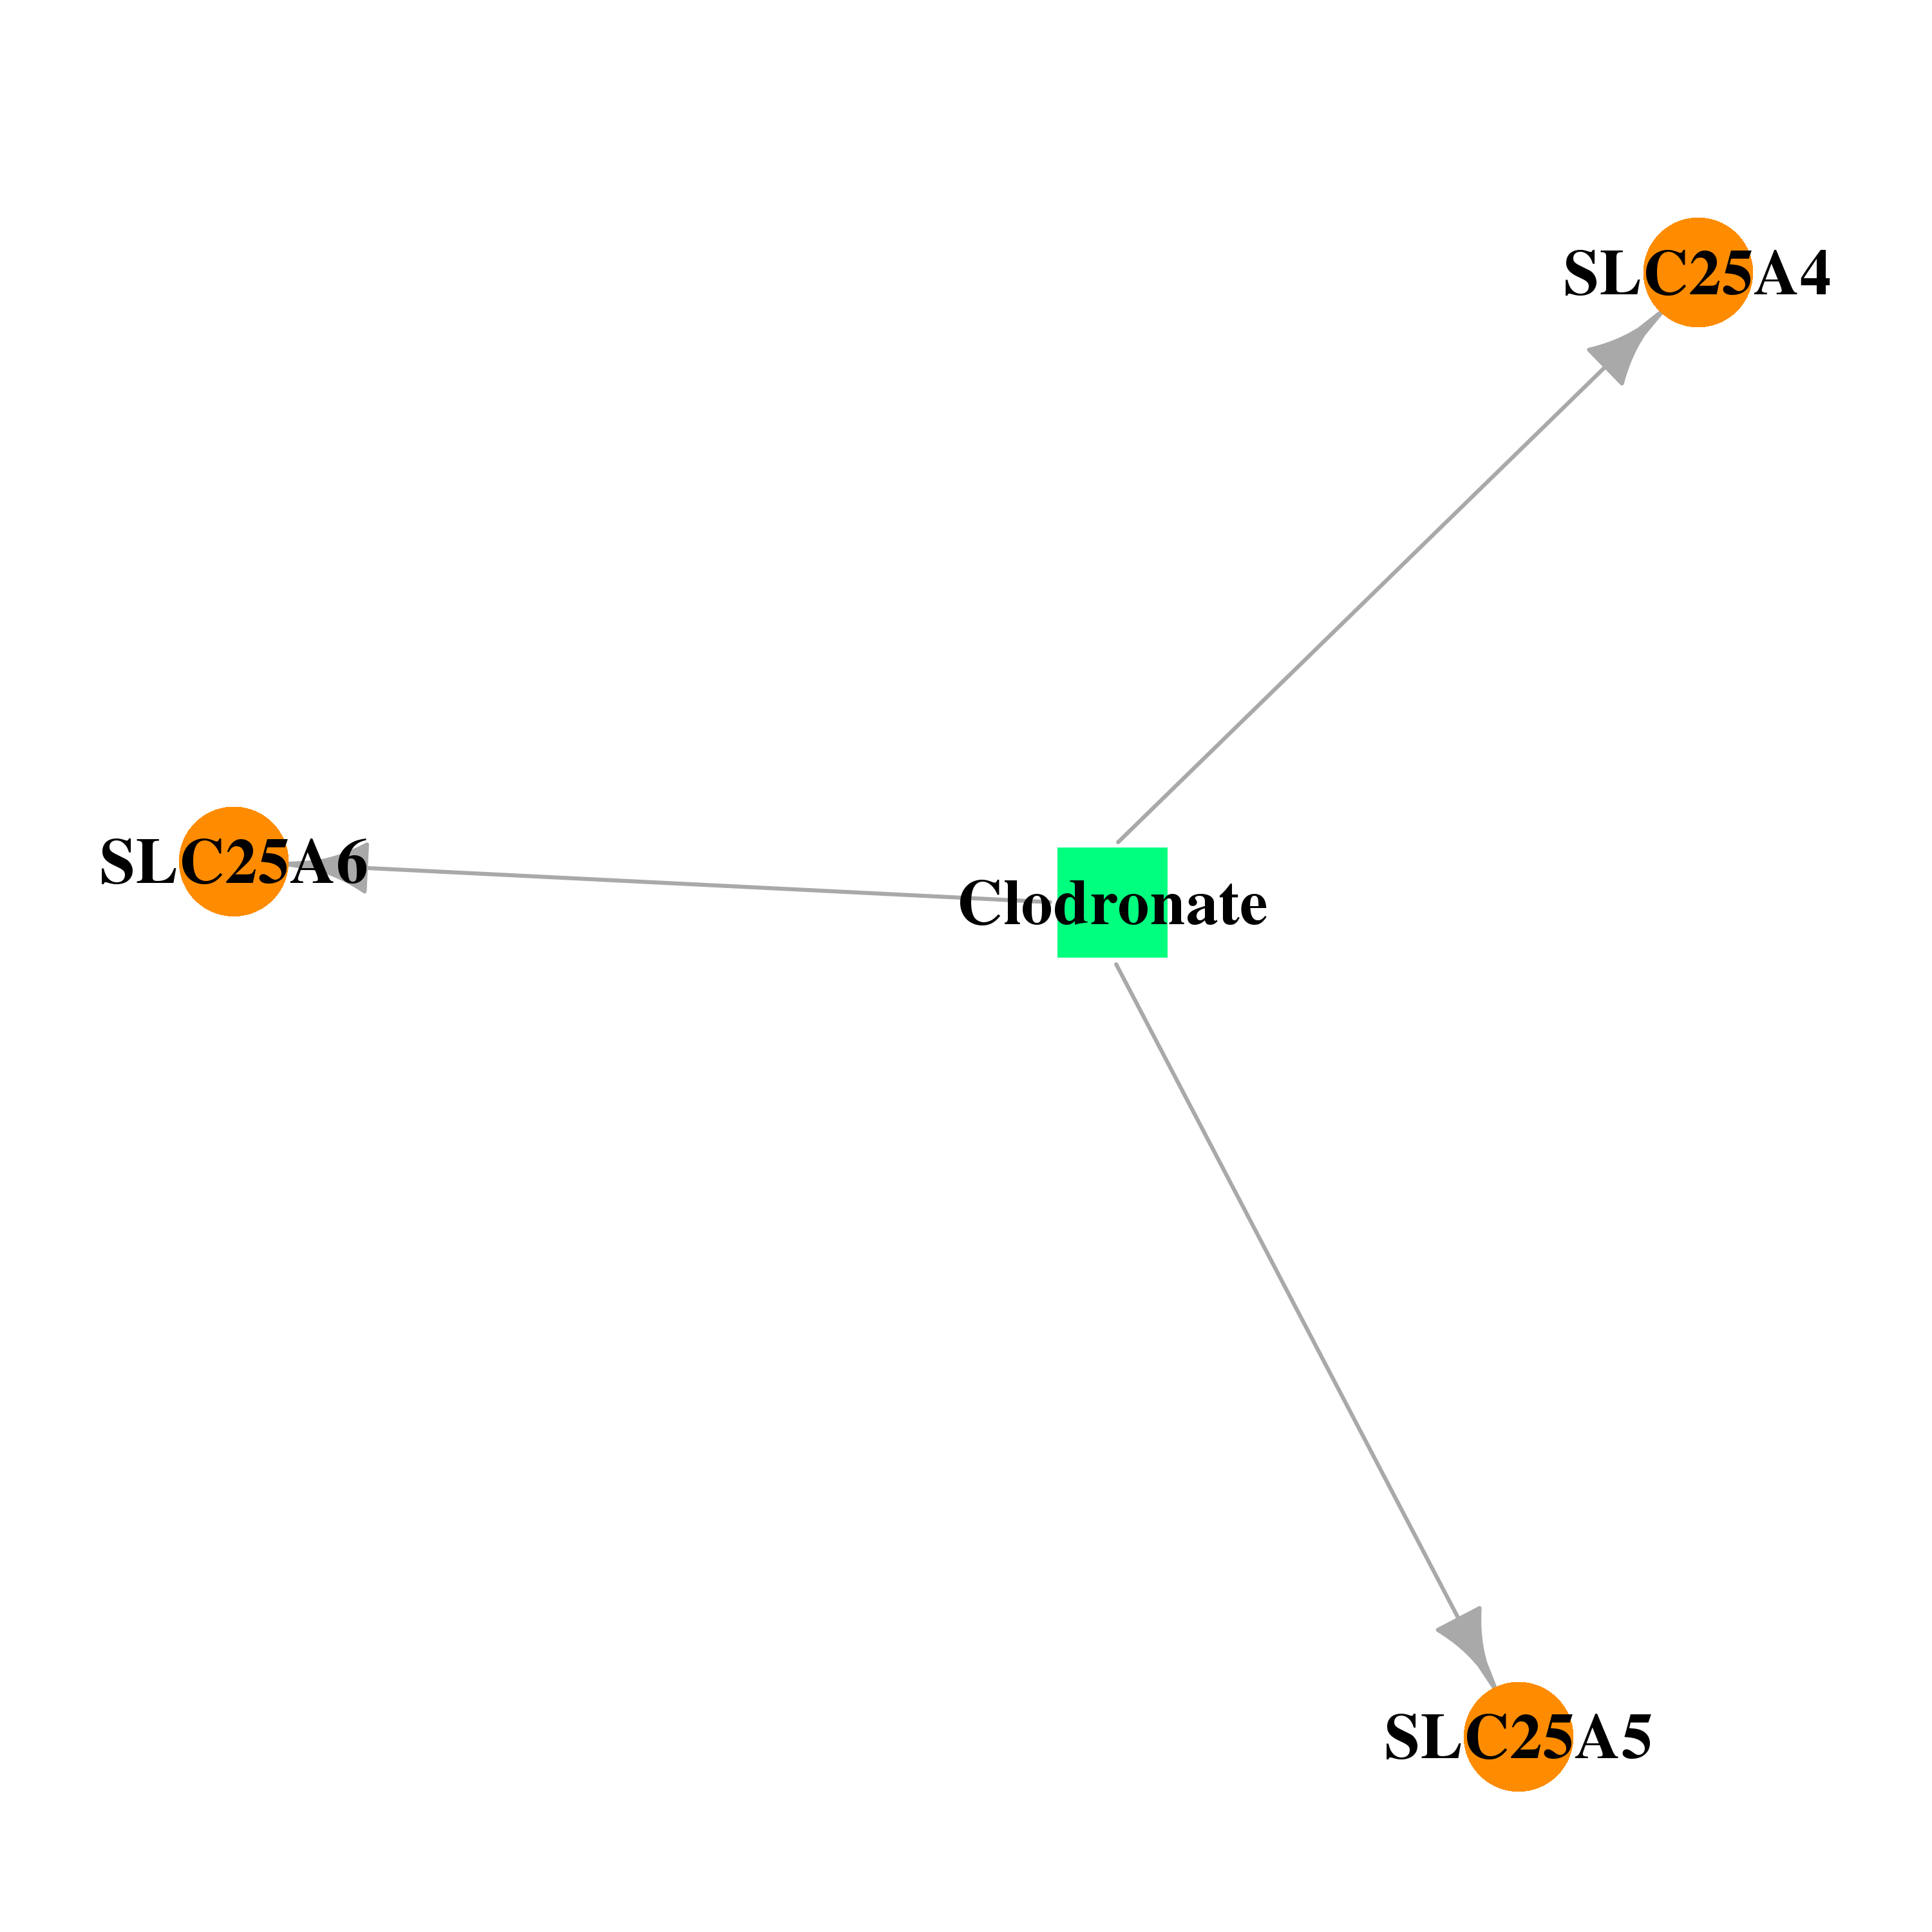 | 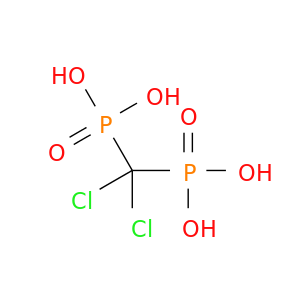 |
| DB01736 | solute carrier family 25 (mitochondrial carrier; adenine nucleotide translocator), member 4 | experimental | [3-(Dodecanoylamino)Propyl](Hydroxy)Dimethylammonium |  |  |
| DB02426 | solute carrier family 25 (mitochondrial carrier; adenine nucleotide translocator), member 4 | experimental | Carboxyatractyloside |  | 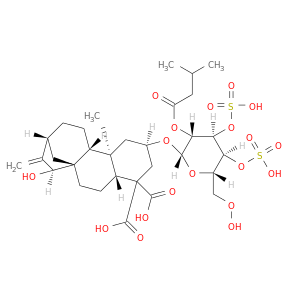 |
| DB03429 | solute carrier family 25 (mitochondrial carrier; adenine nucleotide translocator), member 4 | experimental | Cardiolipin |  |  |
| DB04178 | solute carrier family 25 (mitochondrial carrier; adenine nucleotide translocator), member 4 | experimental | Di-Stearoyl-3-Sn-Phosphatidylcholine |  |  |
| Top |
| Cross referenced IDs for SLC25A4 |
| * We obtained these cross-references from Uniprot database. It covers 150 different DBs, 18 categories. http://www.uniprot.org/help/cross_references_section |
: Open all cross reference information
|
Copyright © 2016-Present - The Univsersity of Texas Health Science Center at Houston @ |