|
||||||||||||||||||||
| |
| Phenotypic Information (metabolism pathway, cancer, disease, phenome) |
| |
| |
| Gene-Gene Network Information: Co-Expression Network, Interacting Genes & KEGG |
| |
|


| Gene Summary for SLC25A6 |
| Basic gene info. | Gene symbol | SLC25A6 |
| Gene name | solute carrier family 25 (mitochondrial carrier; adenine nucleotide translocator), member 6 | |
| Synonyms | 2|3|AAC3|ANT|ANT 2|ANT 3|ANT3|ANT3Y | |
| Cytomap | UCSC genome browser: Xp22.32 and Yp11.3 | |
| Genomic location | chrX :1505044-1511039 | |
| Type of gene | protein-coding | |
| RefGenes | NM_001636.3, | |
| Ensembl id | ENSG00000169100 | |
| Description | ADP,ATP carrier proteinADP,ATP carrier protein 3ADP,ATP carrier protein, liverADP/ATP translocase 3ADP/ATP translocator of liveradenine nucleotide translocator 3solute carrier family 25 member 6 | |
| Modification date | 20141207 | |
| dbXrefs | MIM : 300151 | |
| MIM : 403000 | ||
| HGNC : HGNC | ||
| HPRD : 02461 | ||
| Protein | UniProt: go to UniProt's Cross Reference DB Table | |
| Expression | CleanEX: HS_SLC25A6 | |
| BioGPS: 293 | ||
| Gene Expression Atlas: ENSG00000169100 | ||
| The Human Protein Atlas: ENSG00000169100 | ||
| Pathway | NCI Pathway Interaction Database: SLC25A6 | |
| KEGG: SLC25A6 | ||
| REACTOME: SLC25A6 | ||
| ConsensusPathDB | ||
| Pathway Commons: SLC25A6 | ||
| Metabolism | MetaCyc: SLC25A6 | |
| HUMANCyc: SLC25A6 | ||
| Regulation | Ensembl's Regulation: ENSG00000169100 | |
| miRBase: chrX :1,505,044-1,511,039 | ||
| TargetScan: NM_001636 | ||
| cisRED: ENSG00000169100 | ||
| Context | iHOP: SLC25A6 | |
| cancer metabolism search in PubMed: SLC25A6 | ||
| UCL Cancer Institute: SLC25A6 | ||
| Assigned class in ccmGDB | C | |
| Top |
| Phenotypic Information for SLC25A6(metabolism pathway, cancer, disease, phenome) |
| Cancer | CGAP: SLC25A6 |
| Familial Cancer Database: SLC25A6 | |
| * This gene is included in those cancer gene databases. |
|
|
|
|
|
|
| ||||||||||||||
Oncogene 1 | Significant driver gene in | |||||||||||||||||||
| cf) number; DB name 1 Oncogene; http://nar.oxfordjournals.org/content/35/suppl_1/D721.long, 2 Tumor Suppressor gene; https://bioinfo.uth.edu/TSGene/, 3 Cancer Gene Census; http://www.nature.com/nrc/journal/v4/n3/abs/nrc1299.html, 4 CancerGenes; http://nar.oxfordjournals.org/content/35/suppl_1/D721.long, 5 Network of Cancer Gene; http://ncg.kcl.ac.uk/index.php, 1Therapeutic Vulnerabilities in Cancer; http://cbio.mskcc.org/cancergenomics/statius/ |
| REACTOME_INTEGRATION_OF_ENERGY_METABOLISM REACTOME_METABOLISM_OF_PROTEINS | |
| Mutations for SLC25A6 |
| * Under tables are showing count per each tissue to give us broad intuition about tissue specific mutation patterns.You can go to the detailed page for each mutation database's web site. |
| There's no structural variation information in COSMIC data for this gene. |
| * From mRNA Sanger sequences, Chitars2.0 arranged chimeric transcripts. This table shows SLC25A6 related fusion information. |
| ID | Head Gene | Tail Gene | Accession | Gene_a | qStart_a | qEnd_a | Chromosome_a | tStart_a | tEnd_a | Gene_a | qStart_a | qEnd_a | Chromosome_a | tStart_a | tEnd_a |
| Top |
| There's no copy number variation information in COSMIC data for this gene. |
| Top |
|
 |
| Top |
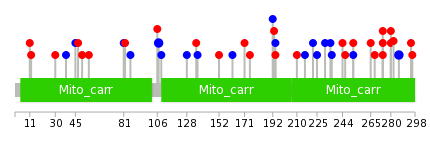
| Stat. for Non-Synonymous SNVs (# total SNVs=19) | (# total SNVs=14) |
 |  |
(# total SNVs=2) | (# total SNVs=0) |
 |
| Top |
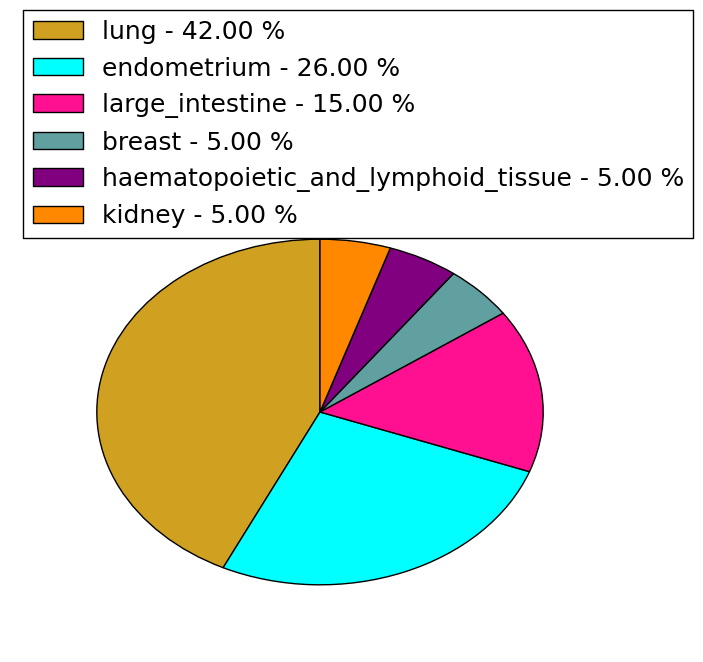
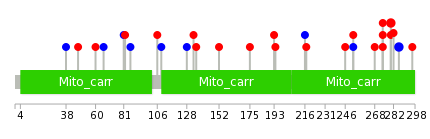
| * When you move the cursor on each content, you can see more deailed mutation information on the Tooltip. Those are primary_site,primary_histology,mutation(aa),pubmedID. |
| GRCh37 position | Mutation(aa) | Unique sampleID count |
| chr23:1506318-1506318 | p.? | 3 |
| chr23:1505534-1505534 | p.F286F | 2 |
| chr23:1508411-1508411 | p.T107T | 2 |
| chr23:1505546-1505546 | p.G284fs*14 | 2 |
| chr23:1505571-1505571 | p.A274E | 2 |
| chr23:1506263-1506263 | p.I216I | 1 |
| chr23:1508324-1508324 | p.F136F | 1 |
| chr23:1505599-1505599 | p.E265K | 1 |
| chr23:1508583-1508583 | p.Q50R | 1 |
| chr23:1506283-1506283 | p.I210V | 1 |
| Top |
|
 |
| Point Mutation/ Tissue ID | 1 | 2 | 3 | 4 | 5 | 6 | 7 | 8 | 9 | 10 | 11 | 12 | 13 | 14 | 15 | 16 | 17 | 18 | 19 | 20 |
| # sample | 2 | 1 | 1 | 1 | 1 | 1 | 6 | 1 | 3 | 4 | 7 | |||||||||
| # mutation | 2 | 1 | 1 | 1 | 1 | 1 | 6 | 1 | 3 | 5 | 8 | |||||||||
| nonsynonymous SNV | 1 | 1 | 1 | 5 | 1 | 2 | 5 | 4 | ||||||||||||
| synonymous SNV | 1 | 1 | 1 | 1 | 1 | 1 | 4 |
| cf) Tissue ID; Tissue type (1; BLCA[Bladder Urothelial Carcinoma], 2; BRCA[Breast invasive carcinoma], 3; CESC[Cervical squamous cell carcinoma and endocervical adenocarcinoma], 4; COAD[Colon adenocarcinoma], 5; GBM[Glioblastoma multiforme], 6; Glioma Low Grade, 7; HNSC[Head and Neck squamous cell carcinoma], 8; KICH[Kidney Chromophobe], 9; KIRC[Kidney renal clear cell carcinoma], 10; KIRP[Kidney renal papillary cell carcinoma], 11; LAML[Acute Myeloid Leukemia], 12; LUAD[Lung adenocarcinoma], 13; LUSC[Lung squamous cell carcinoma], 14; OV[Ovarian serous cystadenocarcinoma ], 15; PAAD[Pancreatic adenocarcinoma], 16; PRAD[Prostate adenocarcinoma], 17; SKCM[Skin Cutaneous Melanoma], 18:STAD[Stomach adenocarcinoma], 19:THCA[Thyroid carcinoma], 20:UCEC[Uterine Corpus Endometrial Carcinoma]) |
| Top |
| * We represented just top 10 SNVs. When you move the cursor on each content, you can see more deailed mutation information on the Tooltip. Those are primary_site, primary_histology, mutation(aa), pubmedID. |
| Genomic Position | Mutation(aa) | Unique sampleID count |
| chrX:1505534 | p.F286F | 2 |
| chrX:1505553 | p.R280L | 2 |
| chrX:1505571 | p.A274E | 2 |
| chrX:1508405 | p.K268R | 1 |
| chrX:1506175 | p.F82L | 1 |
| chrX:1508415 | p.T252T | 1 |
| chrX:1505504 | p.Y81Y | 1 |
| chrX:1506261 | p.T252M | 1 |
| chrX:1508474 | p.G66G | 1 |
| chrX:1506263 | p.G246R | 1 |
| * Copy number data were extracted from TCGA using R package TCGA-Assembler. The URLs of all public data files on TCGA DCC data server were gathered on Jan-05-2015. Function ProcessCNAData in TCGA-Assembler package was used to obtain gene-level copy number value which is calculated as the average copy number of the genomic region of a gene. |
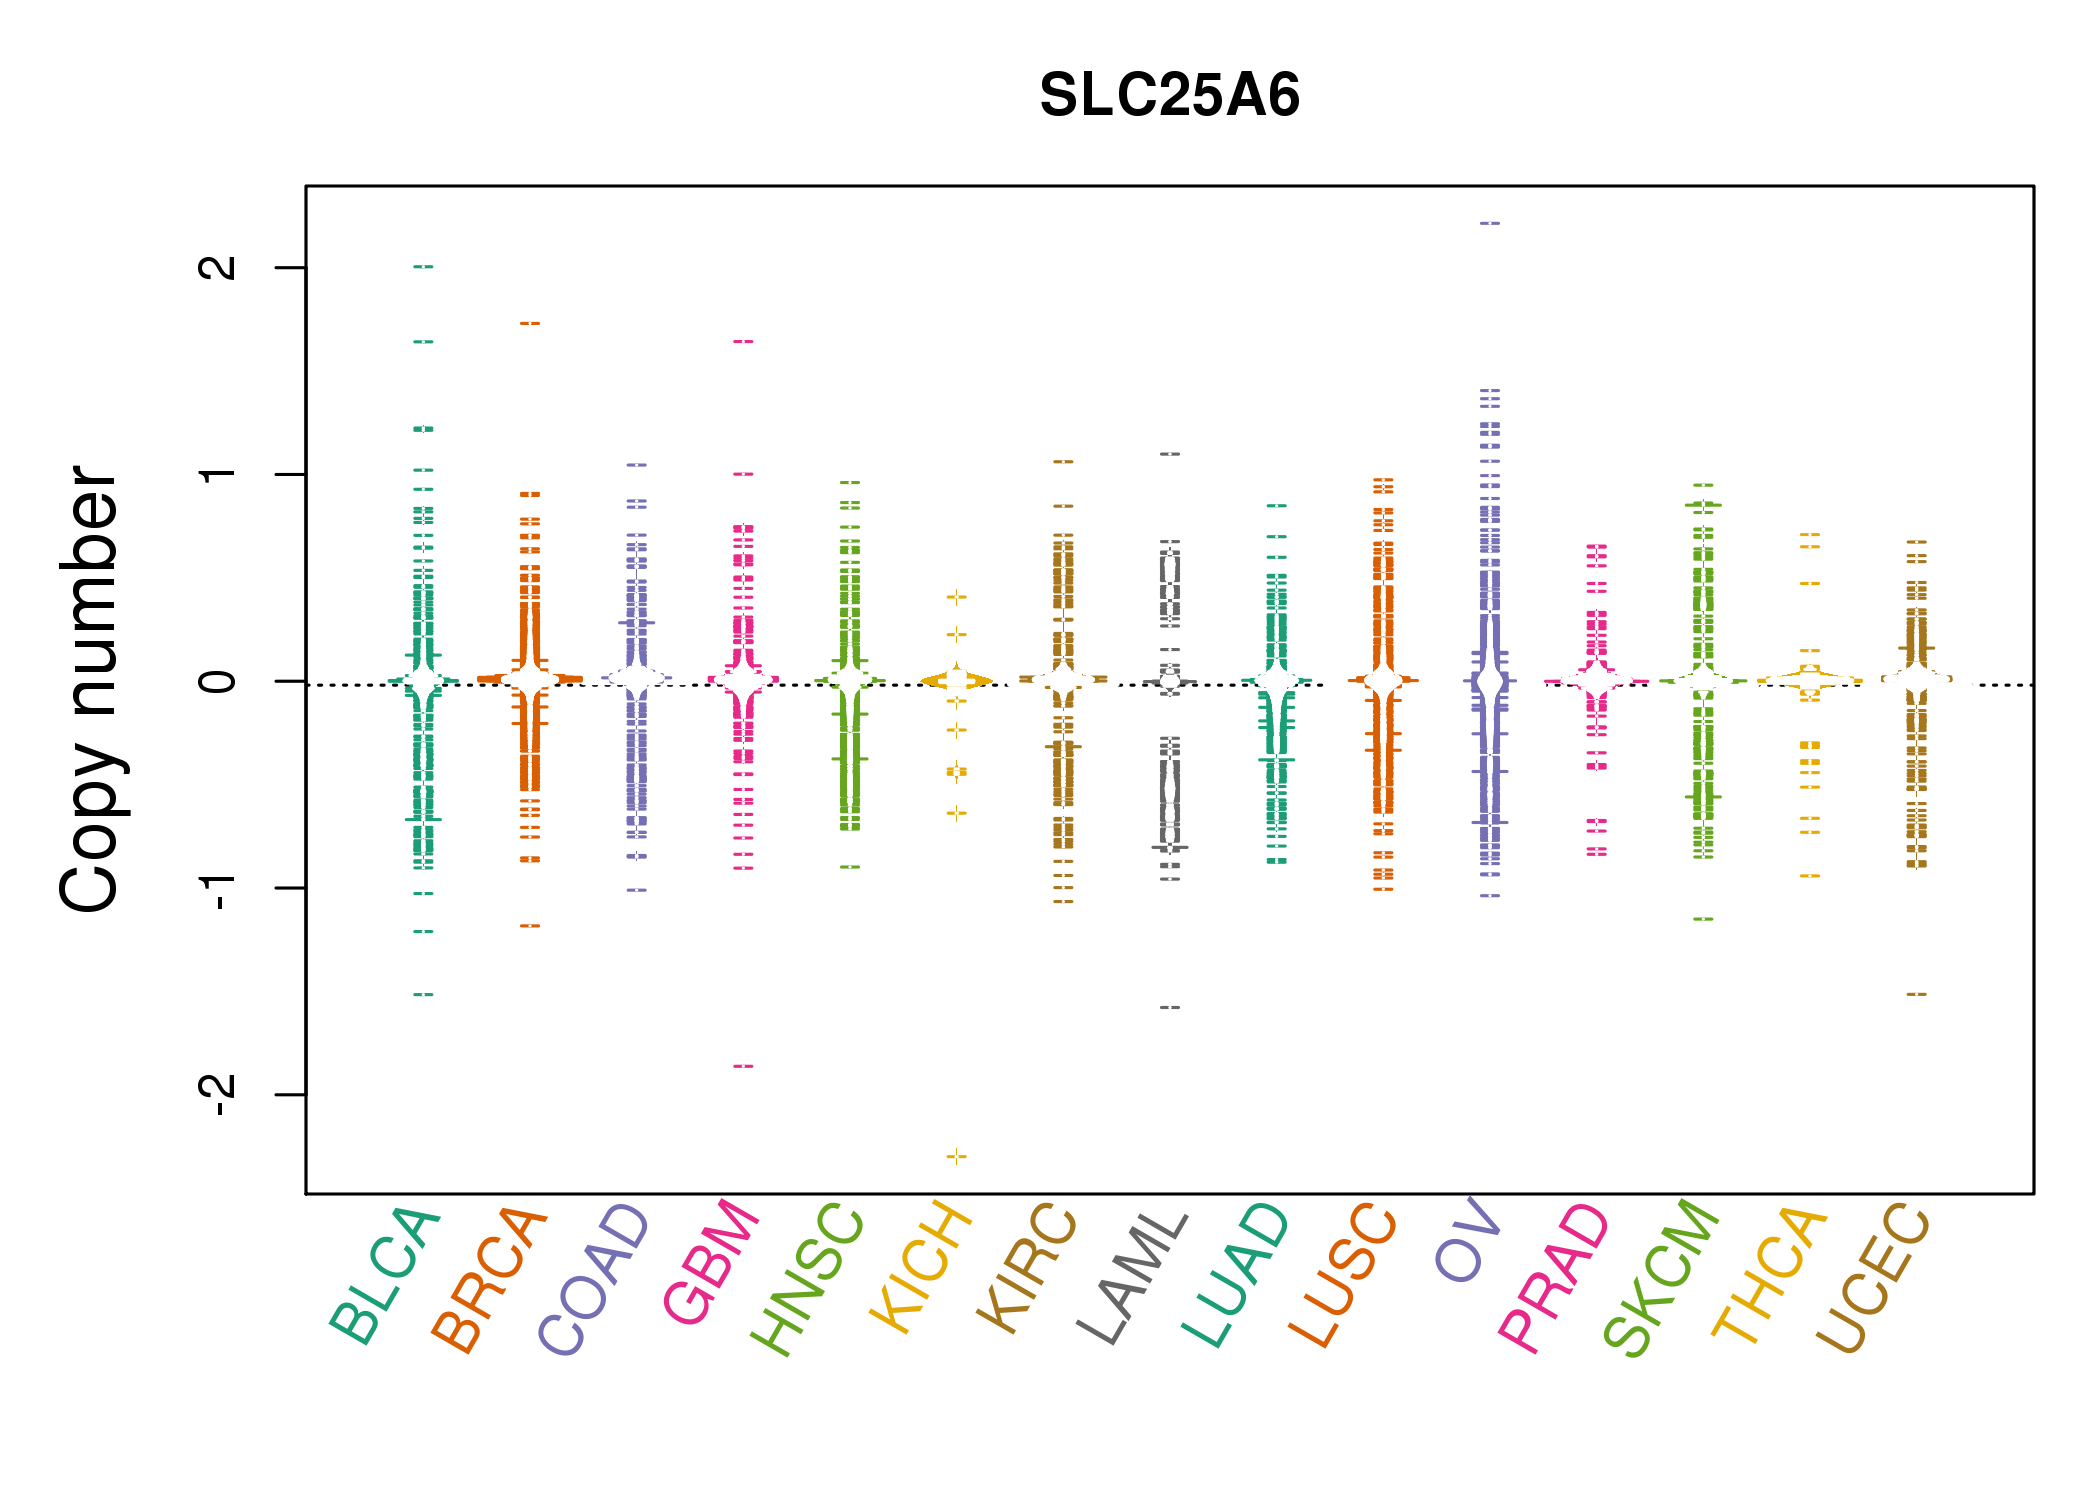 |
| cf) Tissue ID[Tissue type]: BLCA[Bladder Urothelial Carcinoma], BRCA[Breast invasive carcinoma], CESC[Cervical squamous cell carcinoma and endocervical adenocarcinoma], COAD[Colon adenocarcinoma], GBM[Glioblastoma multiforme], Glioma Low Grade, HNSC[Head and Neck squamous cell carcinoma], KICH[Kidney Chromophobe], KIRC[Kidney renal clear cell carcinoma], KIRP[Kidney renal papillary cell carcinoma], LAML[Acute Myeloid Leukemia], LUAD[Lung adenocarcinoma], LUSC[Lung squamous cell carcinoma], OV[Ovarian serous cystadenocarcinoma ], PAAD[Pancreatic adenocarcinoma], PRAD[Prostate adenocarcinoma], SKCM[Skin Cutaneous Melanoma], STAD[Stomach adenocarcinoma], THCA[Thyroid carcinoma], UCEC[Uterine Corpus Endometrial Carcinoma] |
| Top |
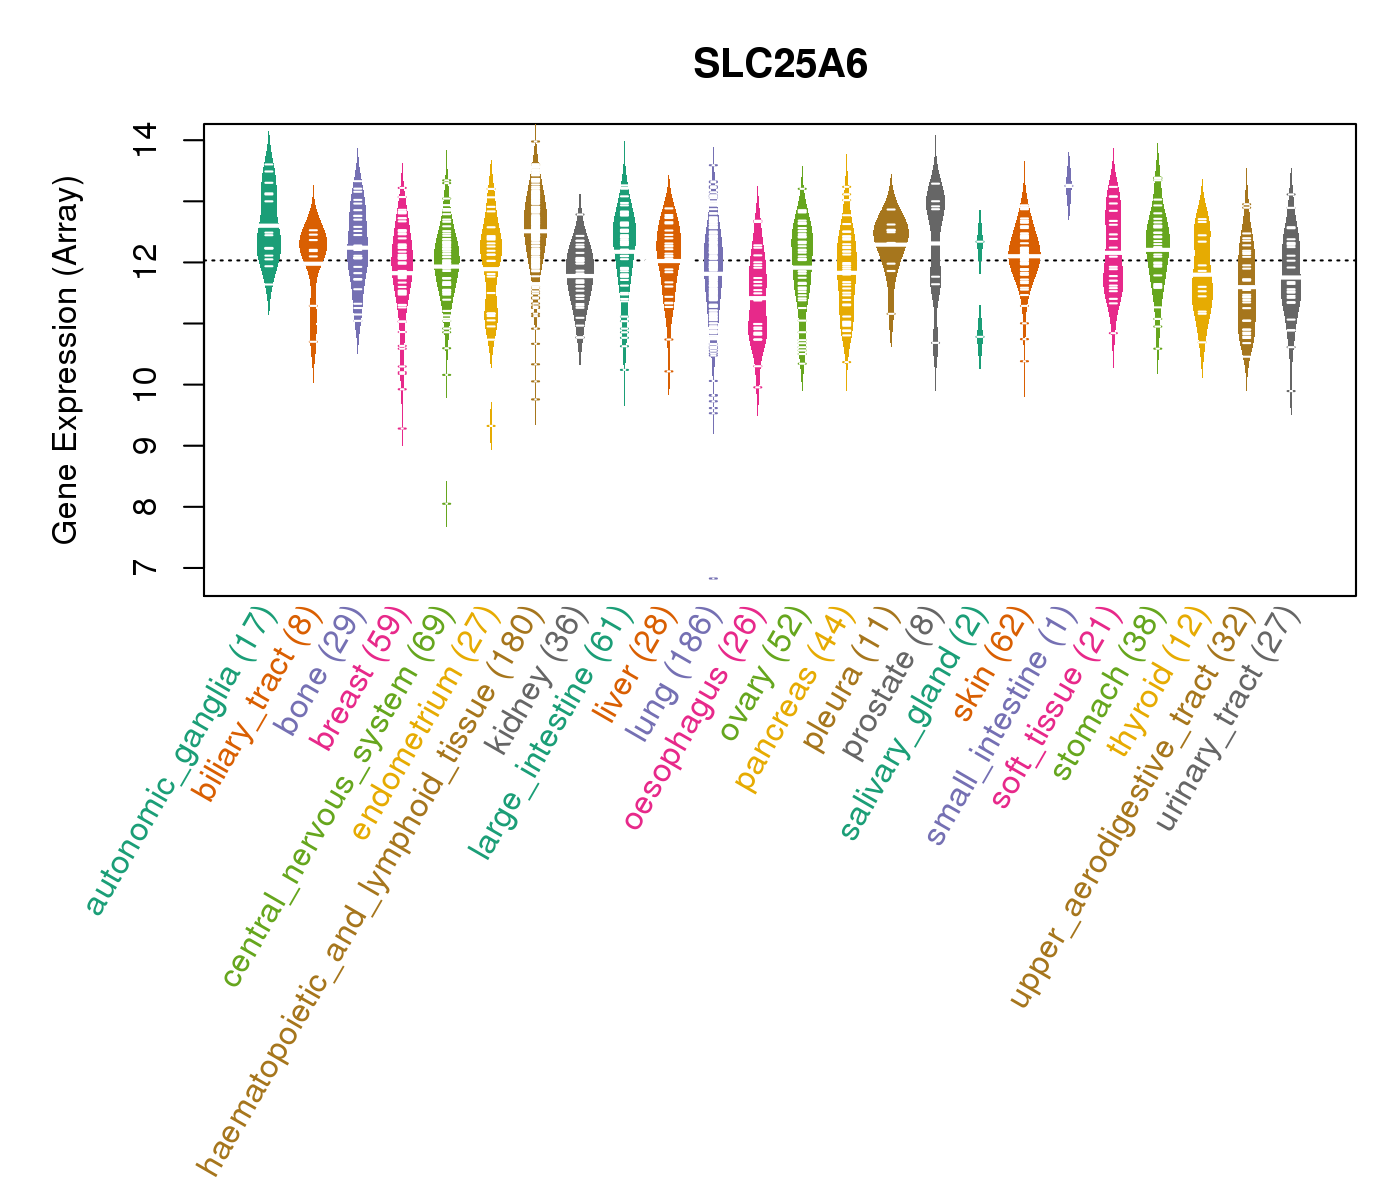
| Gene Expression for SLC25A6 |
| * CCLE gene expression data were extracted from CCLE_Expression_Entrez_2012-10-18.res: Gene-centric RMA-normalized mRNA expression data. |
 |
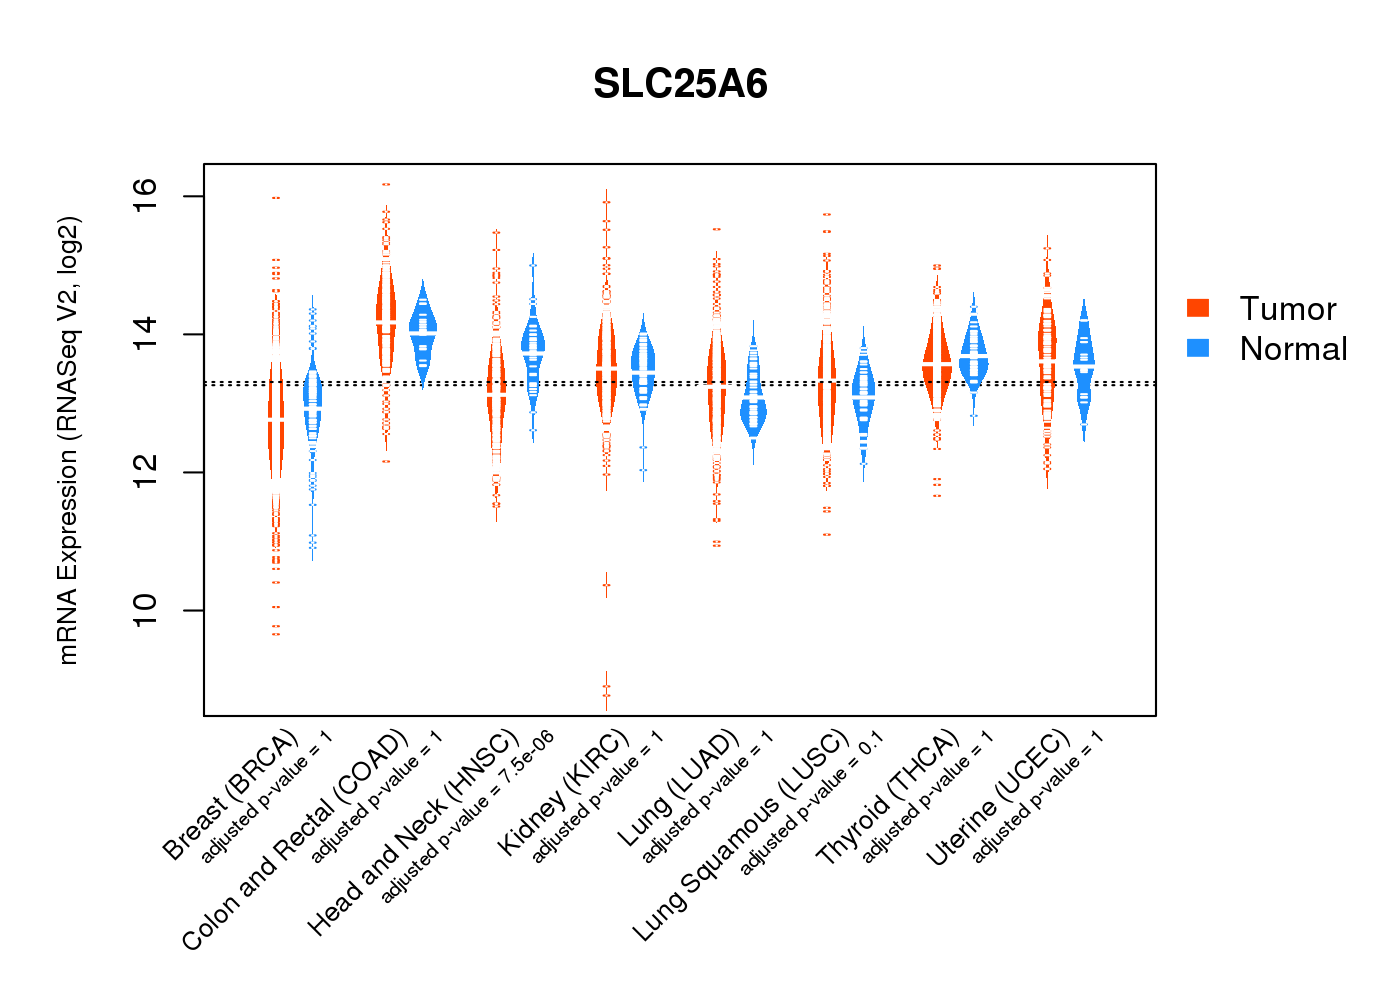
| * Normalized gene expression data of RNASeqV2 was extracted from TCGA using R package TCGA-Assembler. The URLs of all public data files on TCGA DCC data server were gathered at Jan-05-2015. Only eight cancer types have enough normal control samples for differential expression analysis. (t test, adjusted p<0.05 (using Benjamini-Hochberg FDR)) |
 |
| Top |
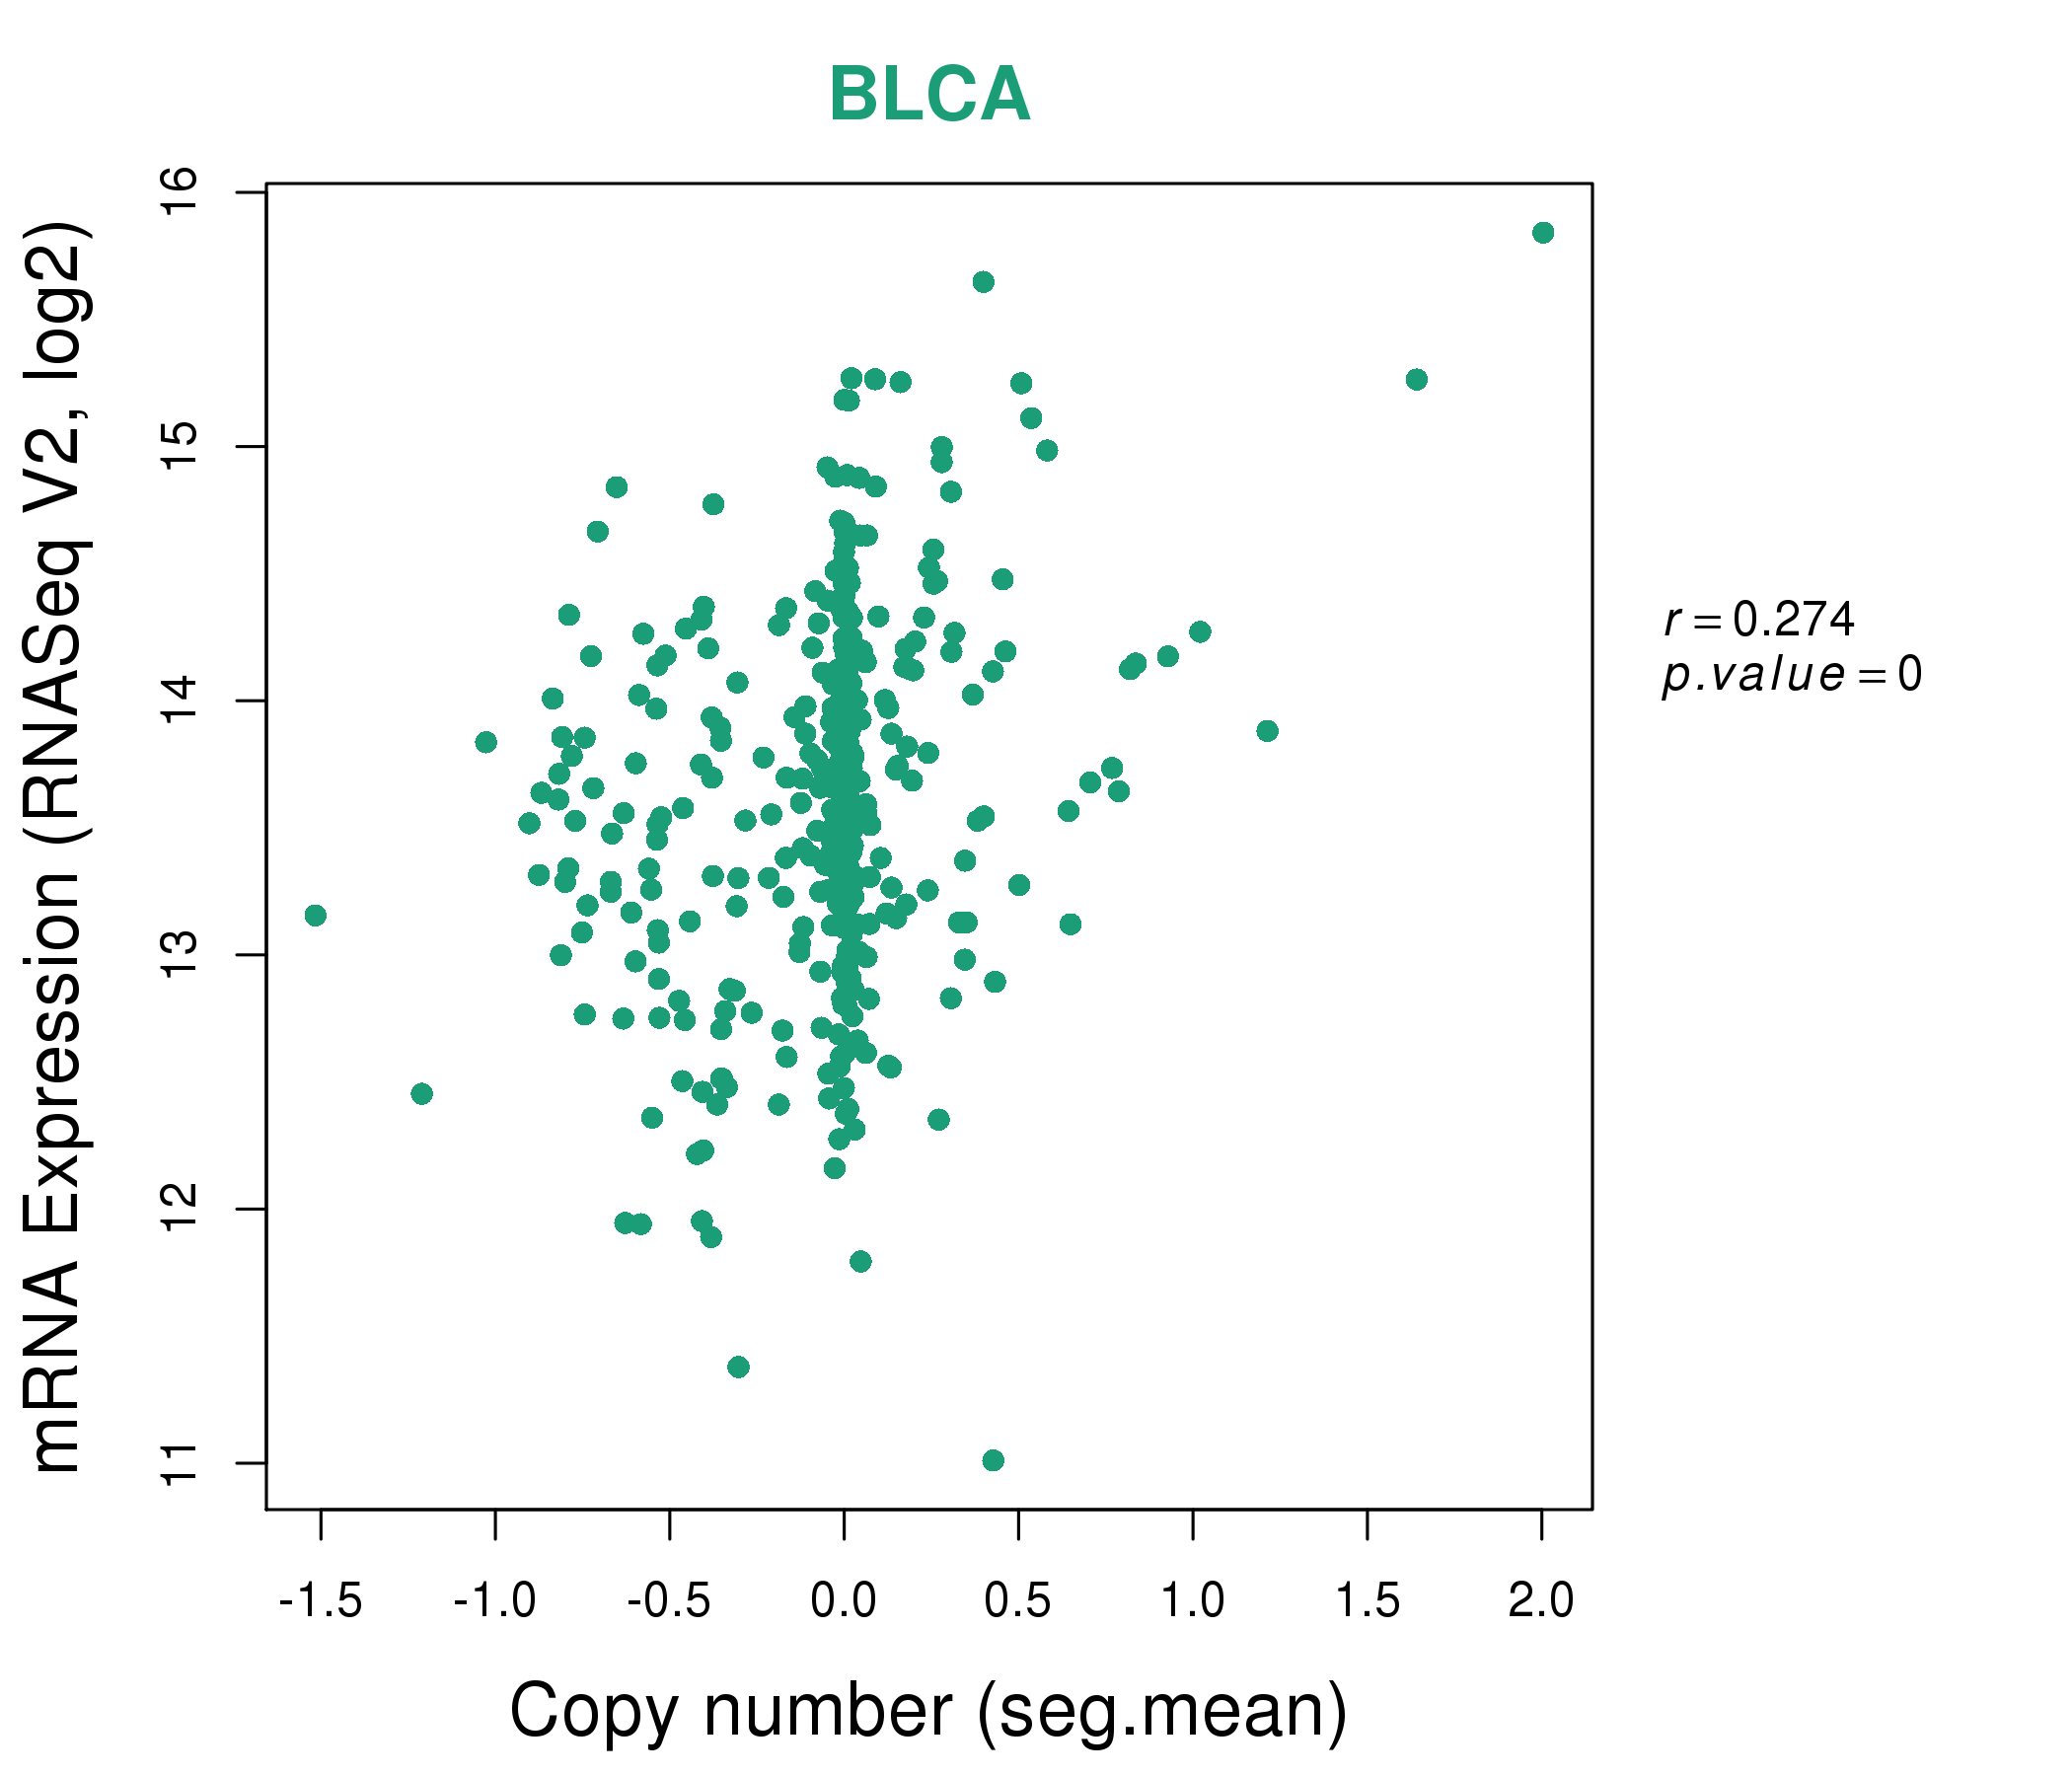
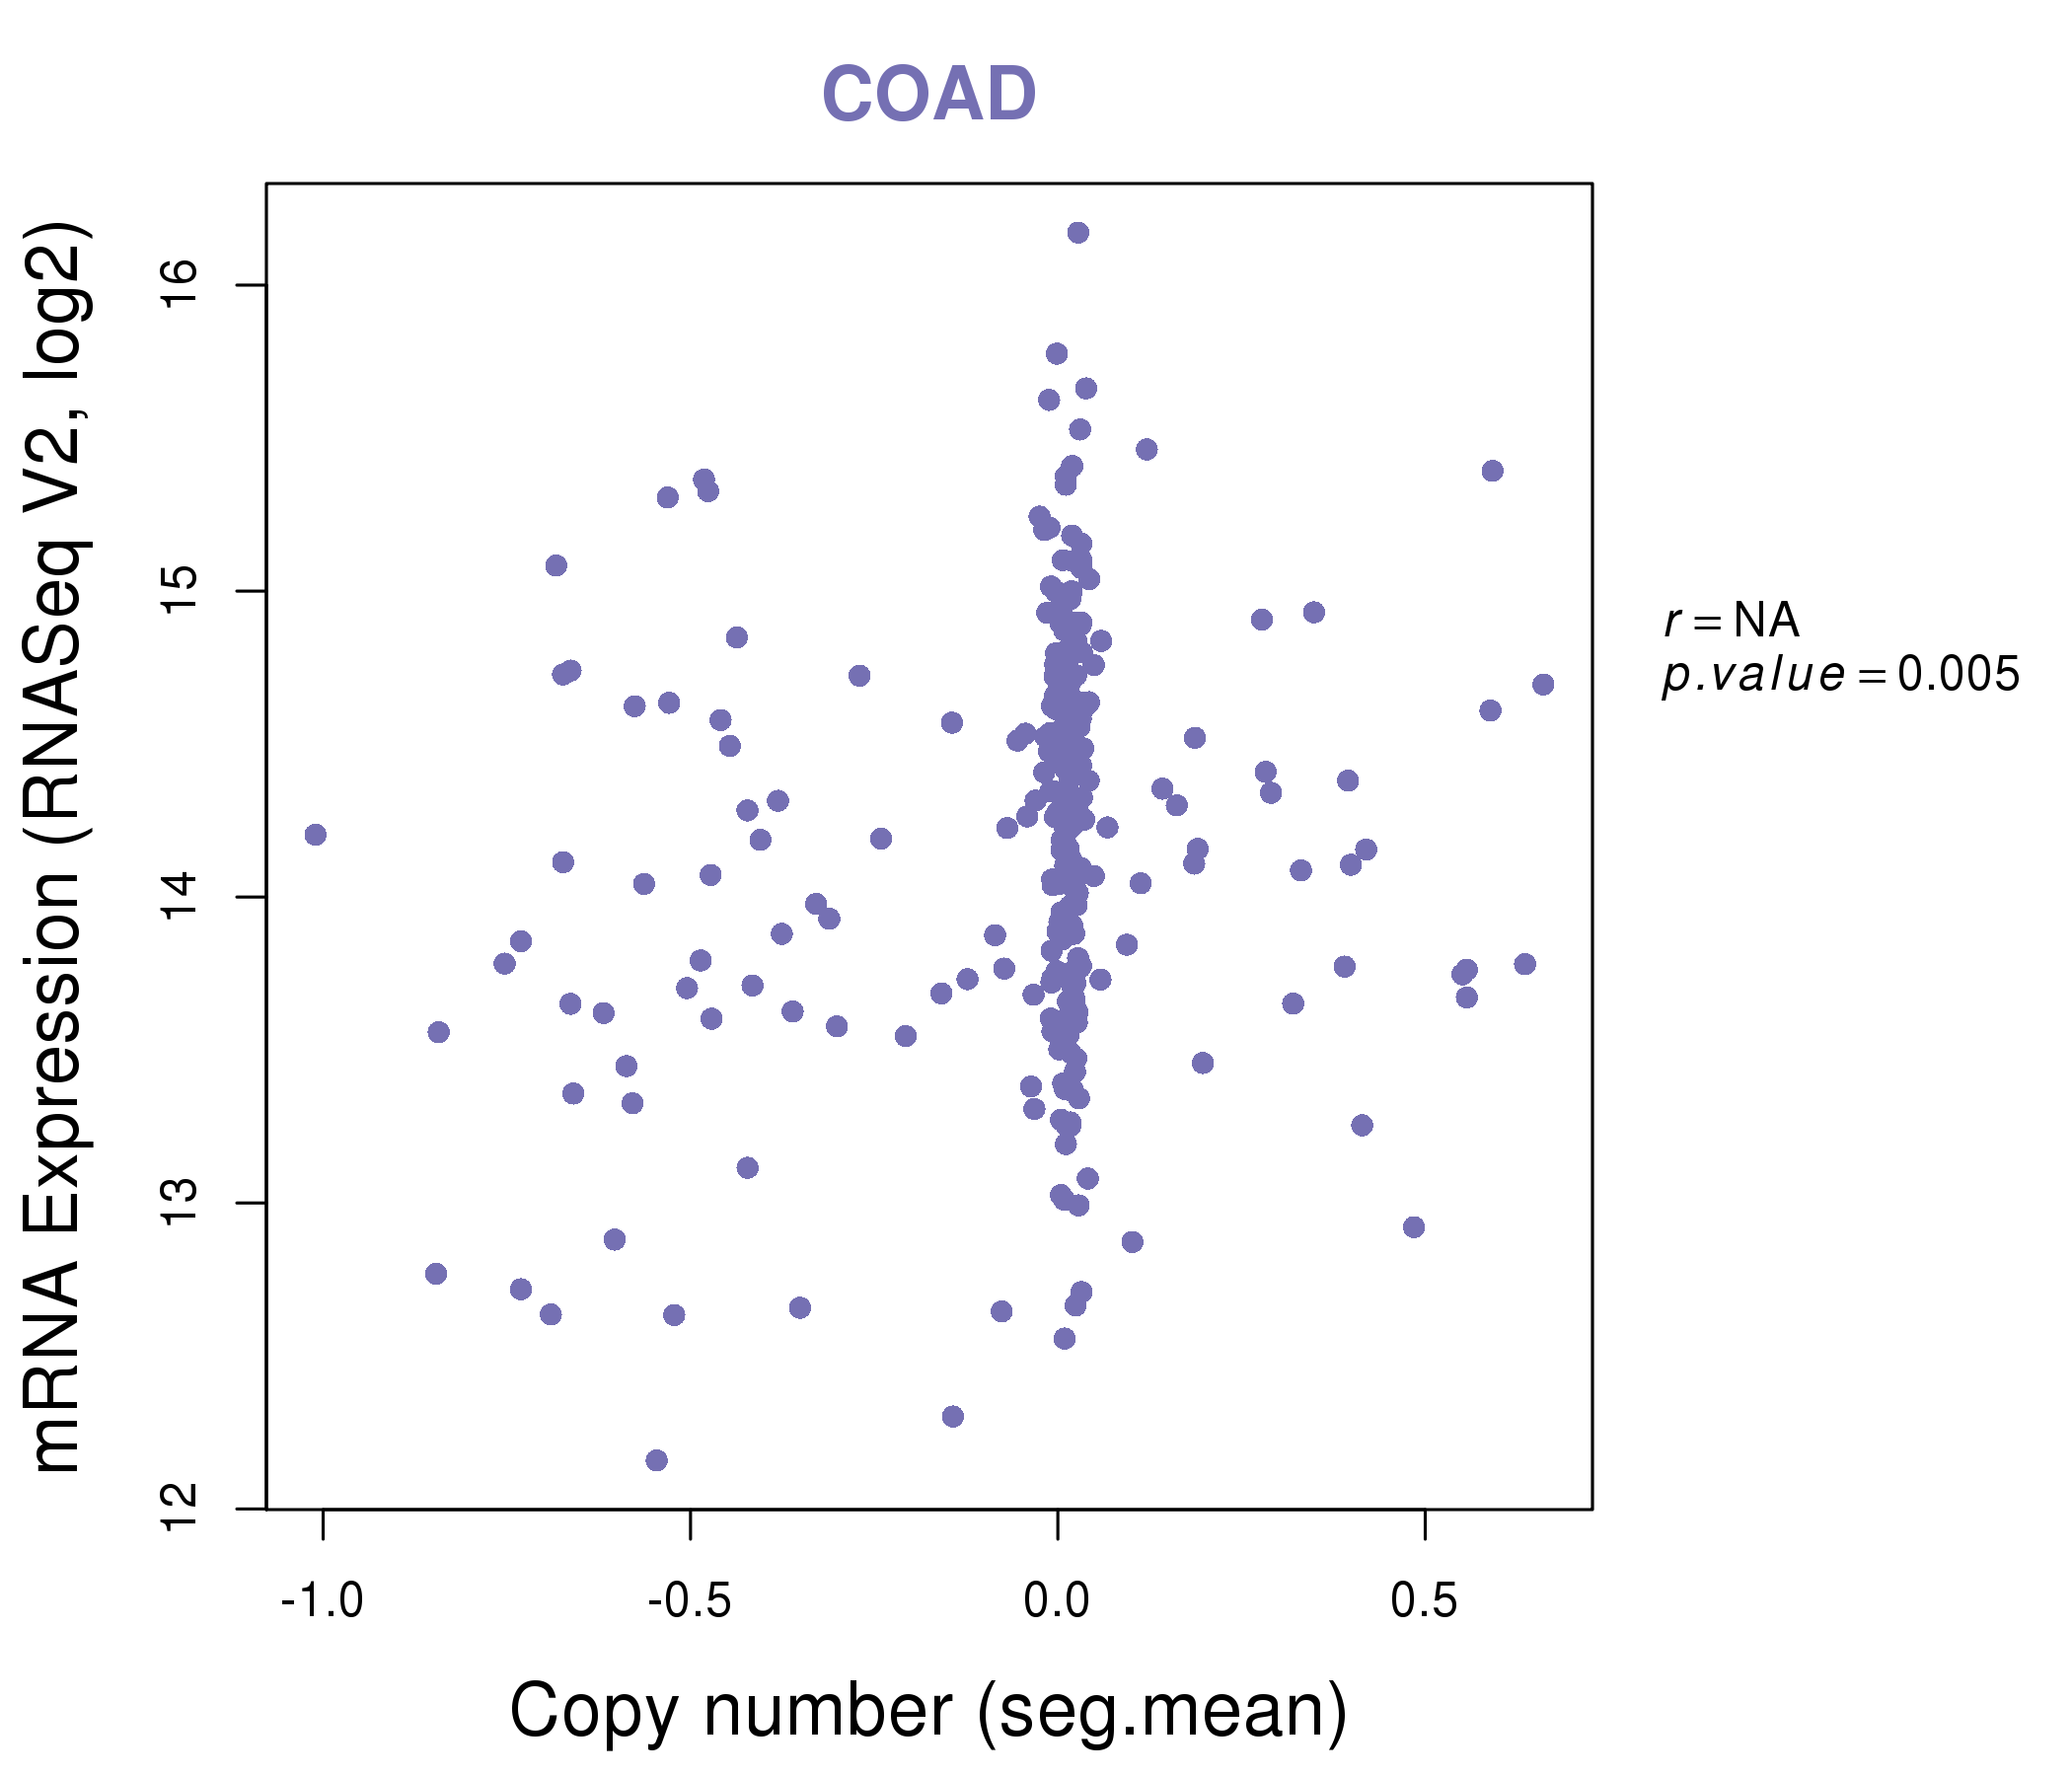
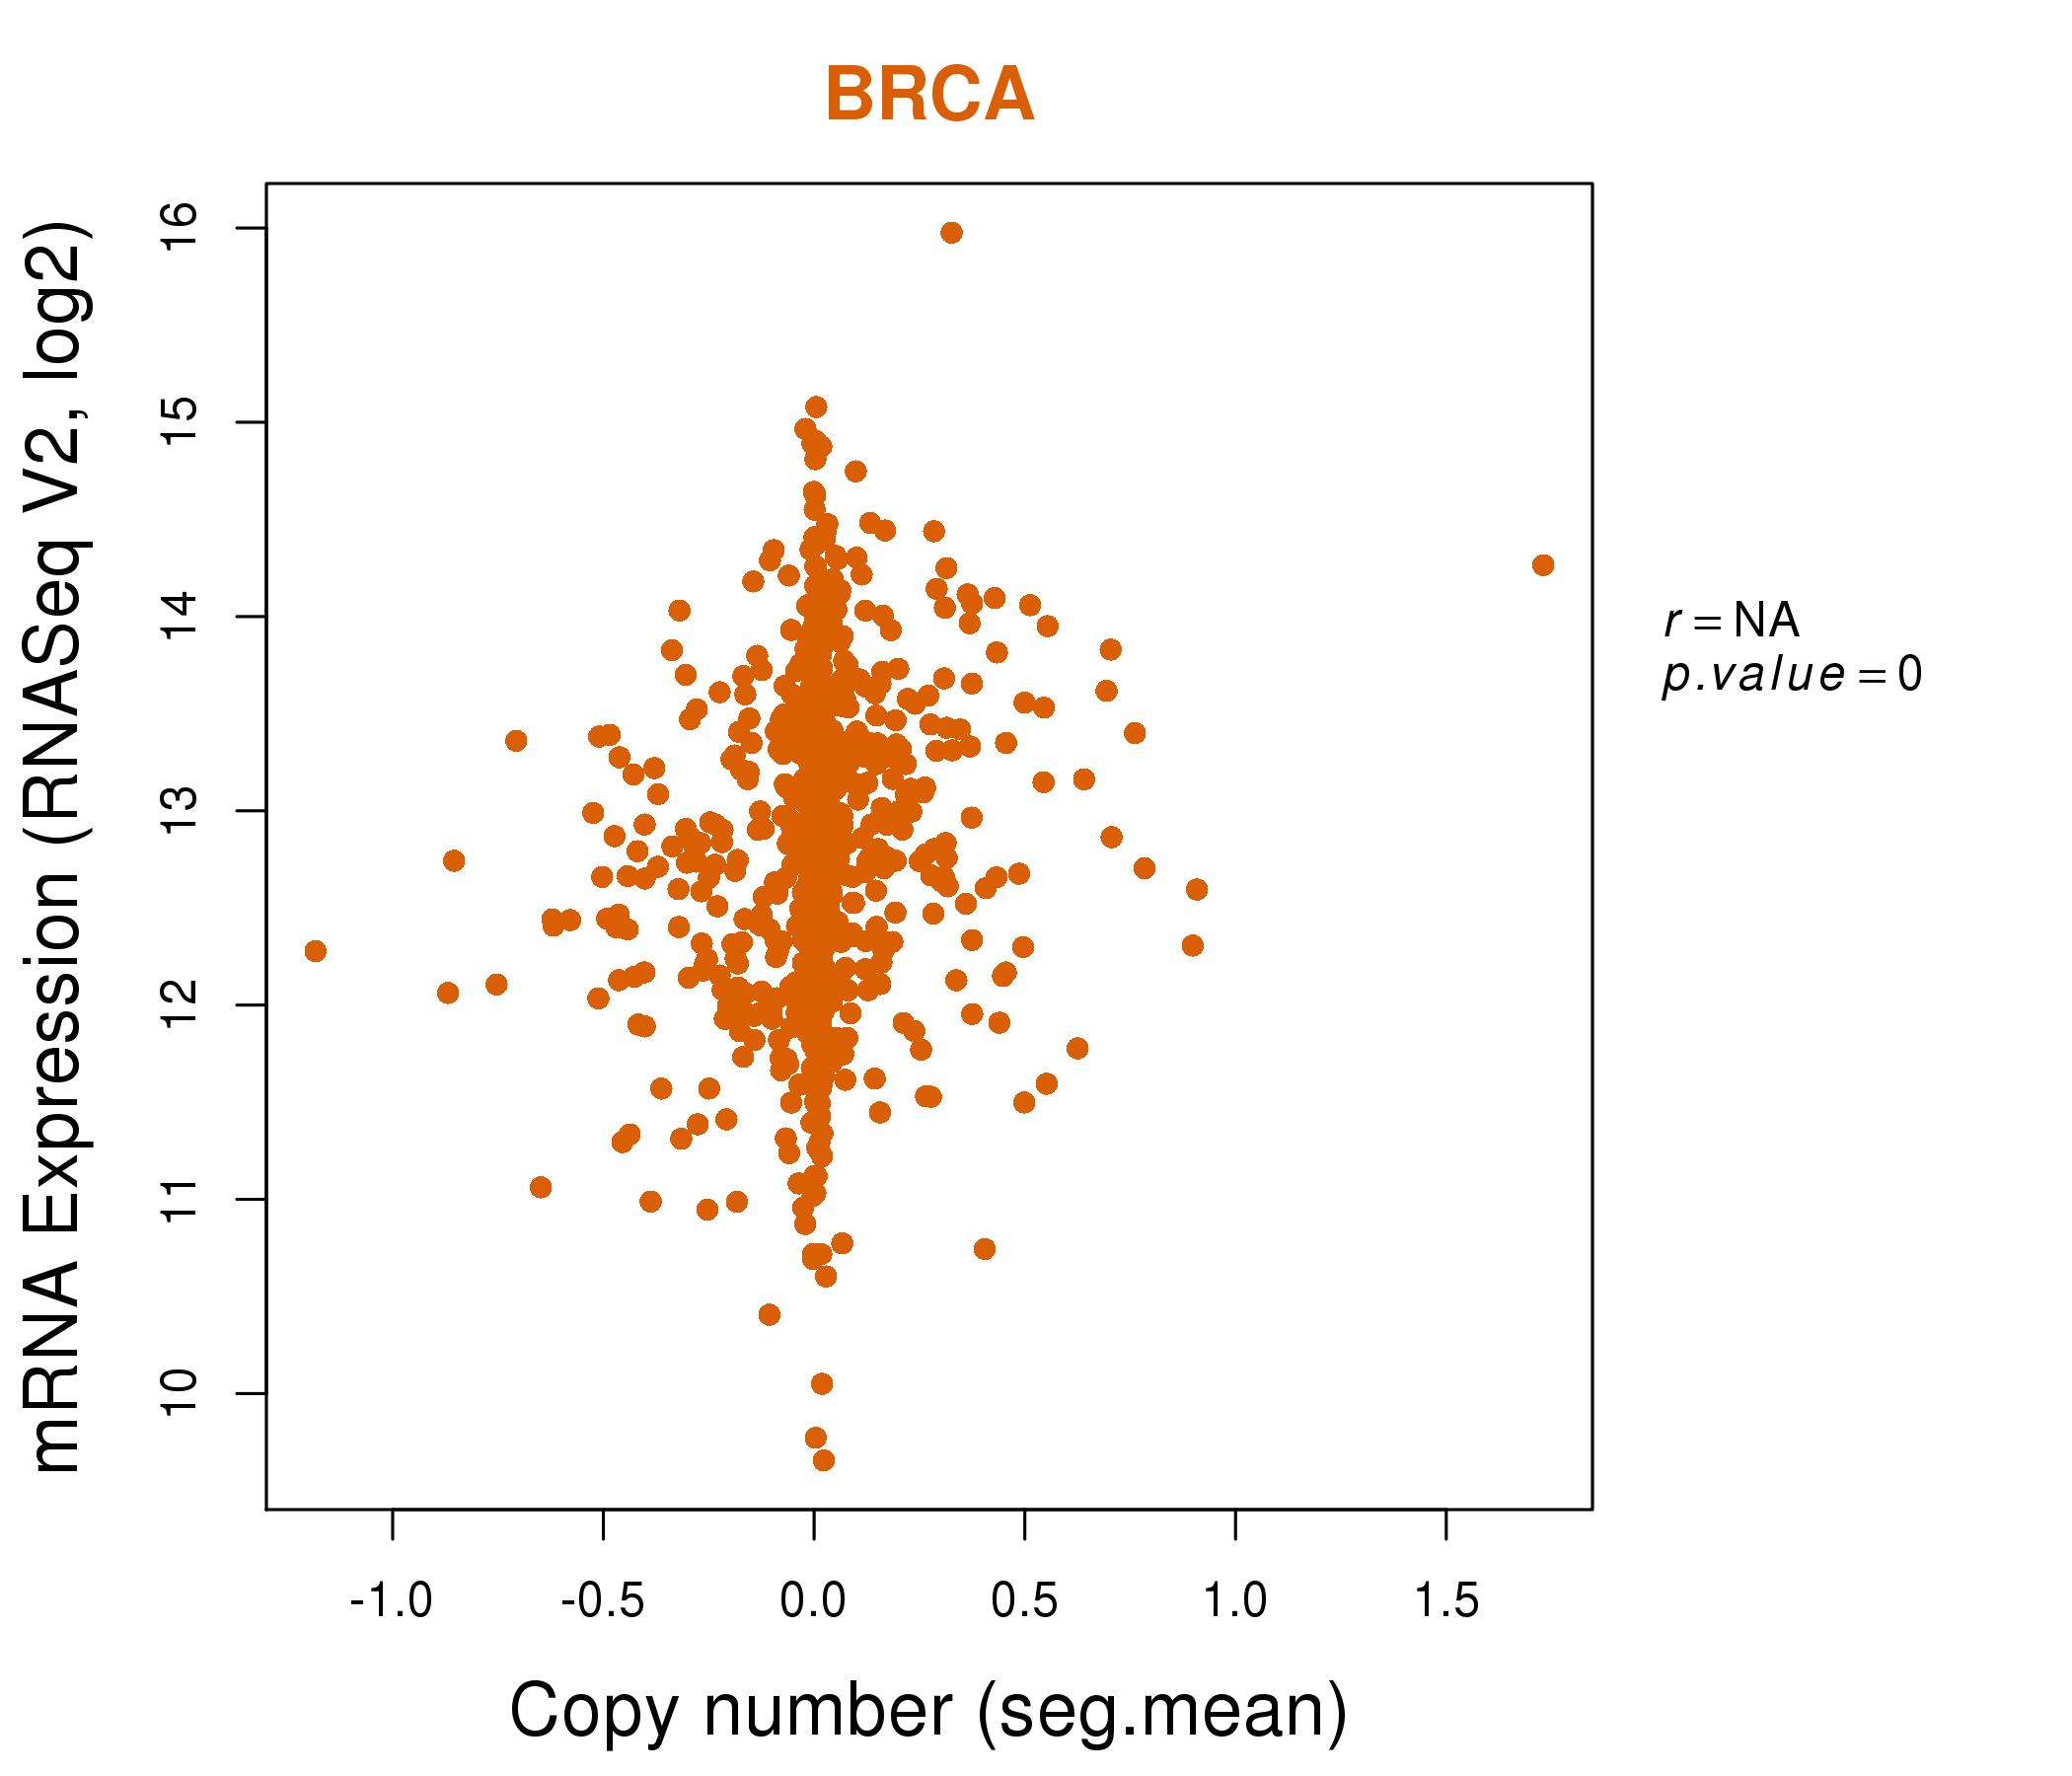
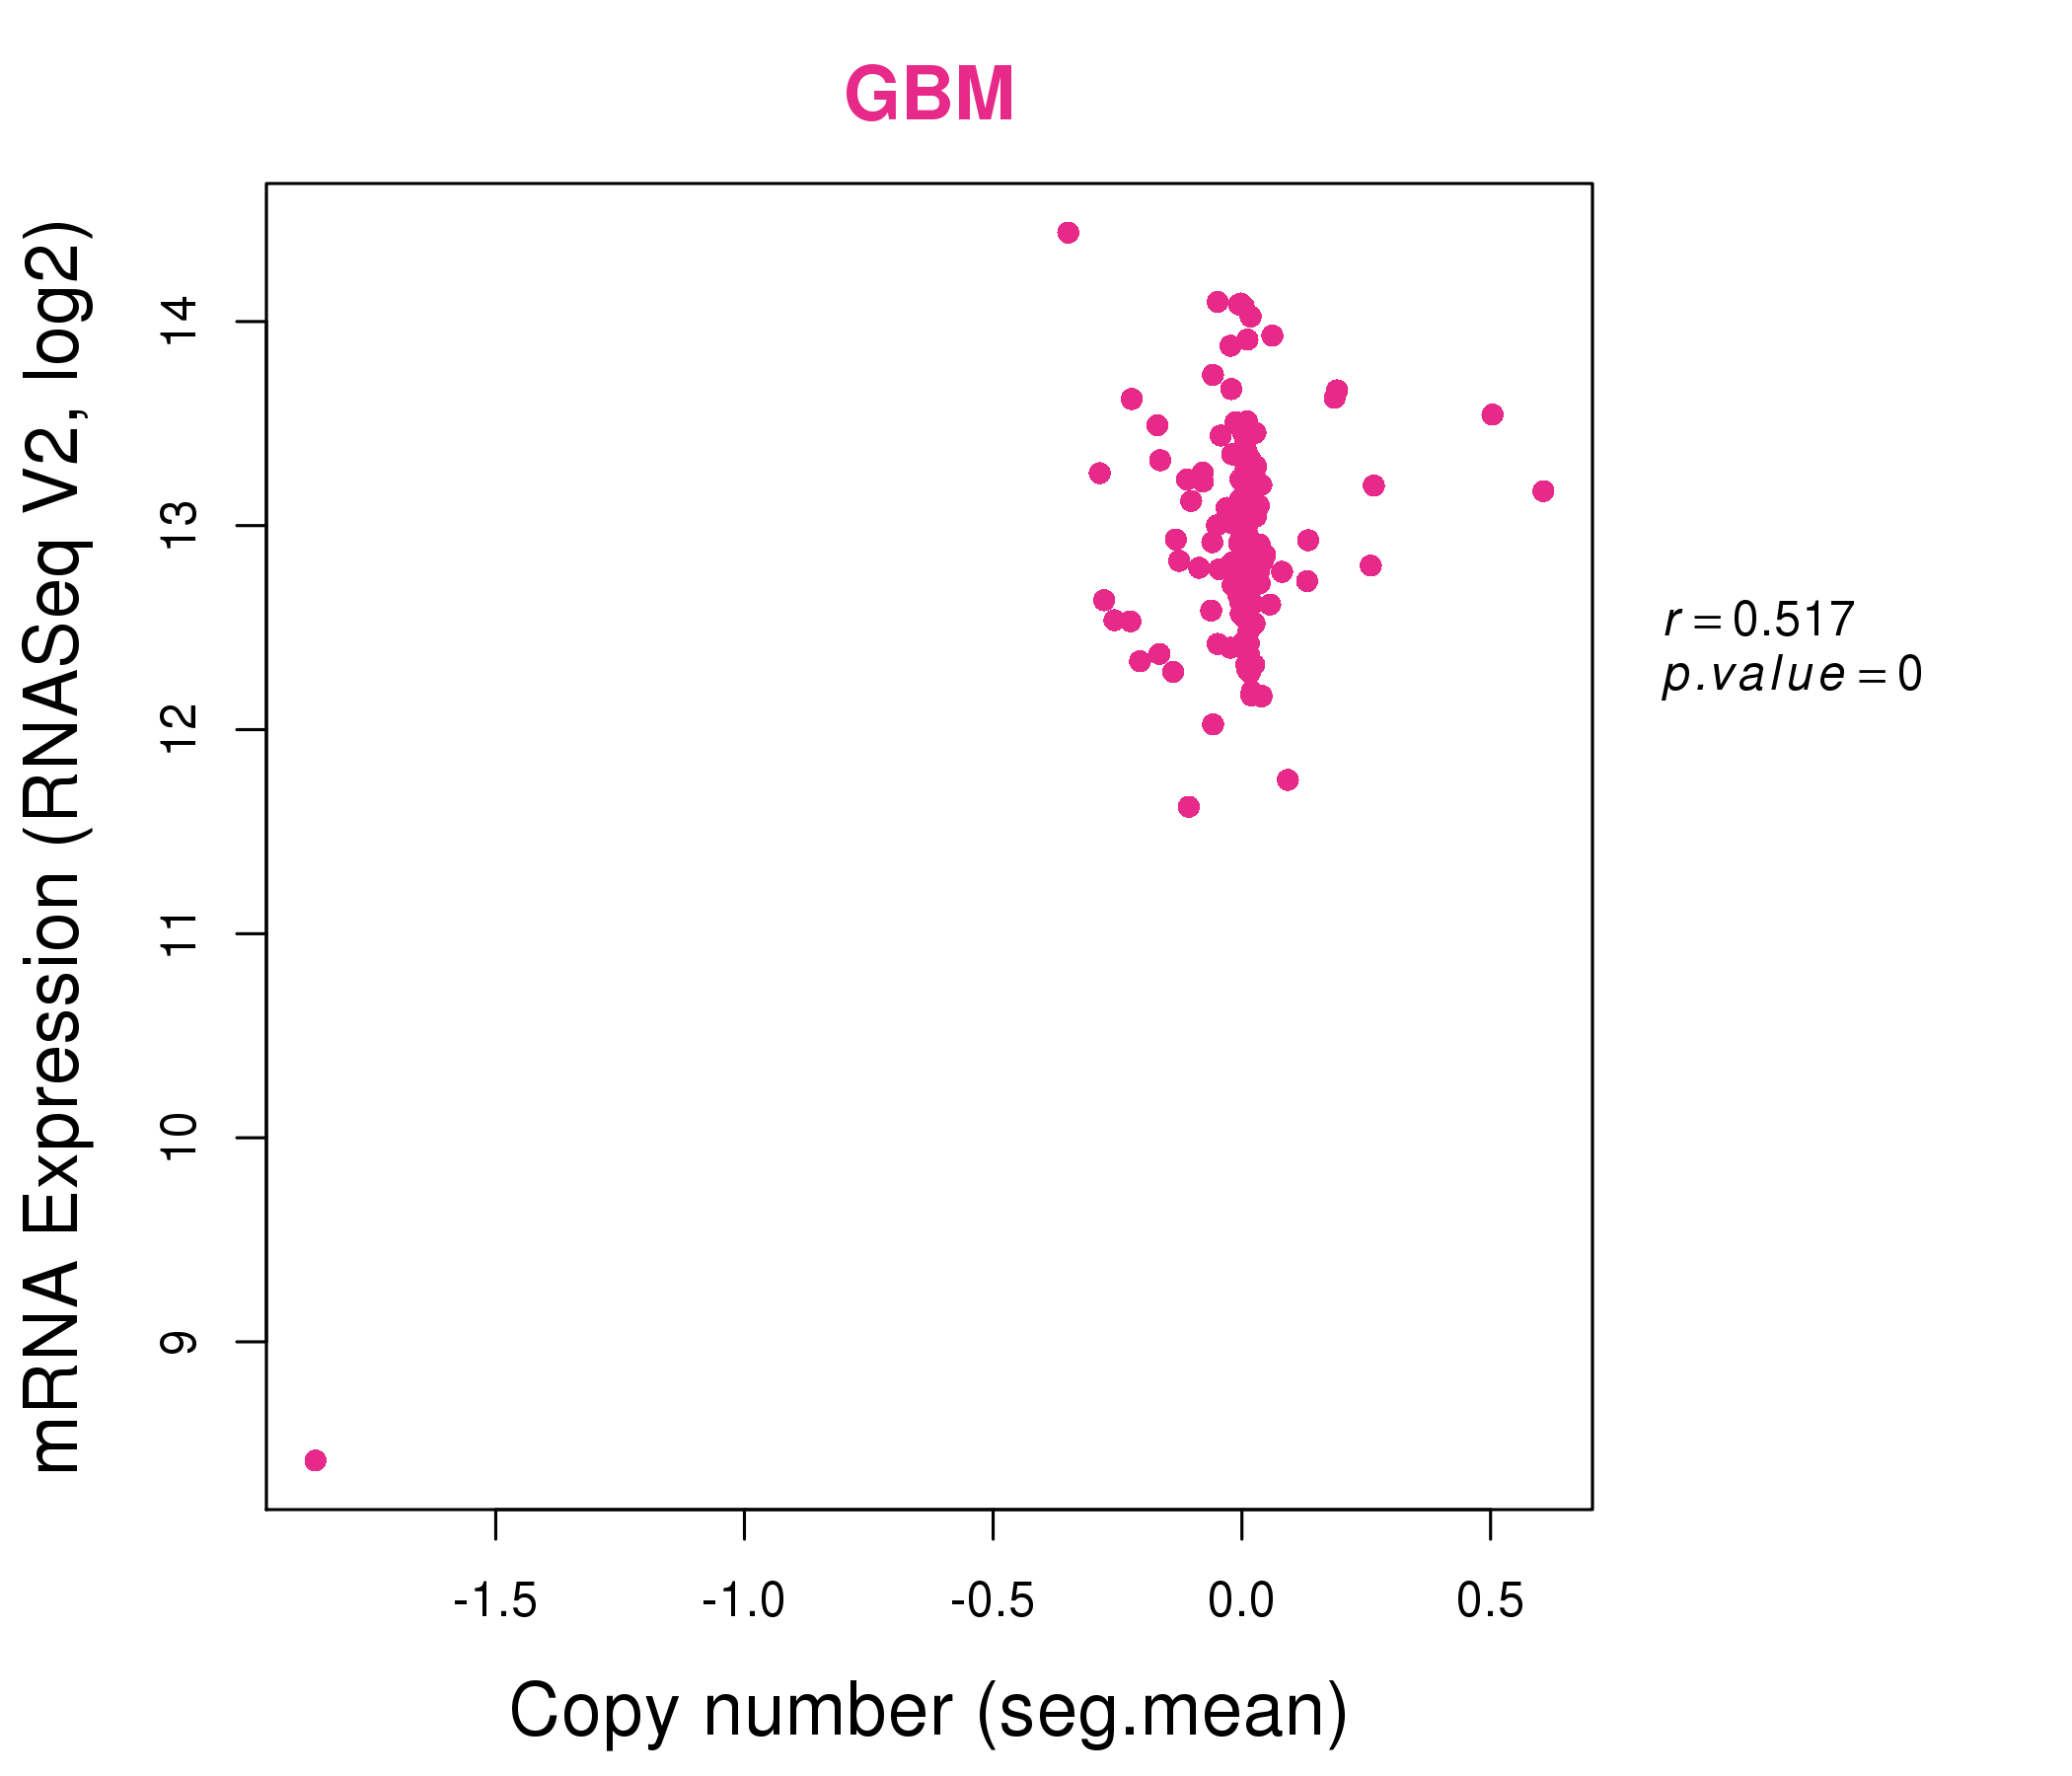
| * This plots show the correlation between CNV and gene expression. |
: Open all plots for all cancer types
 |
|
 |
|
| Top |
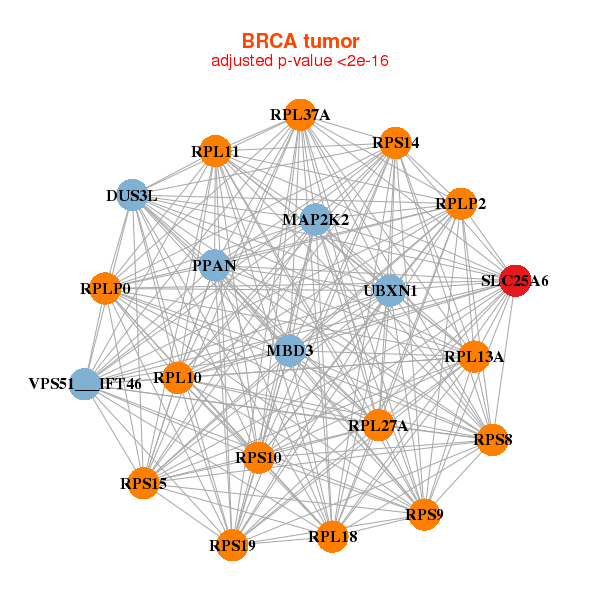
| Gene-Gene Network Information |
| * Co-Expression network figures were drawn using R package igraph. Only the top 20 genes with the highest correlations were shown. Red circle: input gene, orange circle: cell metabolism gene, sky circle: other gene |
: Open all plots for all cancer types
 |
| ||||
| VPS51___IFT46,DUS3L,MAP2K2,MBD3,PPAN,RPL10,RPL11, RPL13A,RPL18,RPL27A,RPL37A,RPLP0,RPLP2,RPS10, RPS14,RPS15,RPS19,RPS8,RPS9,SLC25A6,UBXN1 | APRT,TEN1,DNPH1,EEF1D,EEF2,FAU,MLST8, NFKBIL1,PRKCSH,RAC3,RPL19,RPL35,RPL8,RPS16, RPS9,SLC25A6,TCF25,TIMM13,TUFM,UBXN1,ZNF581 | ||||
 |
| ||||
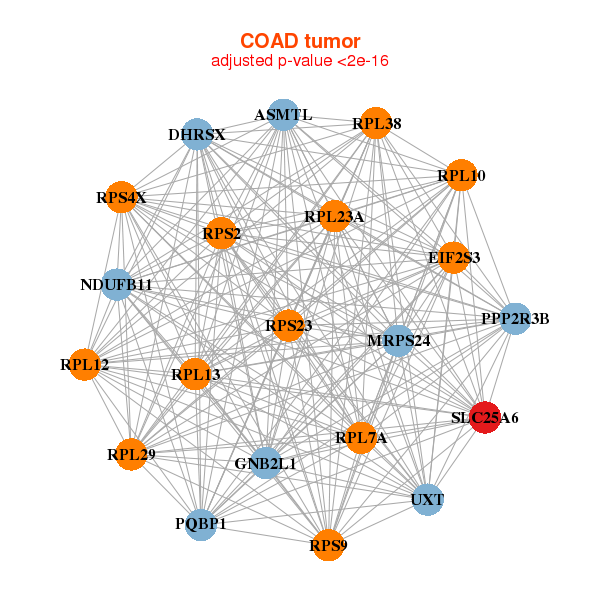
| ASMTL,DHRSX,EIF2S3,GNB2L1,MRPS24,NDUFB11,PPP2R3B, PQBP1,RPL10,RPL12,RPL13,RPL23A,RPL29,RPL38, RPL7A,RPS23,RPS2,RPS4X,RPS9,SLC25A6,UXT | ATP5G2,ATPAF2,BCKDHA,CUTA,ECSIT,EEF1G,EIF3D, EIF3F,ERCC1,GLTSCR2,GNB2L1,NOB1,PEX10,RPL13, RPL18,RPL28,RPL3,RPS15,RPS2,SLC25A6,TRAPPC6A |


| * Co-Expression network figures were drawn using R package igraph. Only the top 20 genes with the highest correlations were shown. Red circle: input gene, orange circle: cell metabolism gene, sky circle: other gene |
: Open all plots for all cancer types
| Top |
: Open all interacting genes' information including KEGG pathway for all interacting genes from DAVID
| Top |
| Pharmacological Information for SLC25A6 |
| DB Category | DB Name | DB's ID and Url link |
| * Gene Centered Interaction Network. |
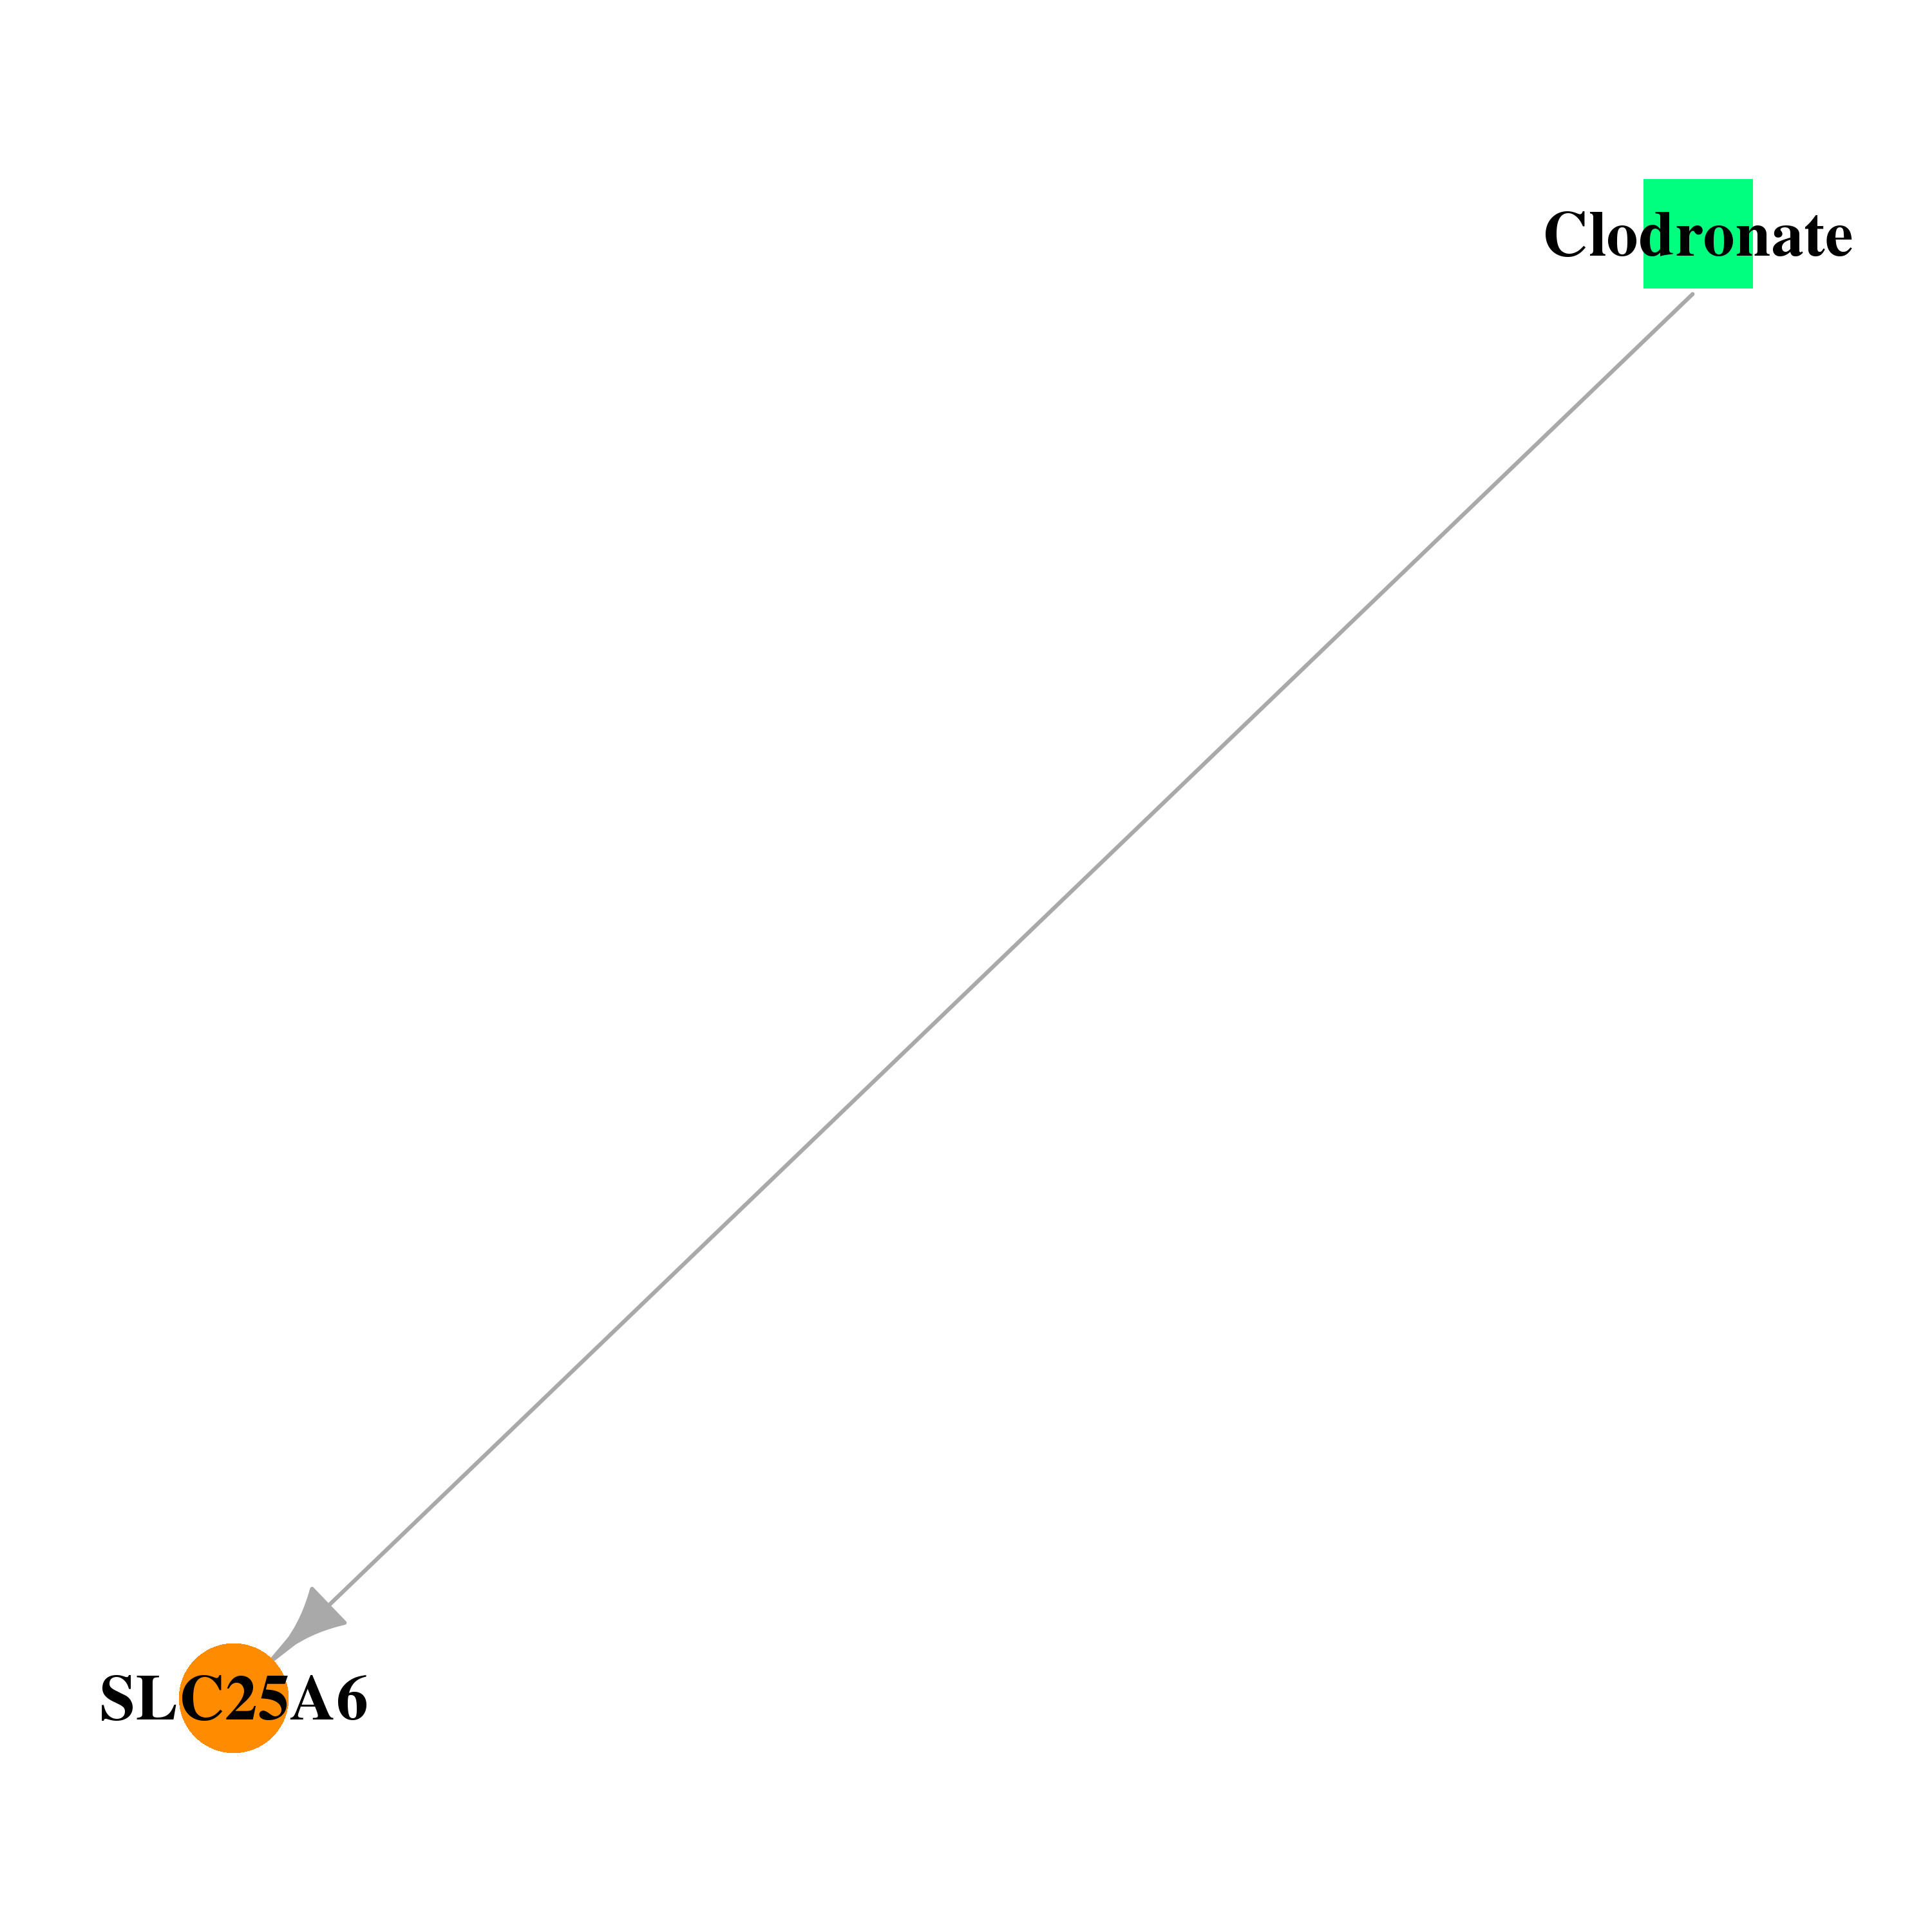 |
| * Drug Centered Interaction Network. |
| DrugBank ID | Target Name | Drug Groups | Generic Name | Drug Centered Network | Drug Structure |
| DB00720 | solute carrier family 25 (mitochondrial carrier; adenine nucleotide translocator), member 6 | approved; investigational | Clodronate | 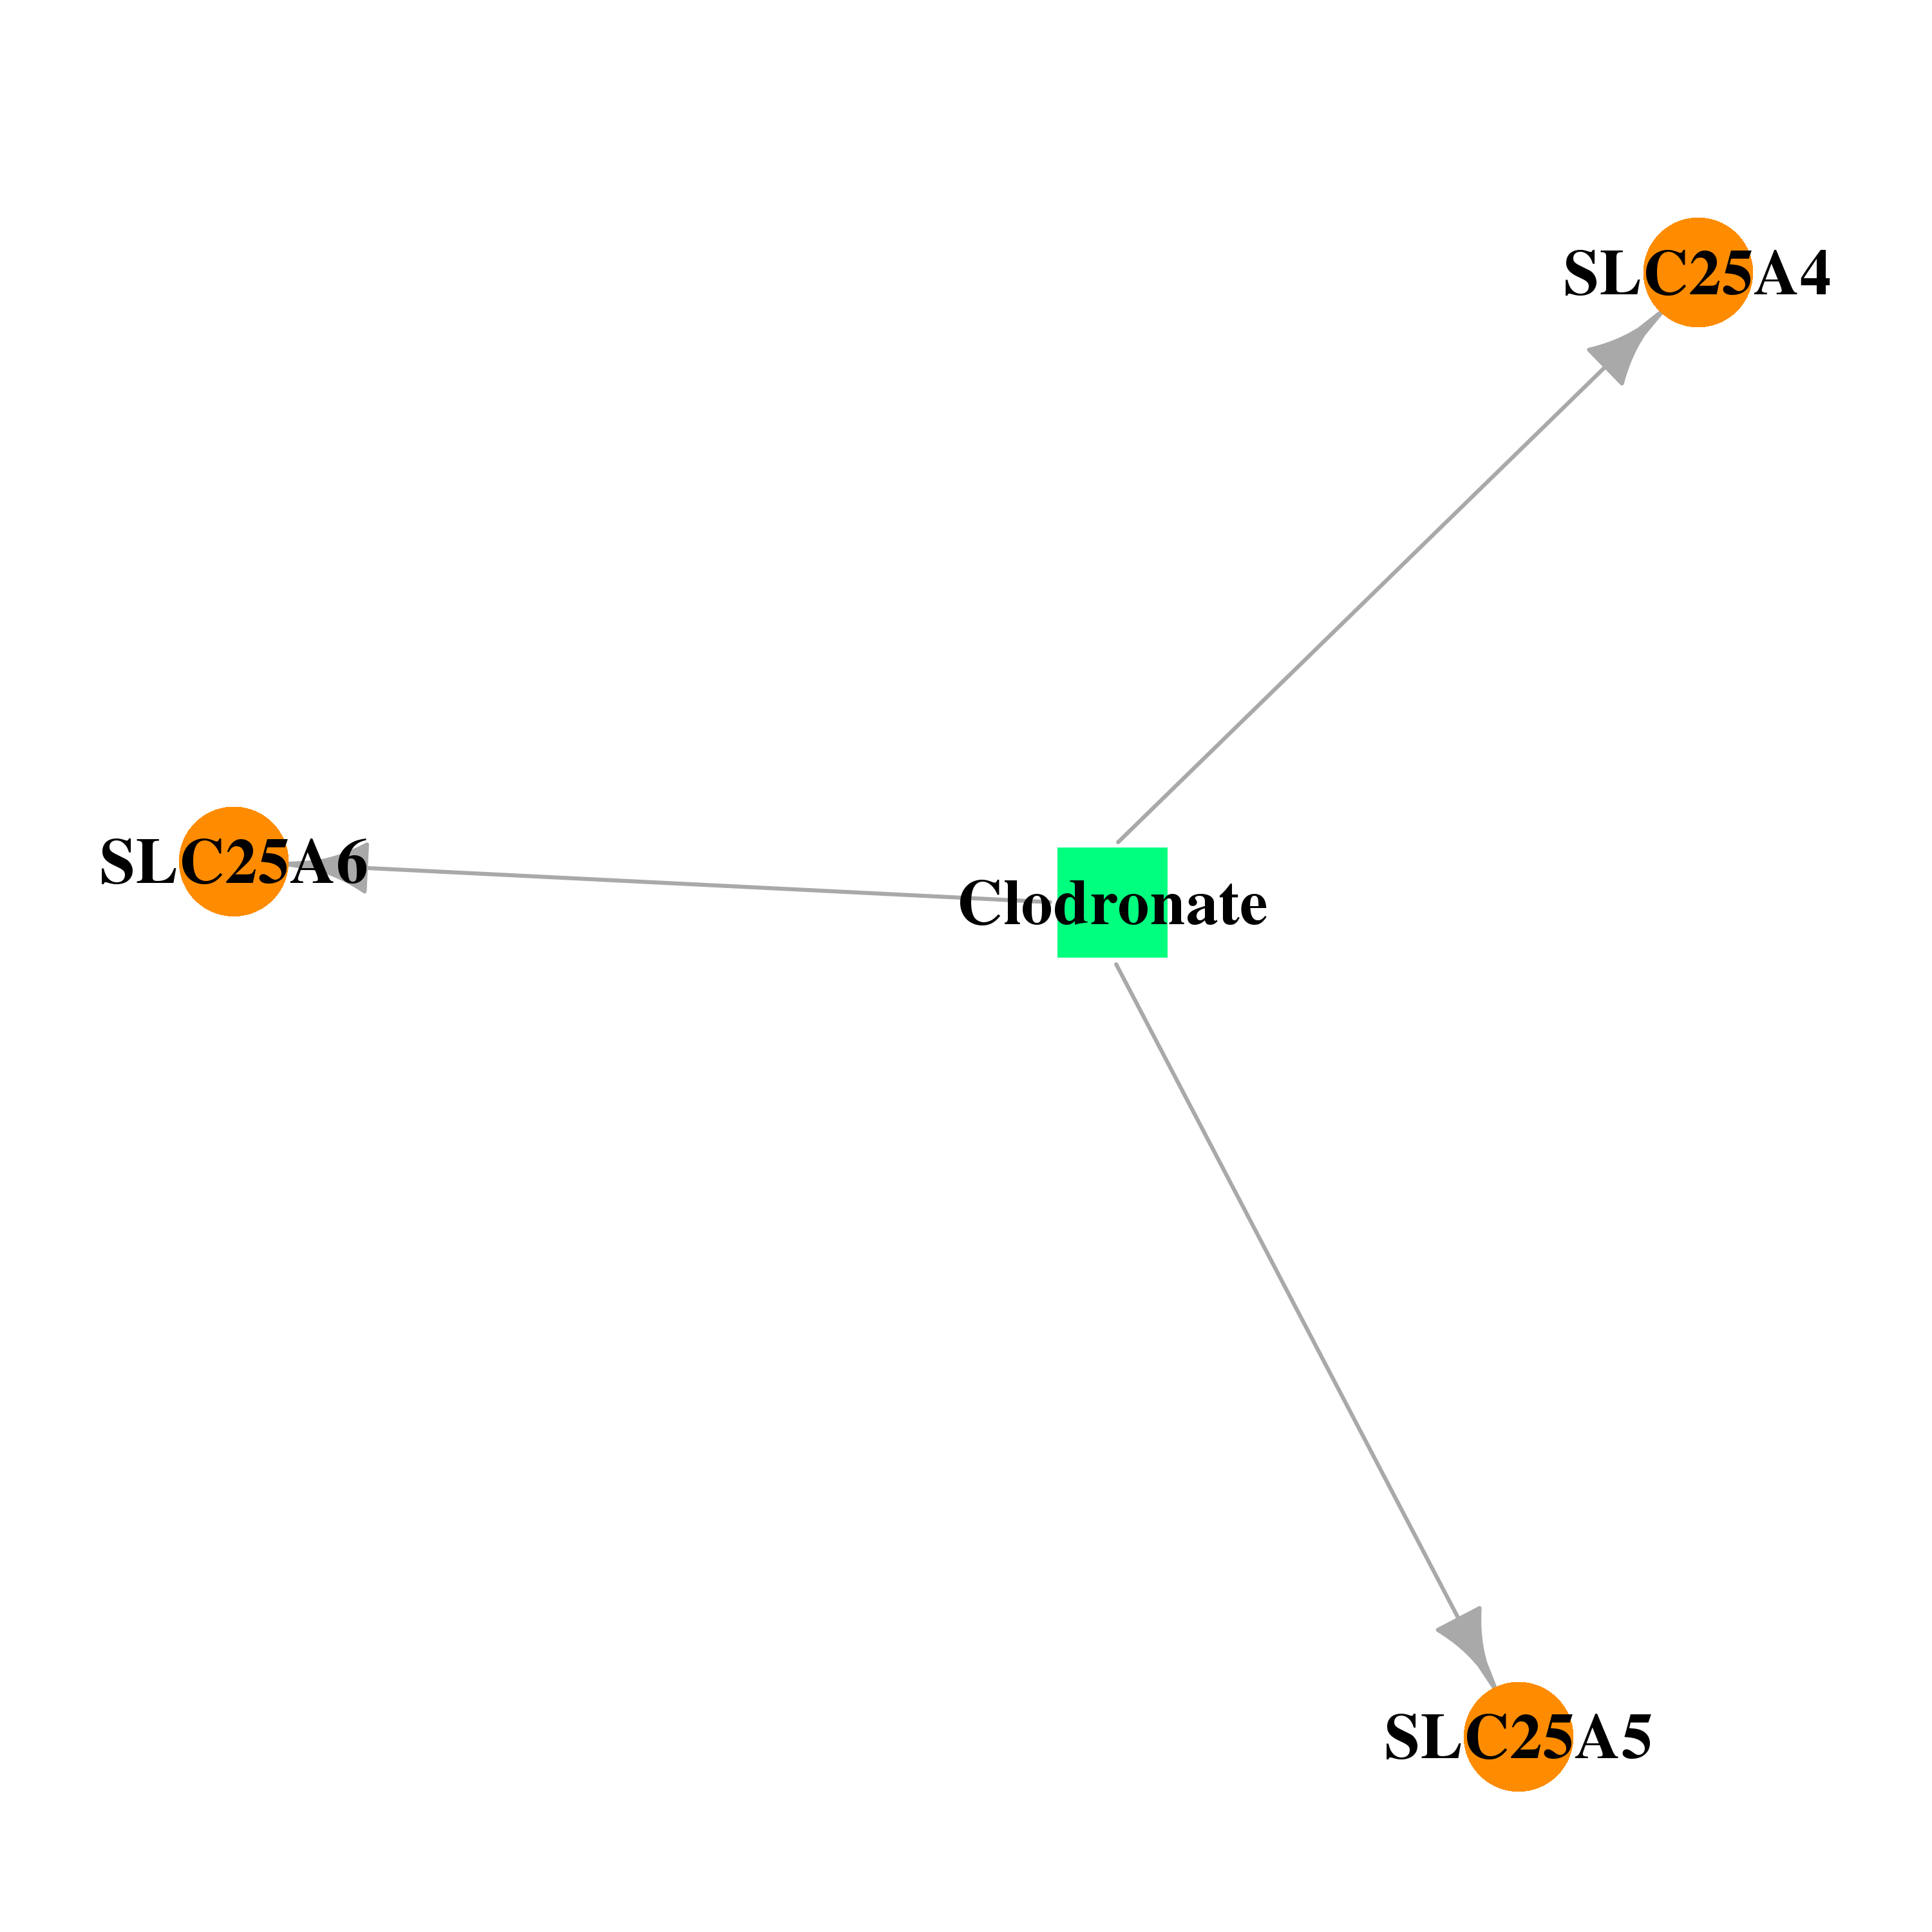 | 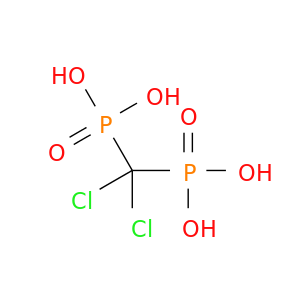 |
| Top |
| Cross referenced IDs for SLC25A6 |
| * We obtained these cross-references from Uniprot database. It covers 150 different DBs, 18 categories. http://www.uniprot.org/help/cross_references_section |
: Open all cross reference information
|
Copyright © 2016-Present - The Univsersity of Texas Health Science Center at Houston @ |