|
|||||||||||||||||||||||||||||||||||||||||||||||||||||||||||||||||||||||||||||||||||||||||||||||||||||||||||||||||||||||||||||||||||||||||||||||||||||||||||||||||||||||||||||||||||||||||||||||||||||||||||||||||||||||||||||||||||||||||||||||||||||||||||||||||||||||||||||||||||||||||||||||||||||||||||||||||||||||||||||||||||||||||||||||||||||||||||||||||||||||||||||||||||||||||||||||||||||||||||||||||||||||||||
| |
| Phenotypic Information (metabolism pathway, cancer, disease, phenome) |
| |
| |
| Gene-Gene Network Information: Co-Expression Network, Interacting Genes & KEGG |
| |
|


| Gene Summary for GSR |
| Top |
| Phenotypic Information for GSR(metabolism pathway, cancer, disease, phenome) |
| Cancer | CGAP: GSR |
| Familial Cancer Database: GSR | |
| * This gene is included in those cancer gene databases. |
|
|
|
|
|
| . | |||||||||||||||||||||||||||||||||||||||||||||||||||||||||||||||||||||||||||||||||||||||||||||||||||||||||||||||||||||||||||||||||||||||||||||||||||||||||||||||||||||||||||||||||||||||||||||||||||||||||||||||||||||||||||||||||||||||||||||||||||||||||||||||||||||||||||||||||||||||||||||||||||||||||||||||||||||||||||||||||||||||||||||||||||||||||||||||||||||||||||||||||||||||||||||||||||||||||||||||||||||
Oncogene 1 | Significant driver gene in | ||||||||||||||||||||||||||||||||||||||||||||||||||||||||||||||||||||||||||||||||||||||||||||||||||||||||||||||||||||||||||||||||||||||||||||||||||||||||||||||||||||||||||||||||||||||||||||||||||||||||||||||||||||||||||||||||||||||||||||||||||||||||||||||||||||||||||||||||||||||||||||||||||||||||||||||||||||||||||||||||||||||||||||||||||||||||||||||||||||||||||||||||||||||||||||||||||||||||||||||||||||||||||
| cf) number; DB name 1 Oncogene; http://nar.oxfordjournals.org/content/35/suppl_1/D721.long, 2 Tumor Suppressor gene; https://bioinfo.uth.edu/TSGene/, 3 Cancer Gene Census; http://www.nature.com/nrc/journal/v4/n3/abs/nrc1299.html, 4 CancerGenes; http://nar.oxfordjournals.org/content/35/suppl_1/D721.long, 5 Network of Cancer Gene; http://ncg.kcl.ac.uk/index.php, 1Therapeutic Vulnerabilities in Cancer; http://cbio.mskcc.org/cancergenomics/statius/ |
| KEGG_GLUTATHIONE_METABOLISM REACTOME_METABOLISM_OF_NUCLEOTIDES | |
| OMIM | |
| Orphanet | |
| Disease | KEGG Disease: GSR |
| MedGen: GSR (Human Medical Genetics with Condition) | |
| ClinVar: GSR | |
| Phenotype | MGI: GSR (International Mouse Phenotyping Consortium) |
| PhenomicDB: GSR | |
| Mutations for GSR |
| * Under tables are showing count per each tissue to give us broad intuition about tissue specific mutation patterns.You can go to the detailed page for each mutation database's web site. |
| - Statistics for Tissue and Mutation type | Top |
 |
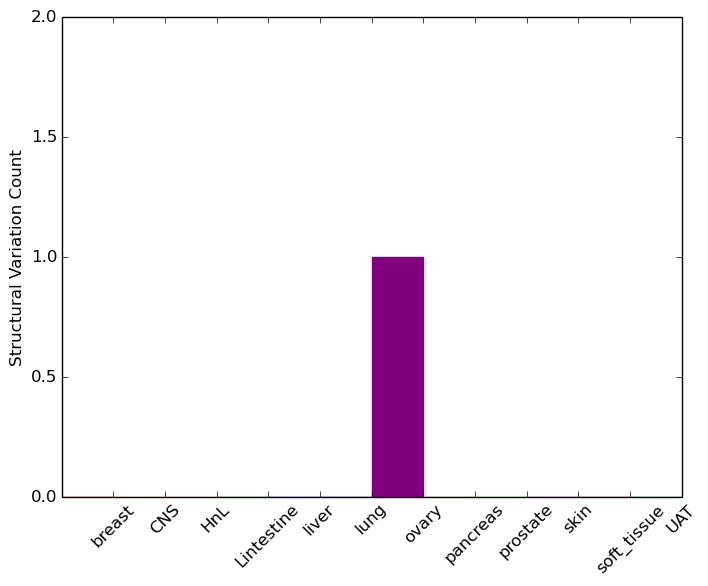
| - For Inter-chromosomal Variations |
| * Inter-chromosomal variantions includes 'interchromosomal amplicon to amplicon', 'interchromosomal amplicon to non-amplified dna', 'interchromosomal insertion', 'Interchromosomal unknown type'. |
 |
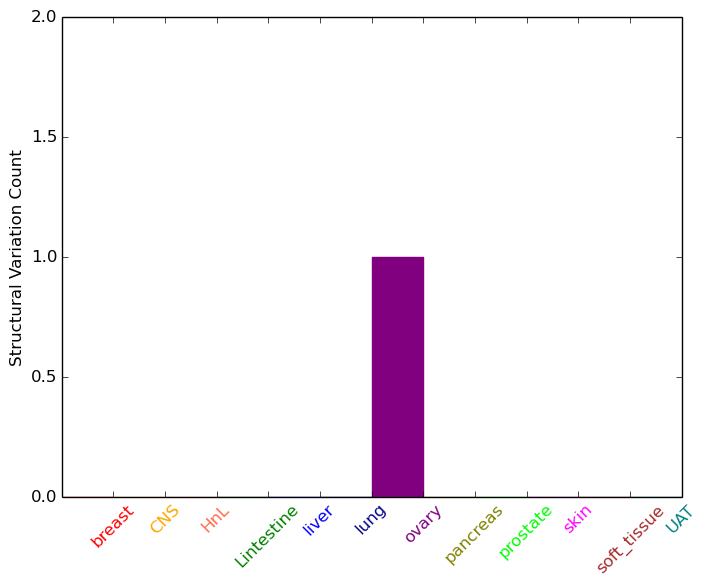
| - For Intra-chromosomal Variations |
| * Intra-chromosomal variantions includes 'intrachromosomal amplicon to amplicon', 'intrachromosomal amplicon to non-amplified dna', 'intrachromosomal deletion', 'intrachromosomal fold-back inversion', 'intrachromosomal inversion', 'intrachromosomal tandem duplication', 'Intrachromosomal unknown type', 'intrachromosomal with inverted orientation', 'intrachromosomal with non-inverted orientation'. |
 |
| Sample | Symbol_a | Chr_a | Start_a | End_a | Symbol_b | Chr_b | Start_b | End_b |
| ovary | GSR | chr8 | 30540768 | 30540788 | GSR | chr8 | 30556938 | 30556958 |
| ovary | GSR | chr8 | 30577252 | 30577272 | C12orf42 | chr12 | 103752262 | 103752282 |
| cf) Tissue number; Tissue name (1;Breast, 2;Central_nervous_system, 3;Haematopoietic_and_lymphoid_tissue, 4;Large_intestine, 5;Liver, 6;Lung, 7;Ovary, 8;Pancreas, 9;Prostate, 10;Skin, 11;Soft_tissue, 12;Upper_aerodigestive_tract) |
| * From mRNA Sanger sequences, Chitars2.0 arranged chimeric transcripts. This table shows GSR related fusion information. |
| ID | Head Gene | Tail Gene | Accession | Gene_a | qStart_a | qEnd_a | Chromosome_a | tStart_a | tEnd_a | Gene_a | qStart_a | qEnd_a | Chromosome_a | tStart_a | tEnd_a |
| Top |
| Mutation type/ Tissue ID | brca | cns | cerv | endome | haematopo | kidn | Lintest | liver | lung | ns | ovary | pancre | prost | skin | stoma | thyro | urina | |||
| Total # sample | 1 | |||||||||||||||||||
| GAIN (# sample) | ||||||||||||||||||||
| LOSS (# sample) | 1 |
| cf) Tissue ID; Tissue type (1; Breast, 2; Central_nervous_system, 3; Cervix, 4; Endometrium, 5; Haematopoietic_and_lymphoid_tissue, 6; Kidney, 7; Large_intestine, 8; Liver, 9; Lung, 10; NS, 11; Ovary, 12; Pancreas, 13; Prostate, 14; Skin, 15; Stomach, 16; Thyroid, 17; Urinary_tract) |
| Top |
|
 |
| Top |
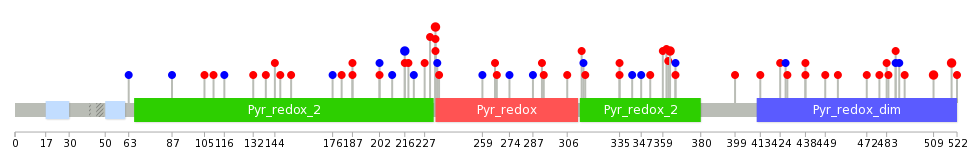
| Stat. for Non-Synonymous SNVs (# total SNVs=38) | (# total SNVs=12) |
 |  |
(# total SNVs=1) | (# total SNVs=1) |
 |  |
| Top |
| * When you move the cursor on each content, you can see more deailed mutation information on the Tooltip. Those are primary_site,primary_histology,mutation(aa),pubmedID. |
| GRCh37 position | Mutation(aa) | Unique sampleID count |
| chr8:30553994-30553994 | p.R233H | 3 |
| chr8:30539537-30539537 | p.E399Q | 2 |
| chr8:30537051-30537051 | p.V519F | 2 |
| chr8:30553940-30553940 | p.S251* | 2 |
| chr8:30541660-30541660 | p.N366N | 2 |
| chr8:30557645-30557645 | p.S216S | 2 |
| chr8:30537081-30537081 | p.A509T | 2 |
| chr8:30541669-30541669 | p.Q363H | 2 |
| chr8:30538562-30538562 | p.? | 2 |
| chr8:30554006-30554006 | p.? | 2 |
| Top |
|
 |
| Point Mutation/ Tissue ID | 1 | 2 | 3 | 4 | 5 | 6 | 7 | 8 | 9 | 10 | 11 | 12 | 13 | 14 | 15 | 16 | 17 | 18 | 19 | 20 |
| # sample | 3 | 1 | 5 | 2 | 2 | 6 | 5 | 1 | 4 | 7 | 5 | |||||||||
| # mutation | 3 | 1 | 5 | 2 | 2 | 6 | 5 | 1 | 6 | 8 | 6 | |||||||||
| nonsynonymous SNV | 2 | 3 | 2 | 5 | 4 | 1 | 3 | 5 | 5 | |||||||||||
| synonymous SNV | 1 | 1 | 2 | 2 | 1 | 1 | 3 | 3 | 1 |
| cf) Tissue ID; Tissue type (1; BLCA[Bladder Urothelial Carcinoma], 2; BRCA[Breast invasive carcinoma], 3; CESC[Cervical squamous cell carcinoma and endocervical adenocarcinoma], 4; COAD[Colon adenocarcinoma], 5; GBM[Glioblastoma multiforme], 6; Glioma Low Grade, 7; HNSC[Head and Neck squamous cell carcinoma], 8; KICH[Kidney Chromophobe], 9; KIRC[Kidney renal clear cell carcinoma], 10; KIRP[Kidney renal papillary cell carcinoma], 11; LAML[Acute Myeloid Leukemia], 12; LUAD[Lung adenocarcinoma], 13; LUSC[Lung squamous cell carcinoma], 14; OV[Ovarian serous cystadenocarcinoma ], 15; PAAD[Pancreatic adenocarcinoma], 16; PRAD[Prostate adenocarcinoma], 17; SKCM[Skin Cutaneous Melanoma], 18:STAD[Stomach adenocarcinoma], 19:THCA[Thyroid carcinoma], 20:UCEC[Uterine Corpus Endometrial Carcinoma]) |
| Top |
| * We represented just top 10 SNVs. When you move the cursor on each content, you can see more deailed mutation information on the Tooltip. Those are primary_site, primary_histology, mutation(aa), pubmedID. |
| Genomic Position | Mutation(aa) | Unique sampleID count |
| chr8:30557645 | p.S216S,GSR | 3 |
| chr8:30560722 | p.F176F,GSR | 2 |
| chr8:30546693 | p.T331I,GSR | 1 |
| chr8:30539450 | p.S234S,GSR | 1 |
| chr8:30546715 | p.E317Q,GSR | 1 |
| chr8:30537129 | p.S221S,GSR | 1 |
| chr8:30557646 | p.F280I,GSR | 1 |
| chr8:30539451 | p.V411L,GSR | 1 |
| chr8:30546716 | p.E279K,GSR | 1 |
| chr8:30537136 | p.S216N,GSR | 1 |
| * Copy number data were extracted from TCGA using R package TCGA-Assembler. The URLs of all public data files on TCGA DCC data server were gathered on Jan-05-2015. Function ProcessCNAData in TCGA-Assembler package was used to obtain gene-level copy number value which is calculated as the average copy number of the genomic region of a gene. |
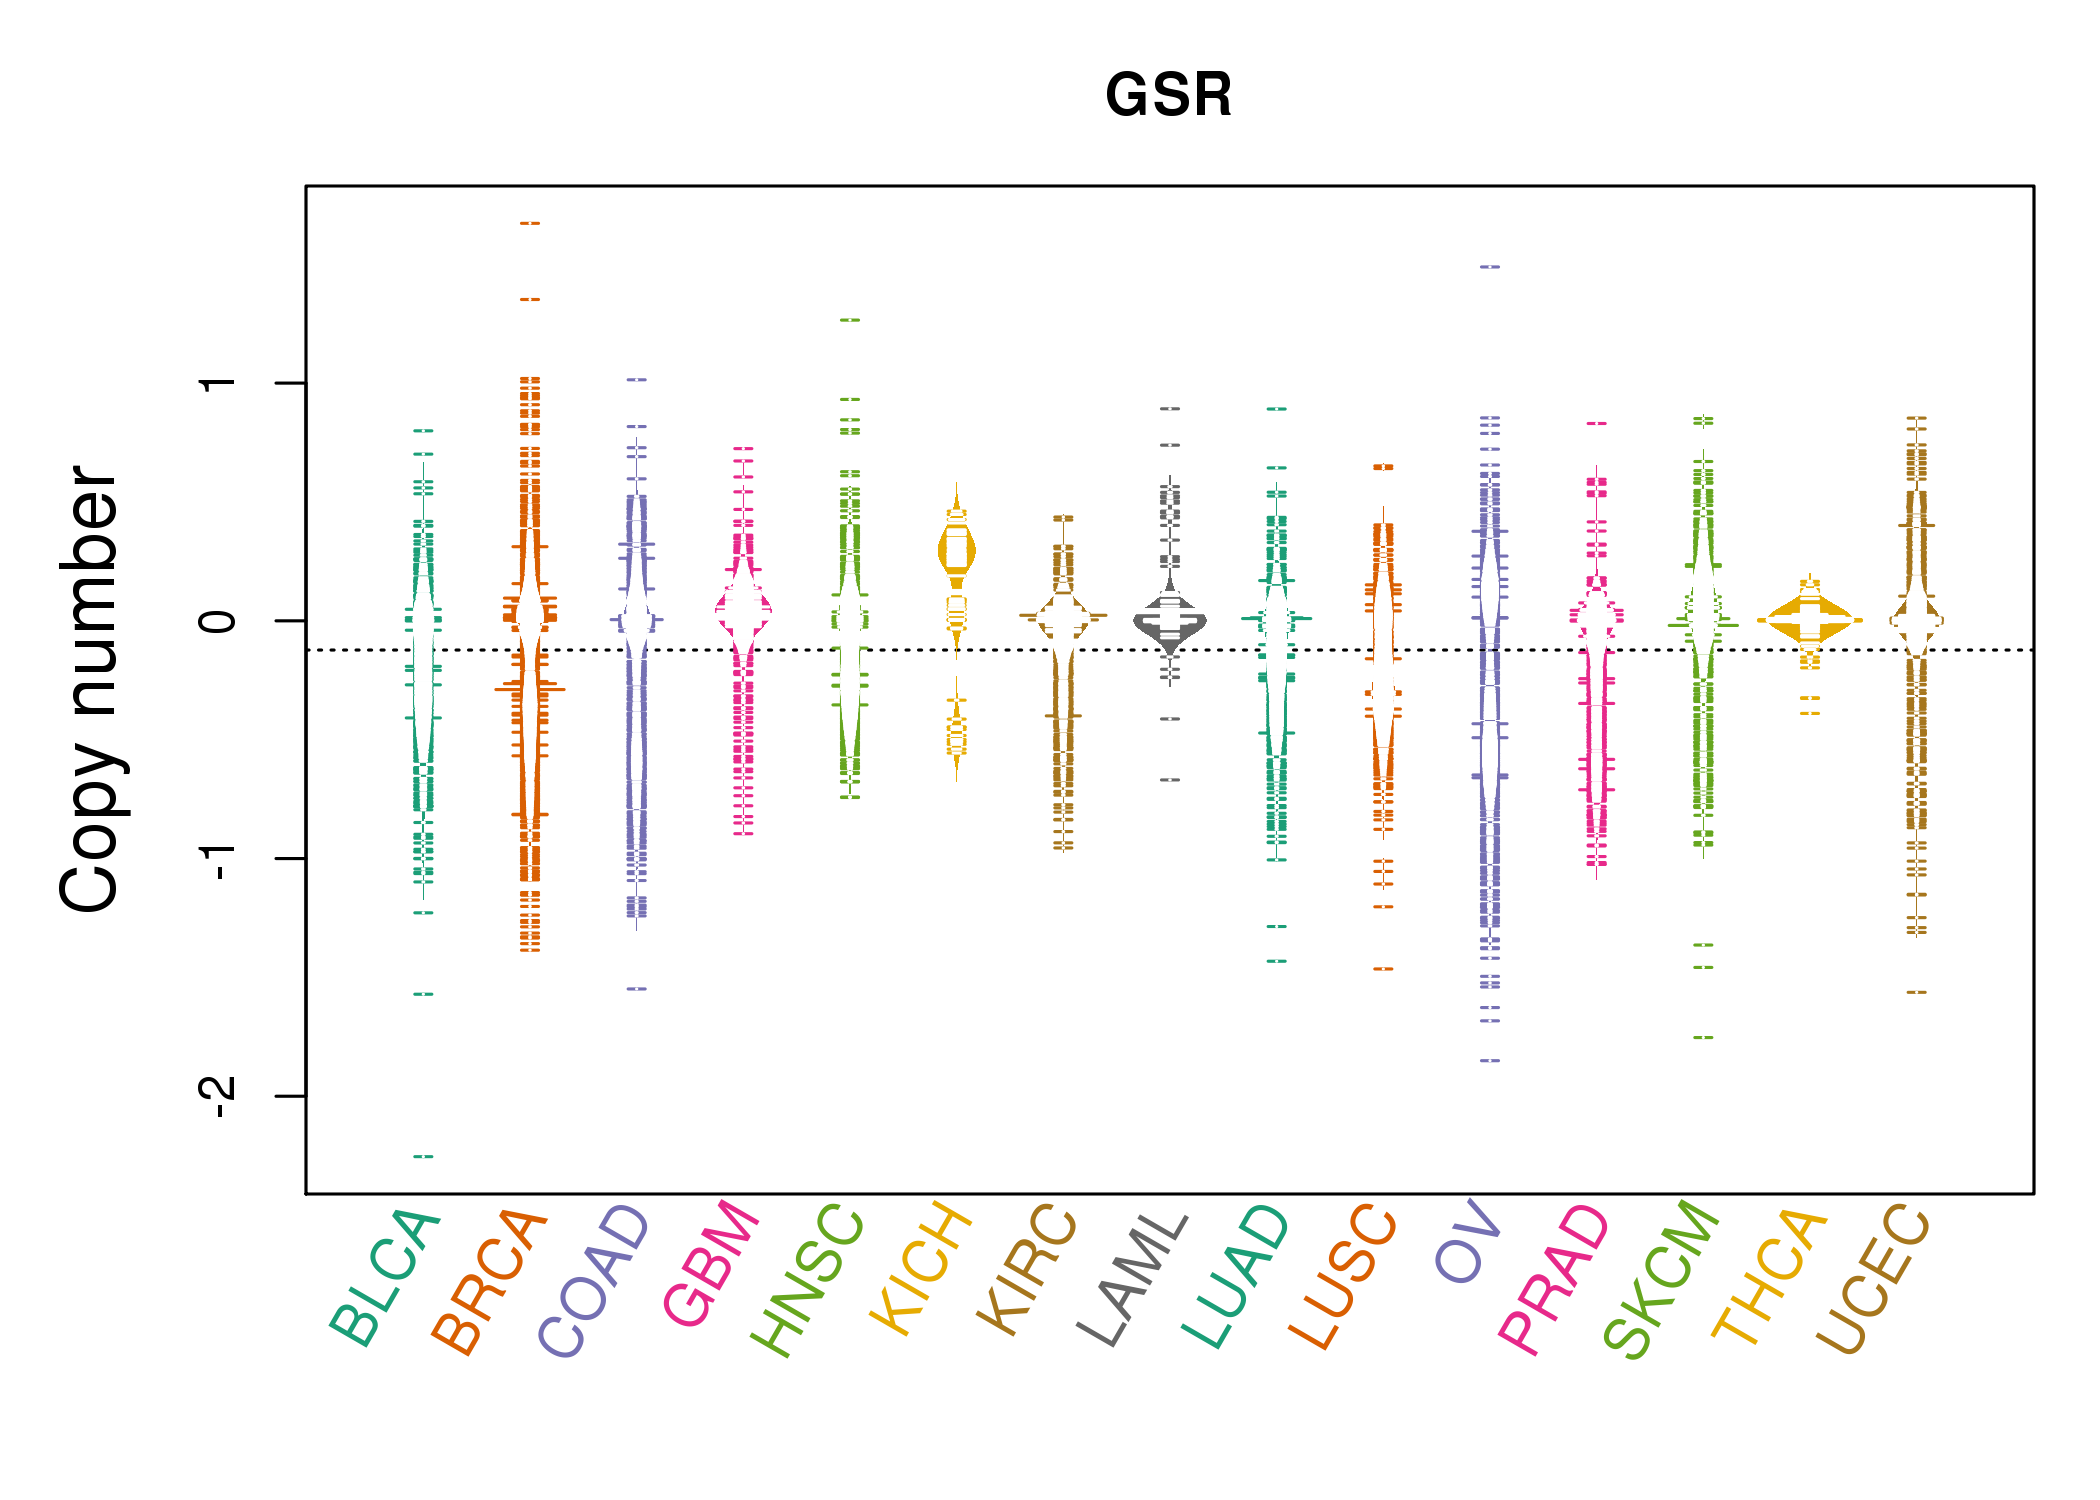 |
| cf) Tissue ID[Tissue type]: BLCA[Bladder Urothelial Carcinoma], BRCA[Breast invasive carcinoma], CESC[Cervical squamous cell carcinoma and endocervical adenocarcinoma], COAD[Colon adenocarcinoma], GBM[Glioblastoma multiforme], Glioma Low Grade, HNSC[Head and Neck squamous cell carcinoma], KICH[Kidney Chromophobe], KIRC[Kidney renal clear cell carcinoma], KIRP[Kidney renal papillary cell carcinoma], LAML[Acute Myeloid Leukemia], LUAD[Lung adenocarcinoma], LUSC[Lung squamous cell carcinoma], OV[Ovarian serous cystadenocarcinoma ], PAAD[Pancreatic adenocarcinoma], PRAD[Prostate adenocarcinoma], SKCM[Skin Cutaneous Melanoma], STAD[Stomach adenocarcinoma], THCA[Thyroid carcinoma], UCEC[Uterine Corpus Endometrial Carcinoma] |
| Top |
| Gene Expression for GSR |
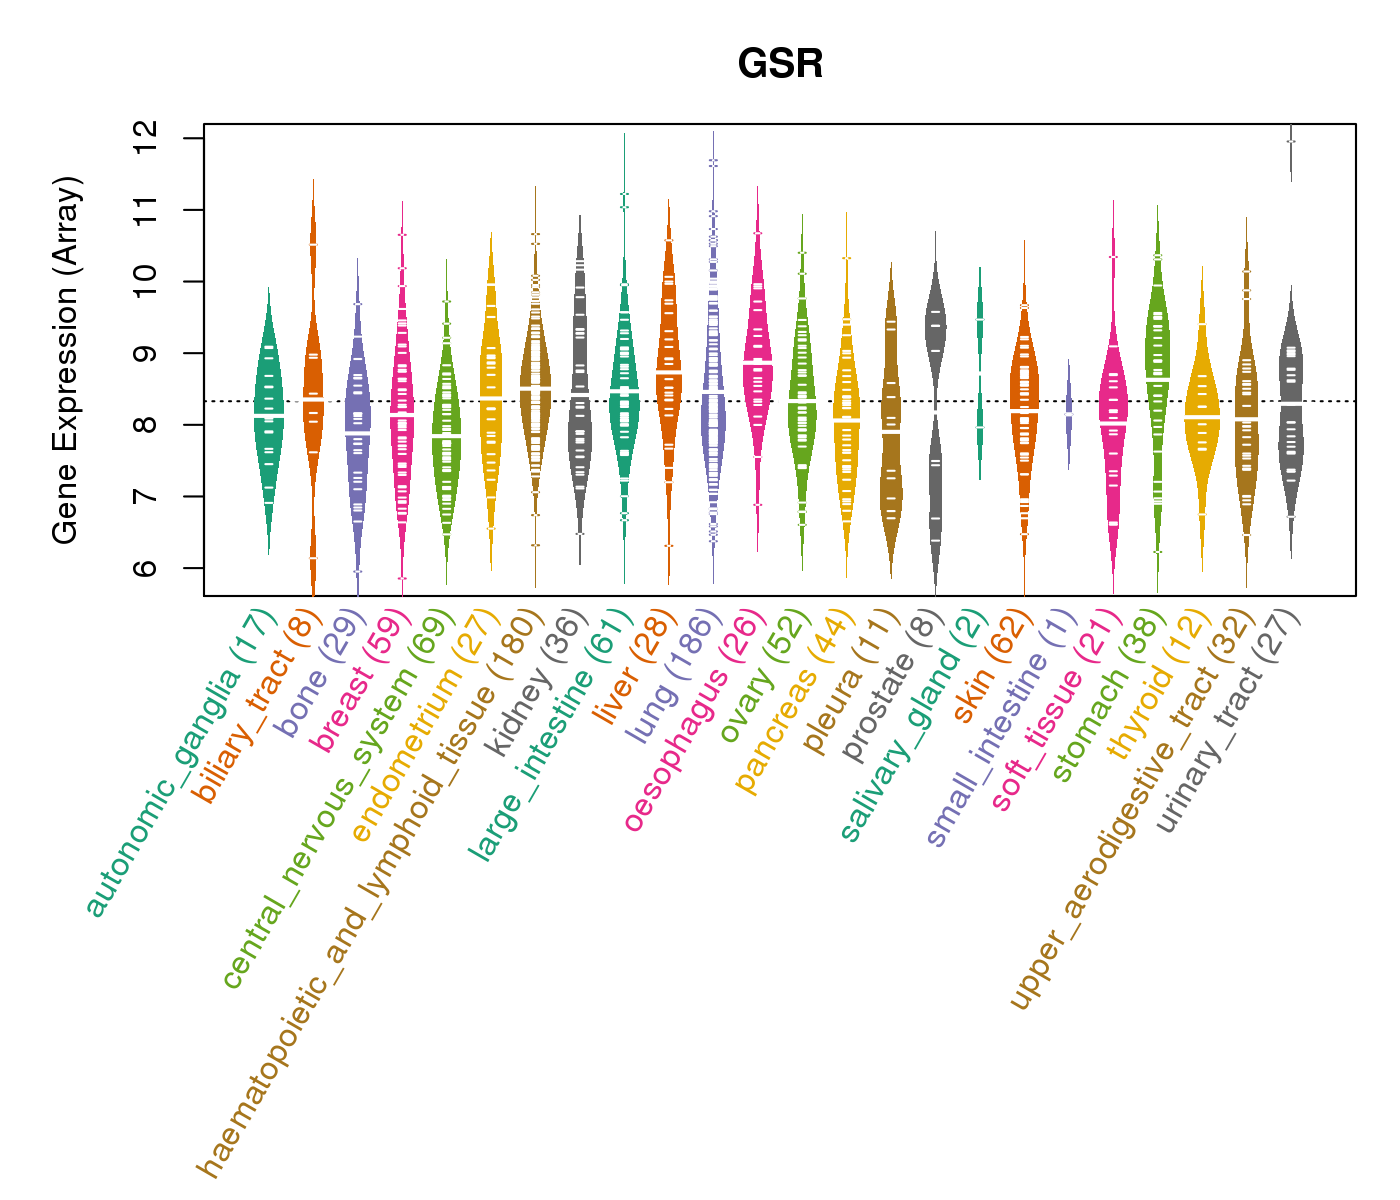
| * CCLE gene expression data were extracted from CCLE_Expression_Entrez_2012-10-18.res: Gene-centric RMA-normalized mRNA expression data. |
 |
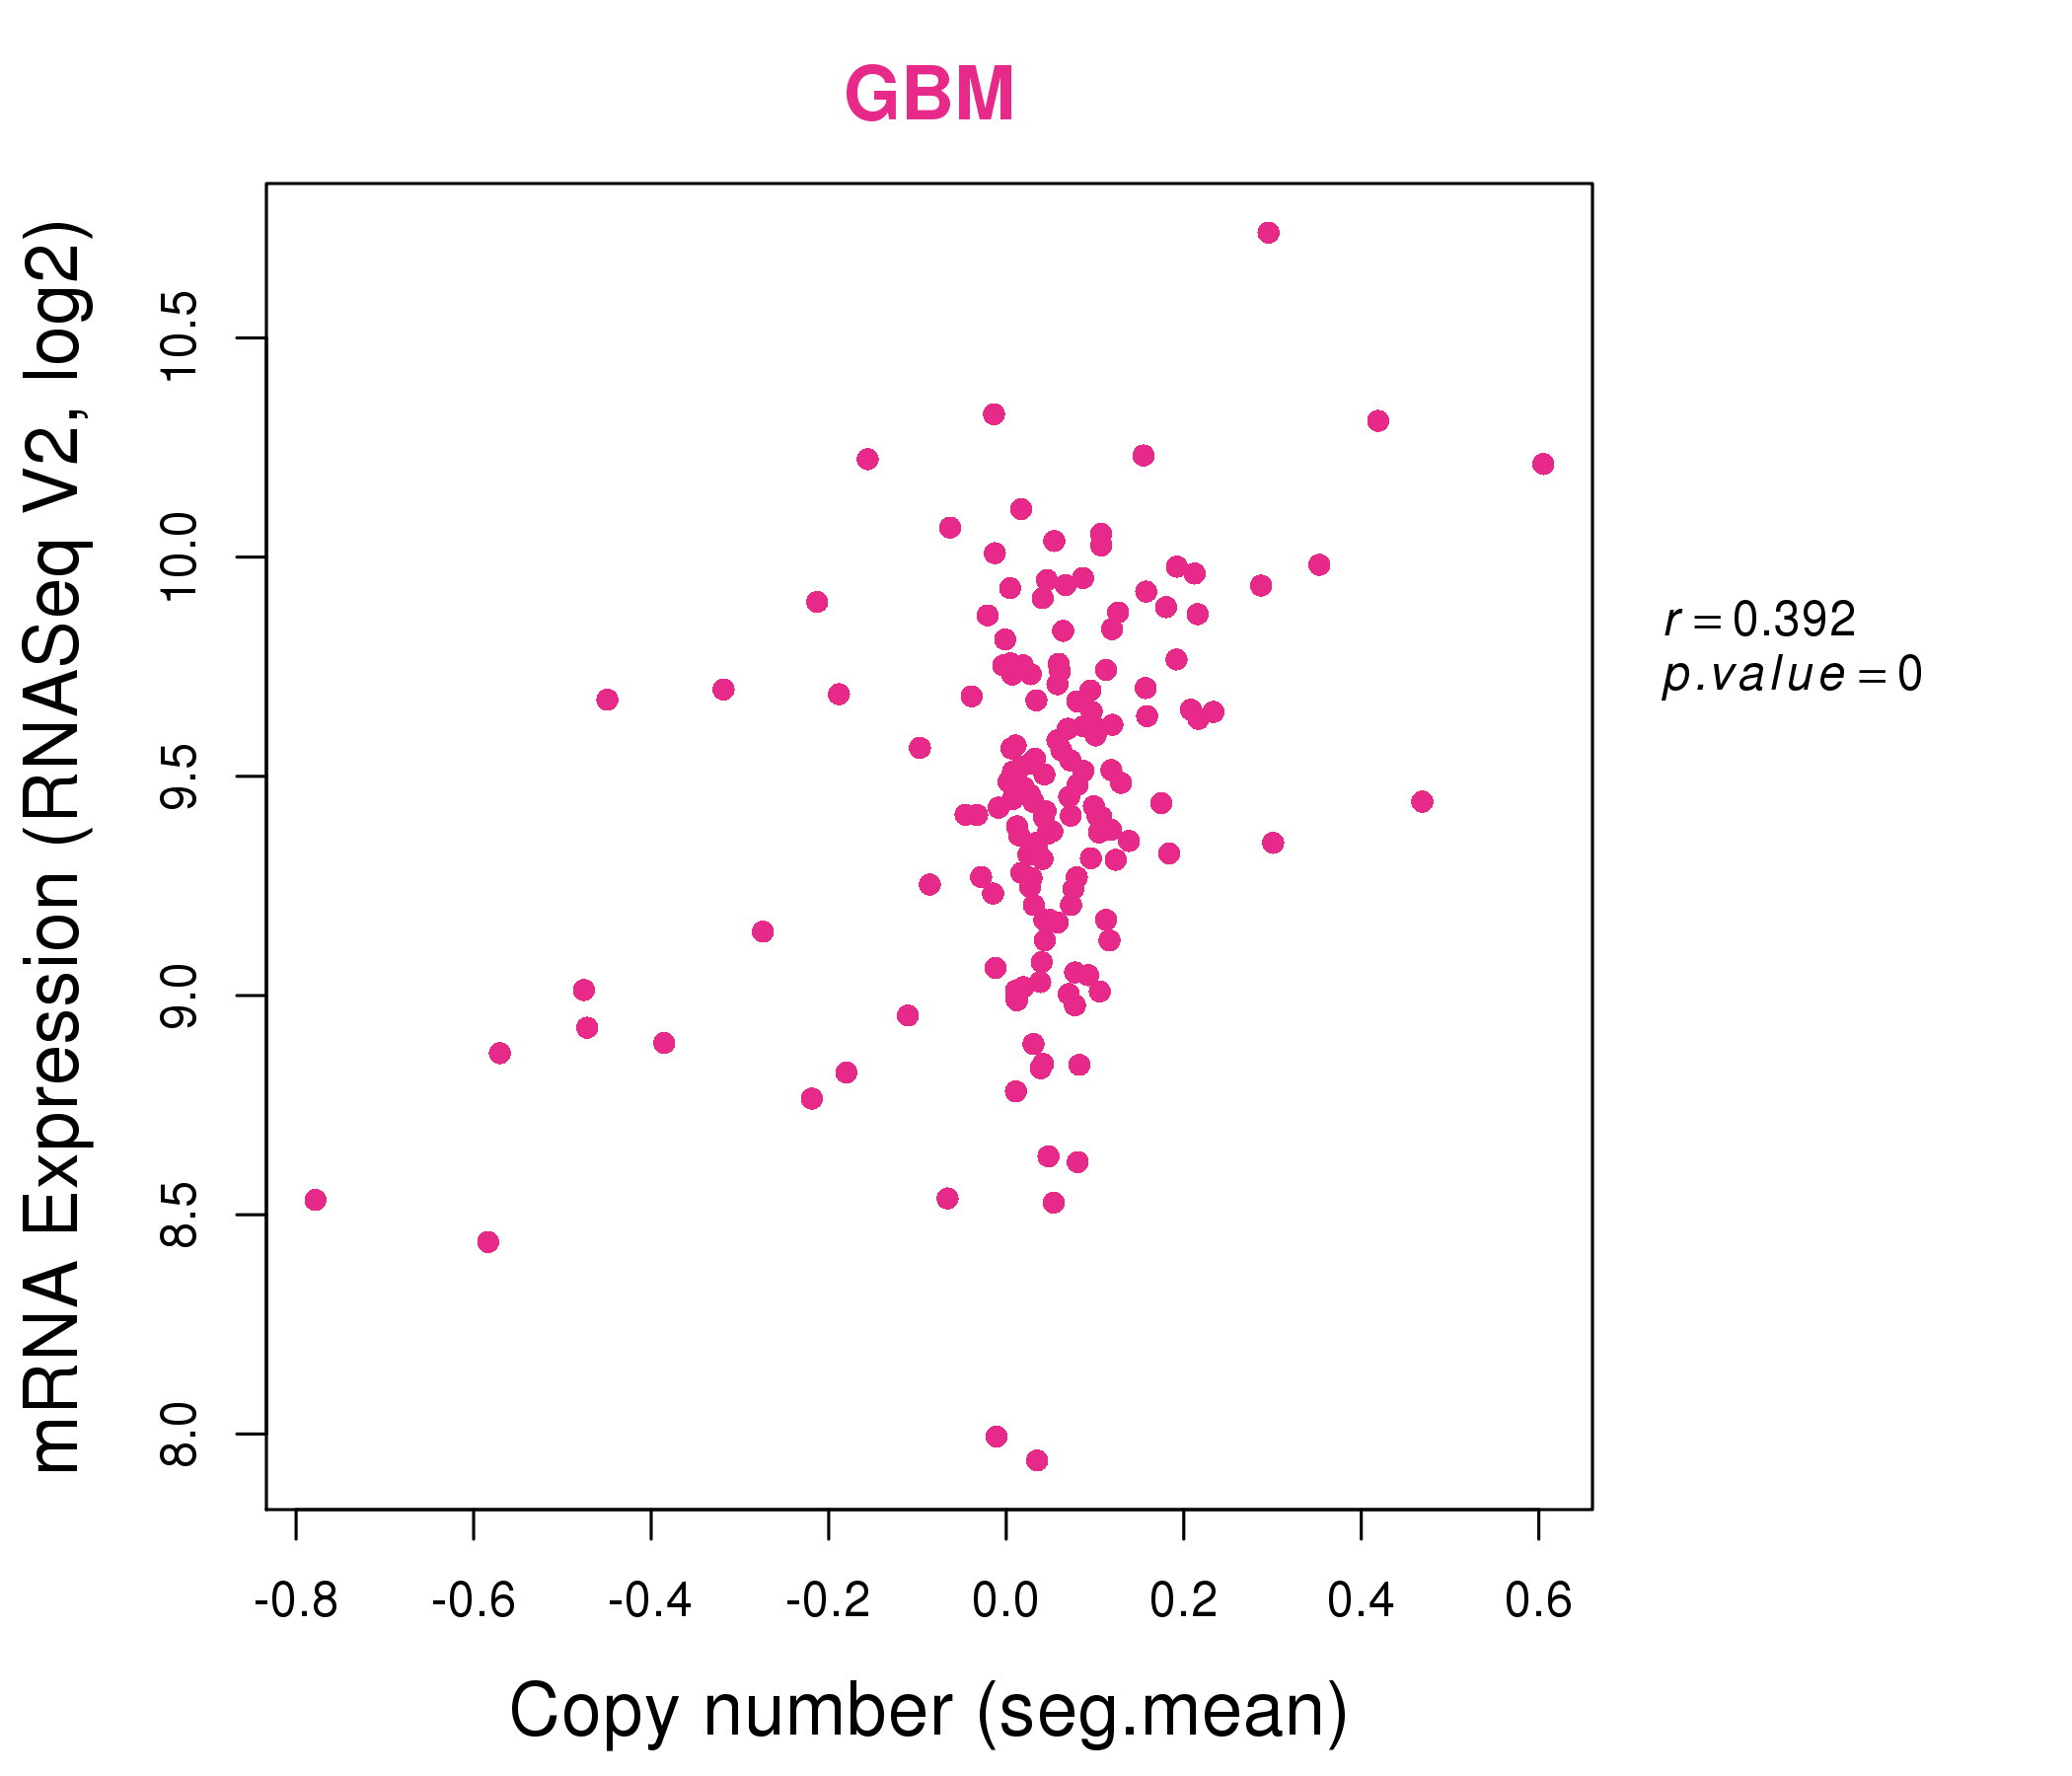
| * Normalized gene expression data of RNASeqV2 was extracted from TCGA using R package TCGA-Assembler. The URLs of all public data files on TCGA DCC data server were gathered at Jan-05-2015. Only eight cancer types have enough normal control samples for differential expression analysis. (t test, adjusted p<0.05 (using Benjamini-Hochberg FDR)) |
 |
| Top |
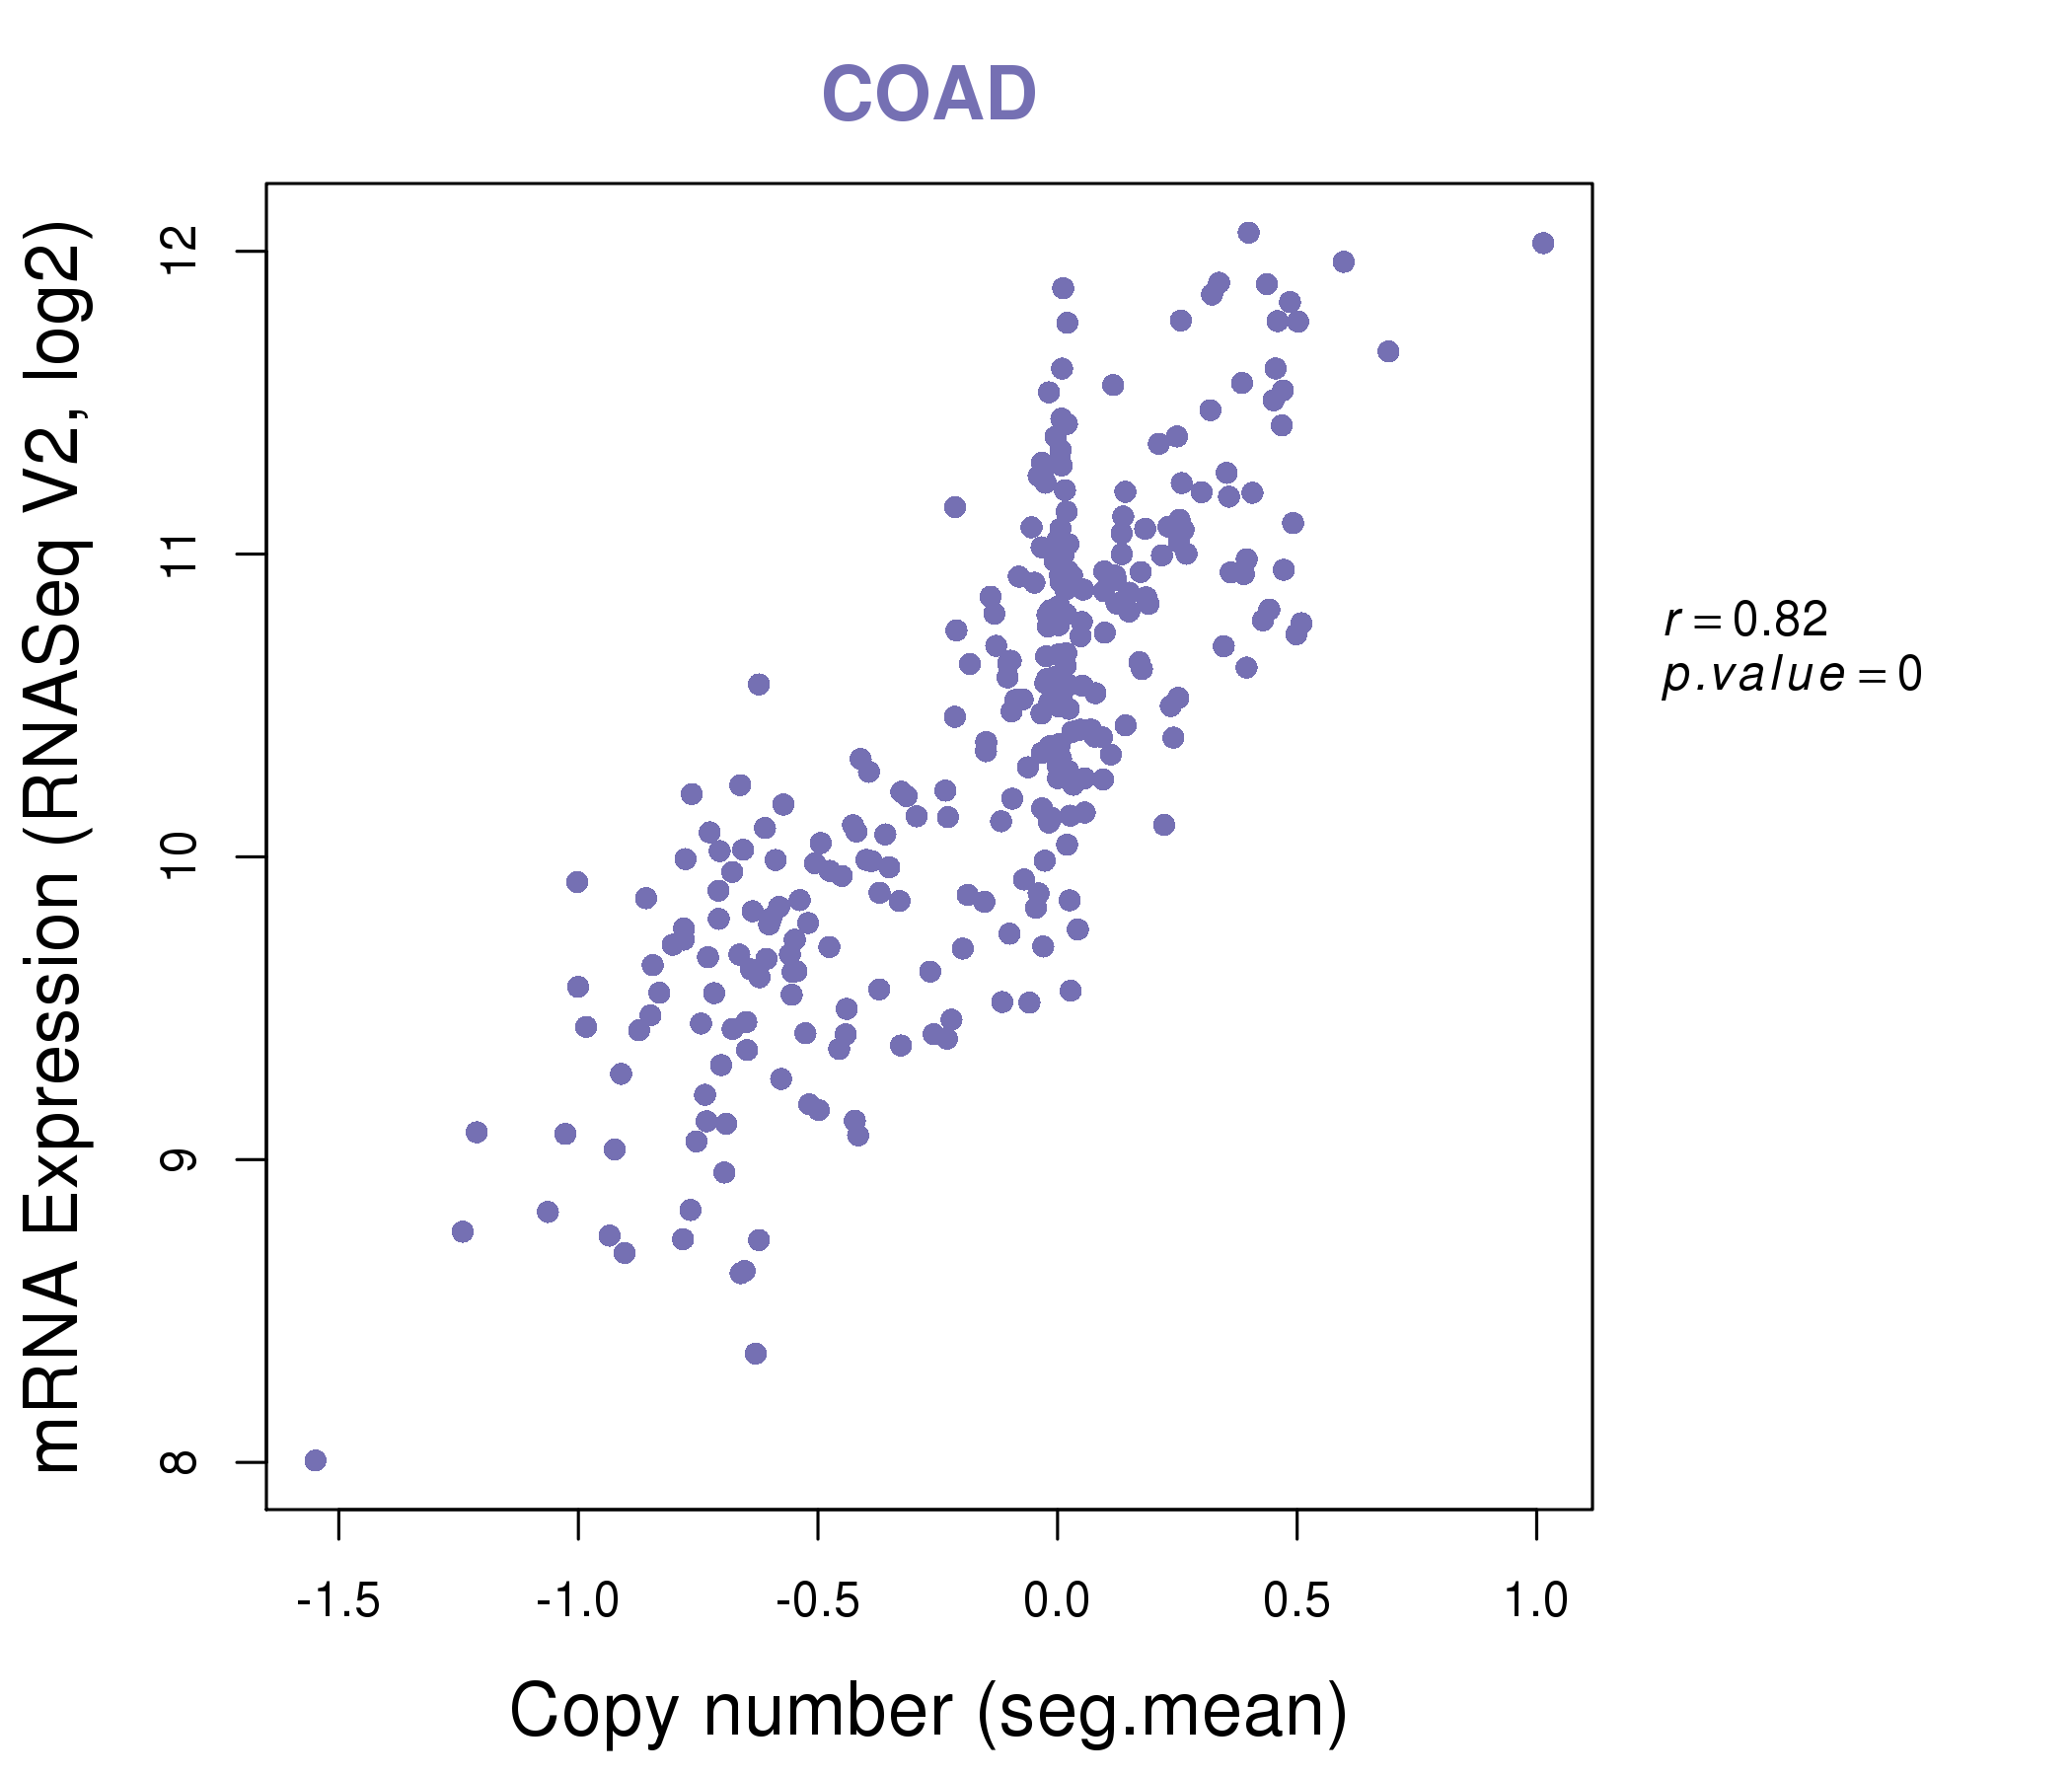
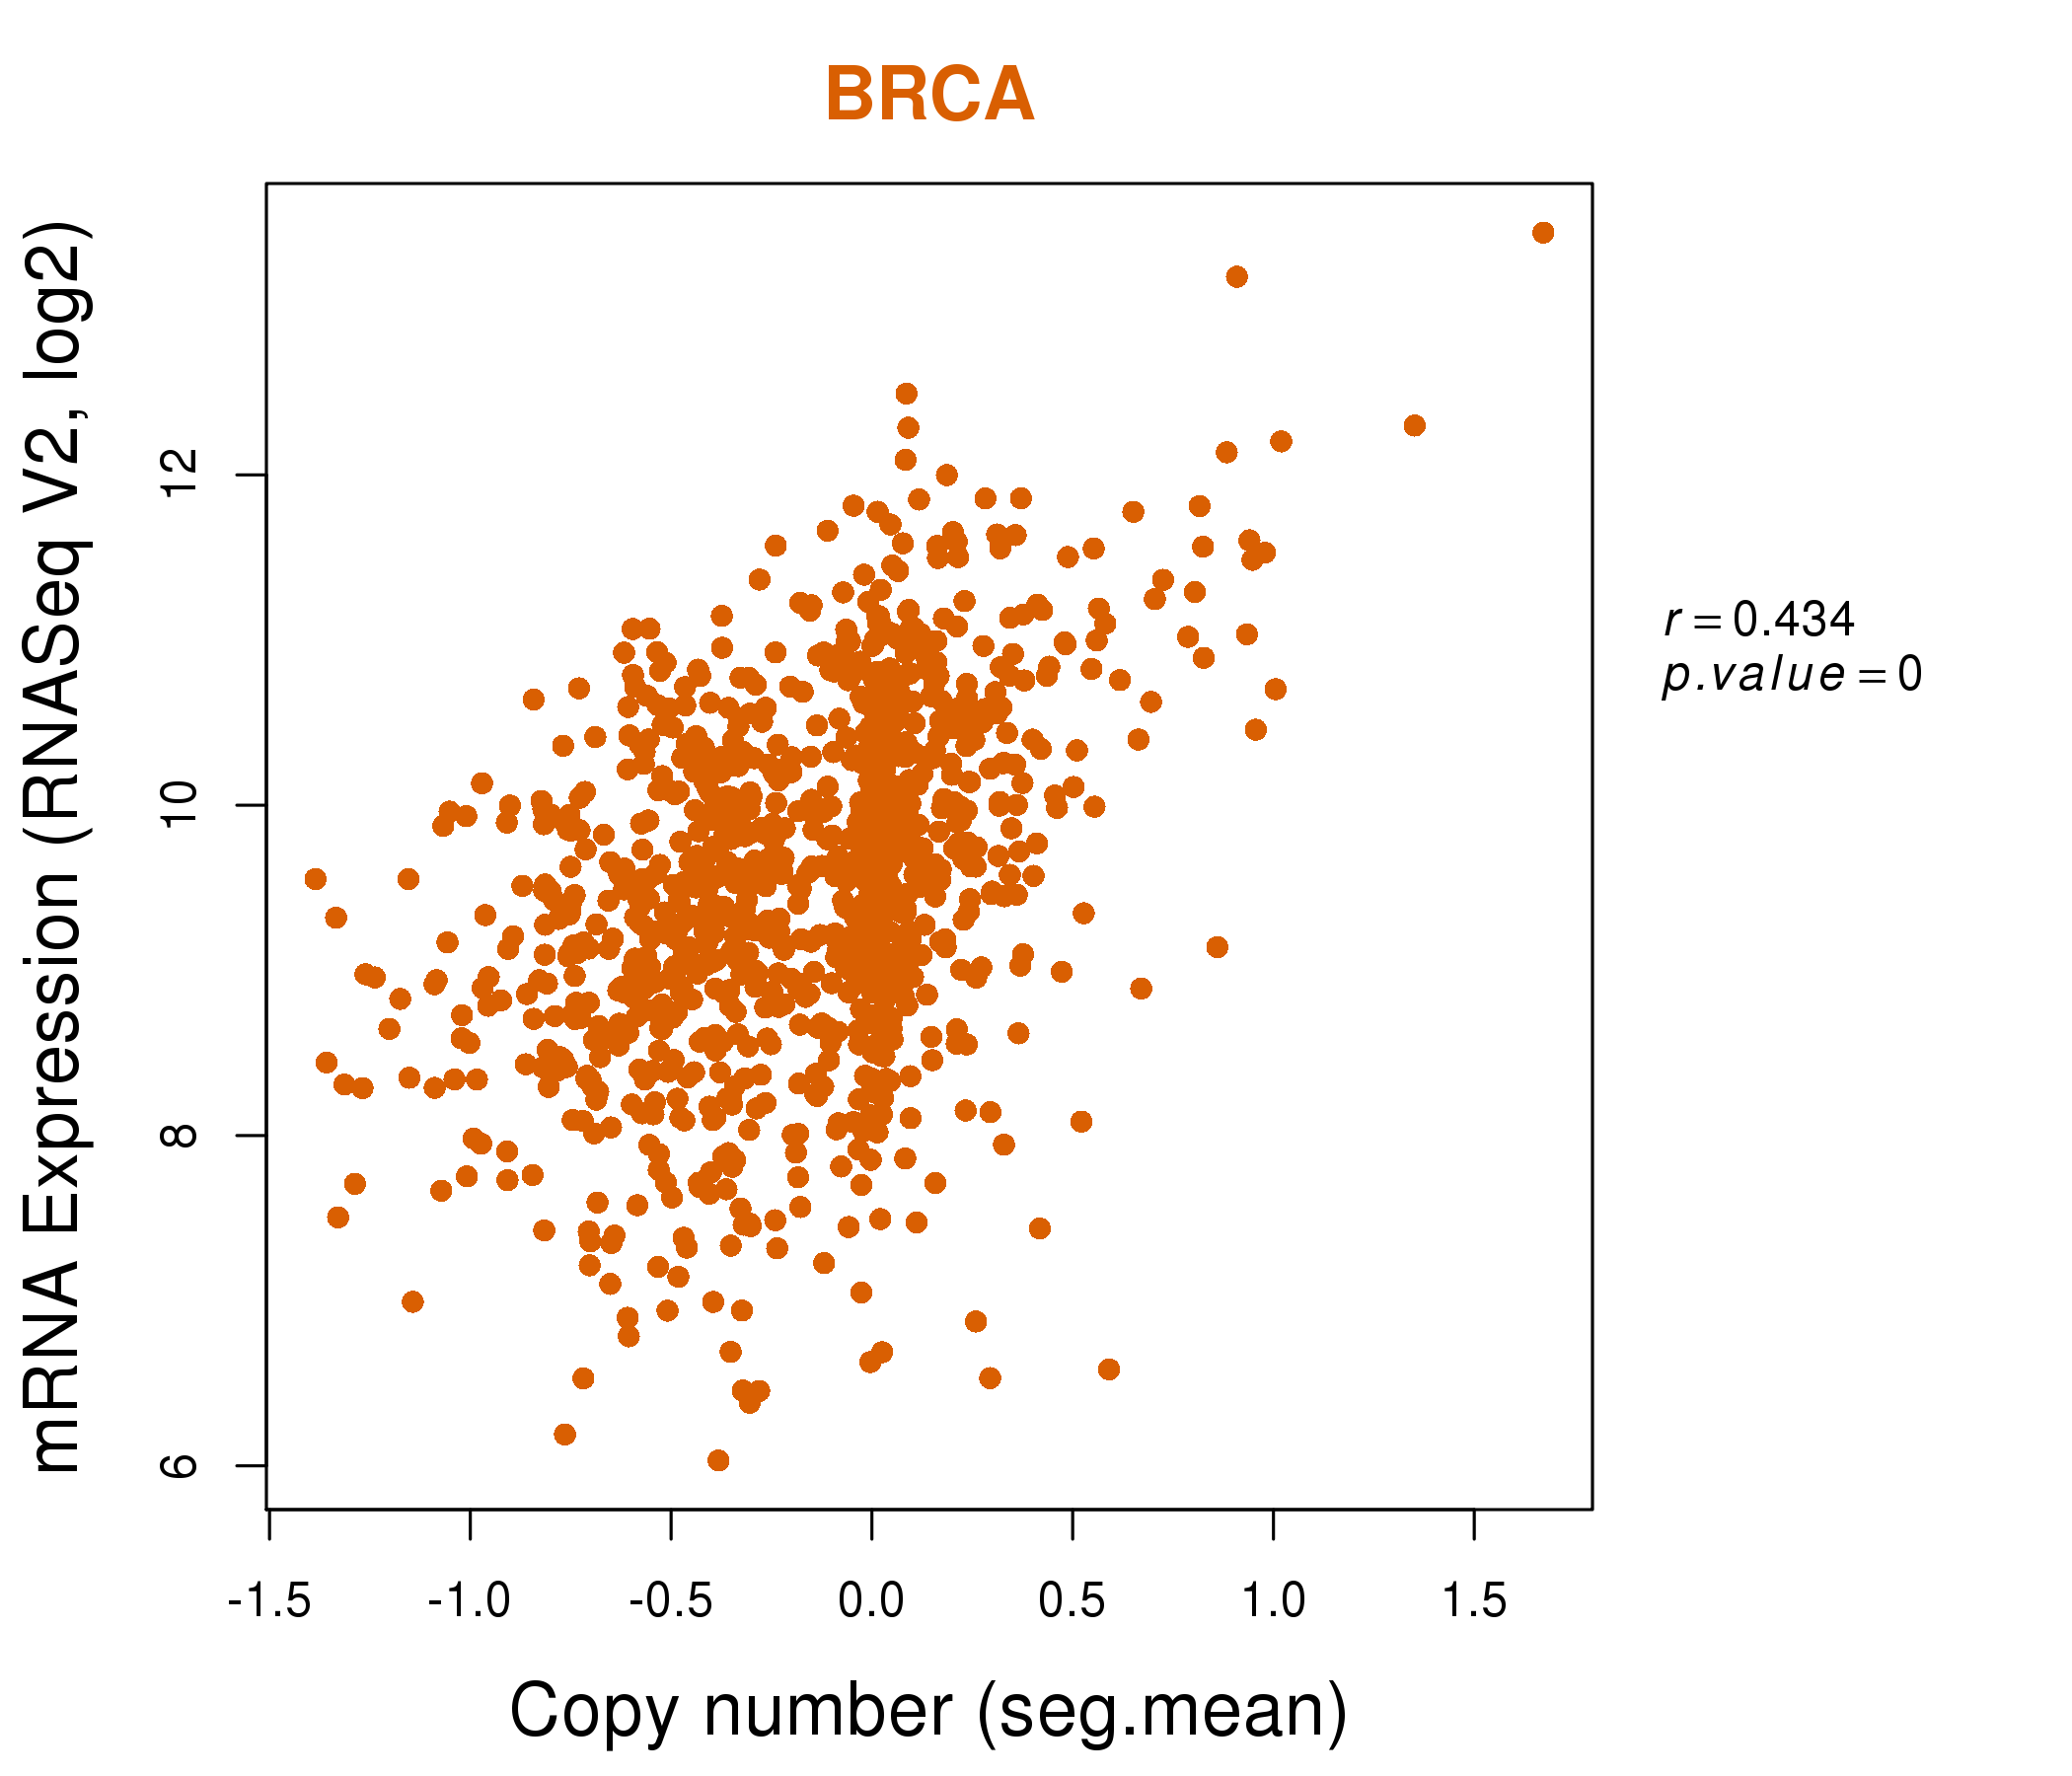
| * This plots show the correlation between CNV and gene expression. |
: Open all plots for all cancer types
 |
|
 |
|
| Top |
| Gene-Gene Network Information |
| * Co-Expression network figures were drawn using R package igraph. Only the top 20 genes with the highest correlations were shown. Red circle: input gene, orange circle: cell metabolism gene, sky circle: other gene |
: Open all plots for all cancer types
 |
| ||||
| BNIP3L,CCDC25,DOPEY2,EIF2AK3,GSR,GTF2E2,HMBOX1, IDE,KIAA1244,PPP2CB,PRRC1,SCARB2,SEC16A,SEC24A, SH2D4A,SLC35F5,SPTLC2,TRIP11,UBR1,UBXN8,WRN | AHCY,ARSH,ASTN2,CENPO,CXCL6,FAM83A,FBN2, GSR,HIST1H2BH,HOXC10,HS6ST2,KCNJ13,KDM4A,LPAR3, MCM4,MUC6,PFKFB2,PRPS2,RACGAP1,SLC39A11,TIMELESS | ||||
 |
| ||||
| AGPAT5,TTI2,CCDC25,DCTN6,ELP3,ERI1,ESCO2, FUT10,GSR,GTF2E2,INTS10,INTS9,LEPROTL1,MAK16, PBK,PPP2CB,PPP2R2A,SARAF,TNFRSF10A,UBXN8,XPO7 | ACP1,AGR3,ARFIP2,C1orf131,CCDC125,GSR,H2AFY, JTB,KRTCAP3,MAPKAPK5,MGST2,NECAP1,NT5DC1,NUDT5, PDSS1,PI4K2B,SS18L2,TMEM106C,TOM1L1,TXNDC12,ZNF468 |


| * Co-Expression network figures were drawn using R package igraph. Only the top 20 genes with the highest correlations were shown. Red circle: input gene, orange circle: cell metabolism gene, sky circle: other gene |
: Open all plots for all cancer types
| Top |
: Open all interacting genes' information including KEGG pathway for all interacting genes from DAVID
| Top |
| Pharmacological Information for GSR |
| DB Category | DB Name | DB's ID and Url link |
| * Gene Centered Interaction Network. |
 |
| * Drug Centered Interaction Network. |
| DrugBank ID | Target Name | Drug Groups | Generic Name | Drug Centered Network | Drug Structure |
| DB00143 | glutathione reductase | approved; nutraceutical | Glutathione |  |  |
| DB00157 | glutathione reductase | approved; nutraceutical | NADH |  |  |
| DB00262 | glutathione reductase | approved | Carmustine | 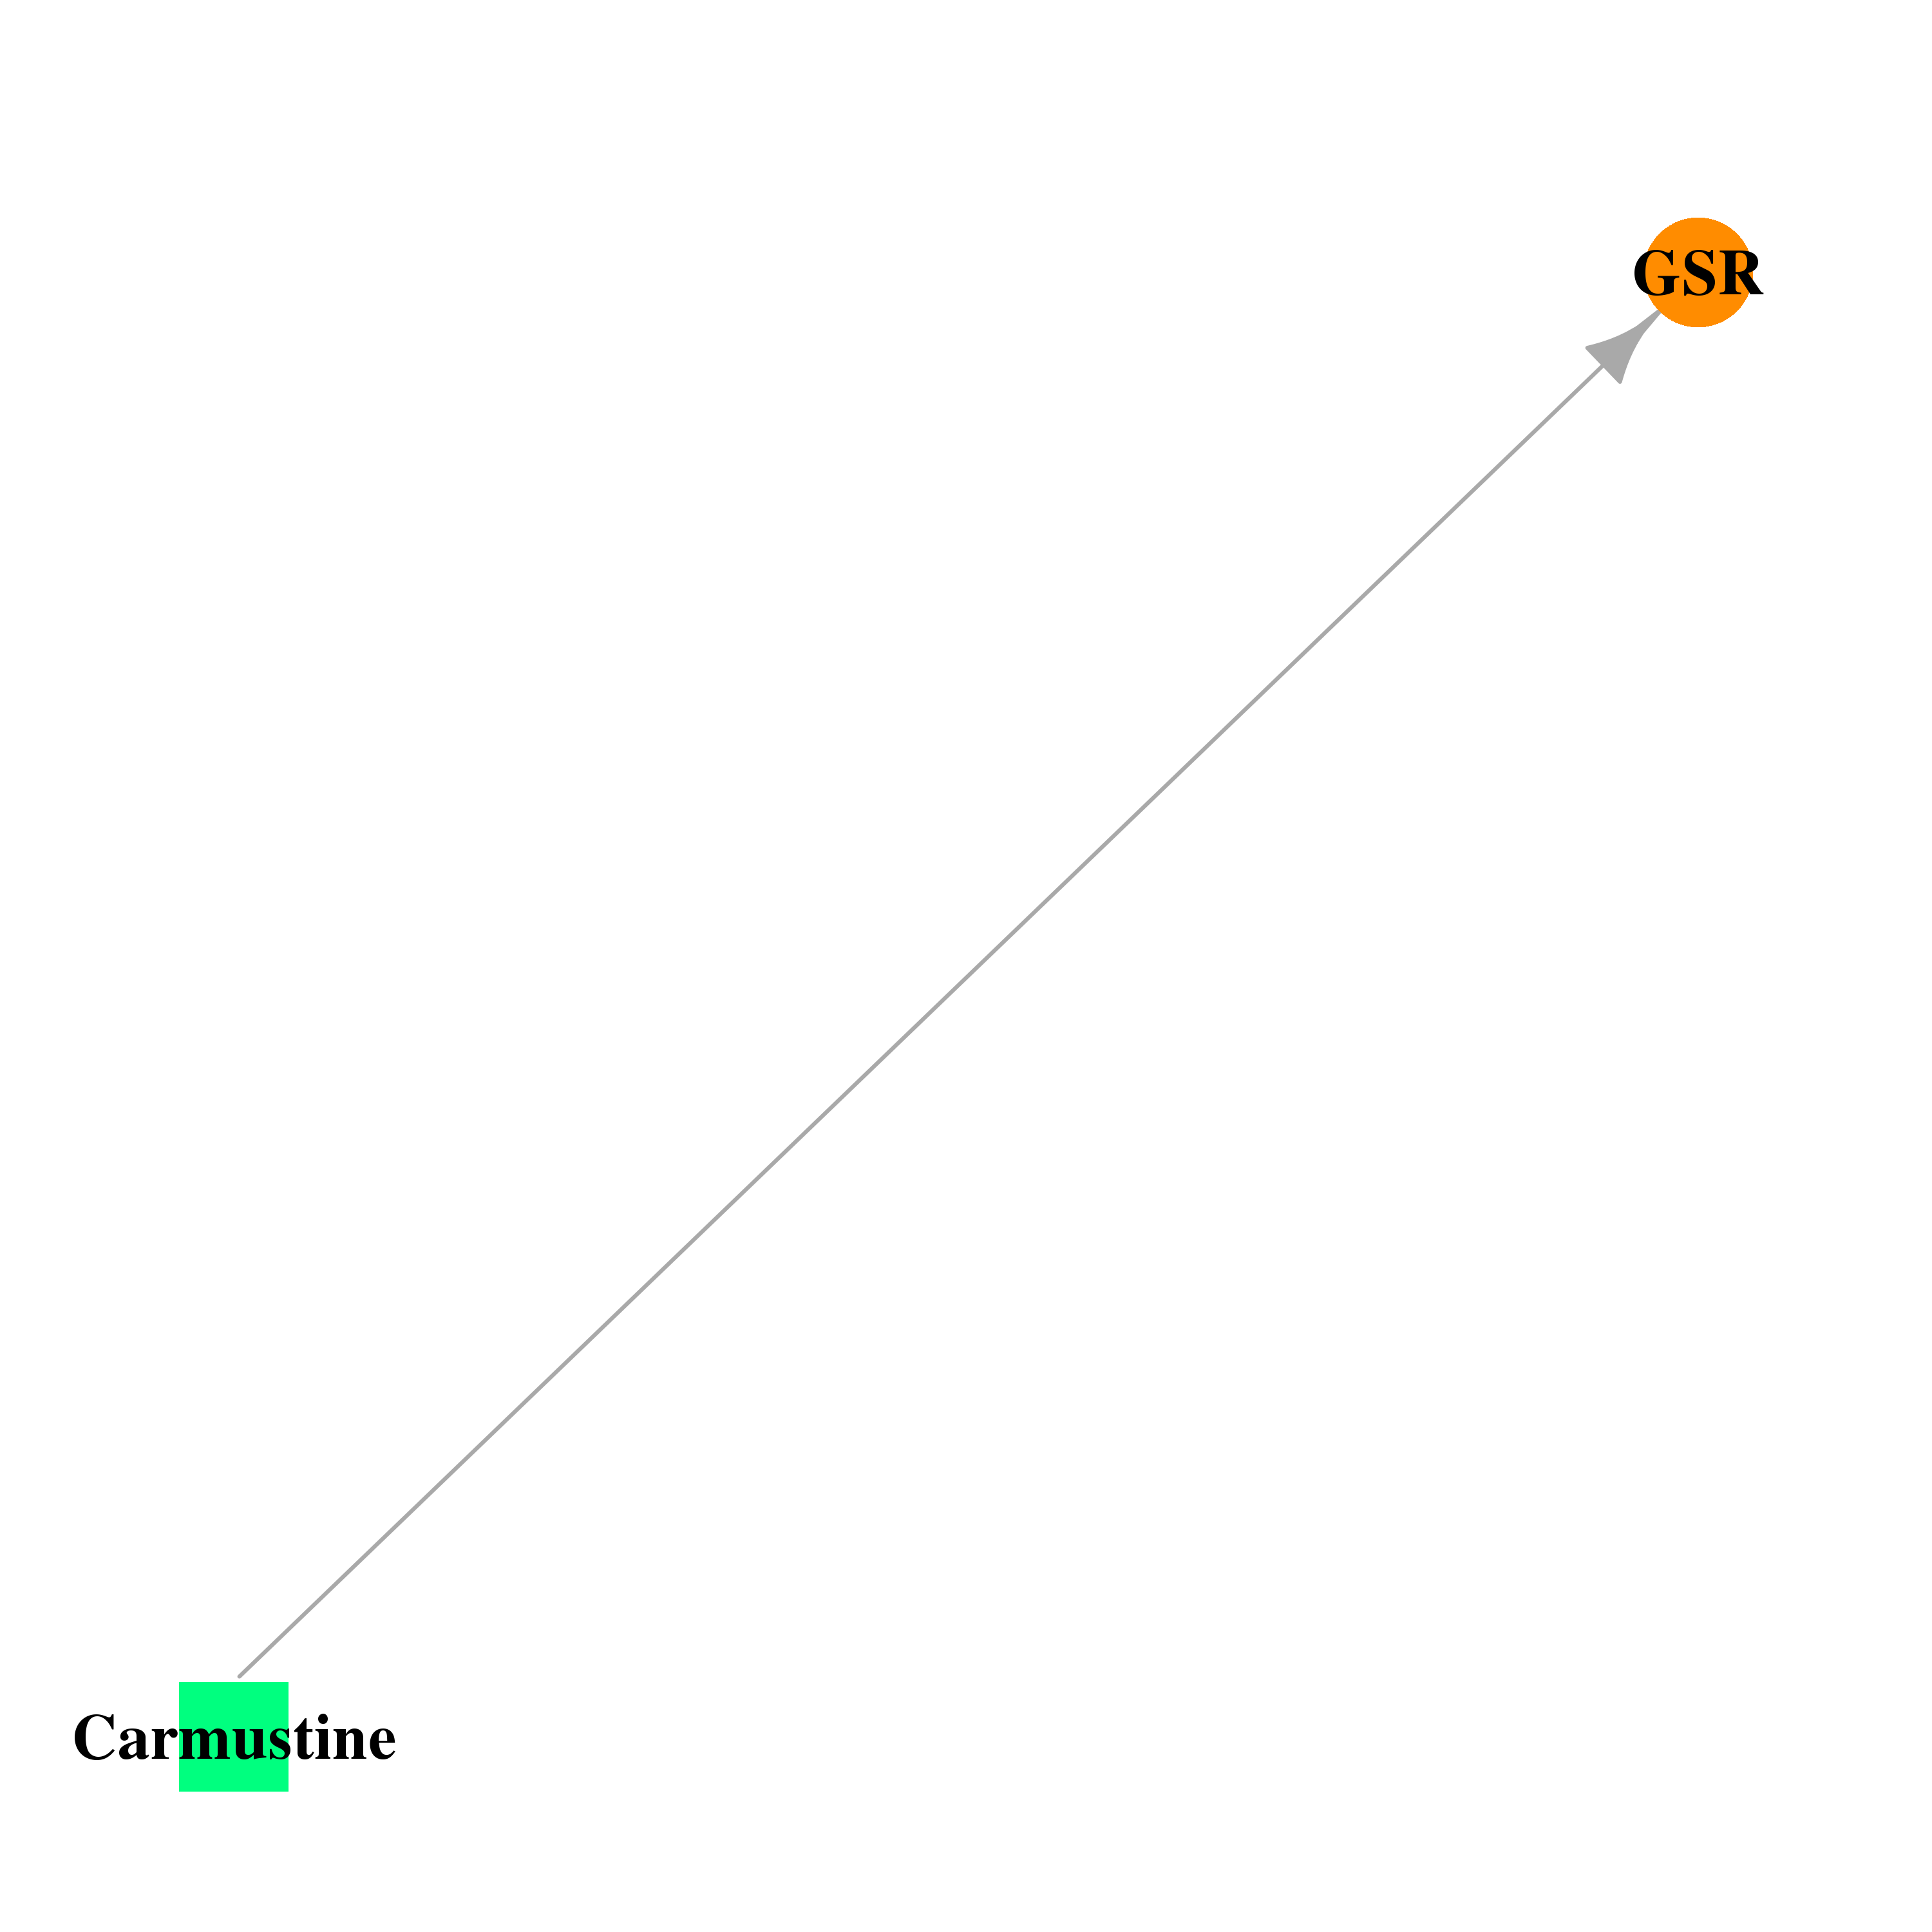 |  |
| DB01644 | glutathione reductase | experimental | 3,6-Dihydroxy-Xanthene-9-Propionic Acid |  |  |
| DB01907 | glutathione reductase | experimental | Nicotinamide-Adenine-Dinucleotide | 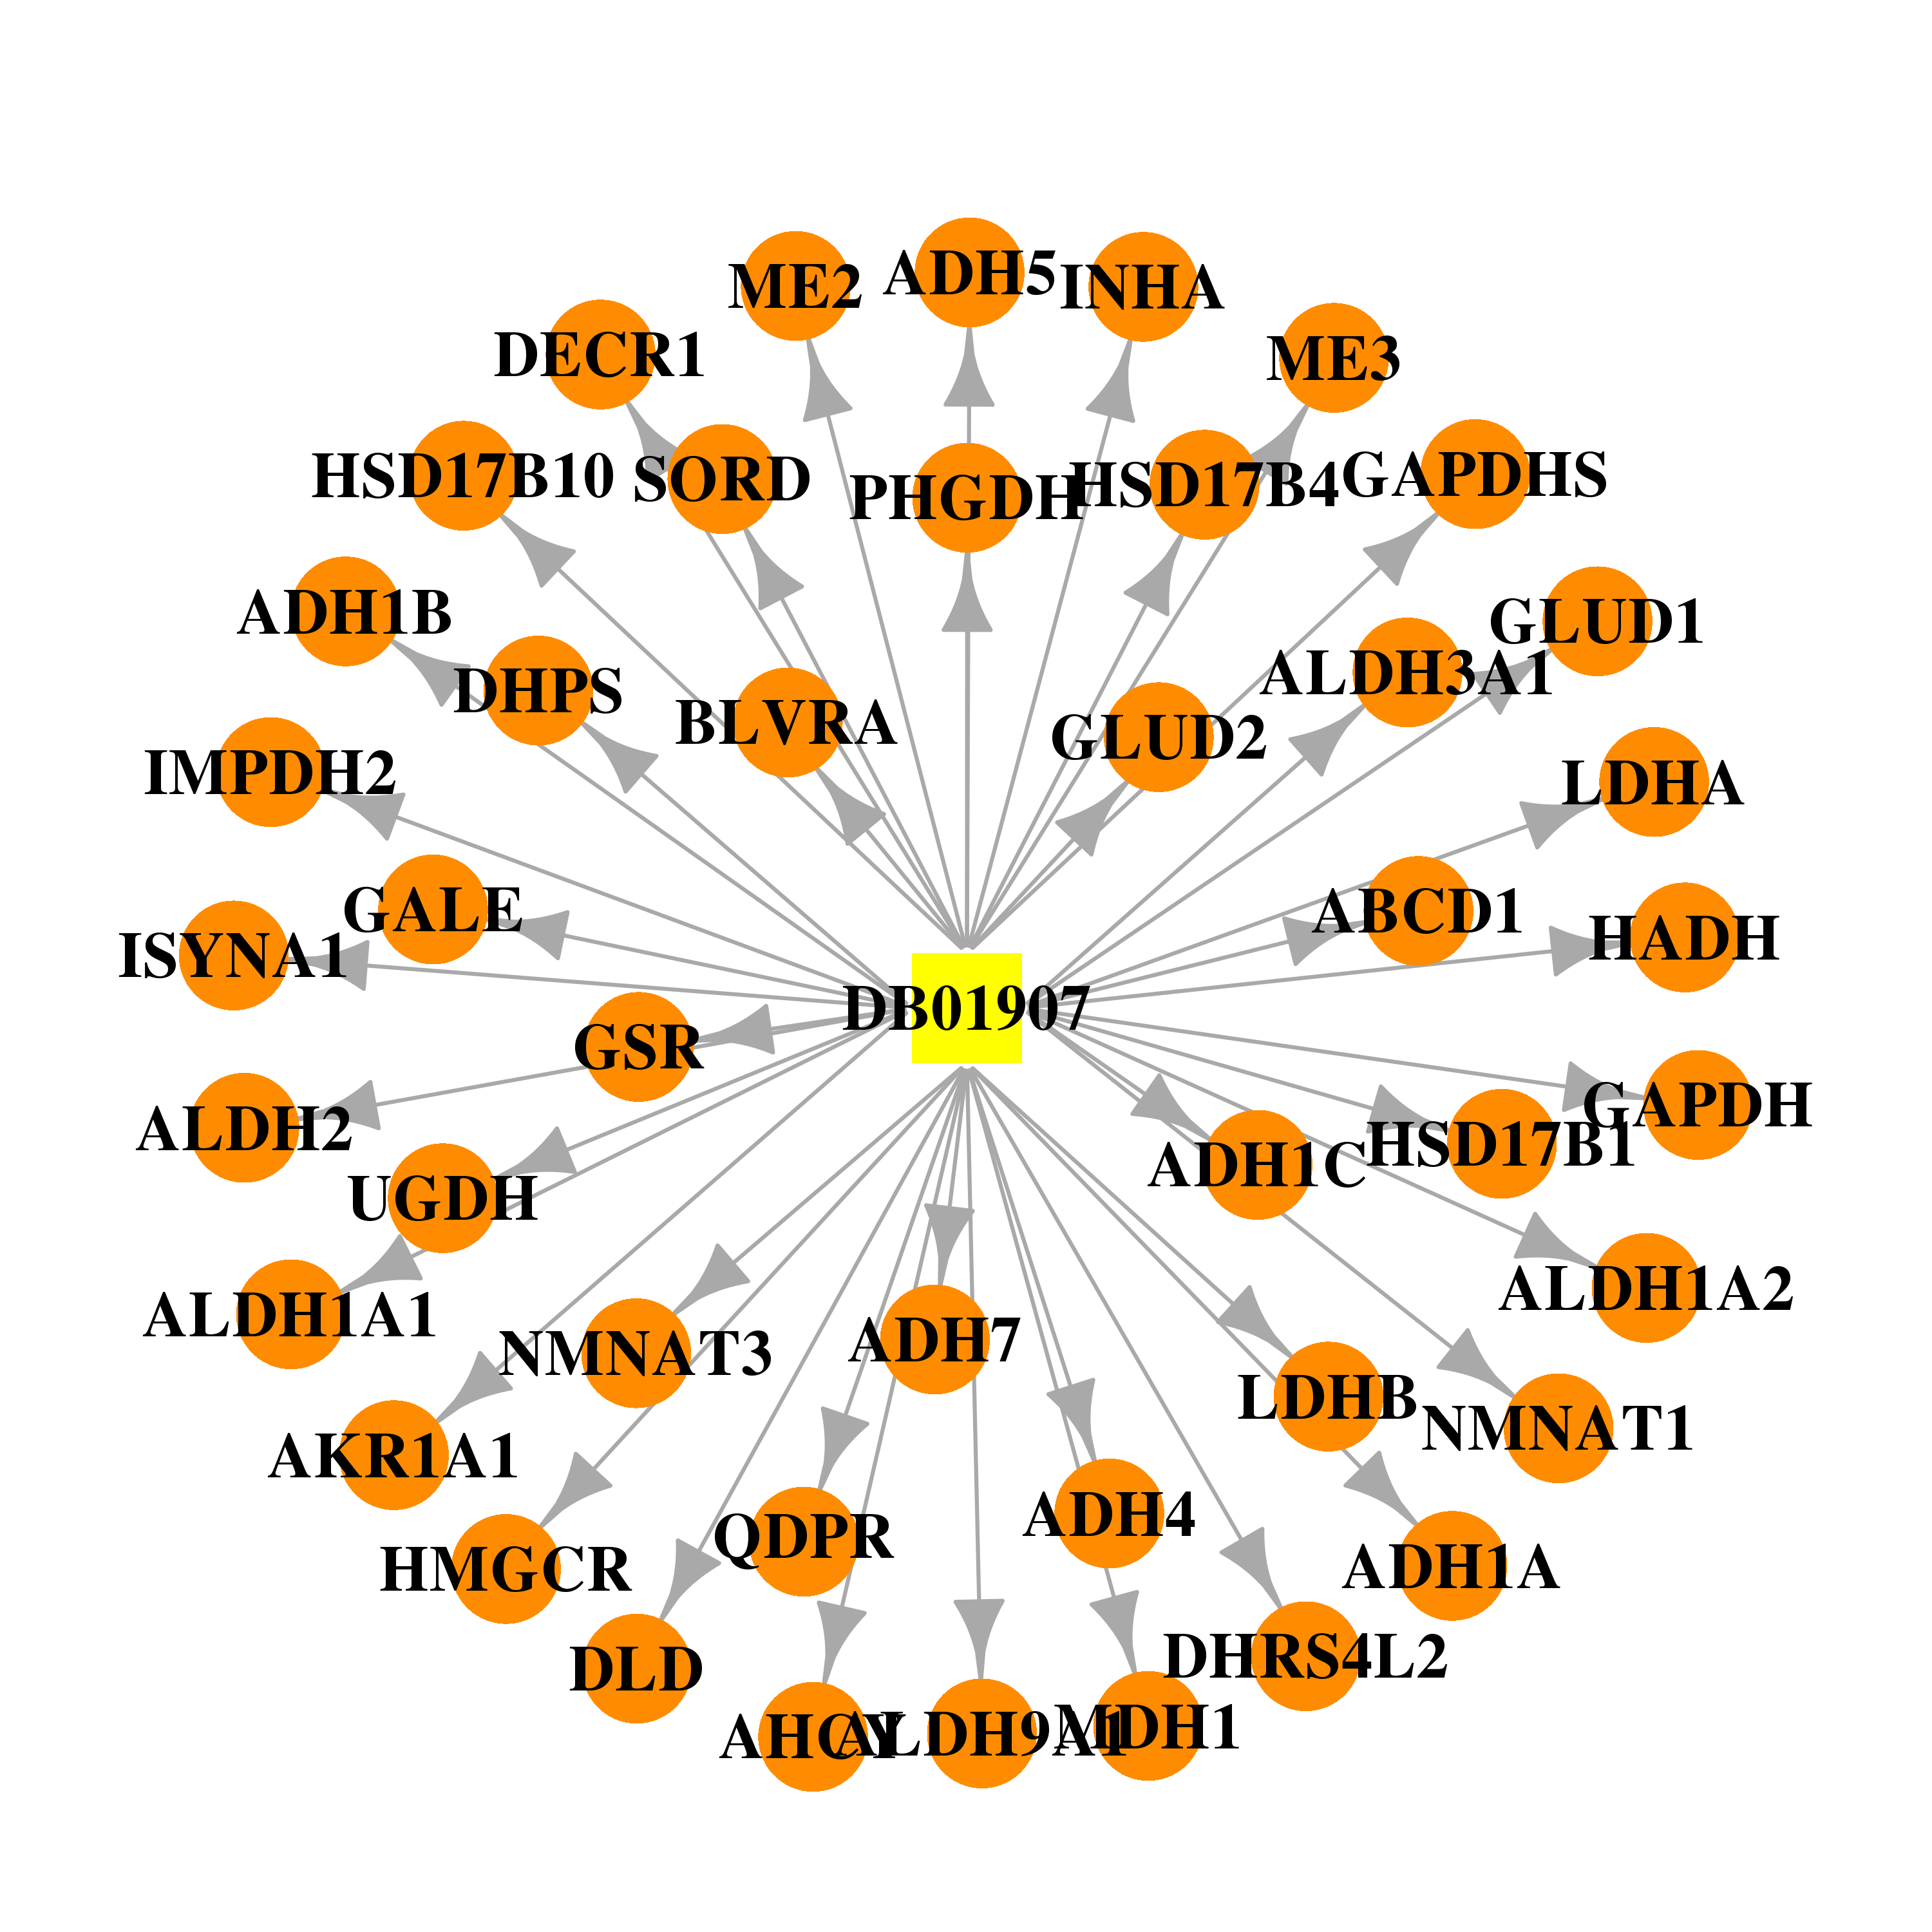 | 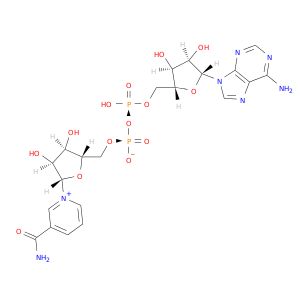 |
| DB02153 | glutathione reductase | experimental | 3-Sulfinoalanine |  |  |
| DB02553 | glutathione reductase | experimental | Glutathionylspermidine Disulfide |  |  |
| DB02895 | glutathione reductase | experimental | 3-(Prop-2-Ene-1-Sulfinyl)-Propene-1-Thiol |  | 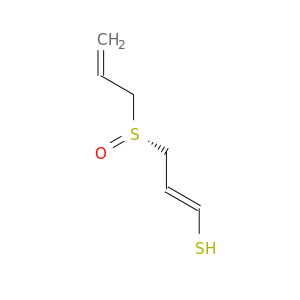 |
| DB03147 | glutathione reductase | experimental | Flavin-Adenine Dinucleotide | 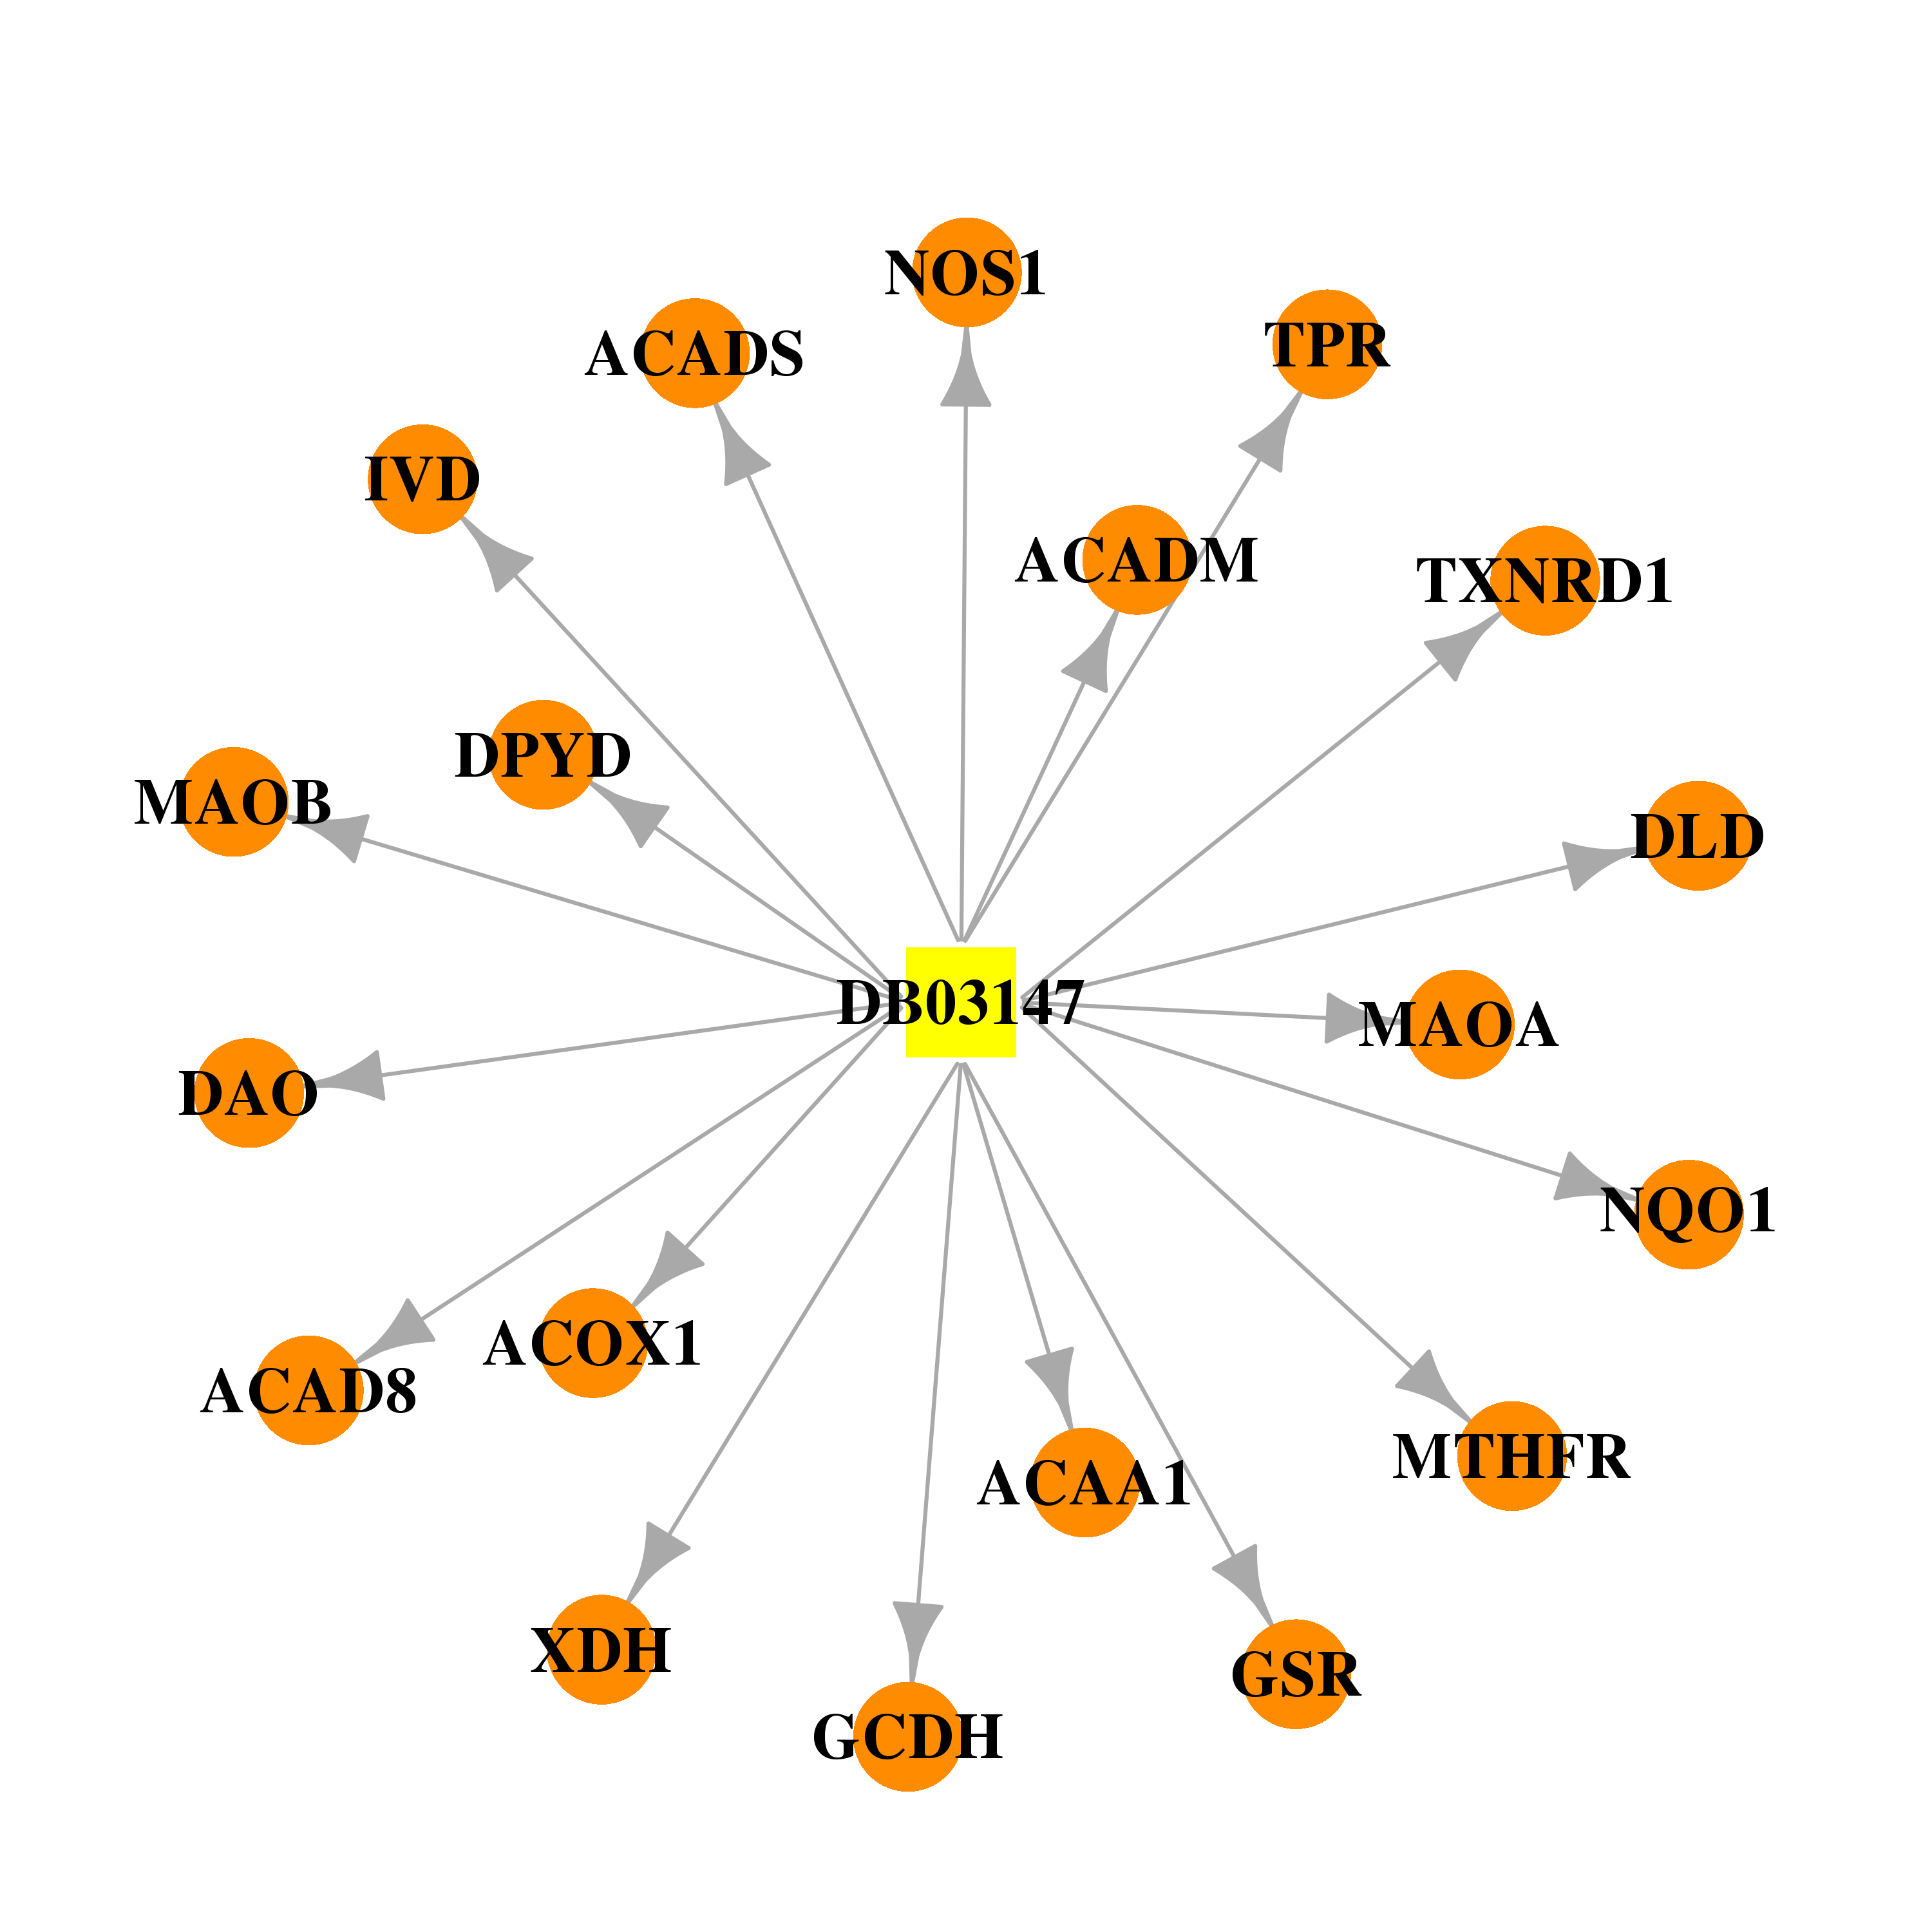 |  |
| DB03310 | glutathione reductase | experimental | Oxidized Glutathione Disulfide | 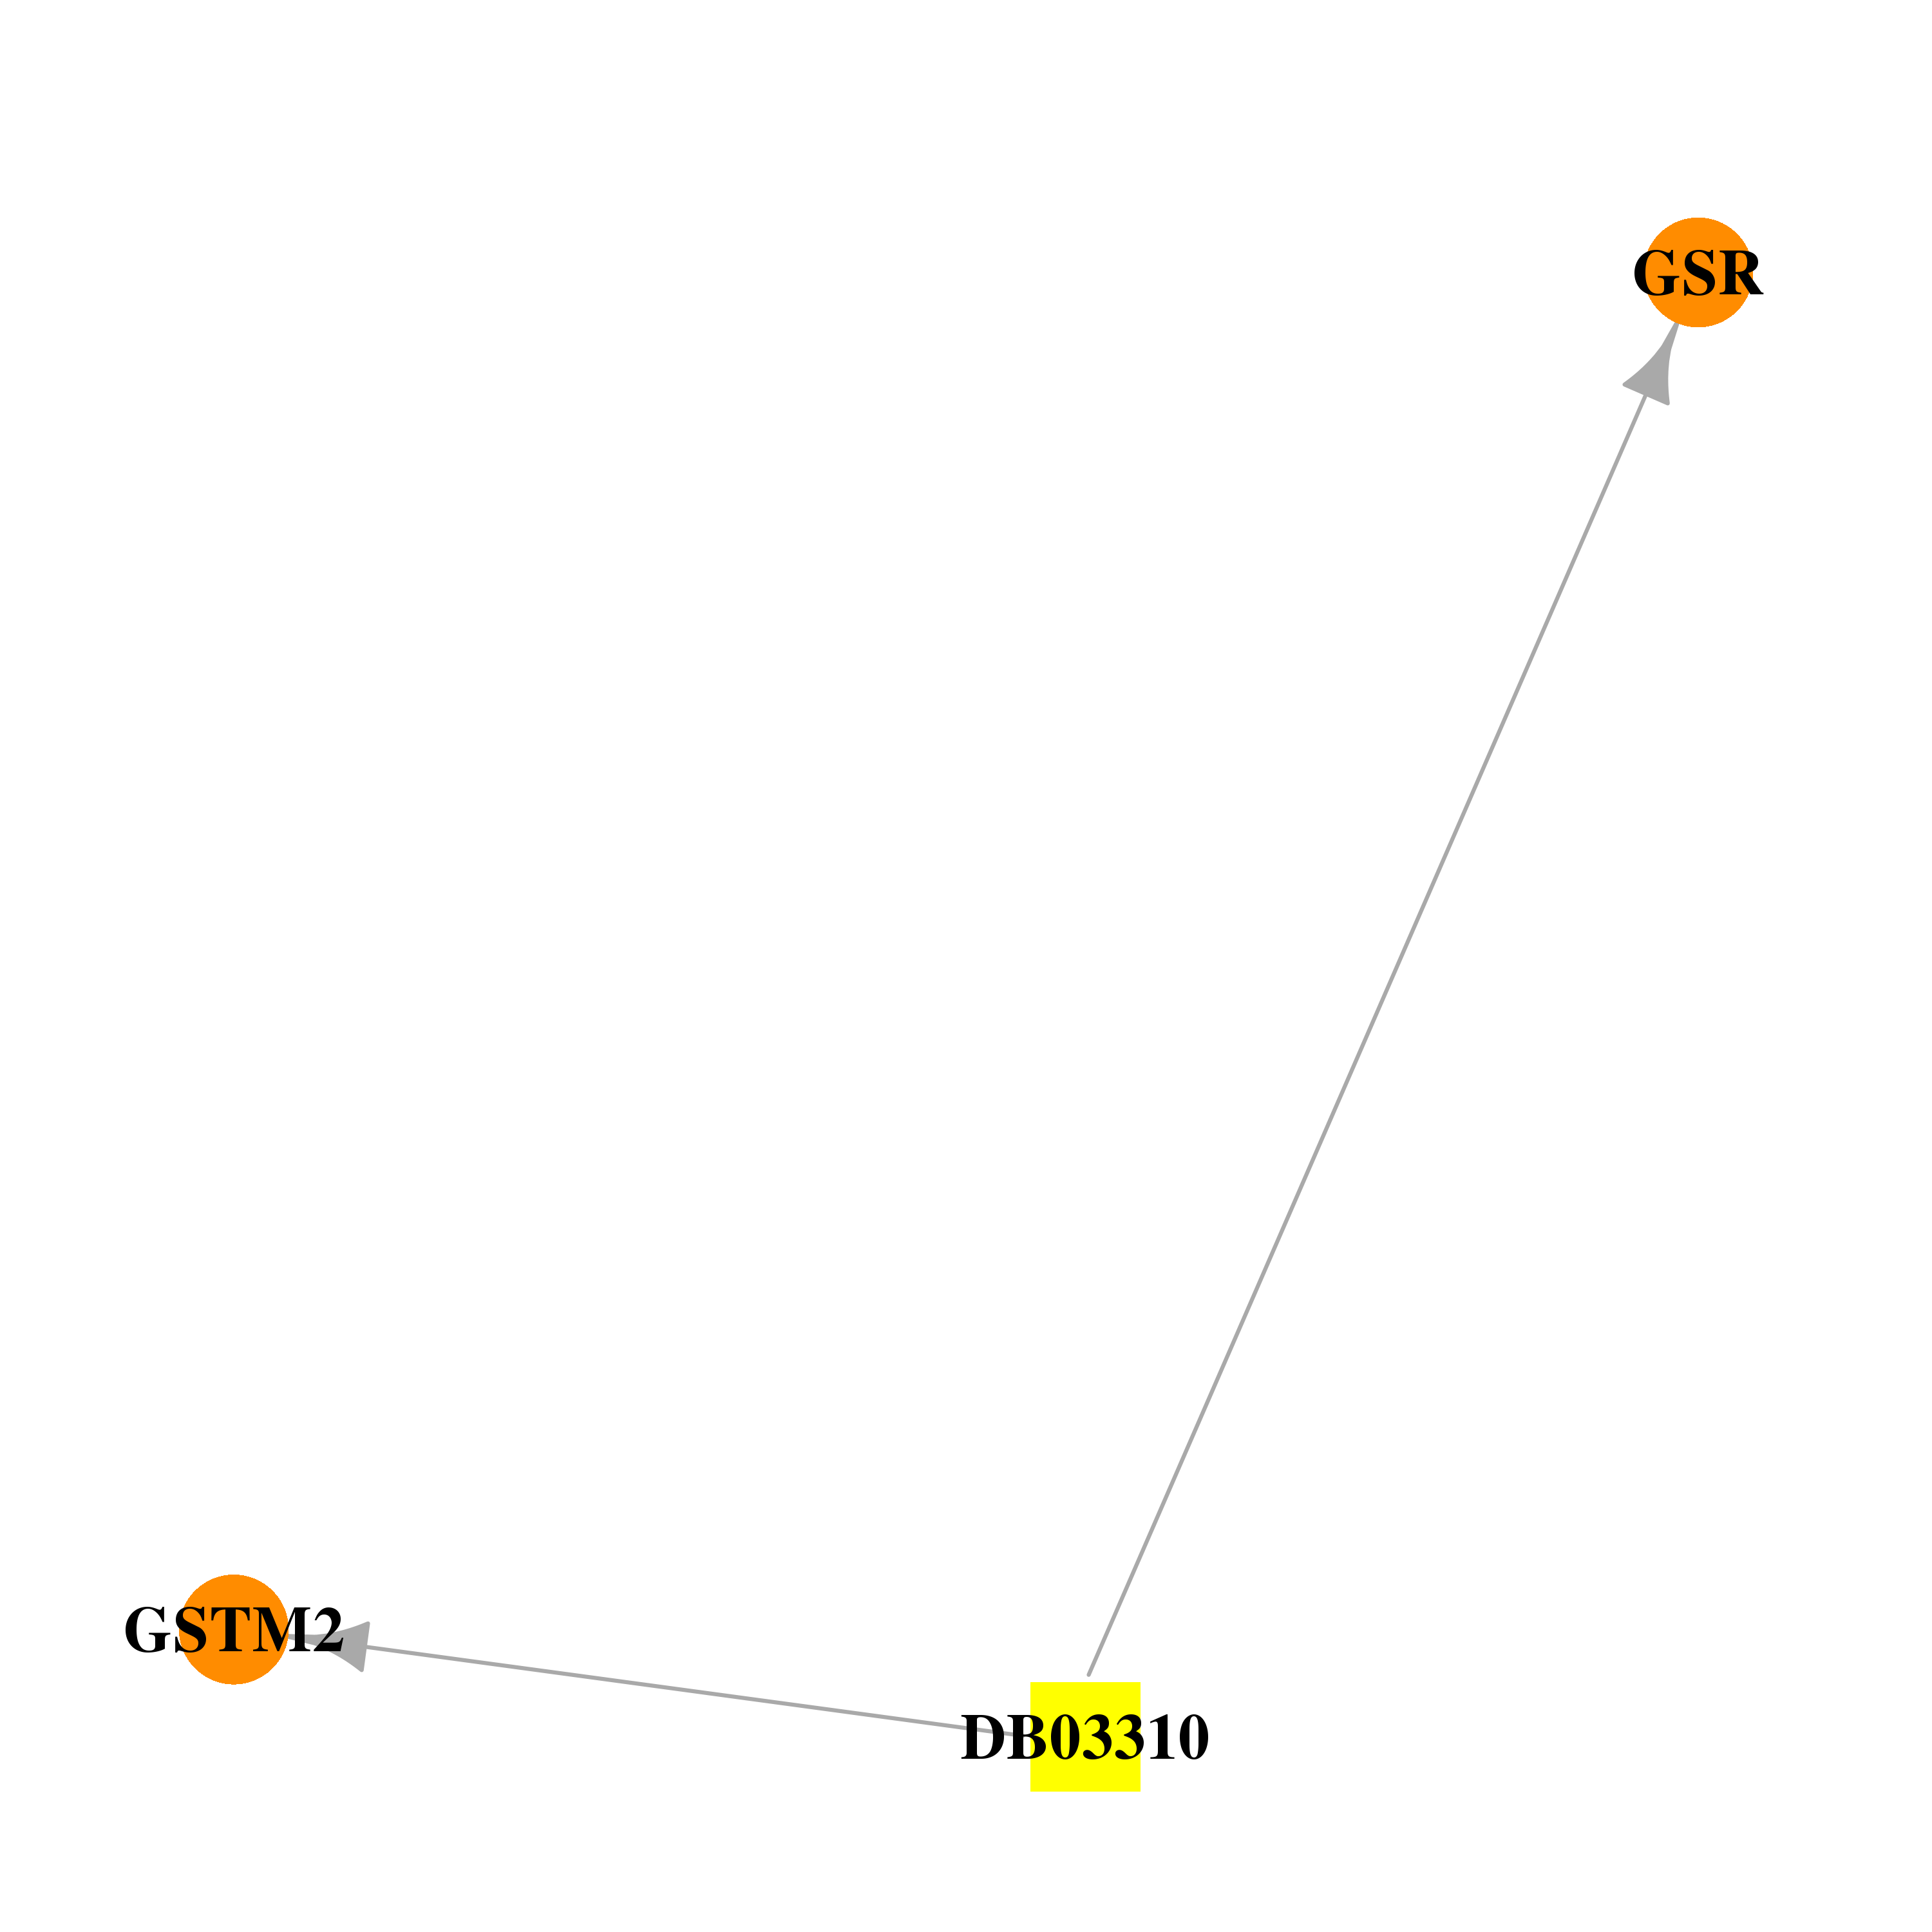 |  |
| DB03867 | glutathione reductase | experimental | Meta-Nitro-Tyrosine | 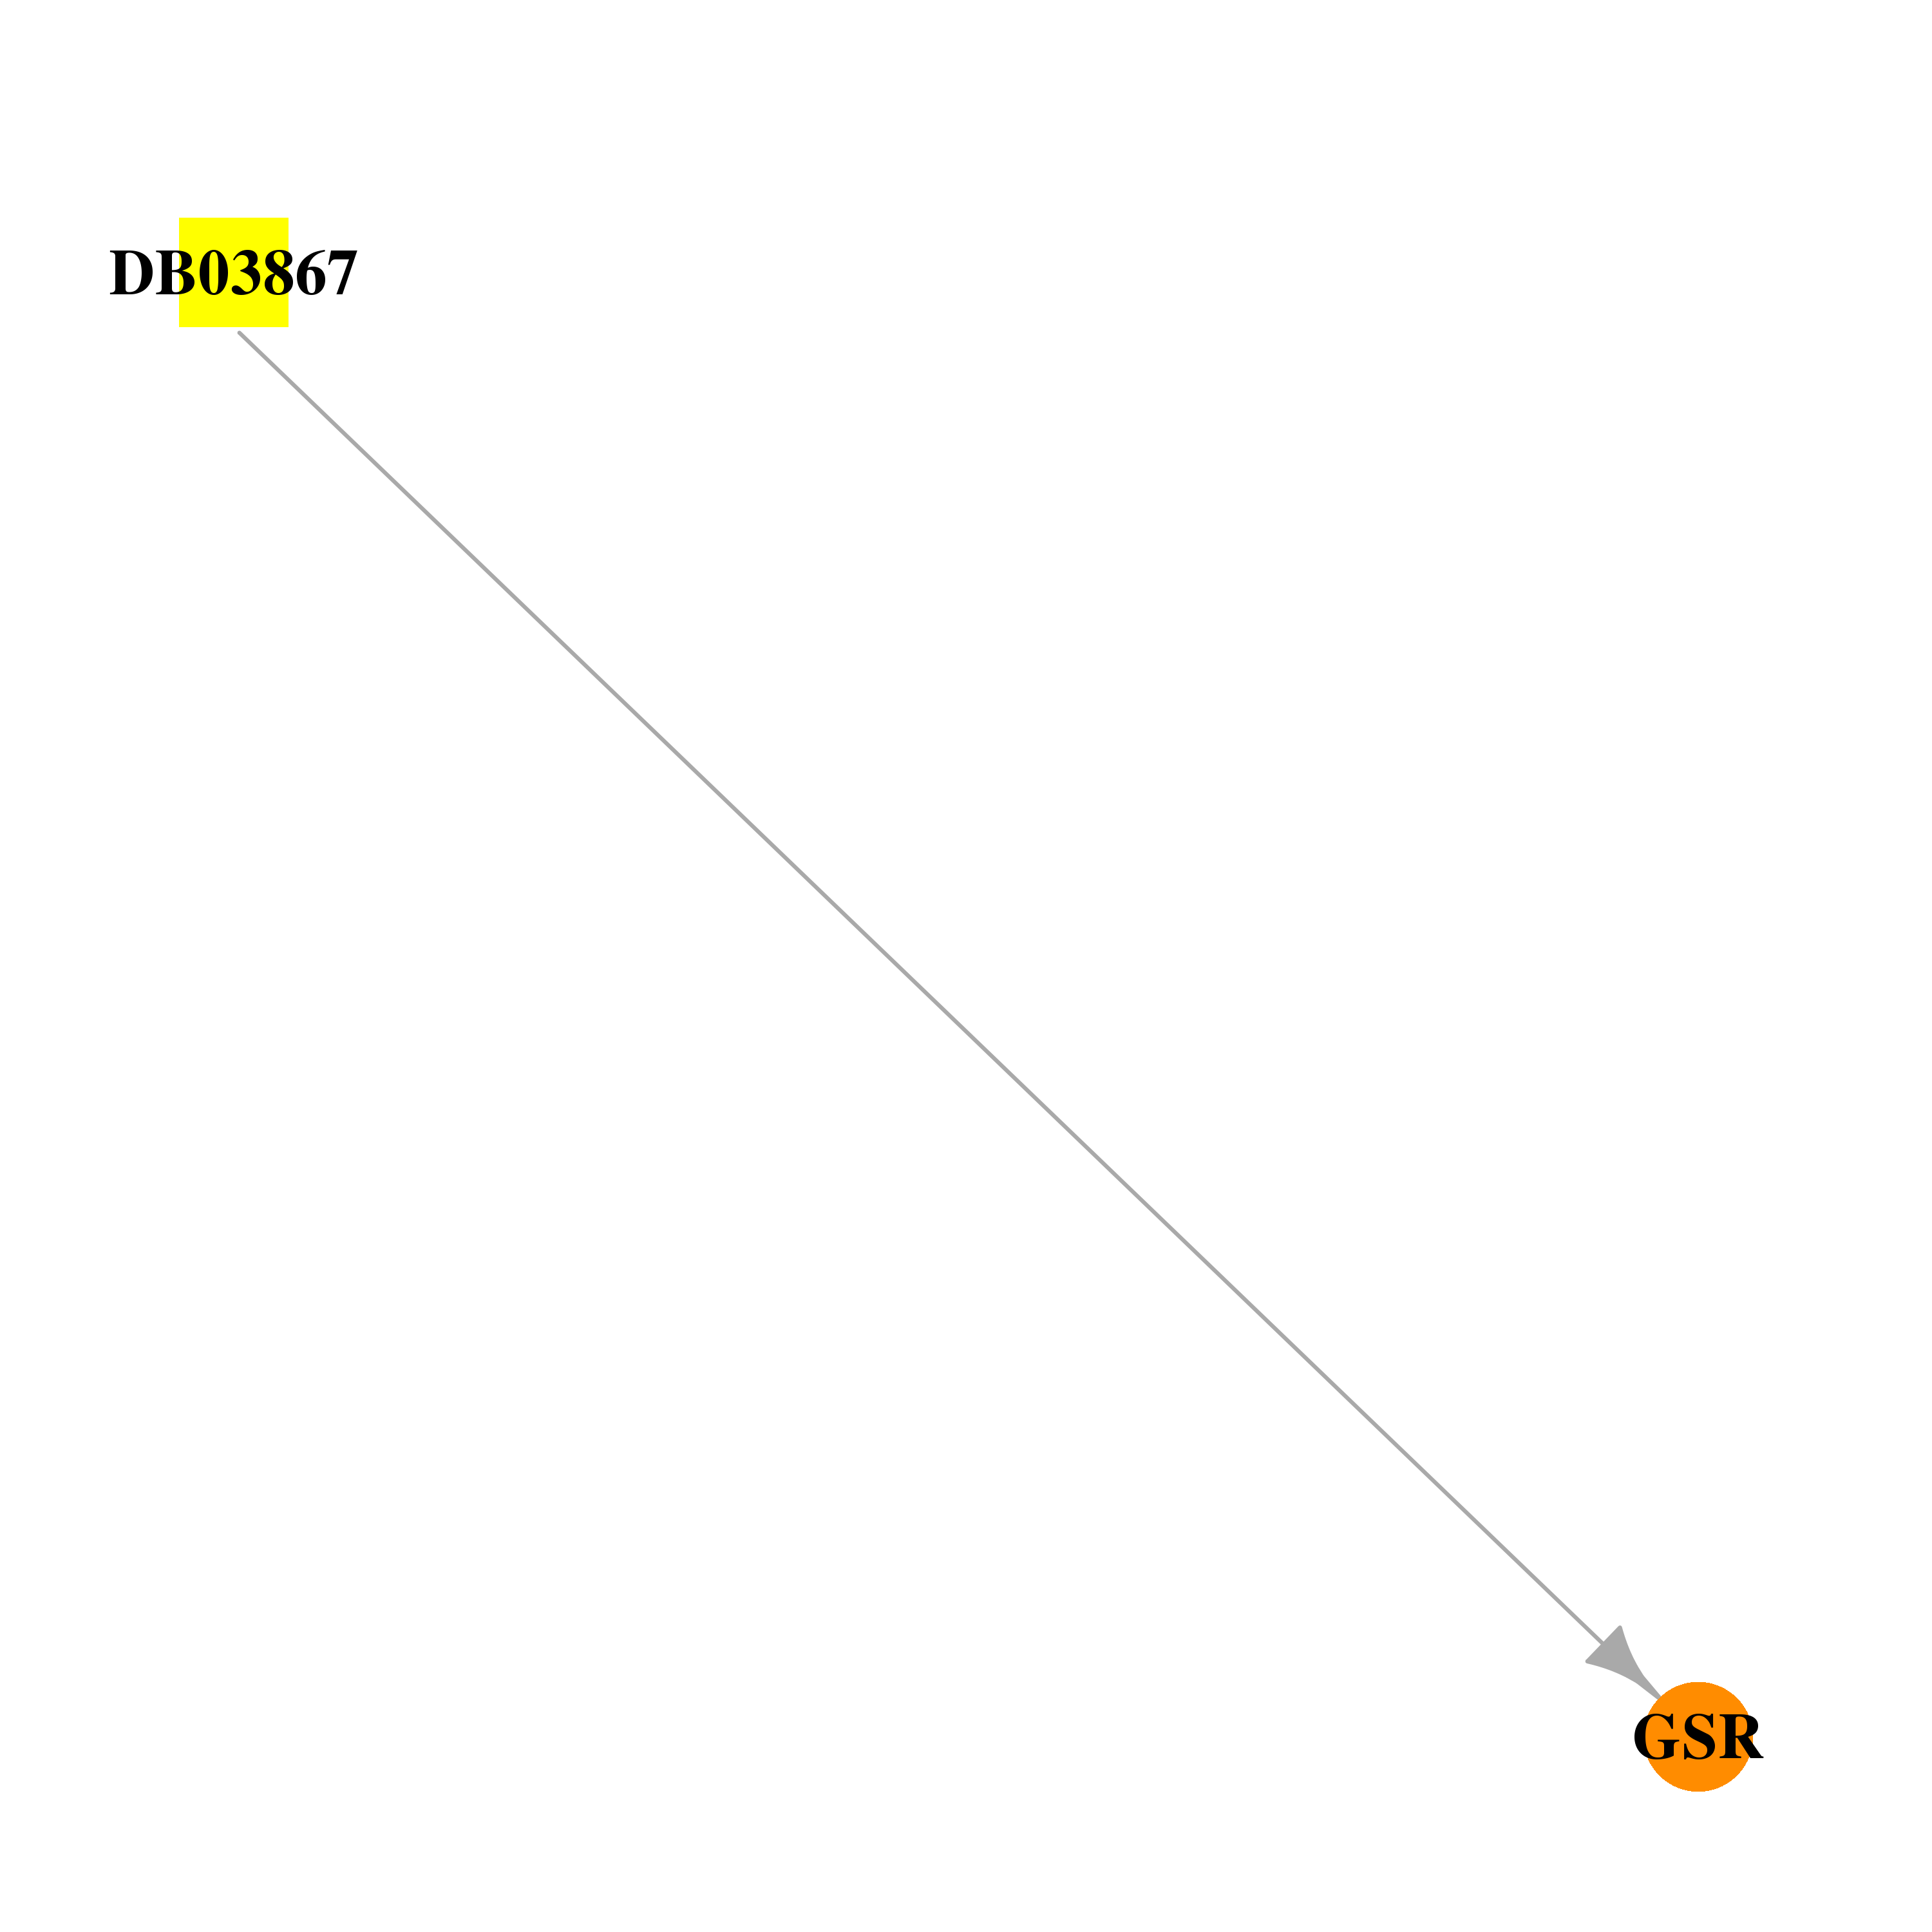 |  |
| DB07393 | glutathione reductase | experimental | 2-(2-PHENYL-3-PYRIDIN-2-YL-4,5,6,7-TETRAHYDRO-2H-ISOPHOSPHINDOL-1-YL)PYRIDINE |  |  |
| DB07714 | glutathione reductase | experimental | 6-(3-METHYL-1,4-DIOXO-1,4-DIHYDRONAPHTHALEN-2-YL)HEXANOIC ACID | 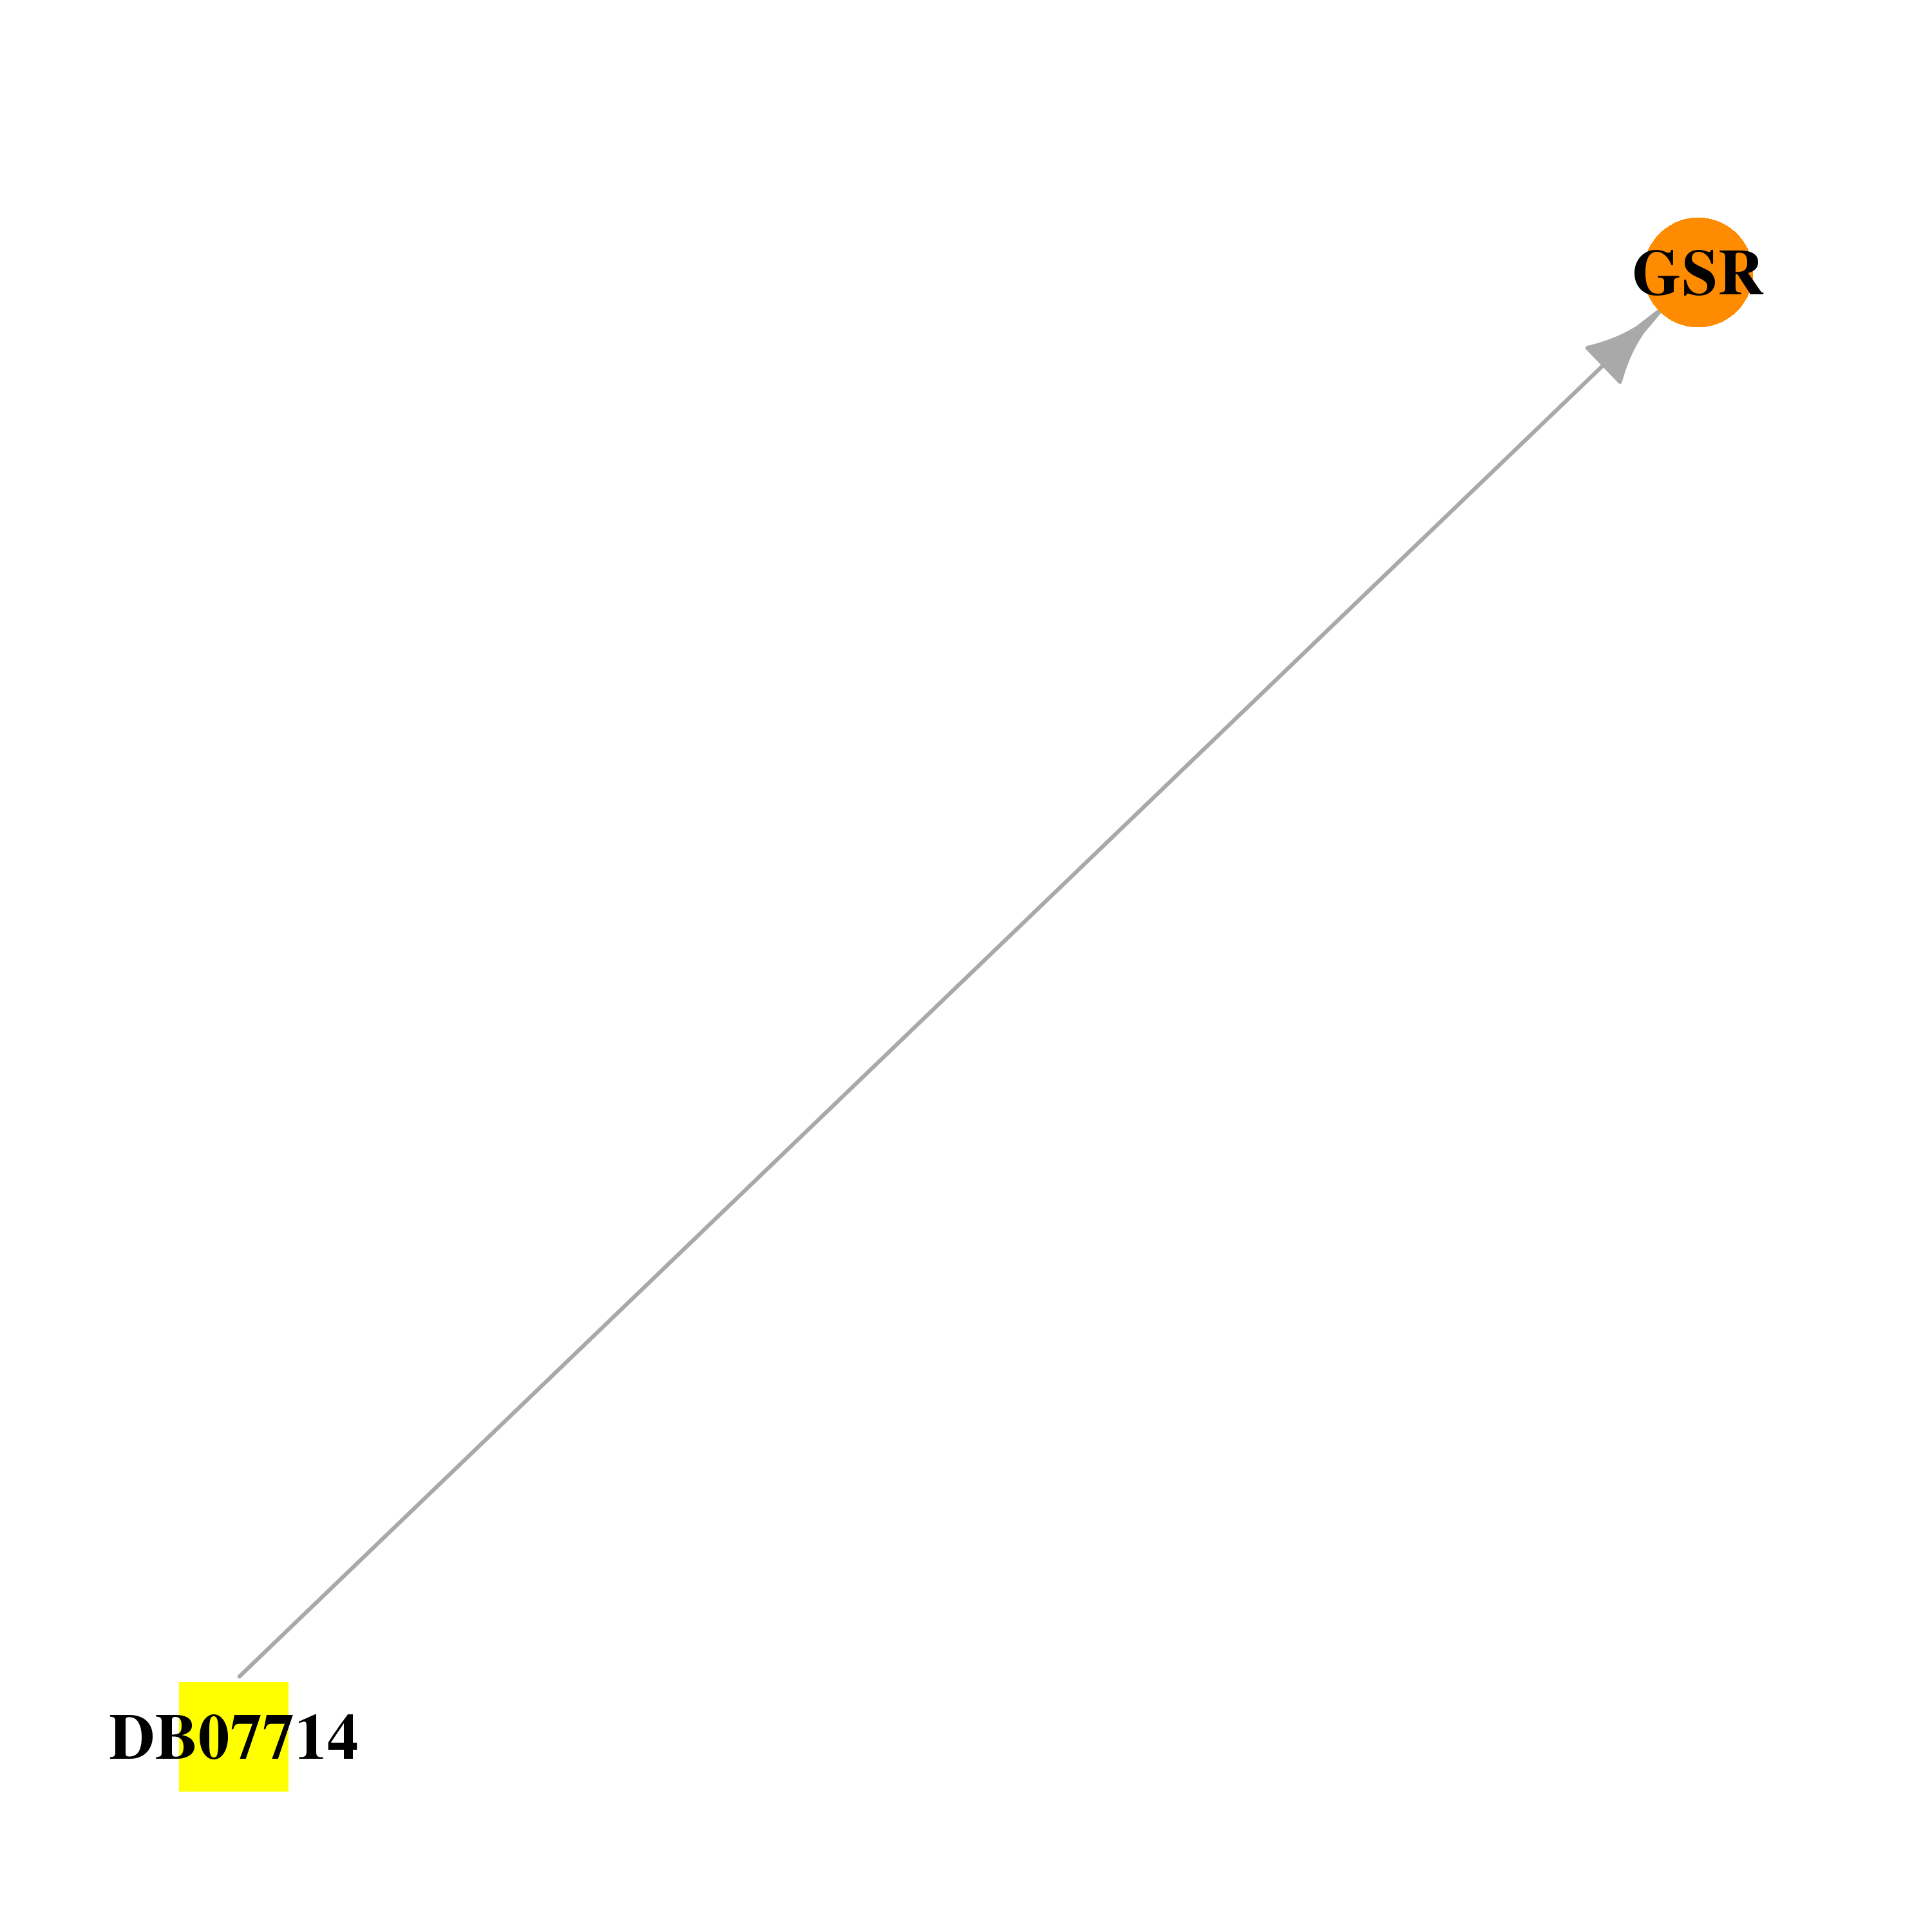 | 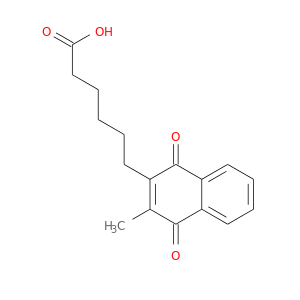 |
| DB00515 | glutathione reductase | approved | Cisplatin |  |  |
| Top |
| Cross referenced IDs for GSR |
| * We obtained these cross-references from Uniprot database. It covers 150 different DBs, 18 categories. http://www.uniprot.org/help/cross_references_section |
: Open all cross reference information
|
Copyright © 2016-Present - The Univsersity of Texas Health Science Center at Houston @ |