|
|||||||||||||||||||||||||||||||||||||||||||||||||||||||||||||||||||||||||||||||||||||||||||||||||||||||||||||||||||||||||||||||||||||||||||||||||||||||||||||||||||||||||||||||||||||||||||||||||||||||||||||||||||||||||||||||||||||||||||||||||||||||||||||||||||||||||||||||||||||||||||||||||||||||||||||||||||||||||||||||||||||||||||||||||||||||||||||||||||||||||||||||||||||||||||||
| |
| Phenotypic Information (metabolism pathway, cancer, disease, phenome) |
| |
| |
| Gene-Gene Network Information: Co-Expression Network, Interacting Genes & KEGG |
| |
|


| Gene Summary for GSS |
| Basic gene info. | Gene symbol | GSS |
| Gene name | glutathione synthetase | |
| Synonyms | GSHS|HEL-S-64p|HEL-S-88n | |
| Cytomap | UCSC genome browser: 20q11.2 | |
| Genomic location | chr20 :33516235-33543601 | |
| Type of gene | protein-coding | |
| RefGenes | NM_000178.2, | |
| Ensembl id | ENSG00000100983 | |
| Description | GSH synthetaseGSH-Sepididymis secretory sperm binding protein Li 64pepididymis secretory sperm binding protein Li 88nglutathione synthase | |
| Modification date | 20141207 | |
| dbXrefs | MIM : 601002 | |
| HGNC : HGNC | ||
| Ensembl : ENSG00000100983 | ||
| HPRD : 03000 | ||
| Vega : OTTHUMG00000032315 | ||
| Protein | UniProt: go to UniProt's Cross Reference DB Table | |
| Expression | CleanEX: HS_GSS | |
| BioGPS: 2937 | ||
| Gene Expression Atlas: ENSG00000100983 | ||
| The Human Protein Atlas: ENSG00000100983 | ||
| Pathway | NCI Pathway Interaction Database: GSS | |
| KEGG: GSS | ||
| REACTOME: GSS | ||
| ConsensusPathDB | ||
| Pathway Commons: GSS | ||
| Metabolism | MetaCyc: GSS | |
| HUMANCyc: GSS | ||
| Regulation | Ensembl's Regulation: ENSG00000100983 | |
| miRBase: chr20 :33,516,235-33,543,601 | ||
| TargetScan: NM_000178 | ||
| cisRED: ENSG00000100983 | ||
| Context | iHOP: GSS | |
| cancer metabolism search in PubMed: GSS | ||
| UCL Cancer Institute: GSS | ||
| Assigned class in ccmGDB | C | |
| Top |
| Phenotypic Information for GSS(metabolism pathway, cancer, disease, phenome) |
| Cancer | CGAP: GSS |
| Familial Cancer Database: GSS | |
| * This gene is included in those cancer gene databases. |
|
|
|
|
|
| . | |||||||||||||||||||||||||||||||||||||||||||||||||||||||||||||||||||||||||||||||||||||||||||||||||||||||||||||||||||||||||||||||||||||||||||||||||||||||||||||||||||||||||||||||||||||||||||||||||||||||||||||||||||||||||||||||||||||||||||||||||||||||||||||||||||||||||||||||||||||||||||||||||||||||||||||||||||||||||||||||||||||||||||||||||||||||||||||||||||||||||||||||||||||||
Oncogene 1 | Significant driver gene in | ||||||||||||||||||||||||||||||||||||||||||||||||||||||||||||||||||||||||||||||||||||||||||||||||||||||||||||||||||||||||||||||||||||||||||||||||||||||||||||||||||||||||||||||||||||||||||||||||||||||||||||||||||||||||||||||||||||||||||||||||||||||||||||||||||||||||||||||||||||||||||||||||||||||||||||||||||||||||||||||||||||||||||||||||||||||||||||||||||||||||||||||||||||||||||||
| cf) number; DB name 1 Oncogene; http://nar.oxfordjournals.org/content/35/suppl_1/D721.long, 2 Tumor Suppressor gene; https://bioinfo.uth.edu/TSGene/, 3 Cancer Gene Census; http://www.nature.com/nrc/journal/v4/n3/abs/nrc1299.html, 4 CancerGenes; http://nar.oxfordjournals.org/content/35/suppl_1/D721.long, 5 Network of Cancer Gene; http://ncg.kcl.ac.uk/index.php, 1Therapeutic Vulnerabilities in Cancer; http://cbio.mskcc.org/cancergenomics/statius/ |
| KEGG_GLUTATHIONE_METABOLISM | |
| OMIM | |
| Orphanet | |
| Disease | KEGG Disease: GSS |
| MedGen: GSS (Human Medical Genetics with Condition) | |
| ClinVar: GSS | |
| Phenotype | MGI: GSS (International Mouse Phenotyping Consortium) |
| PhenomicDB: GSS | |
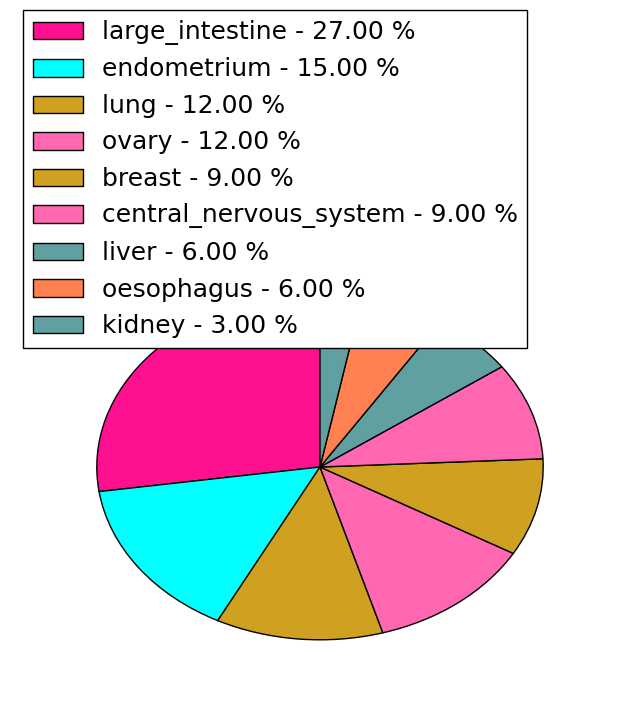
| Mutations for GSS |
| * Under tables are showing count per each tissue to give us broad intuition about tissue specific mutation patterns.You can go to the detailed page for each mutation database's web site. |
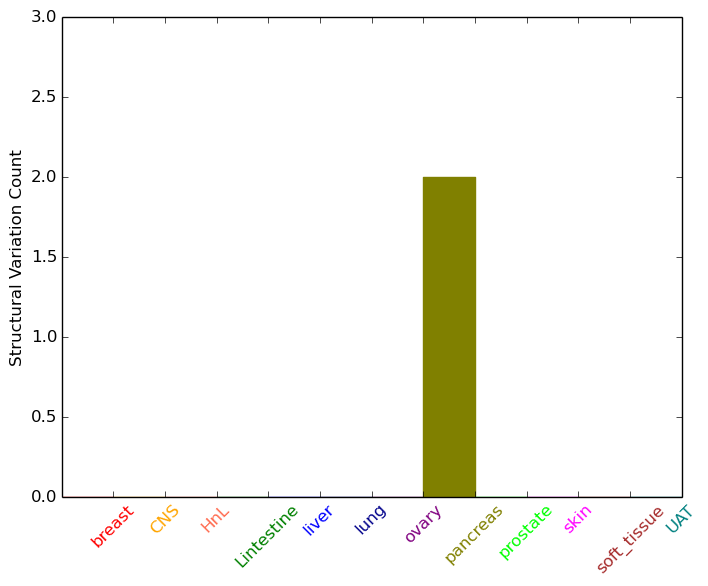
| - Statistics for Tissue and Mutation type | Top |
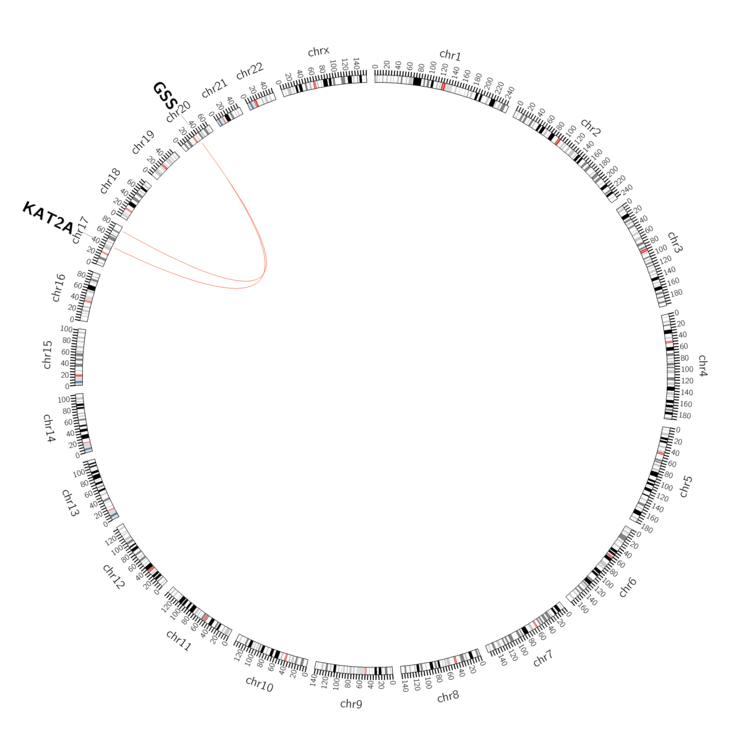 |
| - For Inter-chromosomal Variations |
| * Inter-chromosomal variantions includes 'interchromosomal amplicon to amplicon', 'interchromosomal amplicon to non-amplified dna', 'interchromosomal insertion', 'Interchromosomal unknown type'. |
 |
| - For Intra-chromosomal Variations |
| There's no intra-chromosomal structural variation. |
| Sample | Symbol_a | Chr_a | Start_a | End_a | Symbol_b | Chr_b | Start_b | End_b |
| pancreas | GSS | chr20 | 33536632 | 33536652 | KAT2A | chr17 | 40273167 | 40273187 |
| cf) Tissue number; Tissue name (1;Breast, 2;Central_nervous_system, 3;Haematopoietic_and_lymphoid_tissue, 4;Large_intestine, 5;Liver, 6;Lung, 7;Ovary, 8;Pancreas, 9;Prostate, 10;Skin, 11;Soft_tissue, 12;Upper_aerodigestive_tract) |
| * From mRNA Sanger sequences, Chitars2.0 arranged chimeric transcripts. This table shows GSS related fusion information. |
| ID | Head Gene | Tail Gene | Accession | Gene_a | qStart_a | qEnd_a | Chromosome_a | tStart_a | tEnd_a | Gene_a | qStart_a | qEnd_a | Chromosome_a | tStart_a | tEnd_a |
| AW373865 | BRWD1 | 5 | 148 | 21 | 40558924 | 40559066 | GSS | 140 | 378 | 20 | 33516483 | 33516721 | |
| AW376720 | GSS | 1 | 82 | 20 | 33516452 | 33516533 | OASL | 83 | 438 | 12 | 121458641 | 121461927 | |
| L42531 | GSS | 1 | 1690 | 20 | 33516405 | 33543560 | DHFR | 1691 | 1811 | 5 | 79946695 | 79946815 | |
| AW894712 | GSS | 7 | 289 | 20 | 33530740 | 33531020 | GSS | 288 | 421 | 20 | 33530631 | 33530764 | |
| AW849012 | GSS | 1 | 82 | 20 | 33516452 | 33516533 | OASL | 83 | 340 | 12 | 121458739 | 121461927 | |
| AW848757 | GSS | 1 | 82 | 20 | 33516452 | 33516533 | OASL | 83 | 512 | 12 | 121458567 | 121461927 | |
| AI802443 | ZC2HC1A | 1 | 270 | 8 | 79627472 | 79629741 | GSS | 257 | 638 | 20 | 33530340 | 33539581 | |
| BF746473 | MAT2A | 19 | 121 | 2 | 85771560 | 85771663 | GSS | 119 | 244 | 20 | 33533756 | 33533881 | |
| Top |
| Mutation type/ Tissue ID | brca | cns | cerv | endome | haematopo | kidn | Lintest | liver | lung | ns | ovary | pancre | prost | skin | stoma | thyro | urina | |||
| Total # sample | 1 | 1 | 1 | |||||||||||||||||
| GAIN (# sample) | 1 | 1 | 1 | |||||||||||||||||
| LOSS (# sample) |
| cf) Tissue ID; Tissue type (1; Breast, 2; Central_nervous_system, 3; Cervix, 4; Endometrium, 5; Haematopoietic_and_lymphoid_tissue, 6; Kidney, 7; Large_intestine, 8; Liver, 9; Lung, 10; NS, 11; Ovary, 12; Pancreas, 13; Prostate, 14; Skin, 15; Stomach, 16; Thyroid, 17; Urinary_tract) |
| Top |
|
 |
| Top |
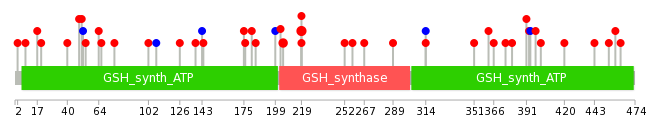
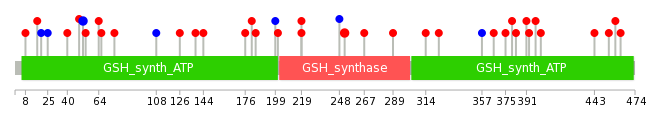
| Stat. for Non-Synonymous SNVs (# total SNVs=33) | (# total SNVs=2) |
 |  |
(# total SNVs=2) | (# total SNVs=0) |
 |
| Top |
| * When you move the cursor on each content, you can see more deailed mutation information on the Tooltip. Those are primary_site,primary_histology,mutation(aa),pubmedID. |
| GRCh37 position | Mutation(aa) | Unique sampleID count |
| chr20:33524779-33524779 | p.D219G | 3 |
| chr20:33524780-33524780 | p.D219Y | 2 |
| chr20:33524822-33524822 | p.L205V | 2 |
| chr20:33533841-33533841 | p.Q64E | 2 |
| chr20:33519152-33519152 | p.Q366H | 1 |
| chr20:33539538-33539538 | p.T40A | 1 |
| chr20:33516696-33516696 | p.I454F | 1 |
| chr20:33530406-33530406 | p.S126A | 1 |
| chr20:33519166-33519166 | p.V362L | 1 |
| chr20:33539596-33539596 | p.Q21fs*13 | 1 |
| Top |
|
 |
| Point Mutation/ Tissue ID | 1 | 2 | 3 | 4 | 5 | 6 | 7 | 8 | 9 | 10 | 11 | 12 | 13 | 14 | 15 | 16 | 17 | 18 | 19 | 20 |
| # sample | 1 | 2 | 1 | 7 | 1 | 4 | 1 | 5 | 2 | 3 | 7 | 4 | 5 | |||||||
| # mutation | 1 | 2 | 1 | 6 | 1 | 4 | 1 | 5 | 2 | 3 | 7 | 4 | 5 | |||||||
| nonsynonymous SNV | 2 | 5 | 1 | 2 | 1 | 3 | 2 | 3 | 7 | 3 | 5 | |||||||||
| synonymous SNV | 1 | 1 | 1 | 2 | 2 | 1 |
| cf) Tissue ID; Tissue type (1; BLCA[Bladder Urothelial Carcinoma], 2; BRCA[Breast invasive carcinoma], 3; CESC[Cervical squamous cell carcinoma and endocervical adenocarcinoma], 4; COAD[Colon adenocarcinoma], 5; GBM[Glioblastoma multiforme], 6; Glioma Low Grade, 7; HNSC[Head and Neck squamous cell carcinoma], 8; KICH[Kidney Chromophobe], 9; KIRC[Kidney renal clear cell carcinoma], 10; KIRP[Kidney renal papillary cell carcinoma], 11; LAML[Acute Myeloid Leukemia], 12; LUAD[Lung adenocarcinoma], 13; LUSC[Lung squamous cell carcinoma], 14; OV[Ovarian serous cystadenocarcinoma ], 15; PAAD[Pancreatic adenocarcinoma], 16; PRAD[Prostate adenocarcinoma], 17; SKCM[Skin Cutaneous Melanoma], 18:STAD[Stomach adenocarcinoma], 19:THCA[Thyroid carcinoma], 20:UCEC[Uterine Corpus Endometrial Carcinoma]) |
| Top |
| * We represented just top 10 SNVs. When you move the cursor on each content, you can see more deailed mutation information on the Tooltip. Those are primary_site, primary_histology, mutation(aa), pubmedID. |
| Genomic Position | Mutation(aa) | Unique sampleID count |
| chr20:33524578 | p.D219Y | 2 |
| chr20:33524780 | p.R252Q | 2 |
| chr20:33533875 | p.L52L | 2 |
| chr20:33519179 | p.K443T | 1 |
| chr20:33529582 | p.T40A | 1 |
| chr20:33516696 | p.E402K | 1 |
| chr20:33533886 | p.S201L | 1 |
| chr20:33519801 | p.R25R | 1 |
| chr20:33529598 | p.M398T | 1 |
| chr20:33516728 | p.Y199Y | 1 |
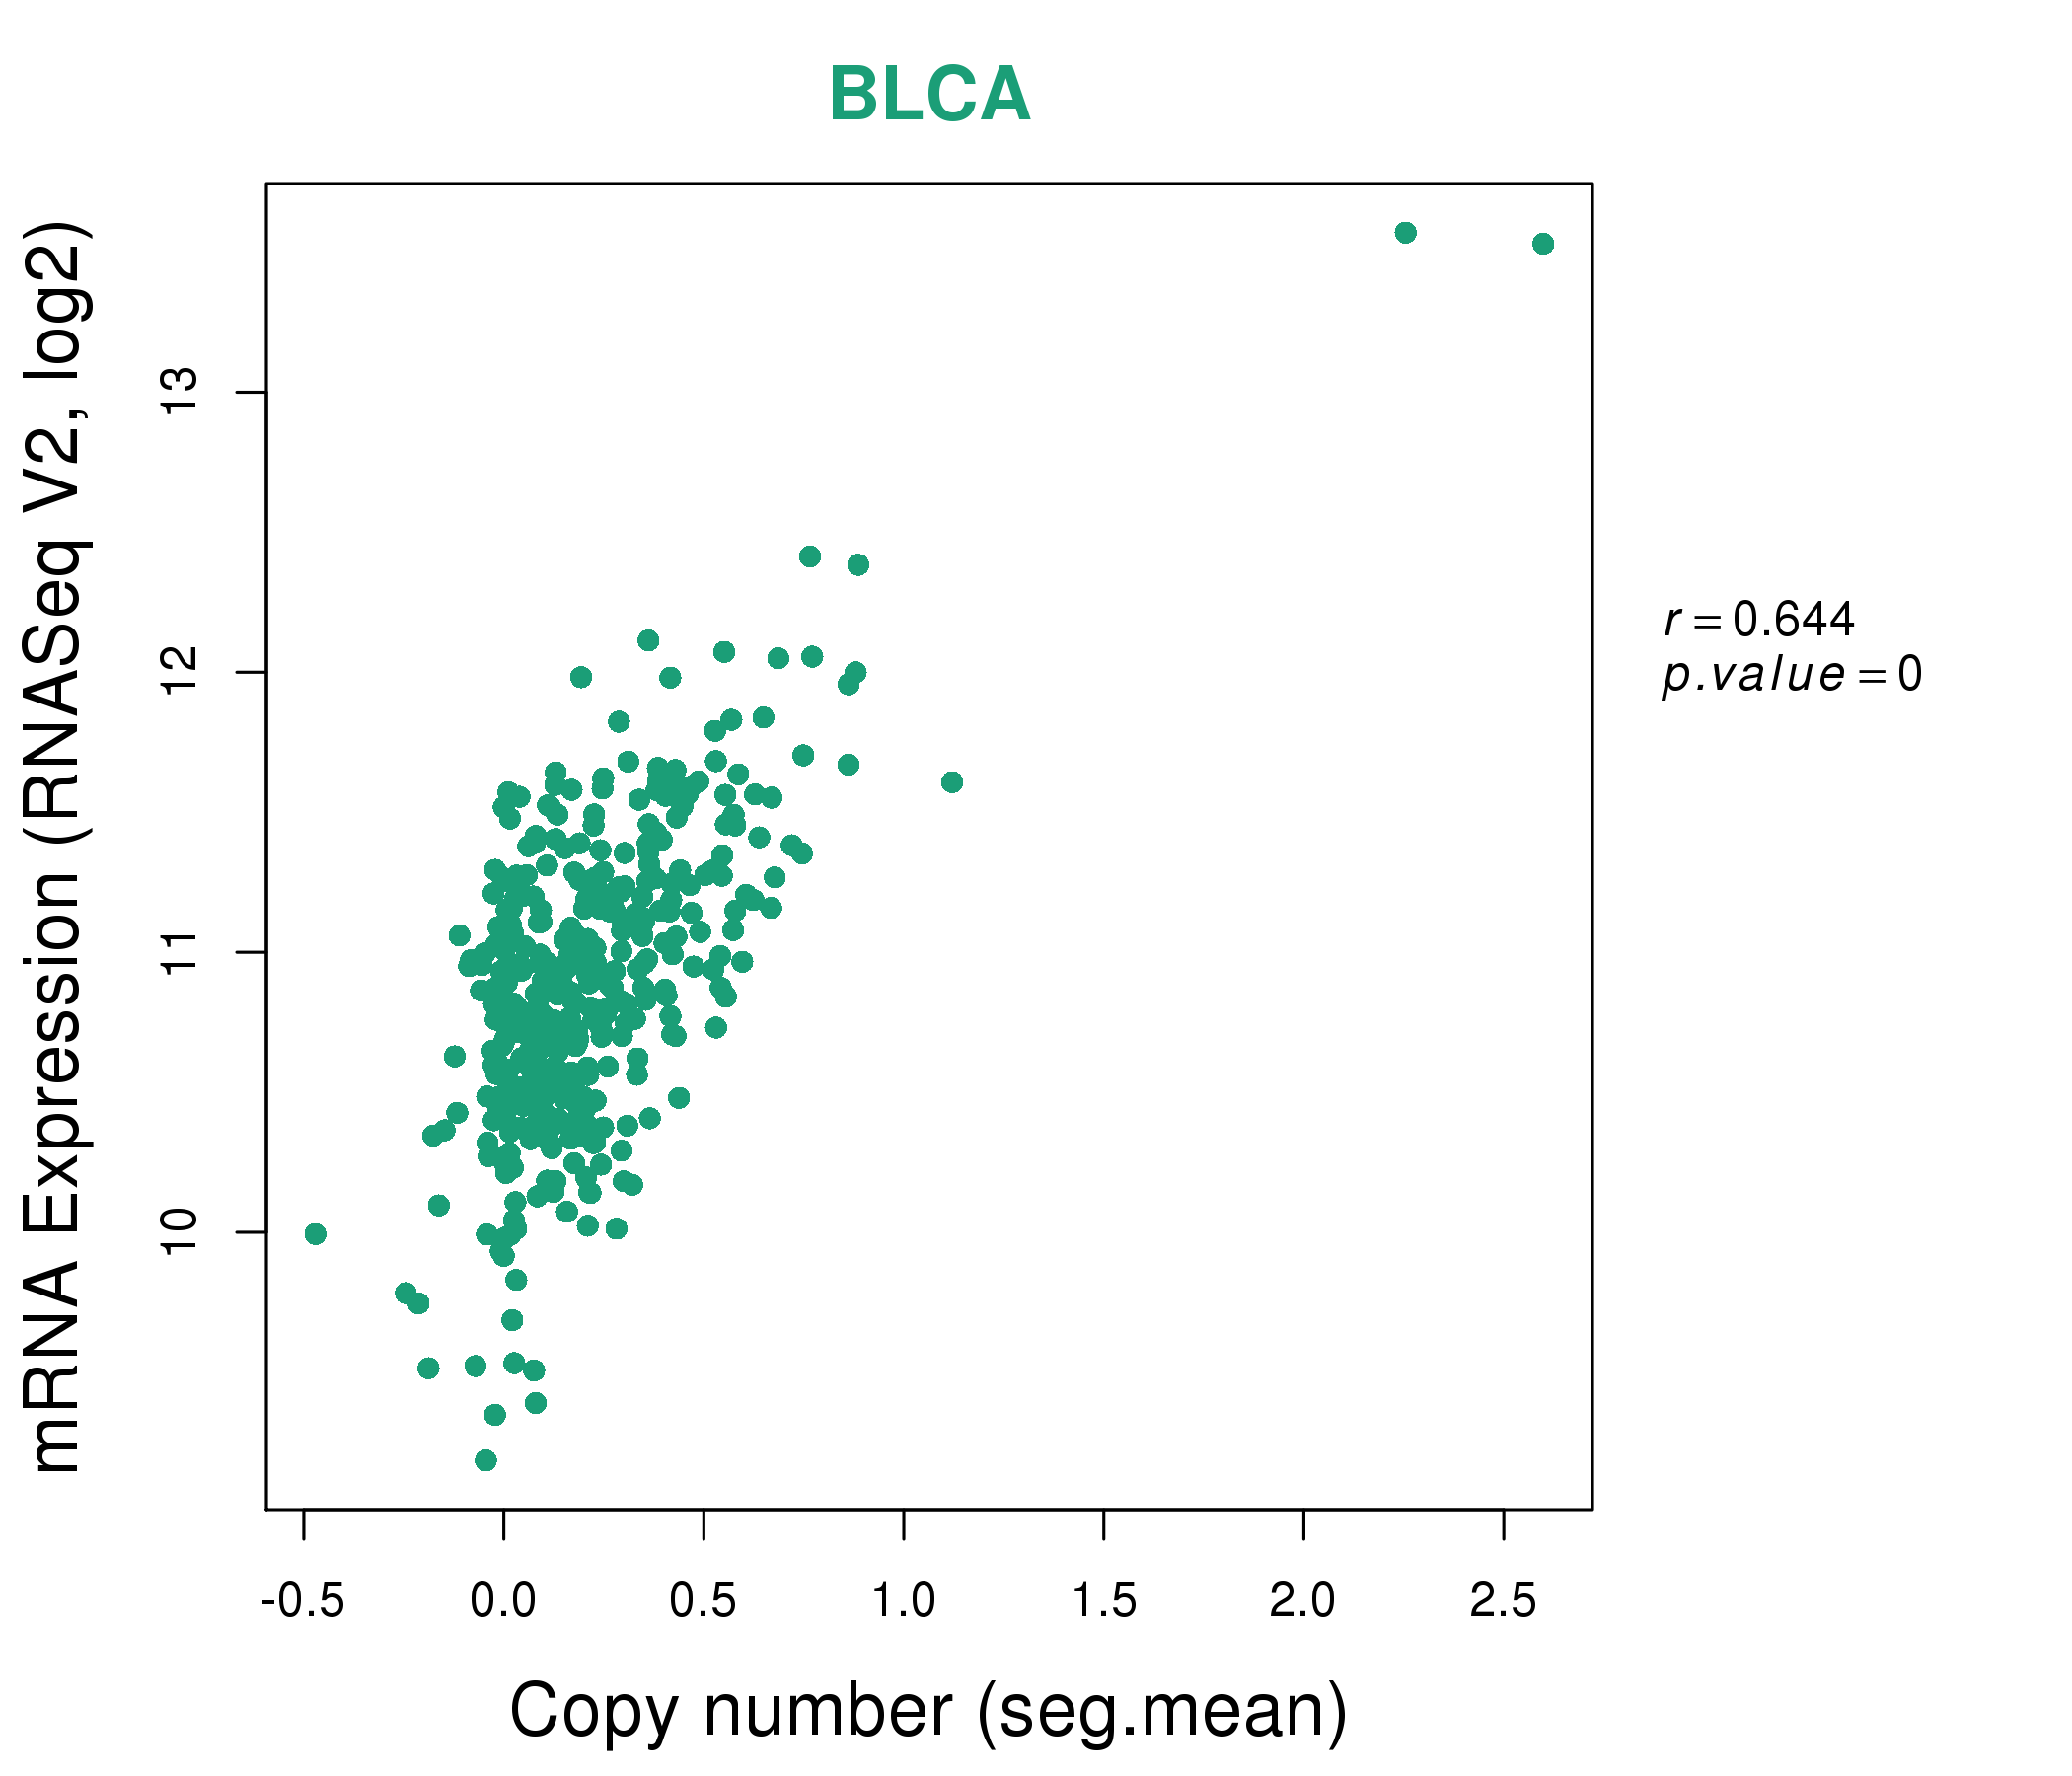
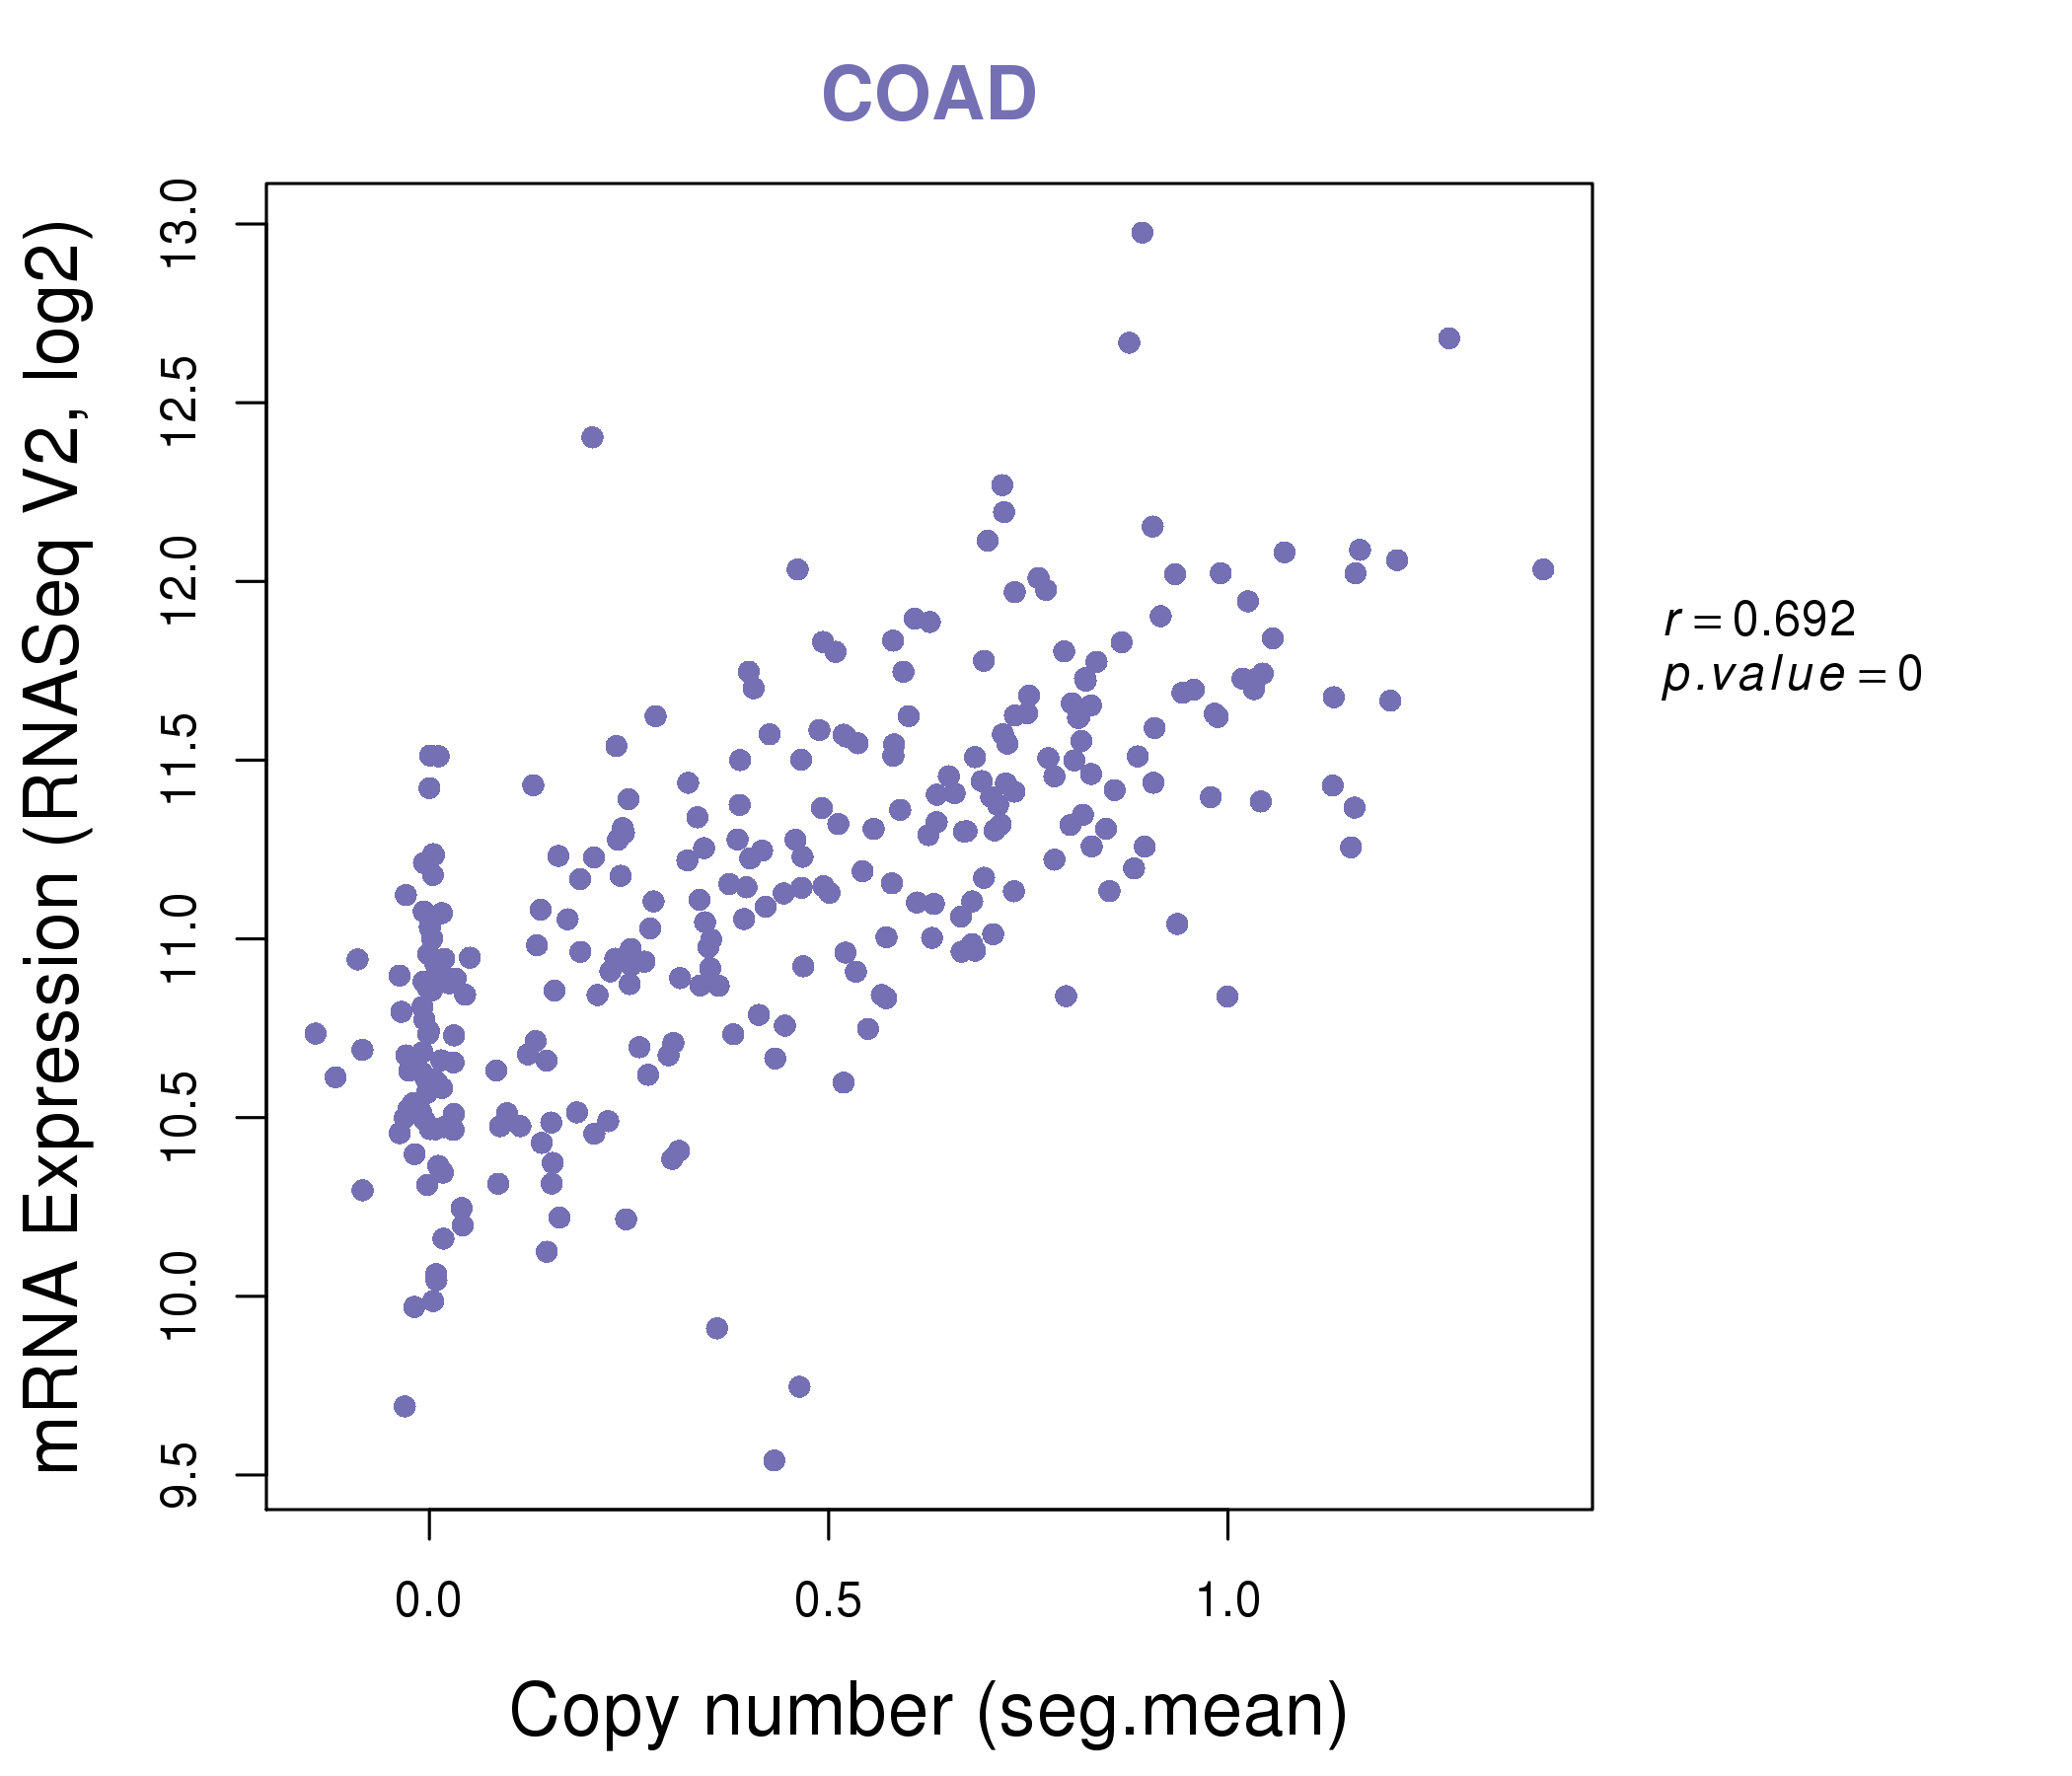
| * Copy number data were extracted from TCGA using R package TCGA-Assembler. The URLs of all public data files on TCGA DCC data server were gathered on Jan-05-2015. Function ProcessCNAData in TCGA-Assembler package was used to obtain gene-level copy number value which is calculated as the average copy number of the genomic region of a gene. |
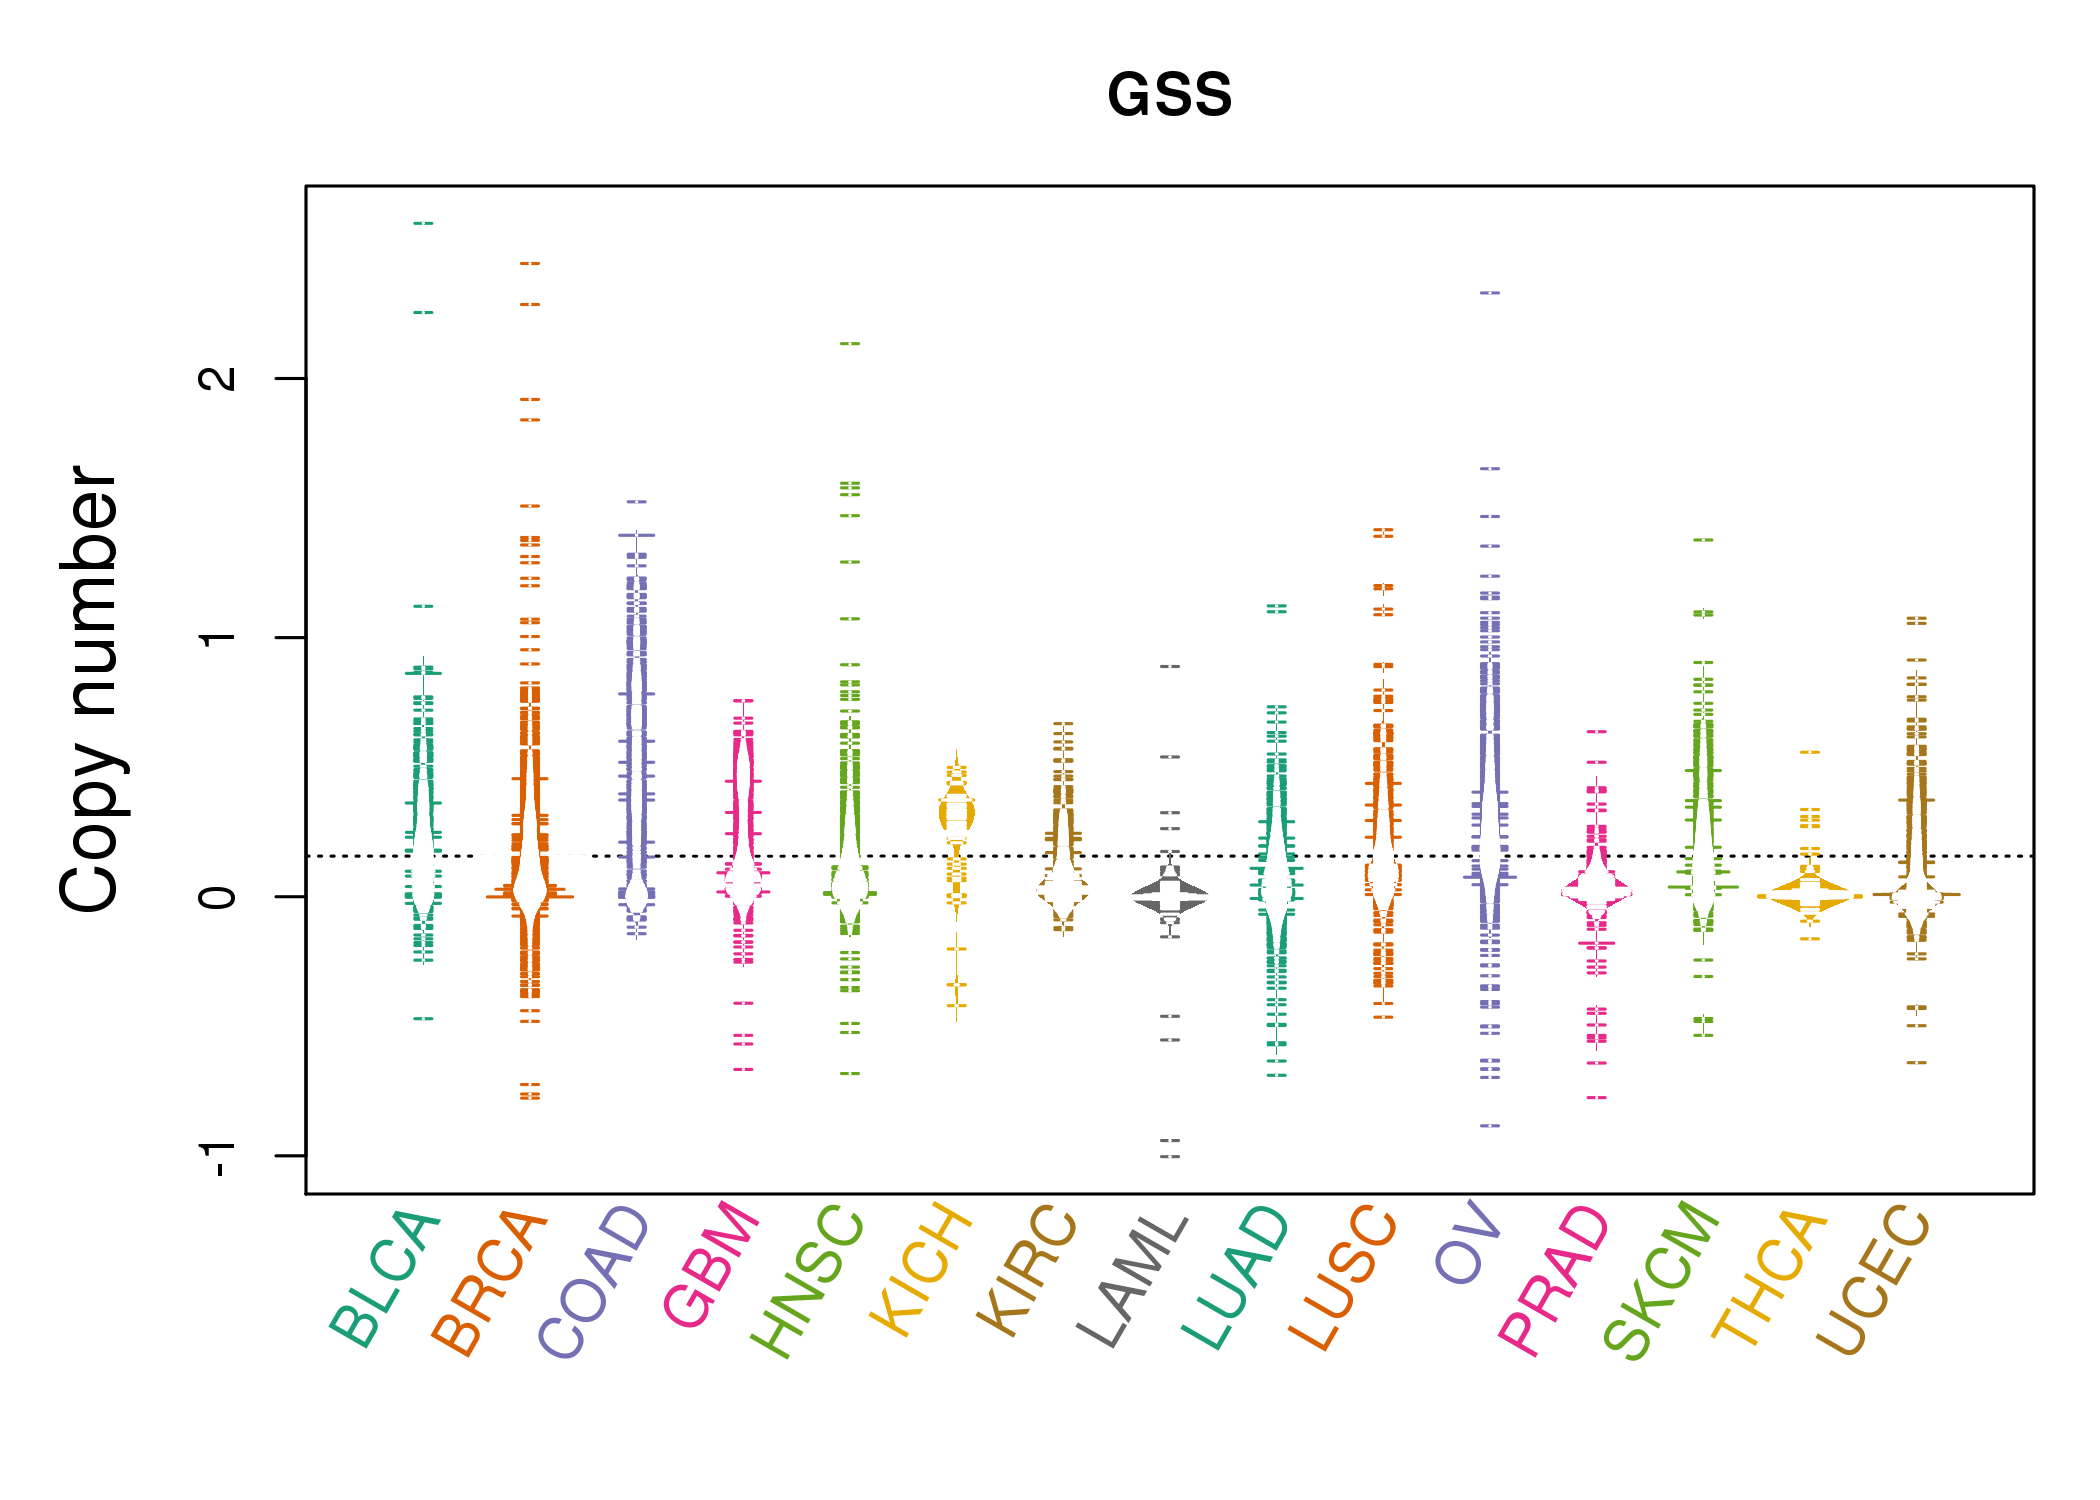 |
| cf) Tissue ID[Tissue type]: BLCA[Bladder Urothelial Carcinoma], BRCA[Breast invasive carcinoma], CESC[Cervical squamous cell carcinoma and endocervical adenocarcinoma], COAD[Colon adenocarcinoma], GBM[Glioblastoma multiforme], Glioma Low Grade, HNSC[Head and Neck squamous cell carcinoma], KICH[Kidney Chromophobe], KIRC[Kidney renal clear cell carcinoma], KIRP[Kidney renal papillary cell carcinoma], LAML[Acute Myeloid Leukemia], LUAD[Lung adenocarcinoma], LUSC[Lung squamous cell carcinoma], OV[Ovarian serous cystadenocarcinoma ], PAAD[Pancreatic adenocarcinoma], PRAD[Prostate adenocarcinoma], SKCM[Skin Cutaneous Melanoma], STAD[Stomach adenocarcinoma], THCA[Thyroid carcinoma], UCEC[Uterine Corpus Endometrial Carcinoma] |
| Top |
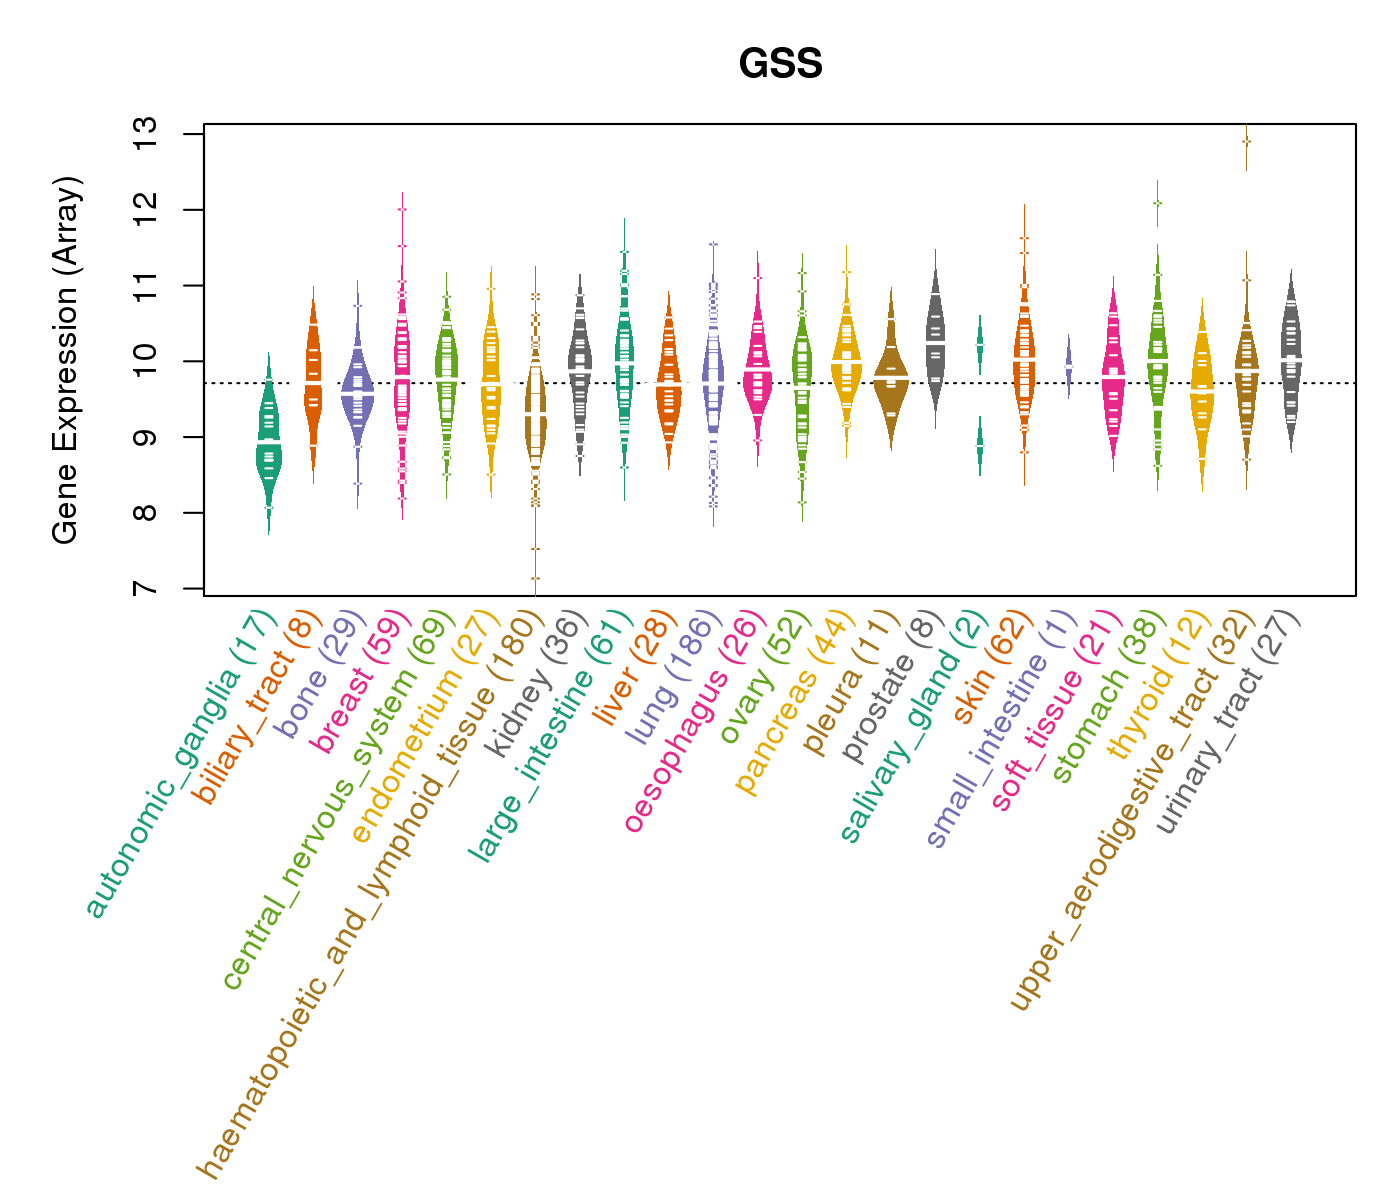
| Gene Expression for GSS |
| * CCLE gene expression data were extracted from CCLE_Expression_Entrez_2012-10-18.res: Gene-centric RMA-normalized mRNA expression data. |
 |
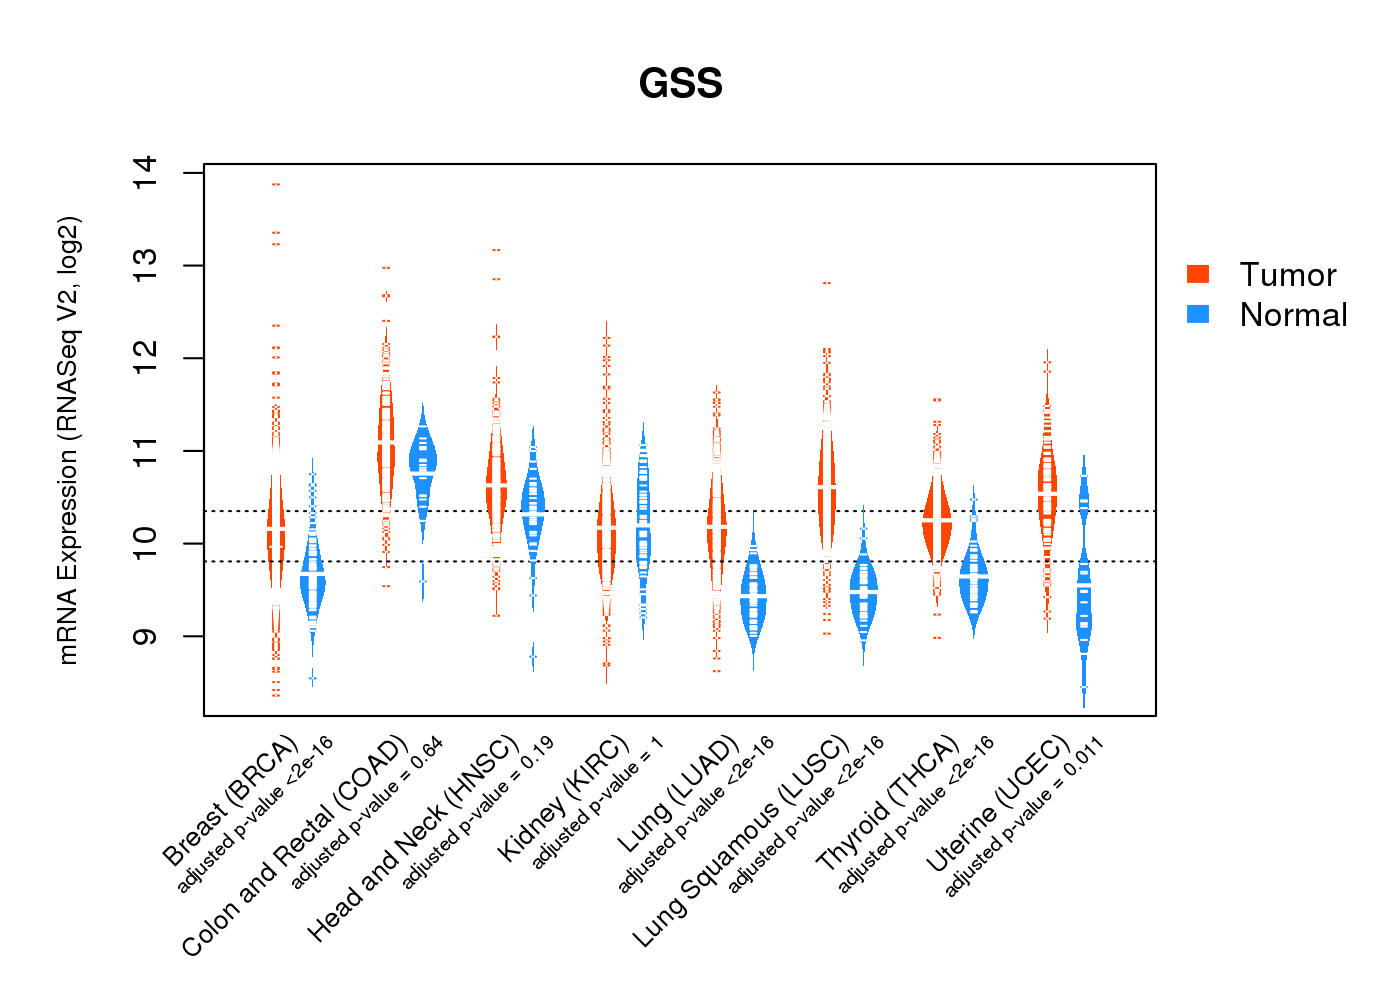
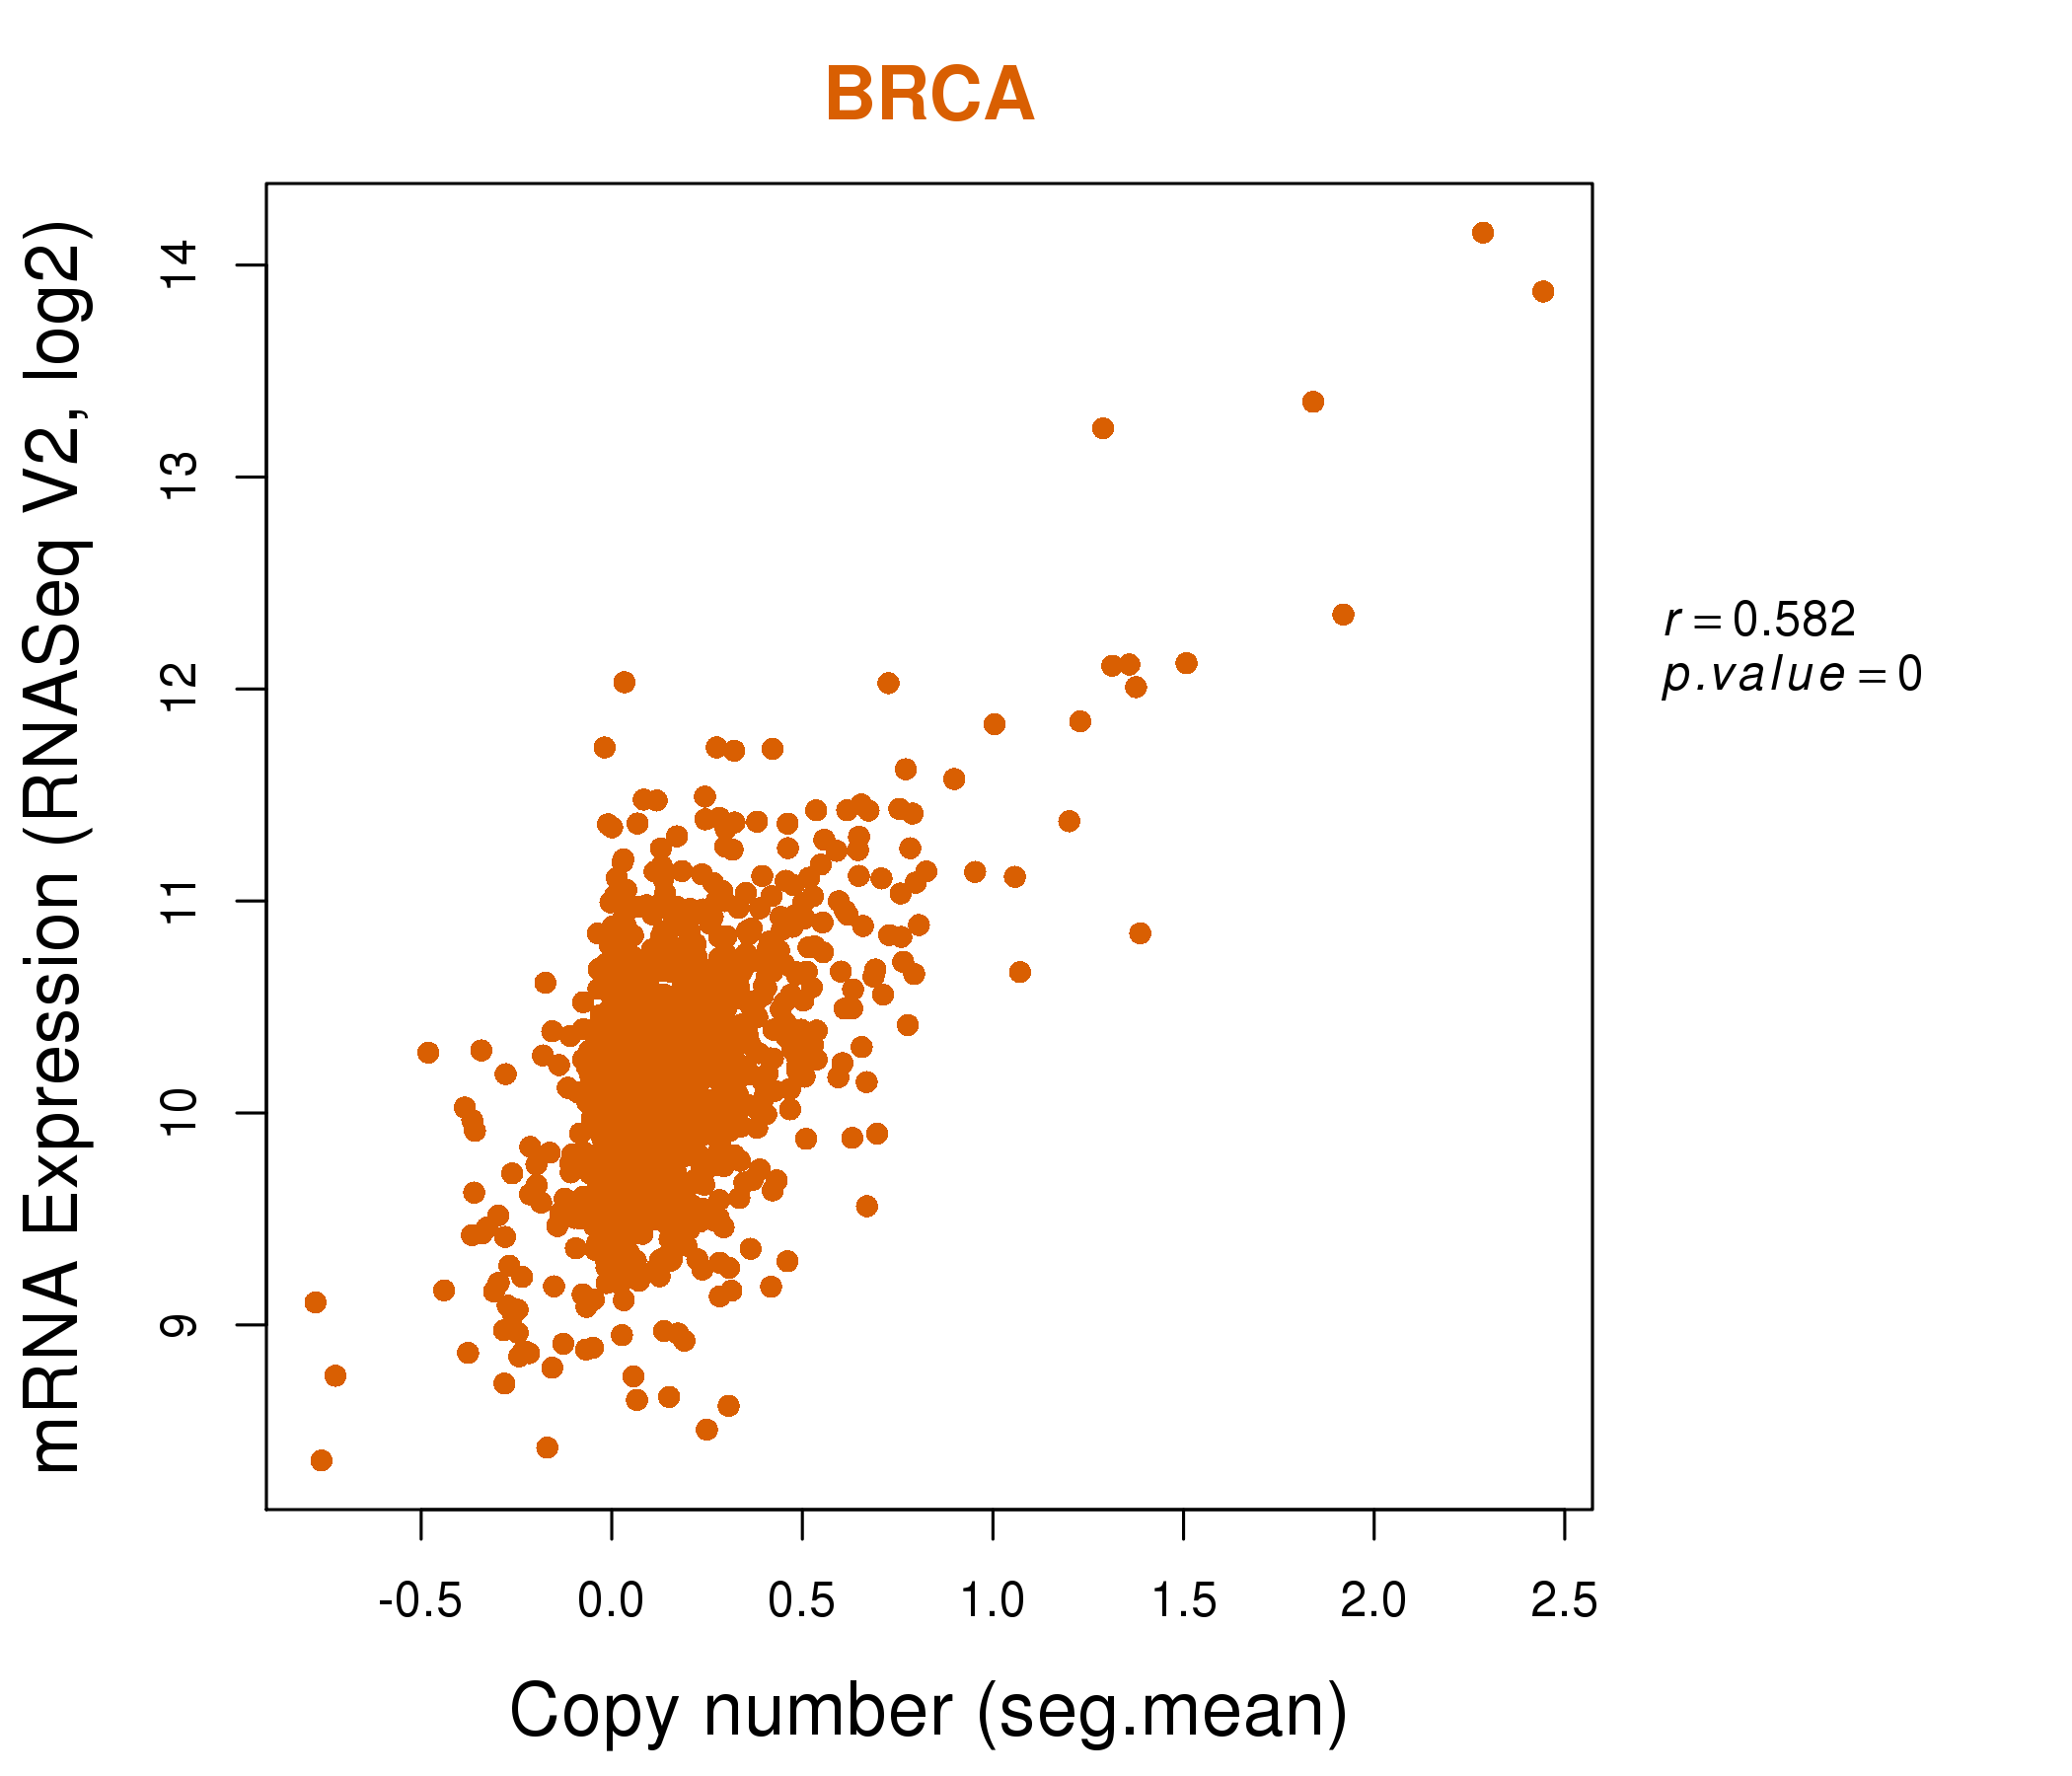
| * Normalized gene expression data of RNASeqV2 was extracted from TCGA using R package TCGA-Assembler. The URLs of all public data files on TCGA DCC data server were gathered at Jan-05-2015. Only eight cancer types have enough normal control samples for differential expression analysis. (t test, adjusted p<0.05 (using Benjamini-Hochberg FDR)) |
 |
| Top |
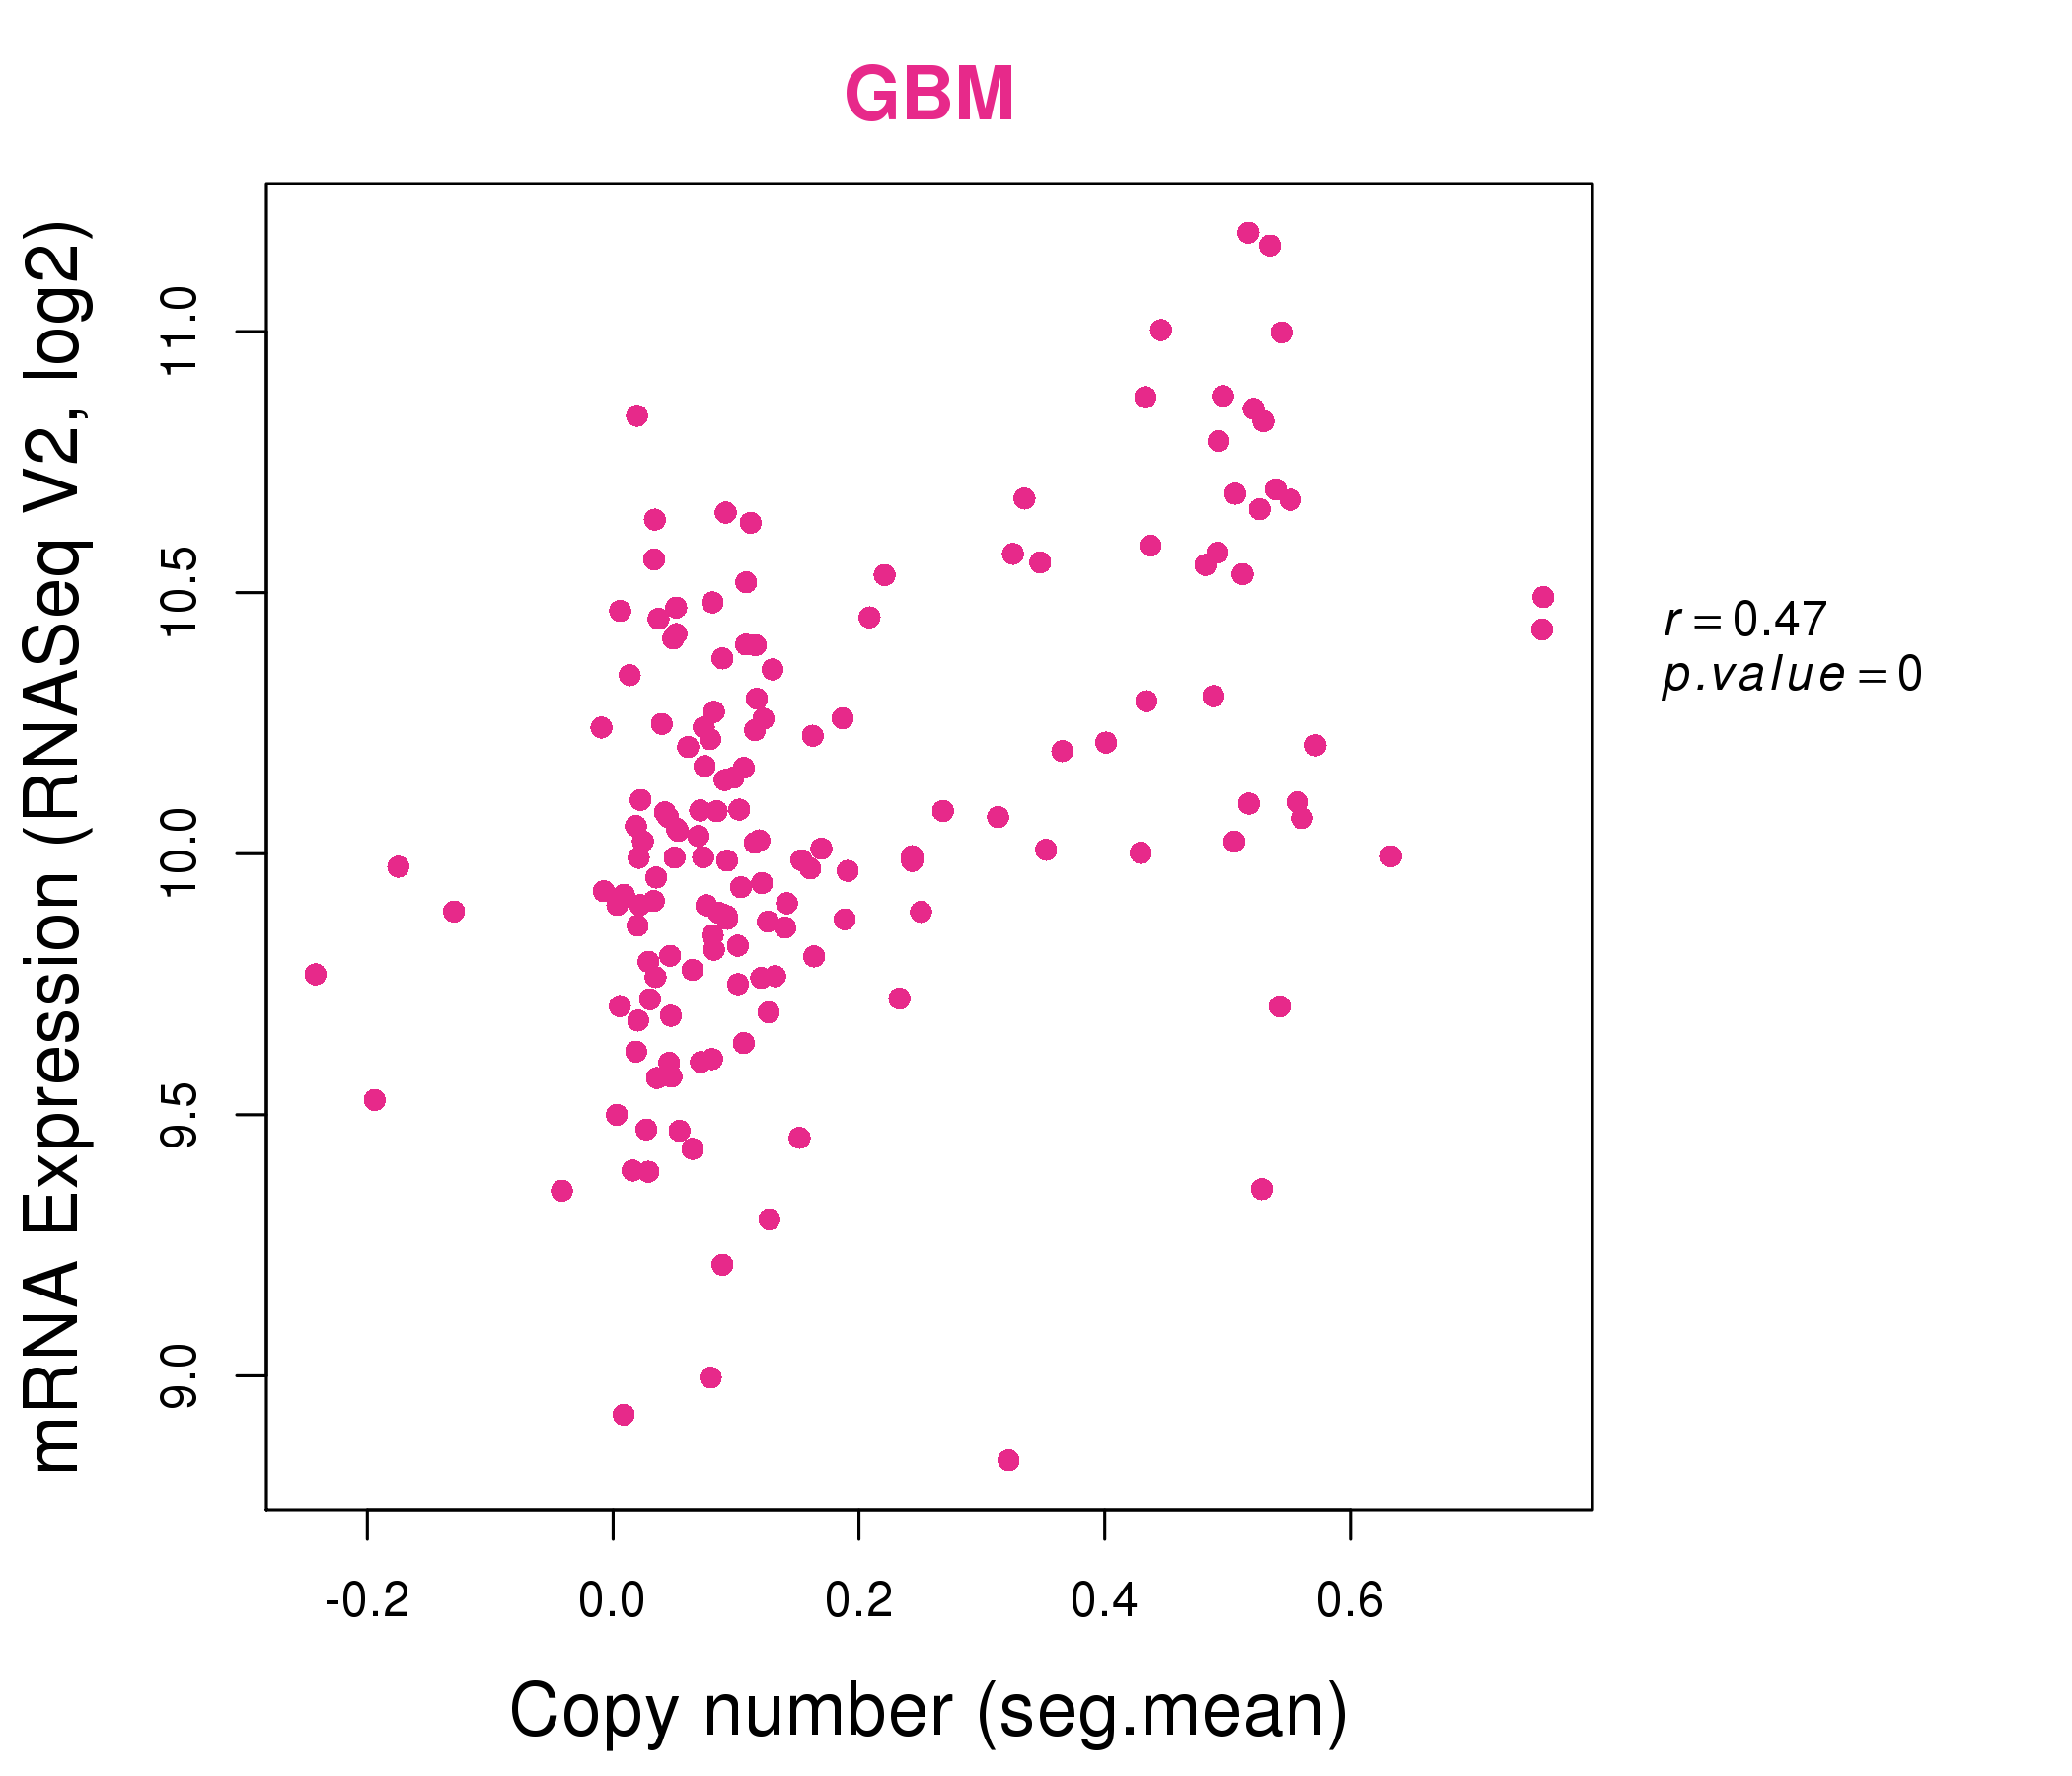
| * This plots show the correlation between CNV and gene expression. |
: Open all plots for all cancer types
 |
|
 |
|
| Top |
| Gene-Gene Network Information |
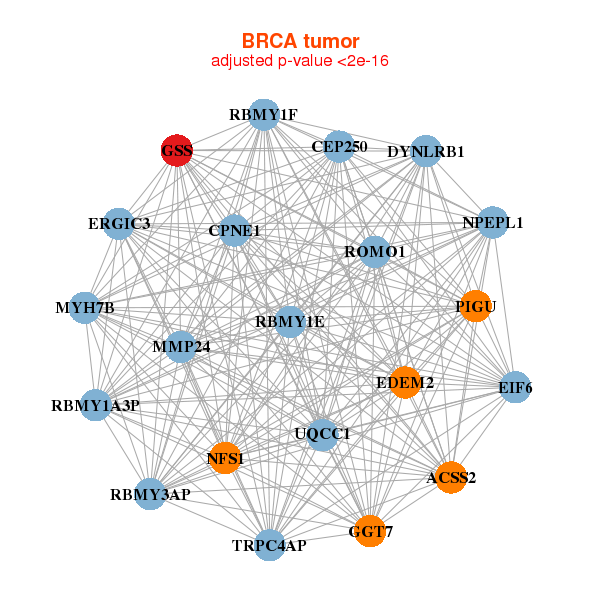
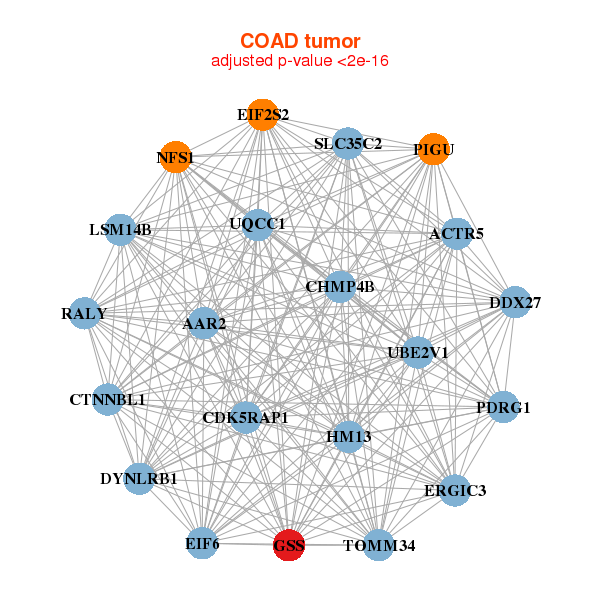
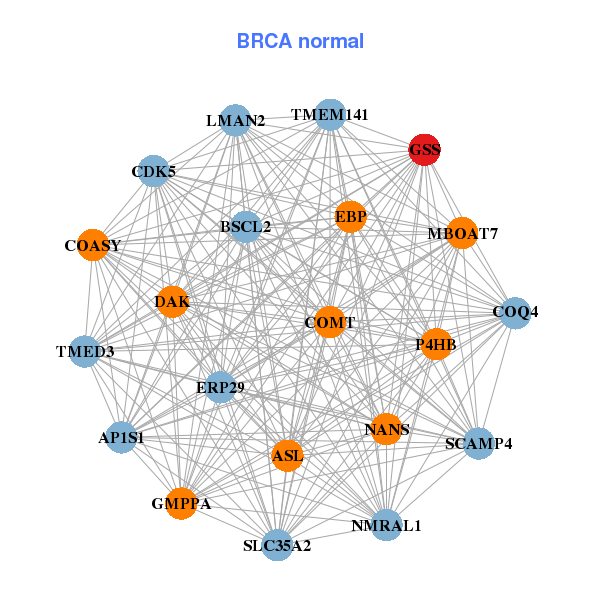
| * Co-Expression network figures were drawn using R package igraph. Only the top 20 genes with the highest correlations were shown. Red circle: input gene, orange circle: cell metabolism gene, sky circle: other gene |
: Open all plots for all cancer types
 |
| ||||
| ACSS2,CEP250,CPNE1,DYNLRB1,EDEM2,EIF6,ERGIC3, GGT7,GSS,MMP24,MYH7B,NFS1,NPEPL1,PIGU, RBMY1A3P,RBMY1E,RBMY1F,RBMY3AP,ROMO1,TRPC4AP,UQCC1 | AP1S1,ASL,BSCL2,CDK5,COASY,COMT,COQ4, DAK,EBP,ERP29,GMPPA,GSS,LMAN2,MBOAT7, NANS,NMRAL1,P4HB,SCAMP4,SLC35A2,TMED3,TMEM141 | ||||
 |
| ||||
| ACTR5,AAR2,CDK5RAP1,CHMP4B,CTNNBL1,DDX27,DYNLRB1, EIF2S2,EIF6,ERGIC3,GSS,HM13,LSM14B,NFS1, PDRG1,PIGU,RALY,SLC35C2,TOMM34,UBE2V1,UQCC1 | AP1M2,APEH,BDH1,MPLKIP,DCAF12,DUS1L,GOT1, GSS,NDUFA10,NDUFV1,PIGU,RAB25,RCE1,RPIA, SDSL,SLC25A10,SLC35A4,SMAGP,TTLL12,TUFM,ZDHHC13 |
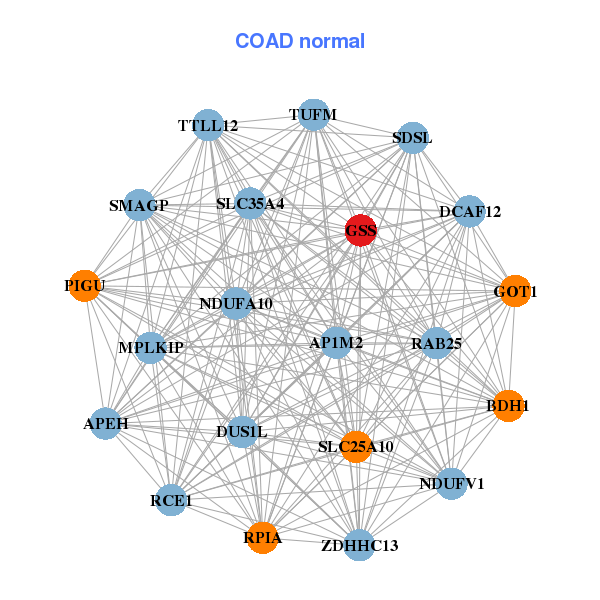
| * Co-Expression network figures were drawn using R package igraph. Only the top 20 genes with the highest correlations were shown. Red circle: input gene, orange circle: cell metabolism gene, sky circle: other gene |
: Open all plots for all cancer types
| Top |
: Open all interacting genes' information including KEGG pathway for all interacting genes from DAVID
| Top |
| Pharmacological Information for GSS |
| DB Category | DB Name | DB's ID and Url link |
| * Gene Centered Interaction Network. |
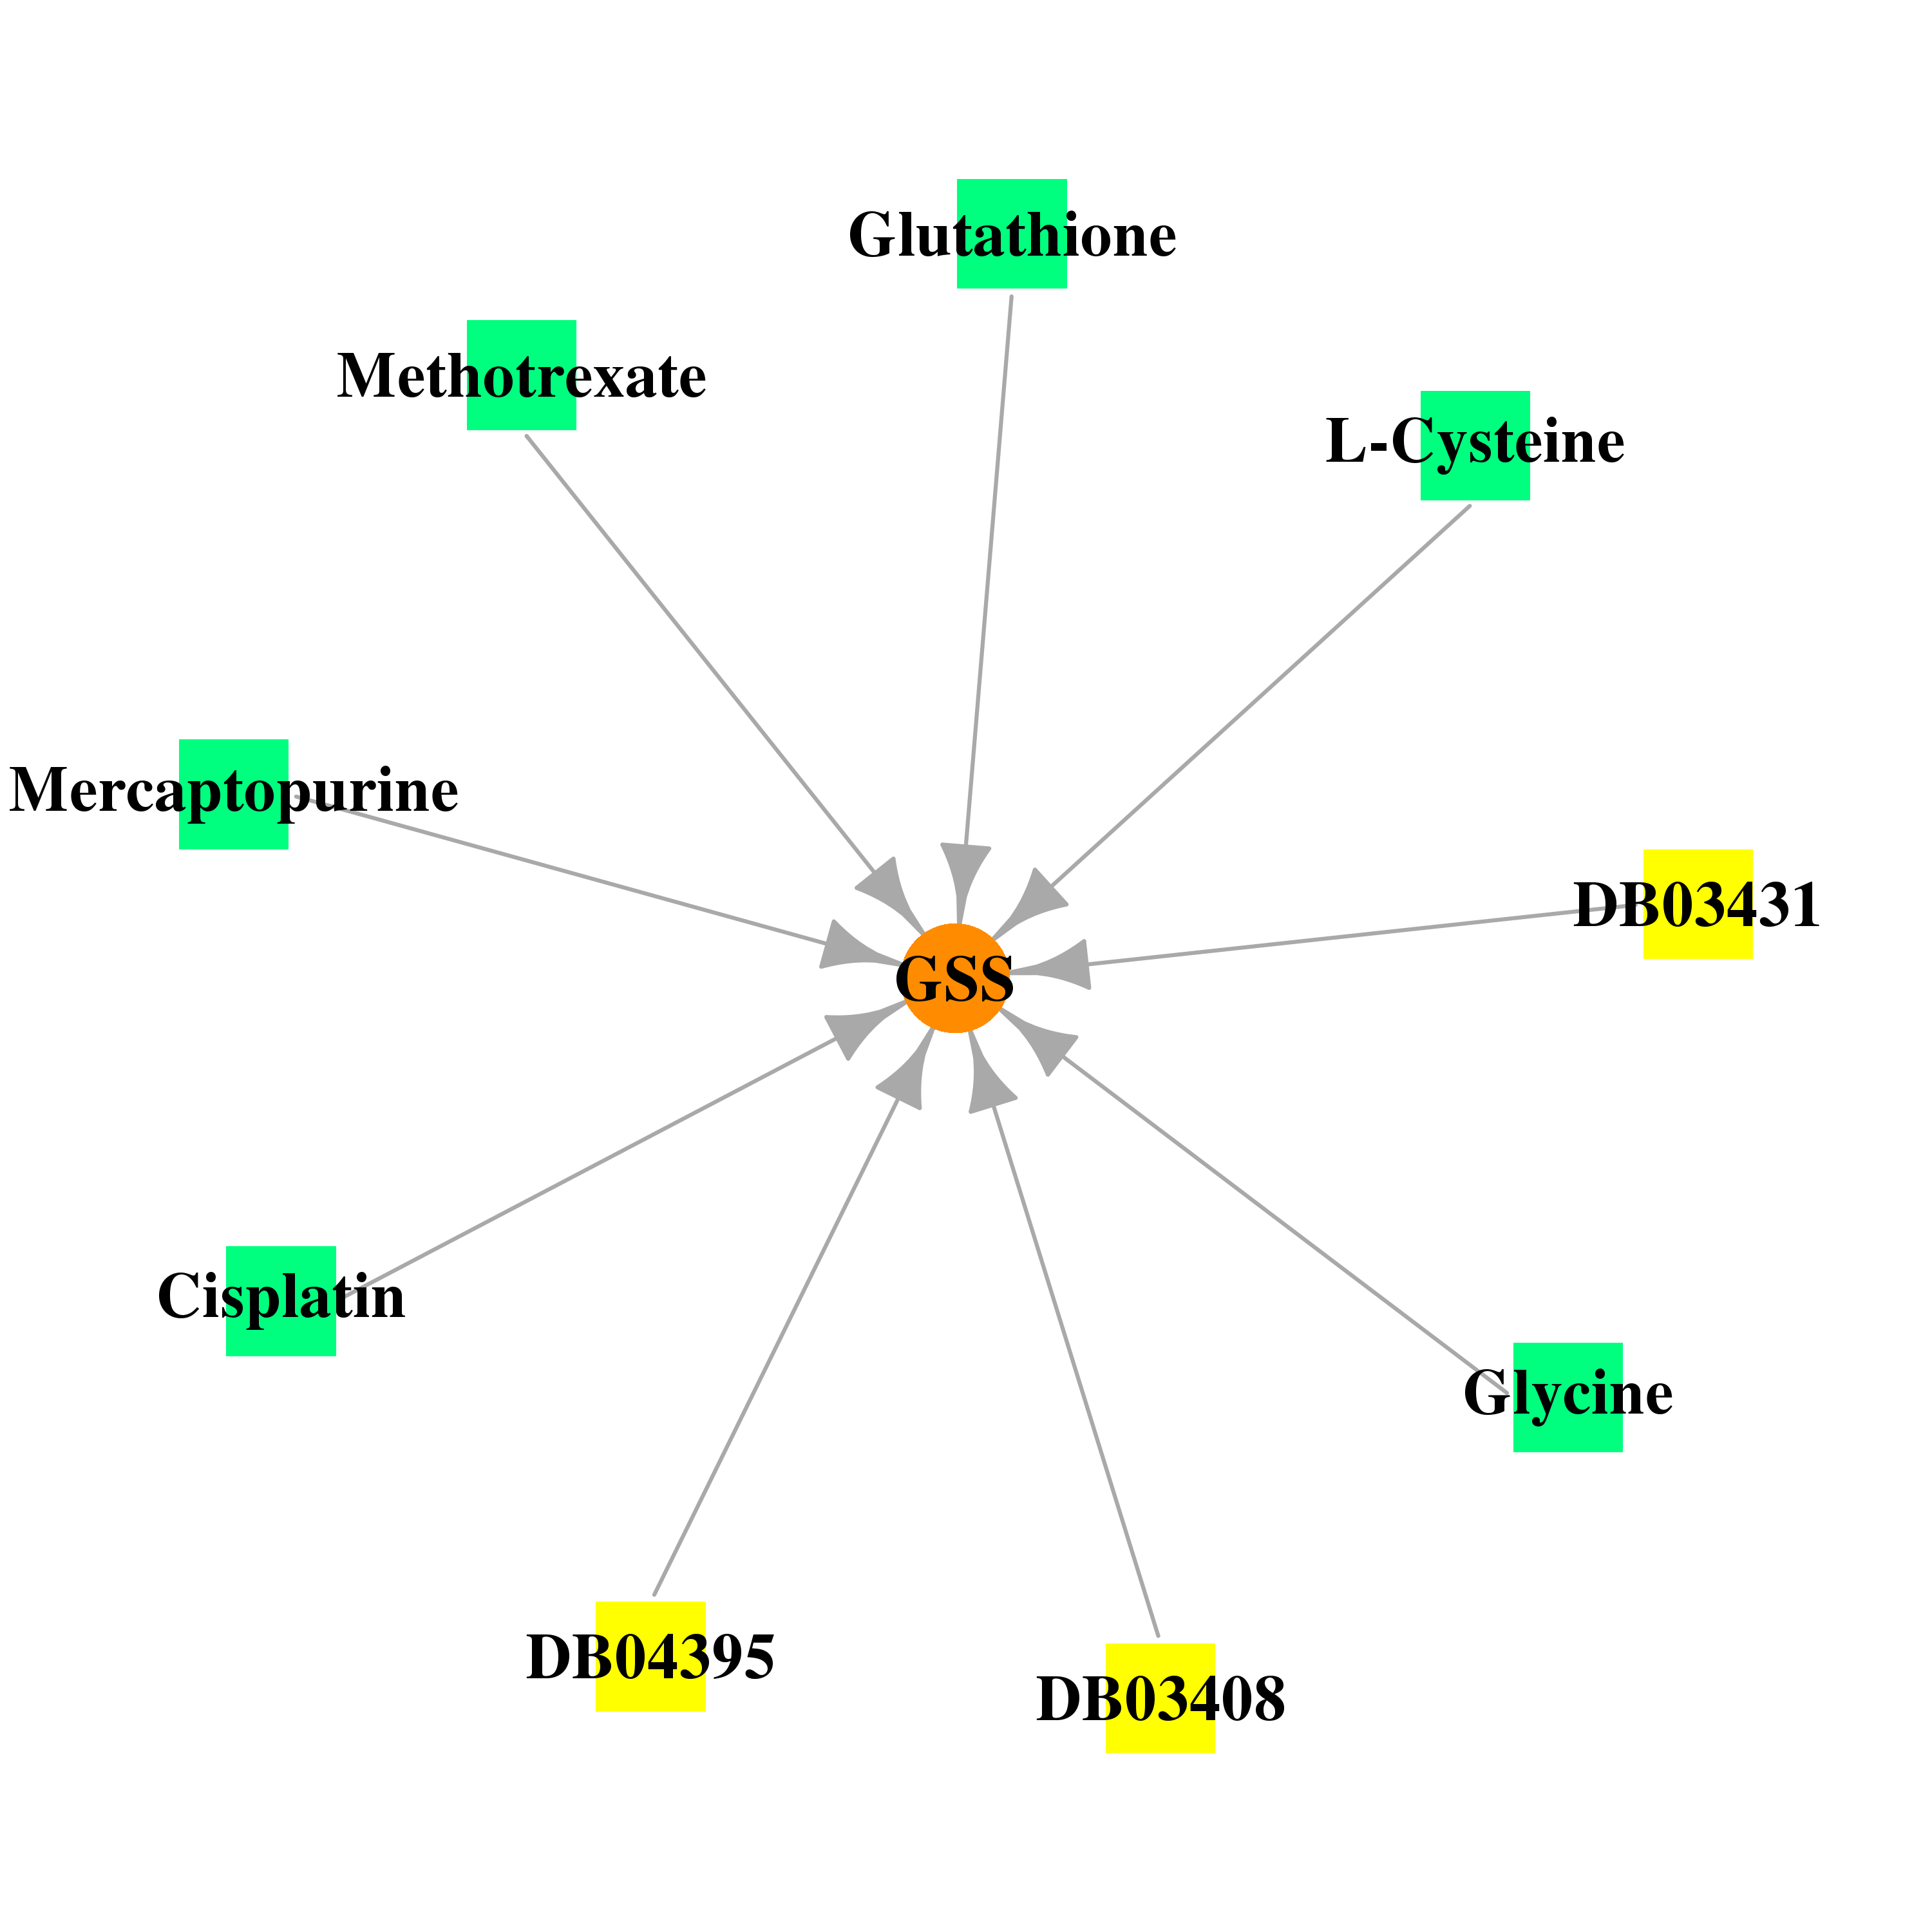 |
| * Drug Centered Interaction Network. |
| DrugBank ID | Target Name | Drug Groups | Generic Name | Drug Centered Network | Drug Structure |
| DB00143 | glutathione synthetase | approved; nutraceutical | Glutathione |  |  |
| DB00145 | glutathione synthetase | approved; nutraceutical | Glycine |  |  |
| DB00151 | glutathione synthetase | approved; nutraceutical | L-Cysteine | 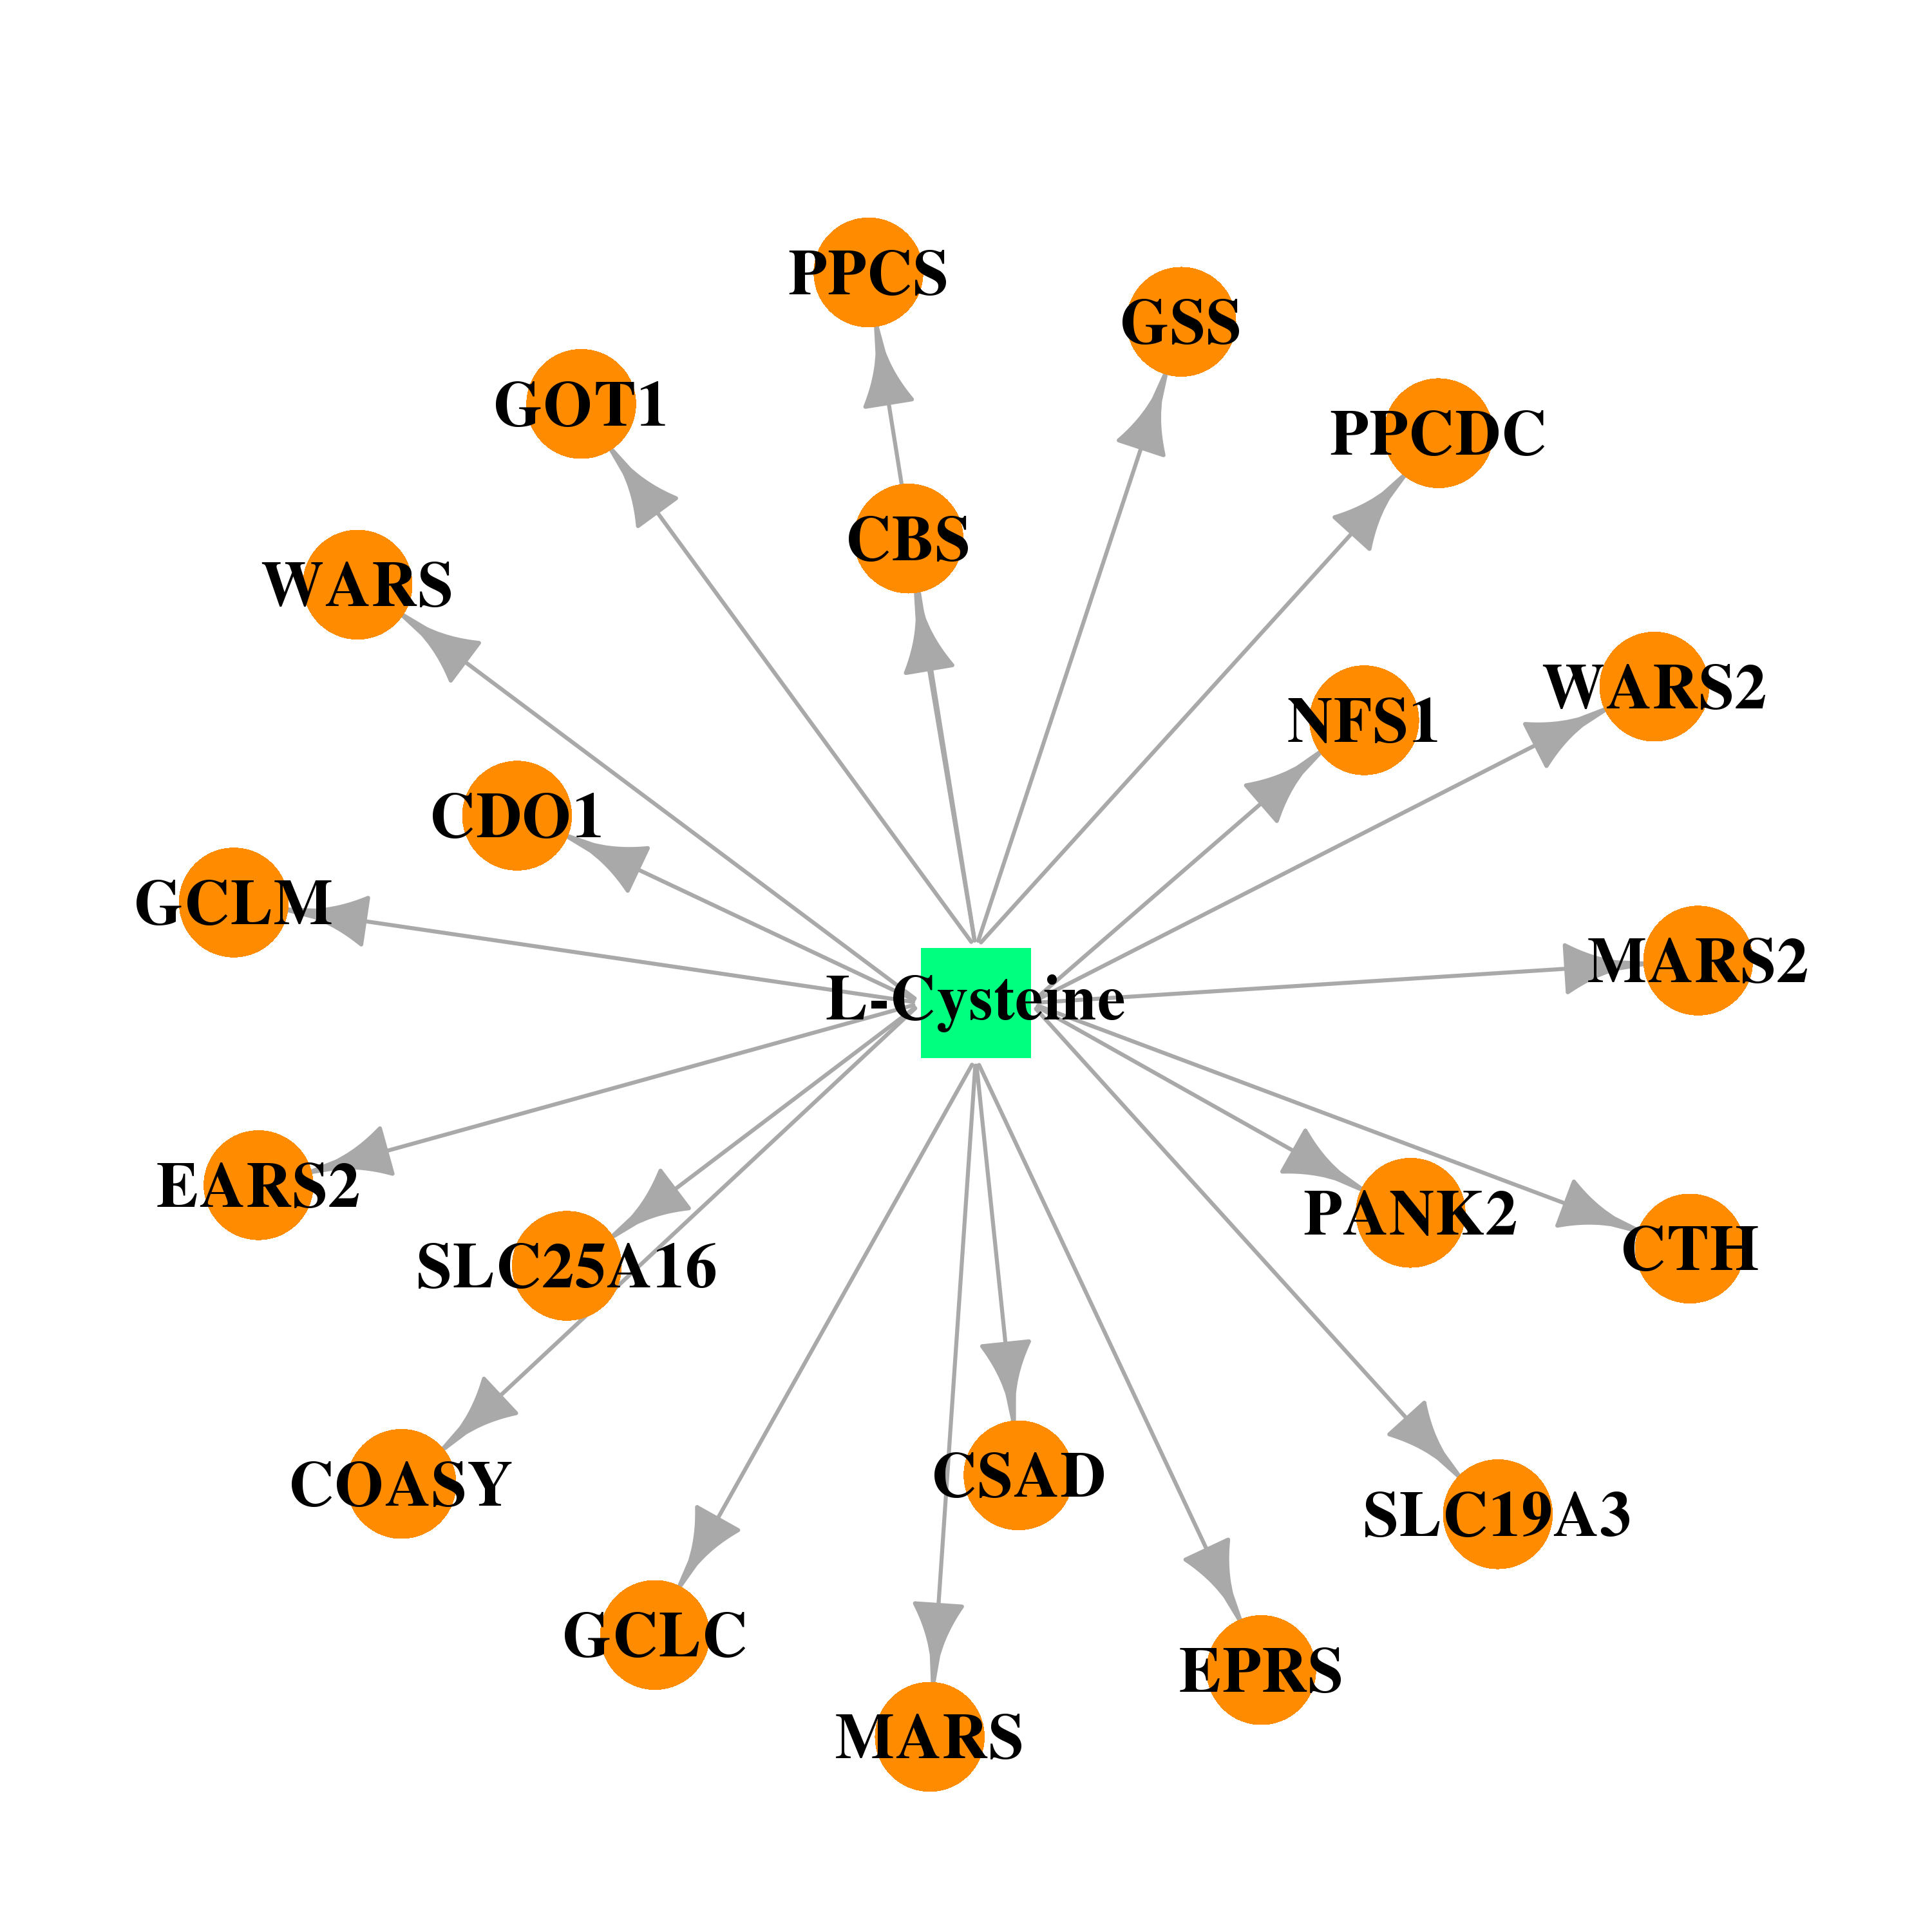 |  |
| DB03408 | glutathione synthetase | experimental | Gamma-Glutamylcysteine | 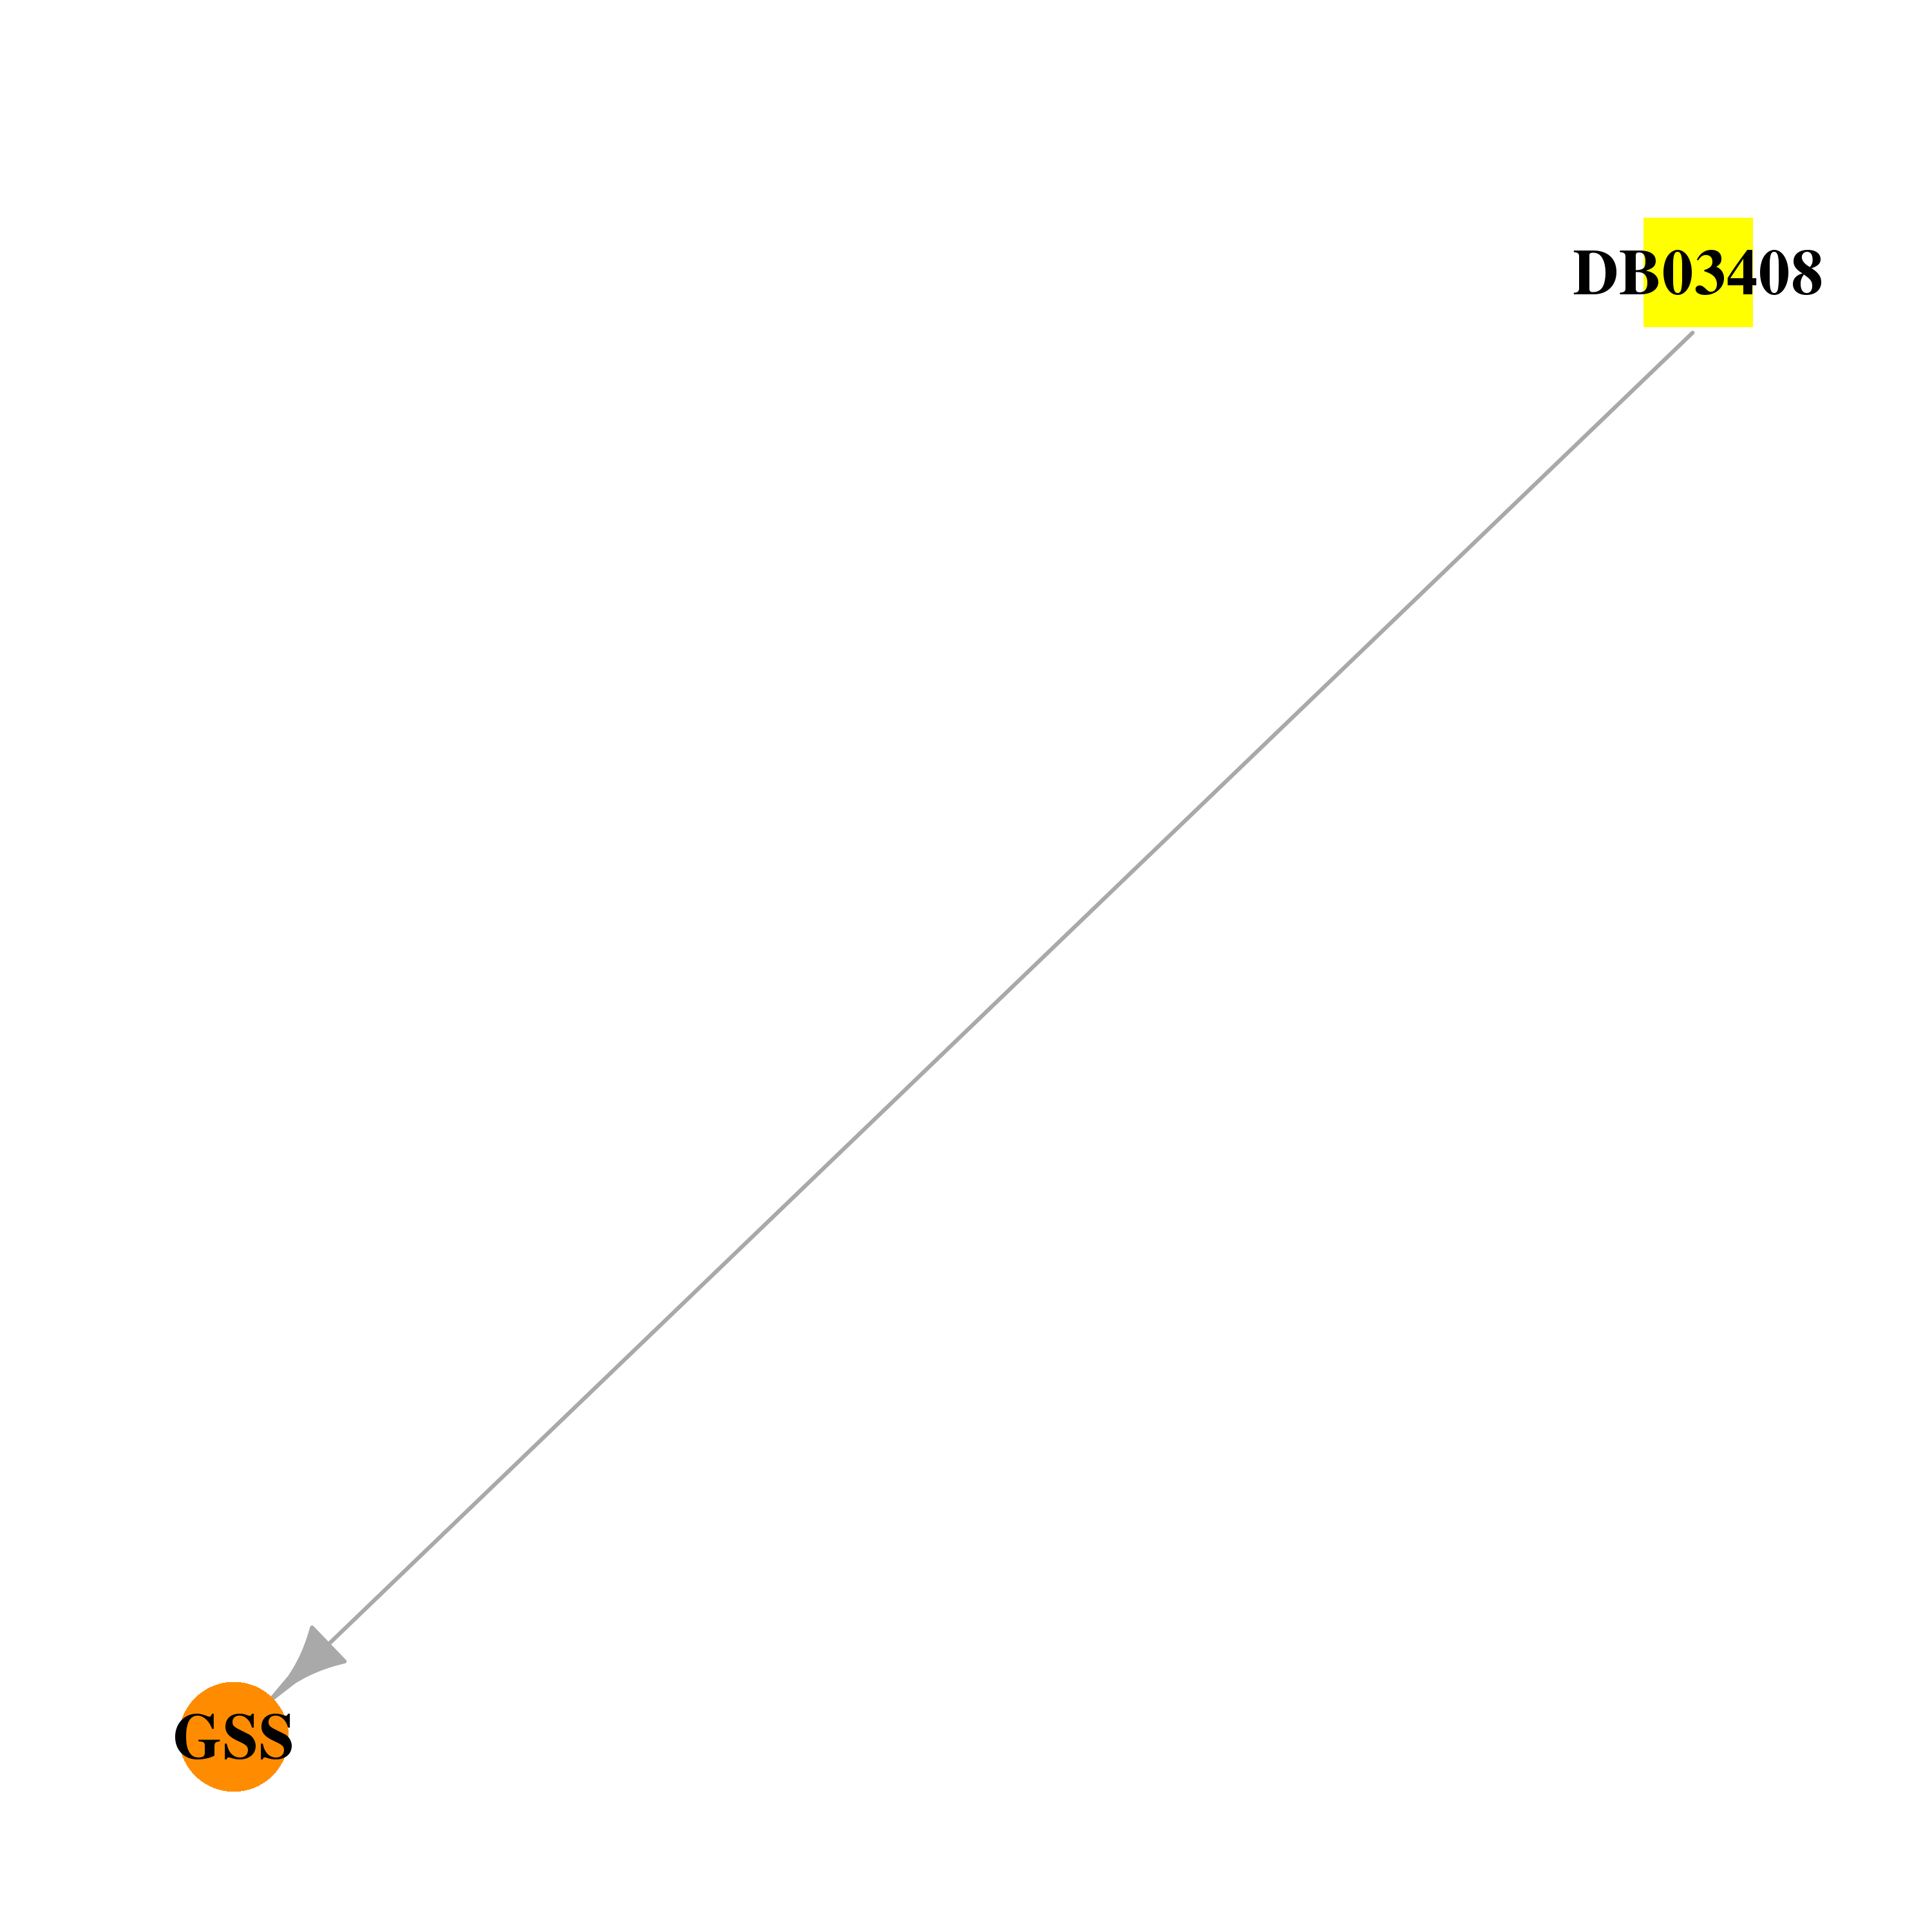 |  |
| DB03431 | glutathione synthetase | experimental | Adenosine-5'-Diphosphate | 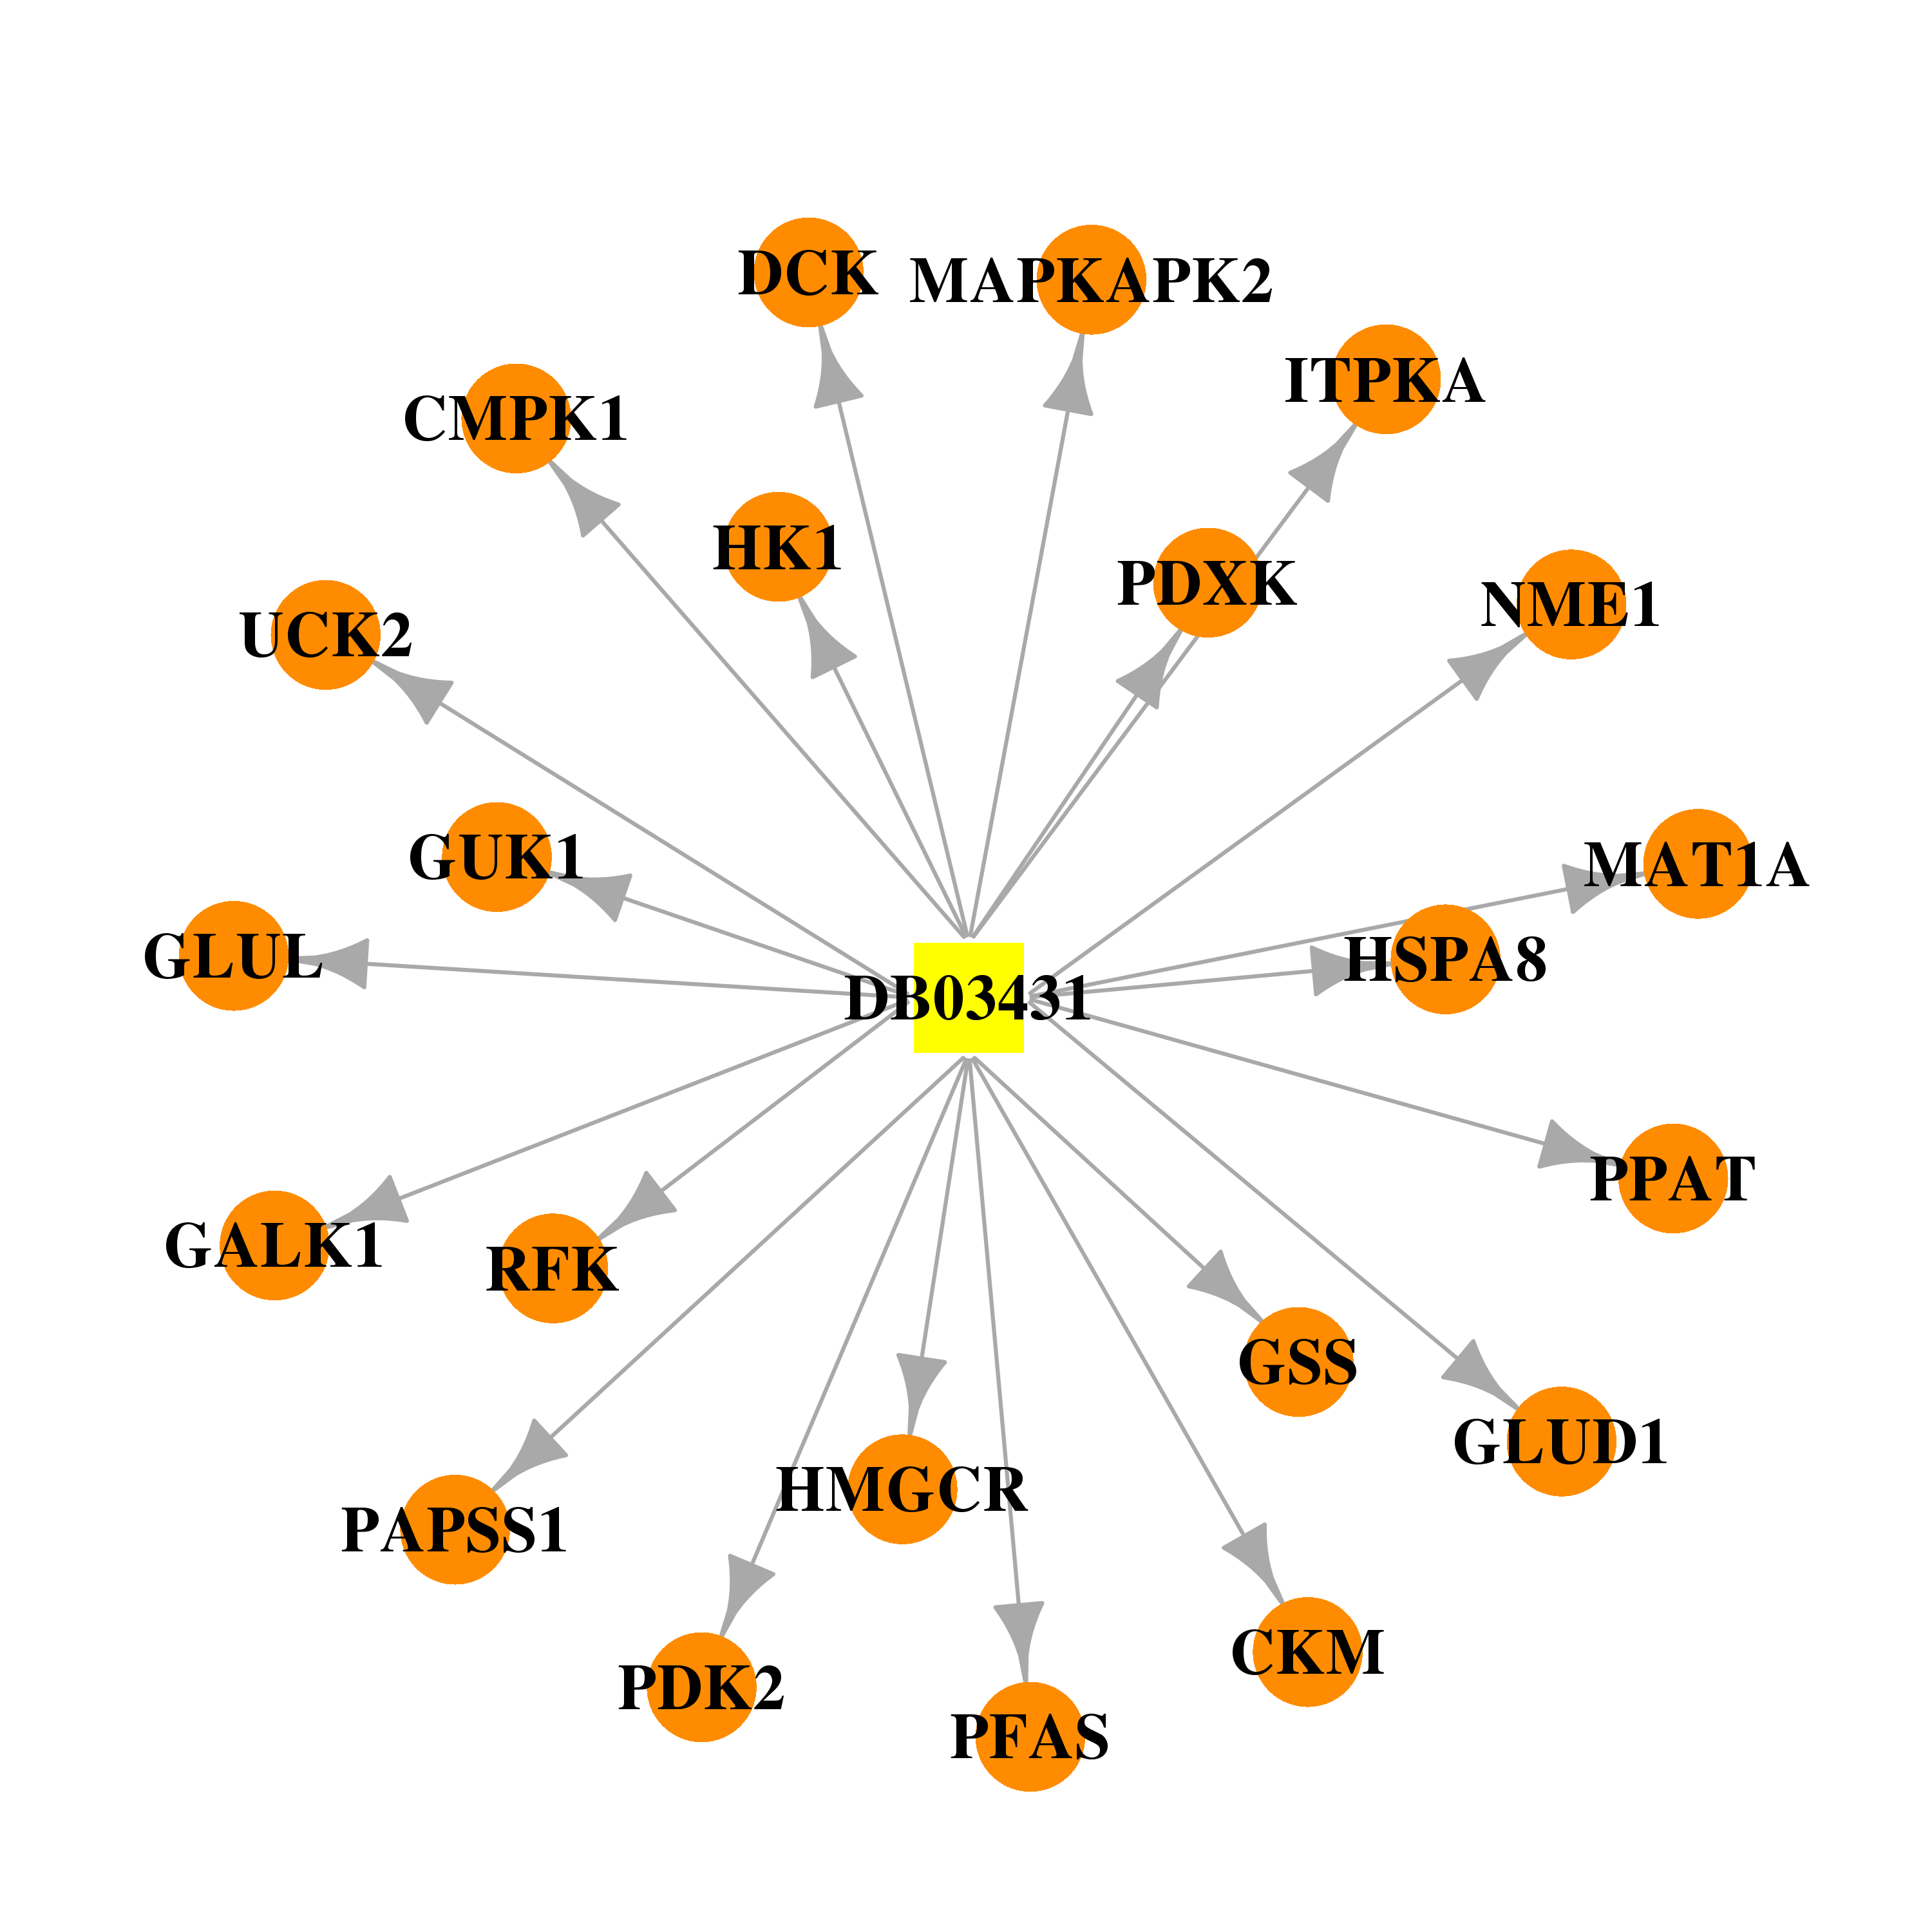 |  |
| DB04395 | glutathione synthetase | experimental | Phosphoaminophosphonic Acid-Adenylate Ester | 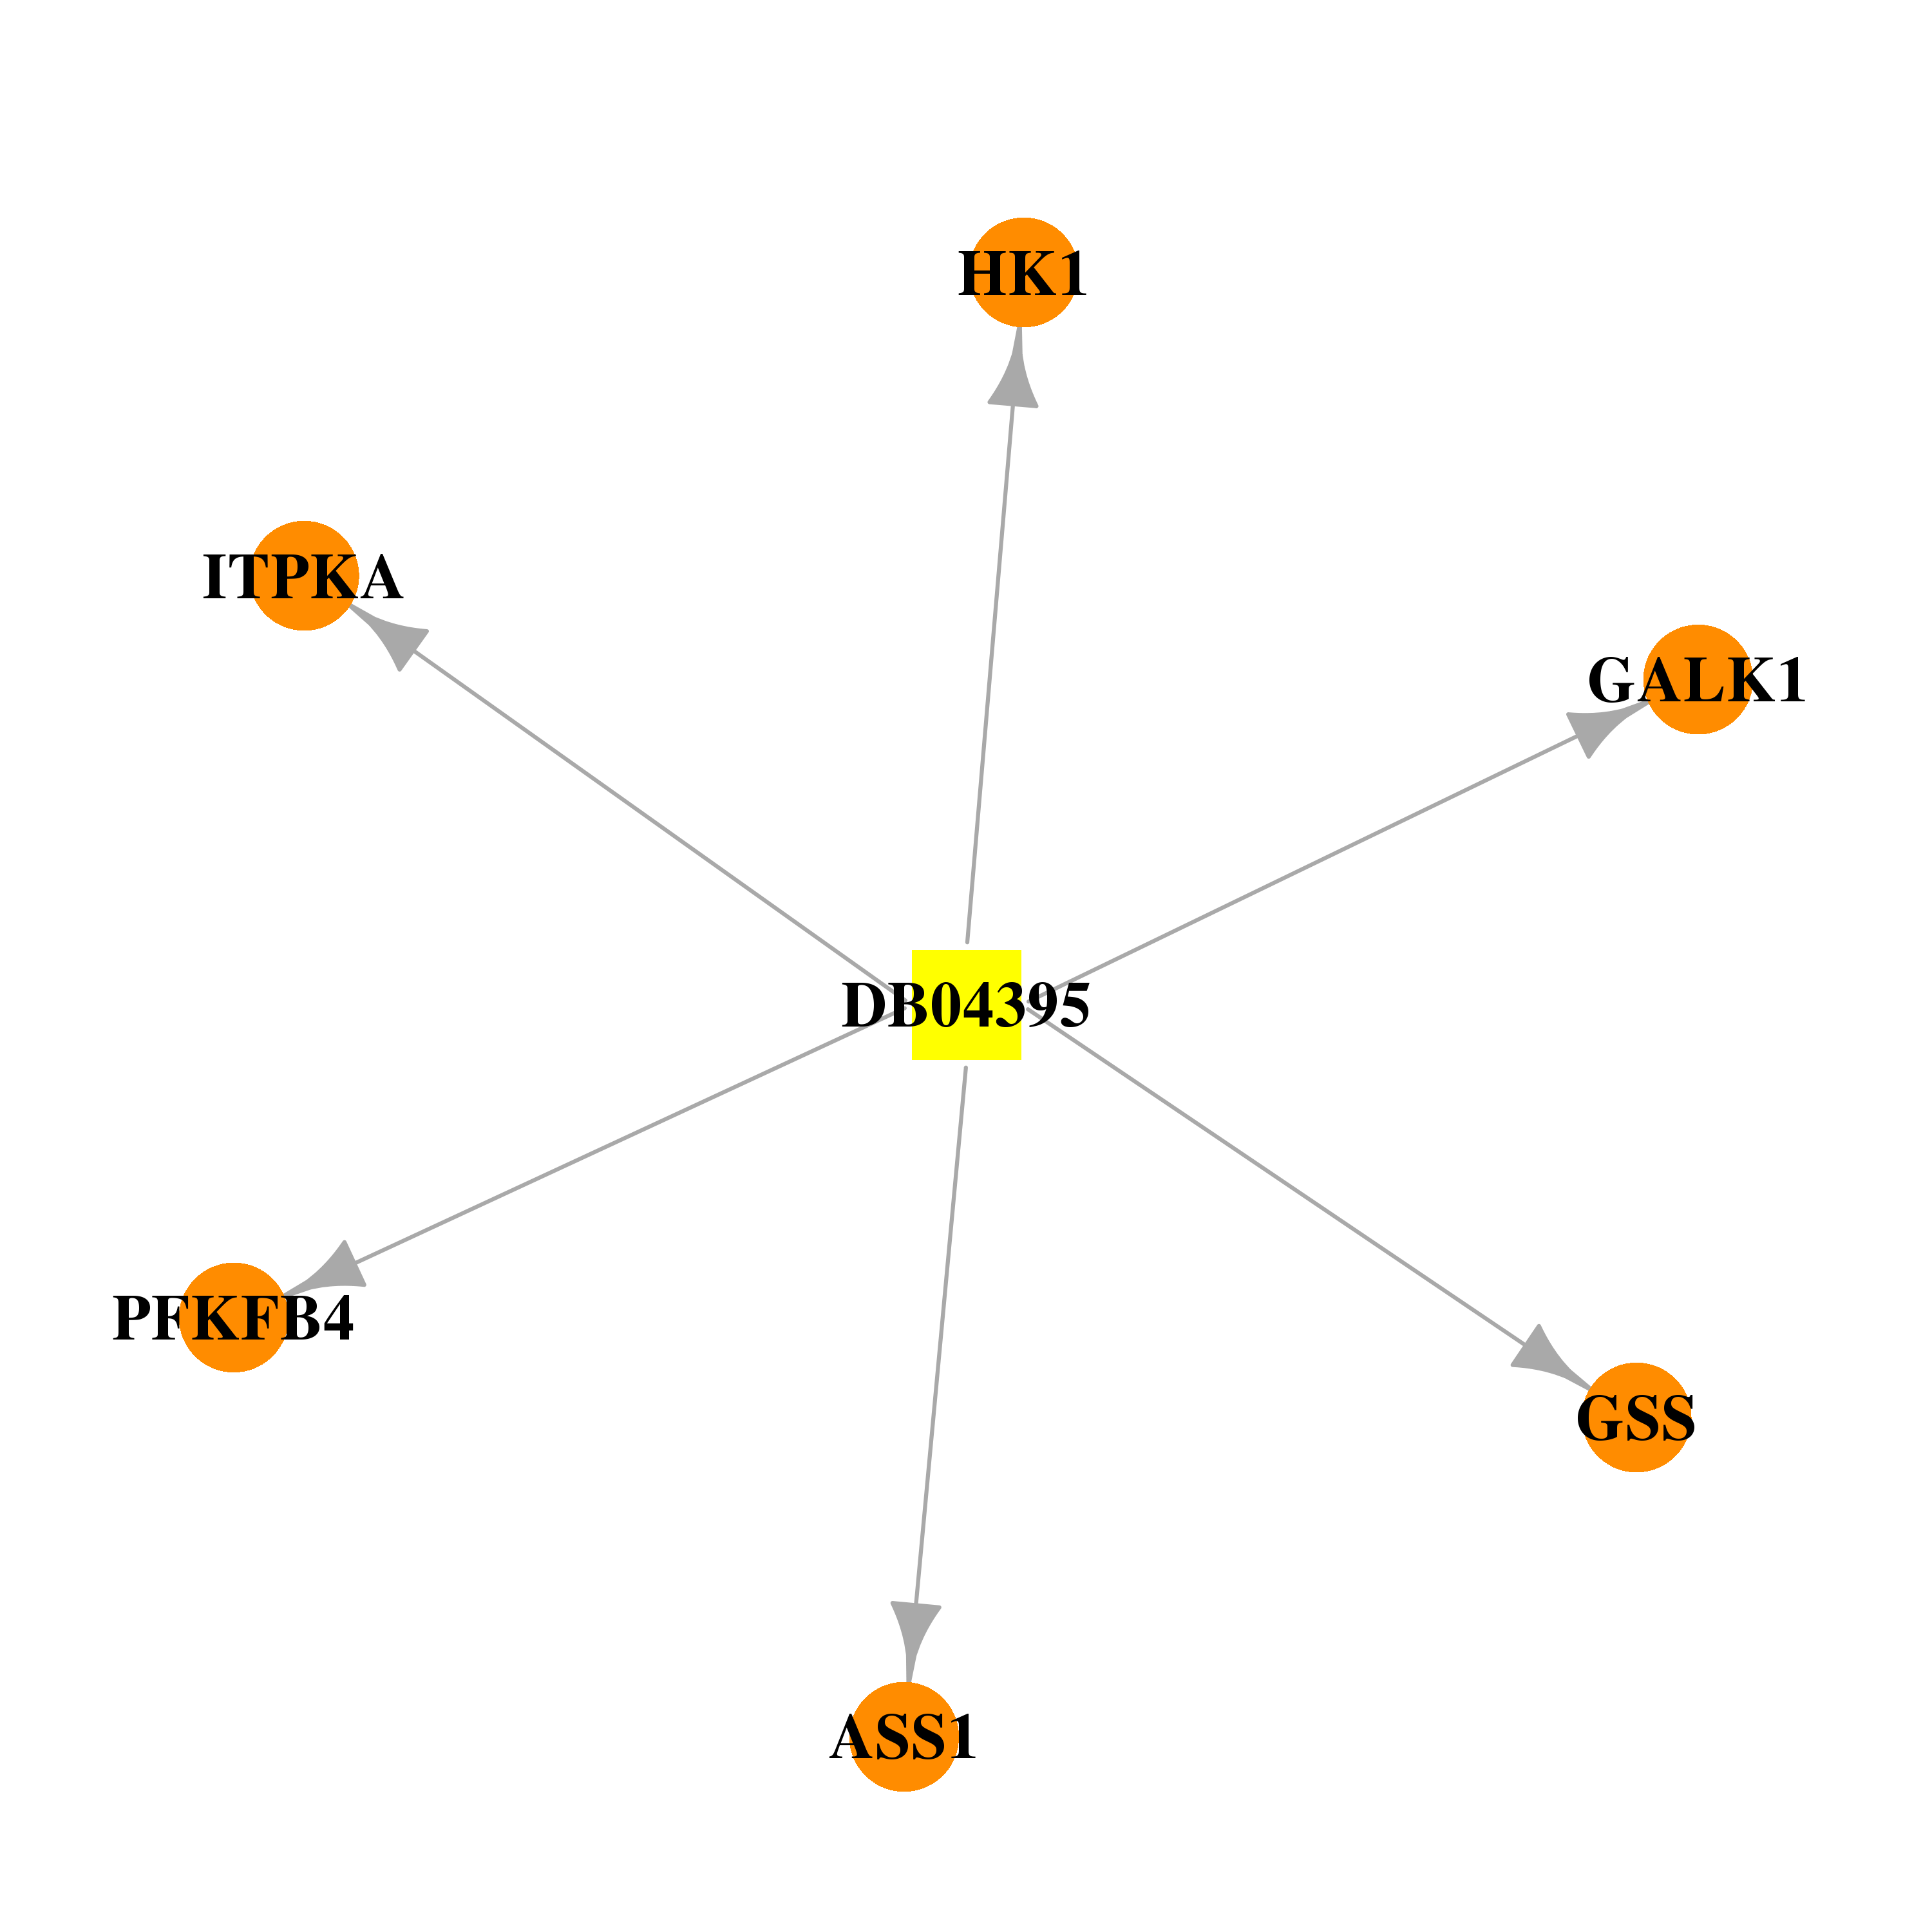 |  |
| DB00515 | glutathione synthetase | approved | Cisplatin |  |  |
| DB01033 | glutathione synthetase | approved | Mercaptopurine | 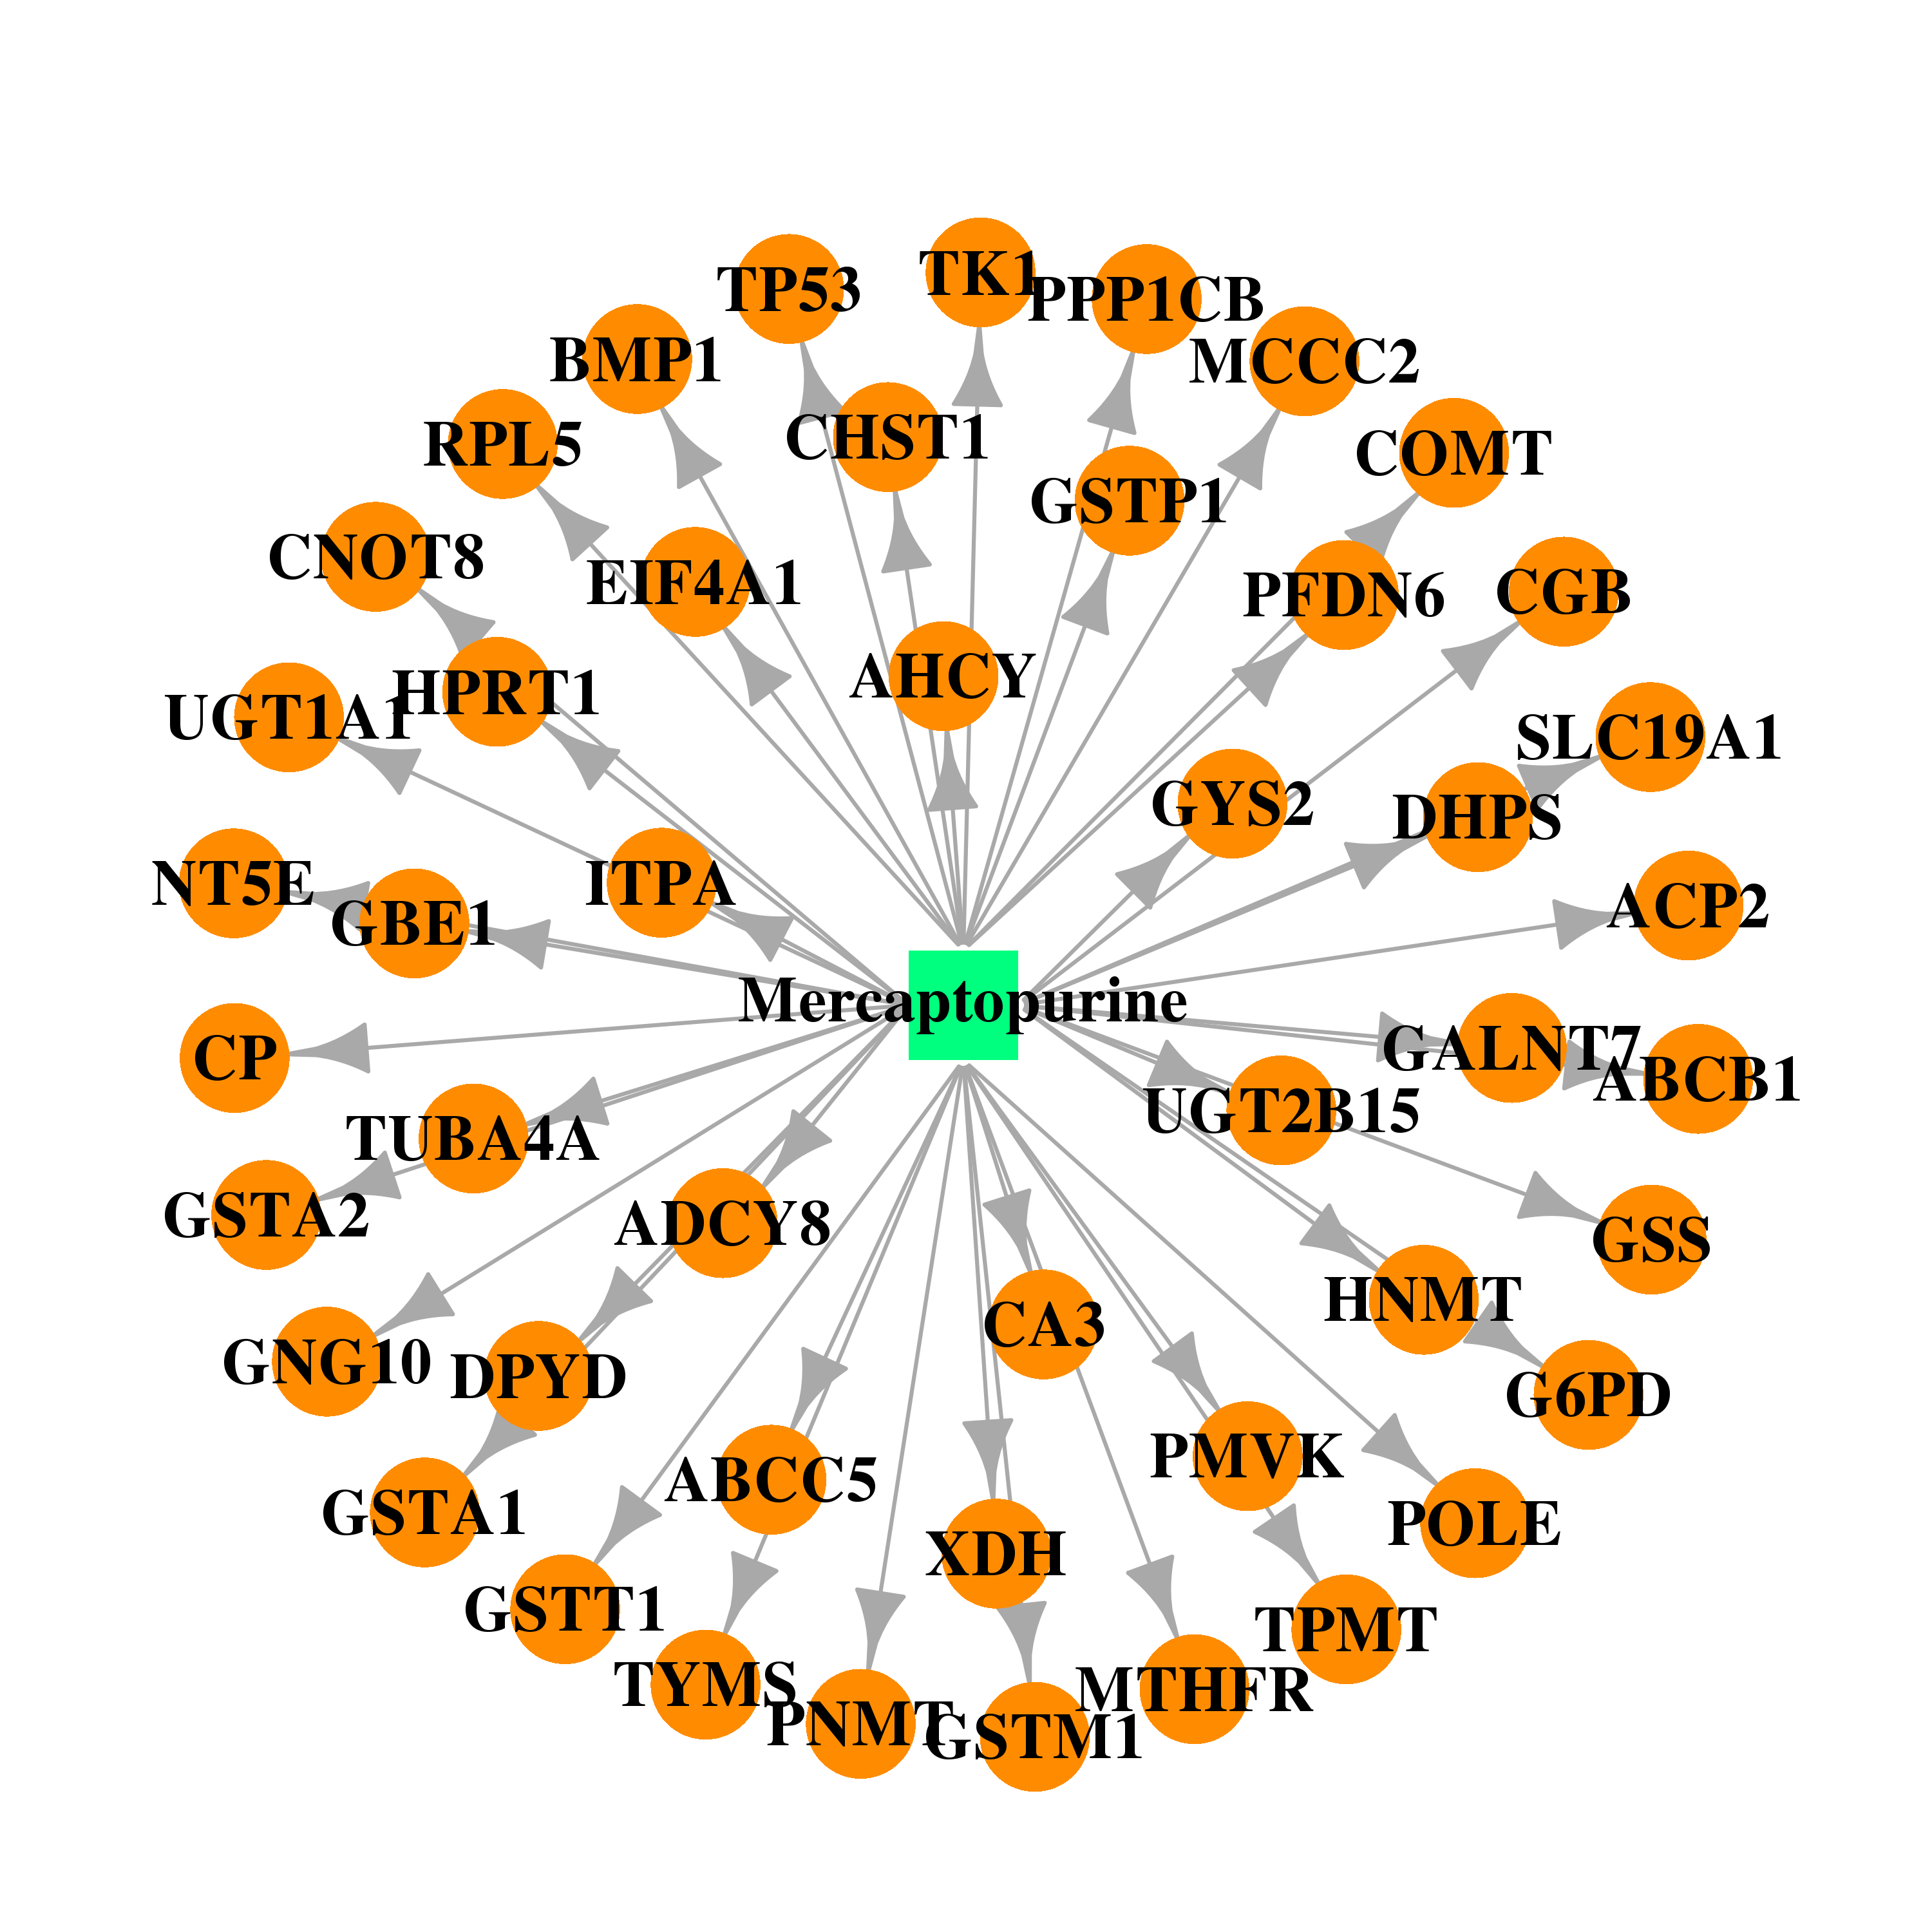 |  |
| DB00563 | glutathione synthetase | approved | Methotrexate |  |  |
| Top |
| Cross referenced IDs for GSS |
| * We obtained these cross-references from Uniprot database. It covers 150 different DBs, 18 categories. http://www.uniprot.org/help/cross_references_section |
: Open all cross reference information
|
Copyright © 2016-Present - The Univsersity of Texas Health Science Center at Houston @ |