|
||||||||||||||||||||
| |
| Phenotypic Information (metabolism pathway, cancer, disease, phenome) |
| |
| |
| Gene-Gene Network Information: Co-Expression Network, Interacting Genes & KEGG |
| |
|


| Gene Summary for GSTM3 |
| Basic gene info. | Gene symbol | GSTM3 |
| Gene name | glutathione S-transferase mu 3 (brain) | |
| Synonyms | GST5|GSTB|GSTM3-3|GTM3 | |
| Cytomap | UCSC genome browser: 1p13.3 | |
| Genomic location | chr1 :110276553-110283660 | |
| Type of gene | protein-coding | |
| RefGenes | NM_000849.4, NR_024537.1, | |
| Ensembl id | ENSG00000134202 | |
| Description | GST class-mu 3S-(hydroxyalkyl)glutathione lyase M3brain GSTbrain type mu-glutathione S-transferaseglutathione S-alkyltransferase M3glutathione S-aralkyltransferase M3glutathione S-aryltransferase M3glutathione S-transferase M3 (brain)glutathione S | |
| Modification date | 20141207 | |
| dbXrefs | MIM : 138390 | |
| HGNC : HGNC | ||
| Ensembl : ENSG00000134202 | ||
| HPRD : 00712 | ||
| Protein | UniProt: go to UniProt's Cross Reference DB Table | |
| Expression | CleanEX: HS_GSTM3 | |
| BioGPS: 2947 | ||
| Gene Expression Atlas: ENSG00000134202 | ||
| The Human Protein Atlas: ENSG00000134202 | ||
| Pathway | NCI Pathway Interaction Database: GSTM3 | |
| KEGG: GSTM3 | ||
| REACTOME: GSTM3 | ||
| ConsensusPathDB | ||
| Pathway Commons: GSTM3 | ||
| Metabolism | MetaCyc: GSTM3 | |
| HUMANCyc: GSTM3 | ||
| Regulation | Ensembl's Regulation: ENSG00000134202 | |
| miRBase: chr1 :110,276,553-110,283,660 | ||
| TargetScan: NM_000849 | ||
| cisRED: ENSG00000134202 | ||
| Context | iHOP: GSTM3 | |
| cancer metabolism search in PubMed: GSTM3 | ||
| UCL Cancer Institute: GSTM3 | ||
| Assigned class in ccmGDB | C | |
| Top |
| Phenotypic Information for GSTM3(metabolism pathway, cancer, disease, phenome) |
| Cancer | CGAP: GSTM3 |
| Familial Cancer Database: GSTM3 | |
| * This gene is included in those cancer gene databases. |
|
|
|
|
|
| . | ||||||||||||||
Oncogene 1 | Significant driver gene in | |||||||||||||||||||
| cf) number; DB name 1 Oncogene; http://nar.oxfordjournals.org/content/35/suppl_1/D721.long, 2 Tumor Suppressor gene; https://bioinfo.uth.edu/TSGene/, 3 Cancer Gene Census; http://www.nature.com/nrc/journal/v4/n3/abs/nrc1299.html, 4 CancerGenes; http://nar.oxfordjournals.org/content/35/suppl_1/D721.long, 5 Network of Cancer Gene; http://ncg.kcl.ac.uk/index.php, 1Therapeutic Vulnerabilities in Cancer; http://cbio.mskcc.org/cancergenomics/statius/ |
| KEGG_GLUTATHIONE_METABOLISM KEGG_METABOLISM_OF_XENOBIOTICS_BY_CYTOCHROME_P450 KEGG_DRUG_METABOLISM_CYTOCHROME_P450 | |
| OMIM | |
| Orphanet | |
| Disease | KEGG Disease: GSTM3 |
| MedGen: GSTM3 (Human Medical Genetics with Condition) | |
| ClinVar: GSTM3 | |
| Phenotype | MGI: GSTM3 (International Mouse Phenotyping Consortium) |
| PhenomicDB: GSTM3 | |
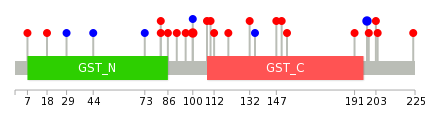
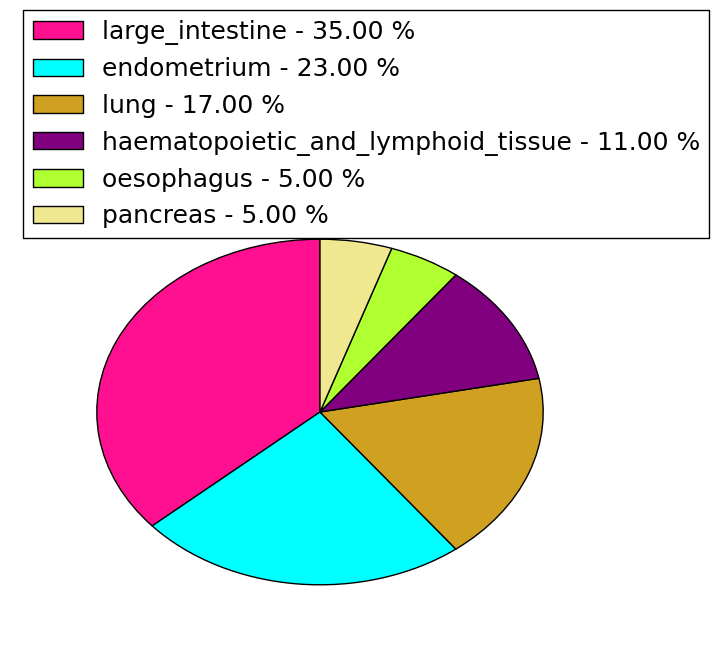
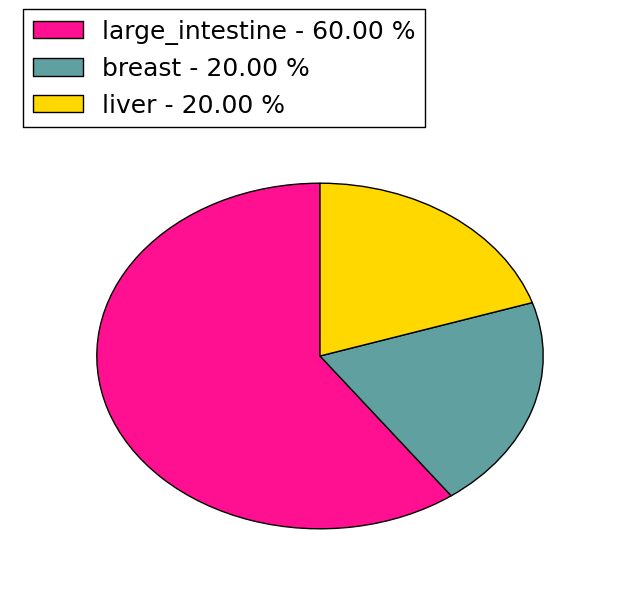
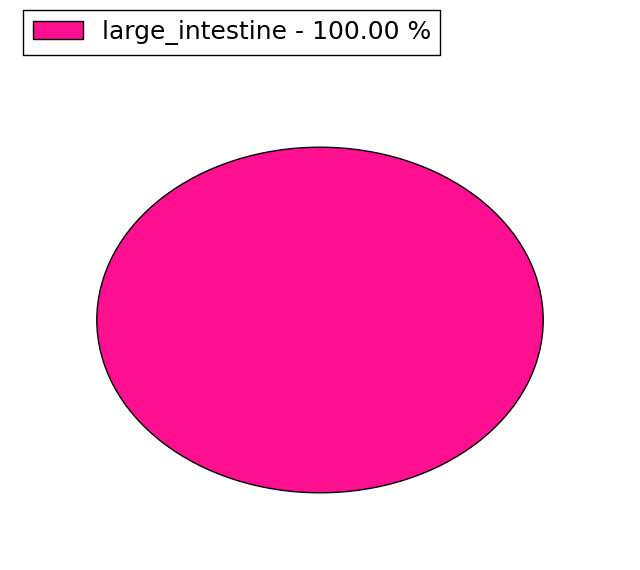
| Mutations for GSTM3 |
| * Under tables are showing count per each tissue to give us broad intuition about tissue specific mutation patterns.You can go to the detailed page for each mutation database's web site. |
| There's no structural variation information in COSMIC data for this gene. |
| * From mRNA Sanger sequences, Chitars2.0 arranged chimeric transcripts. This table shows GSTM3 related fusion information. |
| ID | Head Gene | Tail Gene | Accession | Gene_a | qStart_a | qEnd_a | Chromosome_a | tStart_a | tEnd_a | Gene_a | qStart_a | qEnd_a | Chromosome_a | tStart_a | tEnd_a |
| Top |
| There's no copy number variation information in COSMIC data for this gene. |
| Top |
|
 |
| Top |
| Stat. for Non-Synonymous SNVs (# total SNVs=17) | (# total SNVs=5) |
 |  |
(# total SNVs=1) | (# total SNVs=0) |
 |
| Top |
| * When you move the cursor on each content, you can see more deailed mutation information on the Tooltip. Those are primary_site,primary_histology,mutation(aa),pubmedID. |
| GRCh37 position | Mutation(aa) | Unique sampleID count |
| chr1:110280786-110280786 | p.R100Q | 2 |
| chr1:110279777-110279777 | p.I198I | 2 |
| chr1:110280763-110280763 | p.V108I | 1 |
| chr1:110282101-110282101 | p.R47* | 1 |
| chr1:110280288-110280288 | p.A153V | 1 |
| chr1:110280785-110280785 | p.R100R | 1 |
| chr1:110282108-110282108 | p.D44D | 1 |
| chr1:110280297-110280297 | p.S150L | 1 |
| chr1:110282492-110282492 | p.D29D | 1 |
| chr1:110280306-110280306 | p.G147E | 1 |
| Top |
|
 |
| Point Mutation/ Tissue ID | 1 | 2 | 3 | 4 | 5 | 6 | 7 | 8 | 9 | 10 | 11 | 12 | 13 | 14 | 15 | 16 | 17 | 18 | 19 | 20 |
| # sample | 1 | 4 | 1 | 1 | 1 | 1 | 4 | 3 | 1 | 3 | ||||||||||
| # mutation | 1 | 5 | 1 | 1 | 1 | 1 | 4 | 3 | 1 | 3 | ||||||||||
| nonsynonymous SNV | 3 | 1 | 1 | 1 | 1 | 2 | 2 | 1 | 3 | |||||||||||
| synonymous SNV | 1 | 2 | 2 | 1 |
| cf) Tissue ID; Tissue type (1; BLCA[Bladder Urothelial Carcinoma], 2; BRCA[Breast invasive carcinoma], 3; CESC[Cervical squamous cell carcinoma and endocervical adenocarcinoma], 4; COAD[Colon adenocarcinoma], 5; GBM[Glioblastoma multiforme], 6; Glioma Low Grade, 7; HNSC[Head and Neck squamous cell carcinoma], 8; KICH[Kidney Chromophobe], 9; KIRC[Kidney renal clear cell carcinoma], 10; KIRP[Kidney renal papillary cell carcinoma], 11; LAML[Acute Myeloid Leukemia], 12; LUAD[Lung adenocarcinoma], 13; LUSC[Lung squamous cell carcinoma], 14; OV[Ovarian serous cystadenocarcinoma ], 15; PAAD[Pancreatic adenocarcinoma], 16; PRAD[Prostate adenocarcinoma], 17; SKCM[Skin Cutaneous Melanoma], 18:STAD[Stomach adenocarcinoma], 19:THCA[Thyroid carcinoma], 20:UCEC[Uterine Corpus Endometrial Carcinoma]) |
| Top |
| * We represented just top 10 SNVs. When you move the cursor on each content, you can see more deailed mutation information on the Tooltip. Those are primary_site, primary_histology, mutation(aa), pubmedID. |
| Genomic Position | Mutation(aa) | Unique sampleID count |
| chr1:110282108 | p.L132F | 1 |
| chr1:110280306 | p.Y120H | 1 |
| chr1:110282492 | p.D110D | 1 |
| chr1:110280341 | p.C91F | 1 |
| chr1:110282526 | p.R86C | 1 |
| chr1:110280350 | p.R82H | 1 |
| chr1:110279761 | p.S204A | 1 |
| chr1:110280727 | p.R82C | 1 |
| chr1:110279764 | p.Q203K | 1 |
| chr1:110280755 | p.K73K | 1 |
| * Copy number data were extracted from TCGA using R package TCGA-Assembler. The URLs of all public data files on TCGA DCC data server were gathered on Jan-05-2015. Function ProcessCNAData in TCGA-Assembler package was used to obtain gene-level copy number value which is calculated as the average copy number of the genomic region of a gene. |
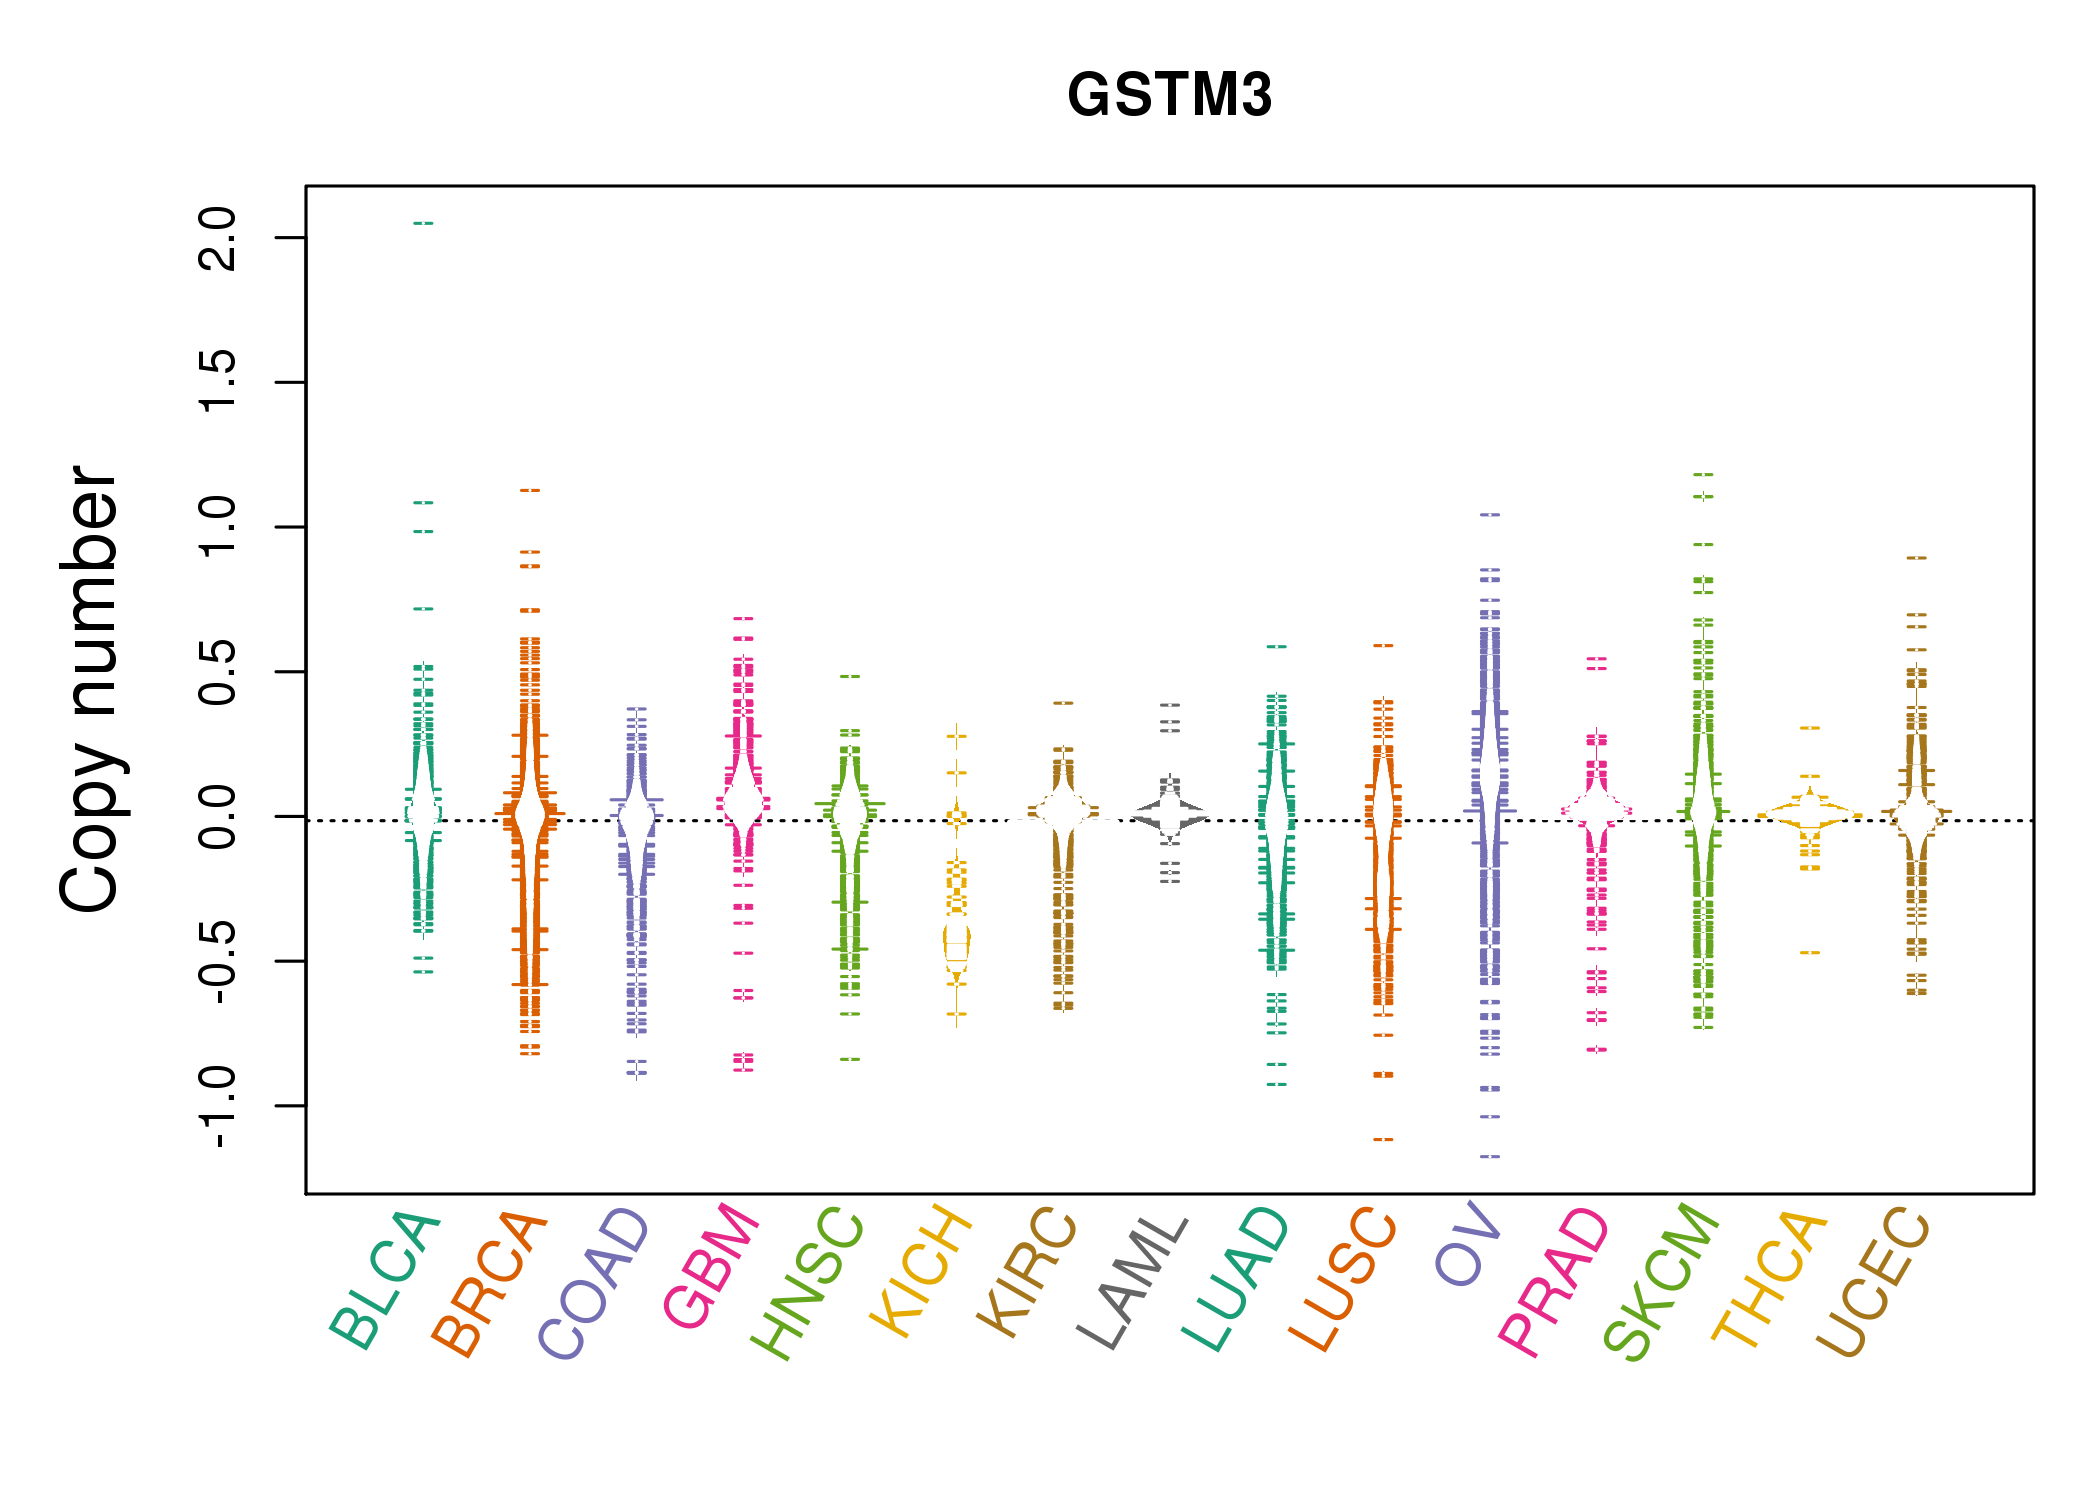 |
| cf) Tissue ID[Tissue type]: BLCA[Bladder Urothelial Carcinoma], BRCA[Breast invasive carcinoma], CESC[Cervical squamous cell carcinoma and endocervical adenocarcinoma], COAD[Colon adenocarcinoma], GBM[Glioblastoma multiforme], Glioma Low Grade, HNSC[Head and Neck squamous cell carcinoma], KICH[Kidney Chromophobe], KIRC[Kidney renal clear cell carcinoma], KIRP[Kidney renal papillary cell carcinoma], LAML[Acute Myeloid Leukemia], LUAD[Lung adenocarcinoma], LUSC[Lung squamous cell carcinoma], OV[Ovarian serous cystadenocarcinoma ], PAAD[Pancreatic adenocarcinoma], PRAD[Prostate adenocarcinoma], SKCM[Skin Cutaneous Melanoma], STAD[Stomach adenocarcinoma], THCA[Thyroid carcinoma], UCEC[Uterine Corpus Endometrial Carcinoma] |
| Top |
| Gene Expression for GSTM3 |
| * CCLE gene expression data were extracted from CCLE_Expression_Entrez_2012-10-18.res: Gene-centric RMA-normalized mRNA expression data. |
 |
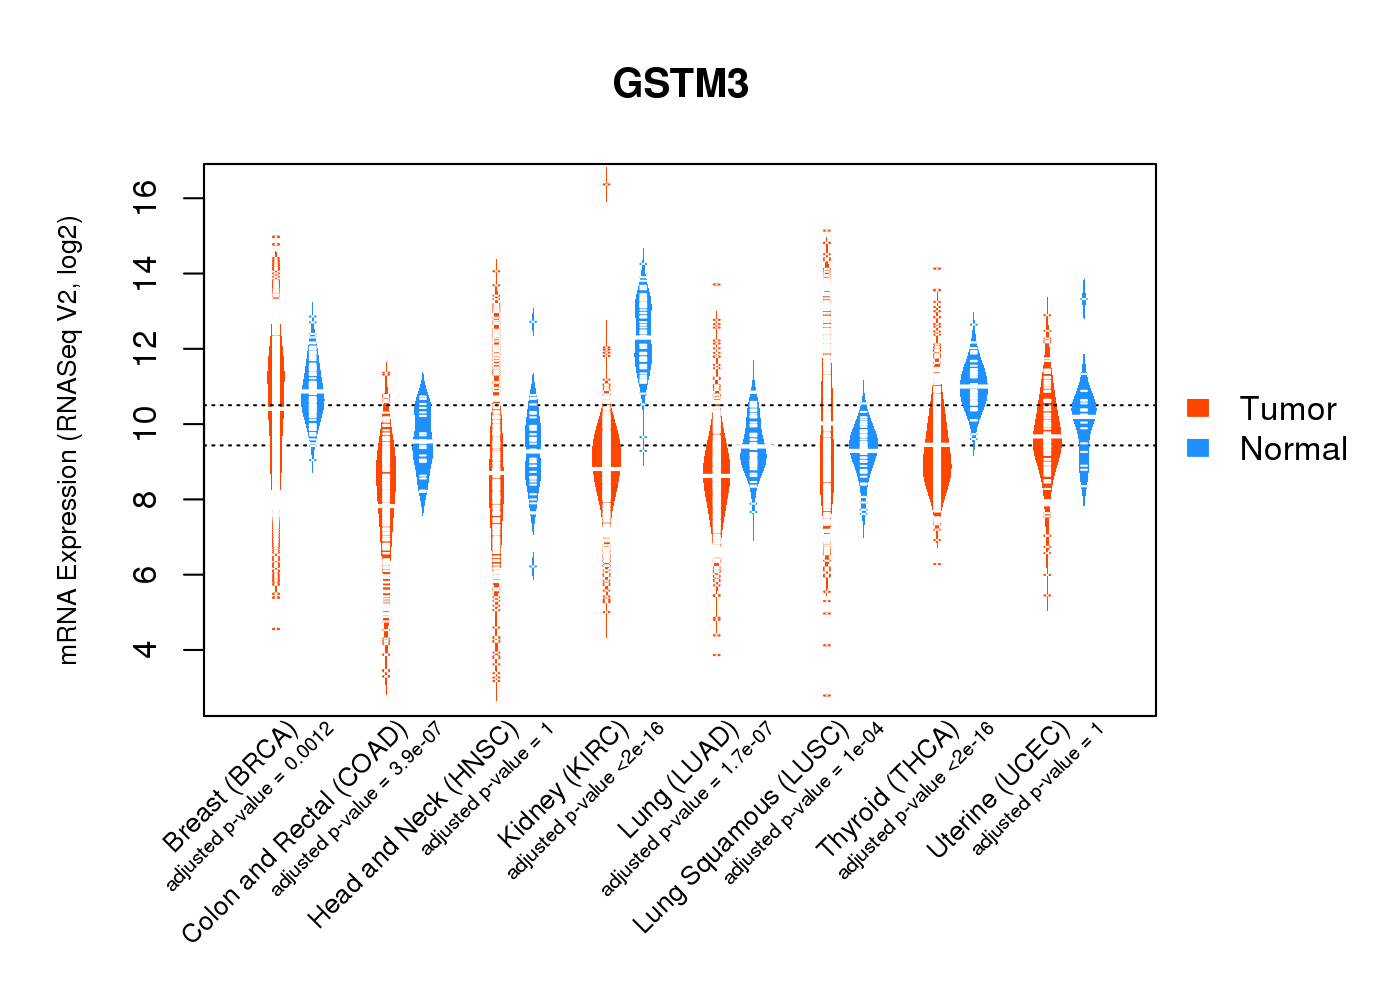
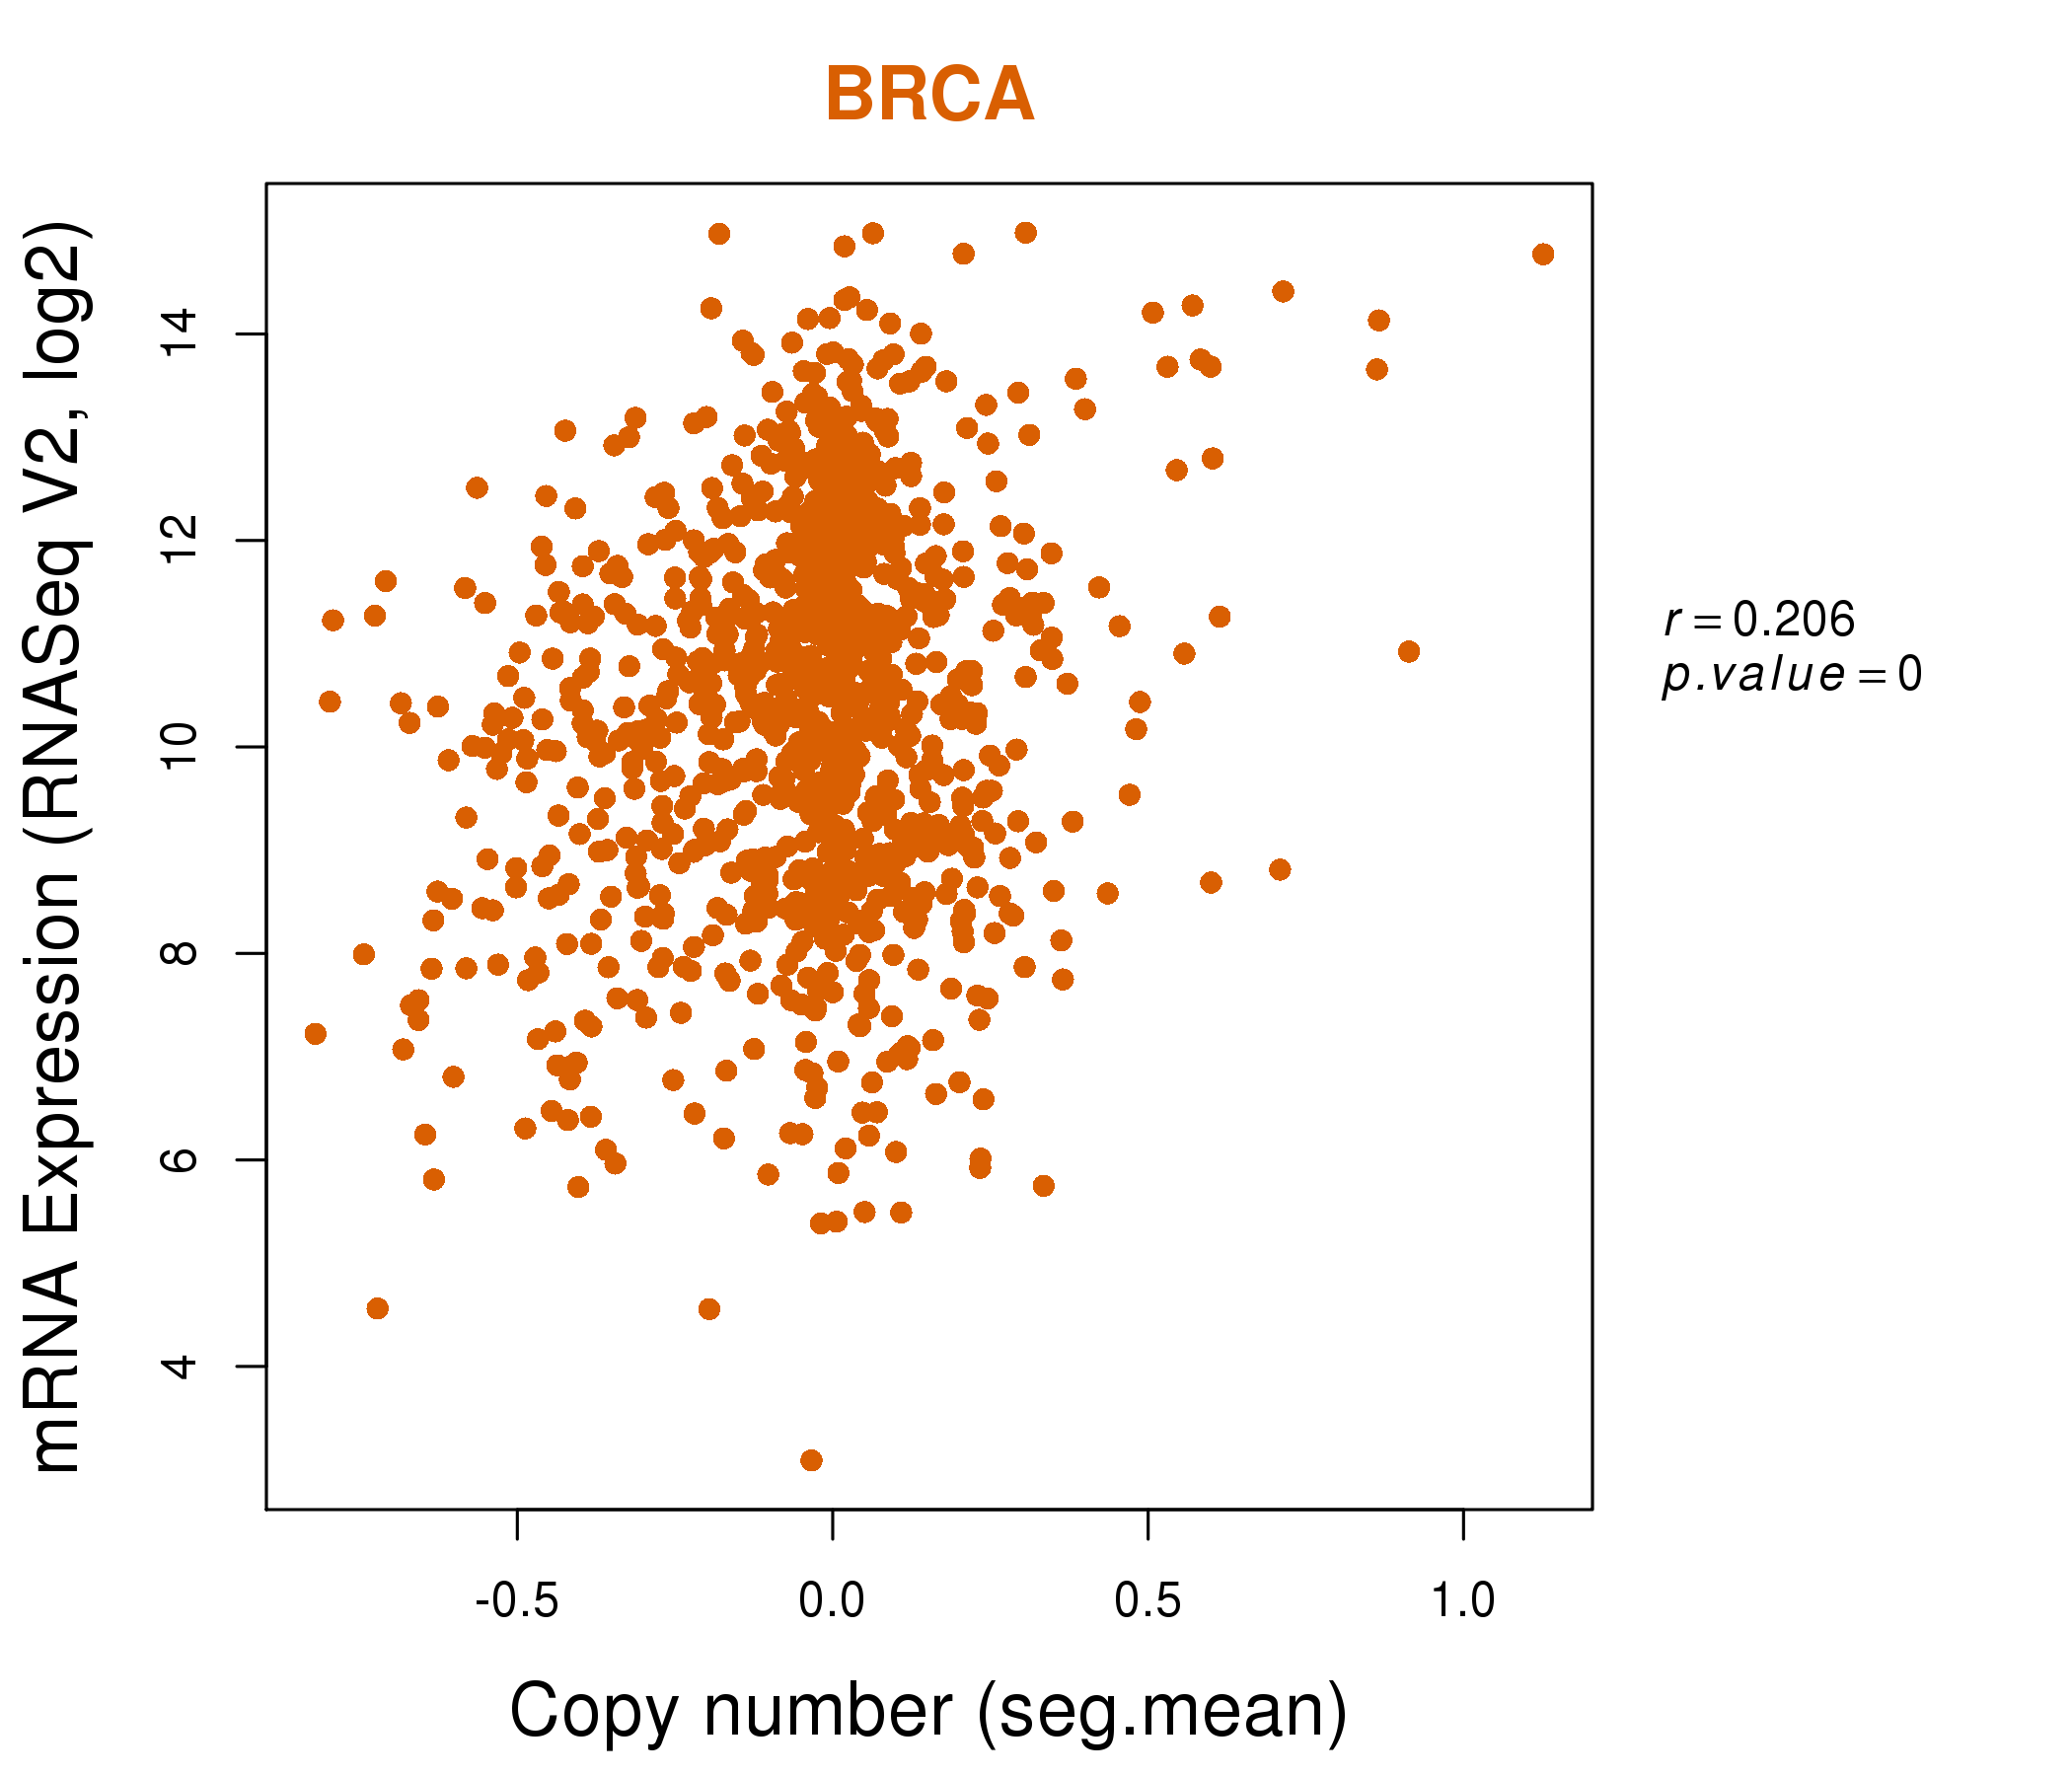
| * Normalized gene expression data of RNASeqV2 was extracted from TCGA using R package TCGA-Assembler. The URLs of all public data files on TCGA DCC data server were gathered at Jan-05-2015. Only eight cancer types have enough normal control samples for differential expression analysis. (t test, adjusted p<0.05 (using Benjamini-Hochberg FDR)) |
 |
| Top |
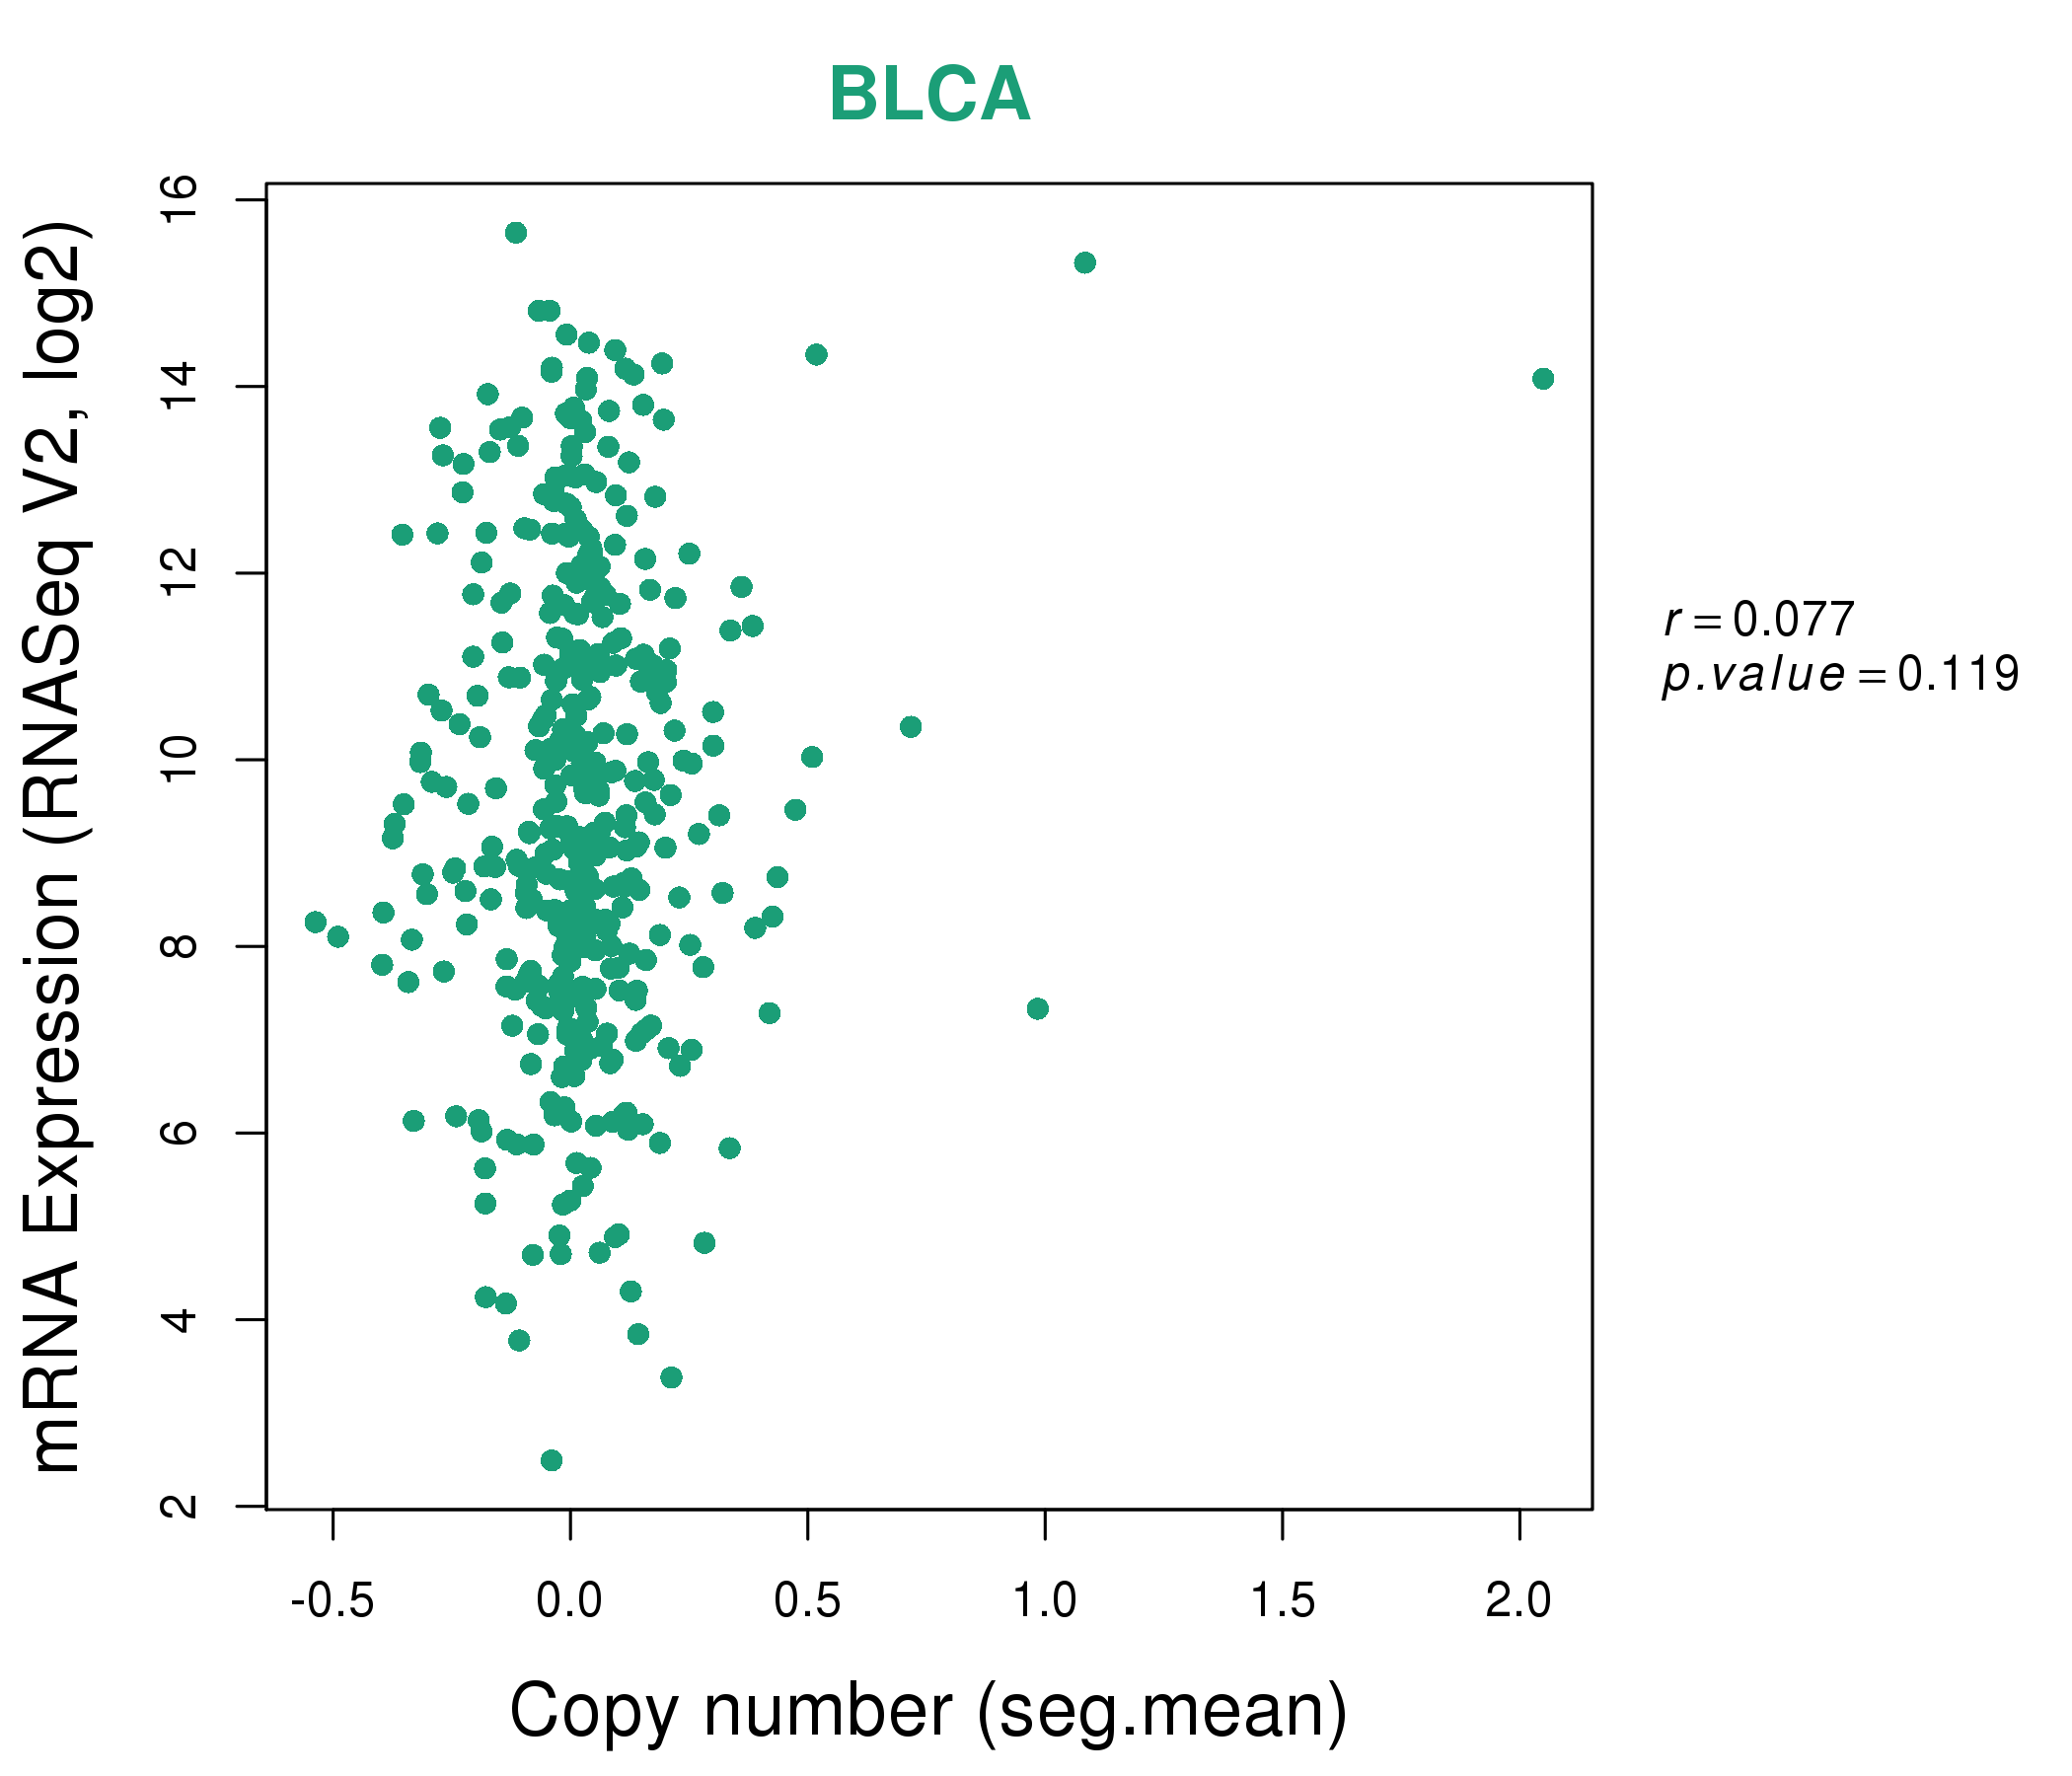
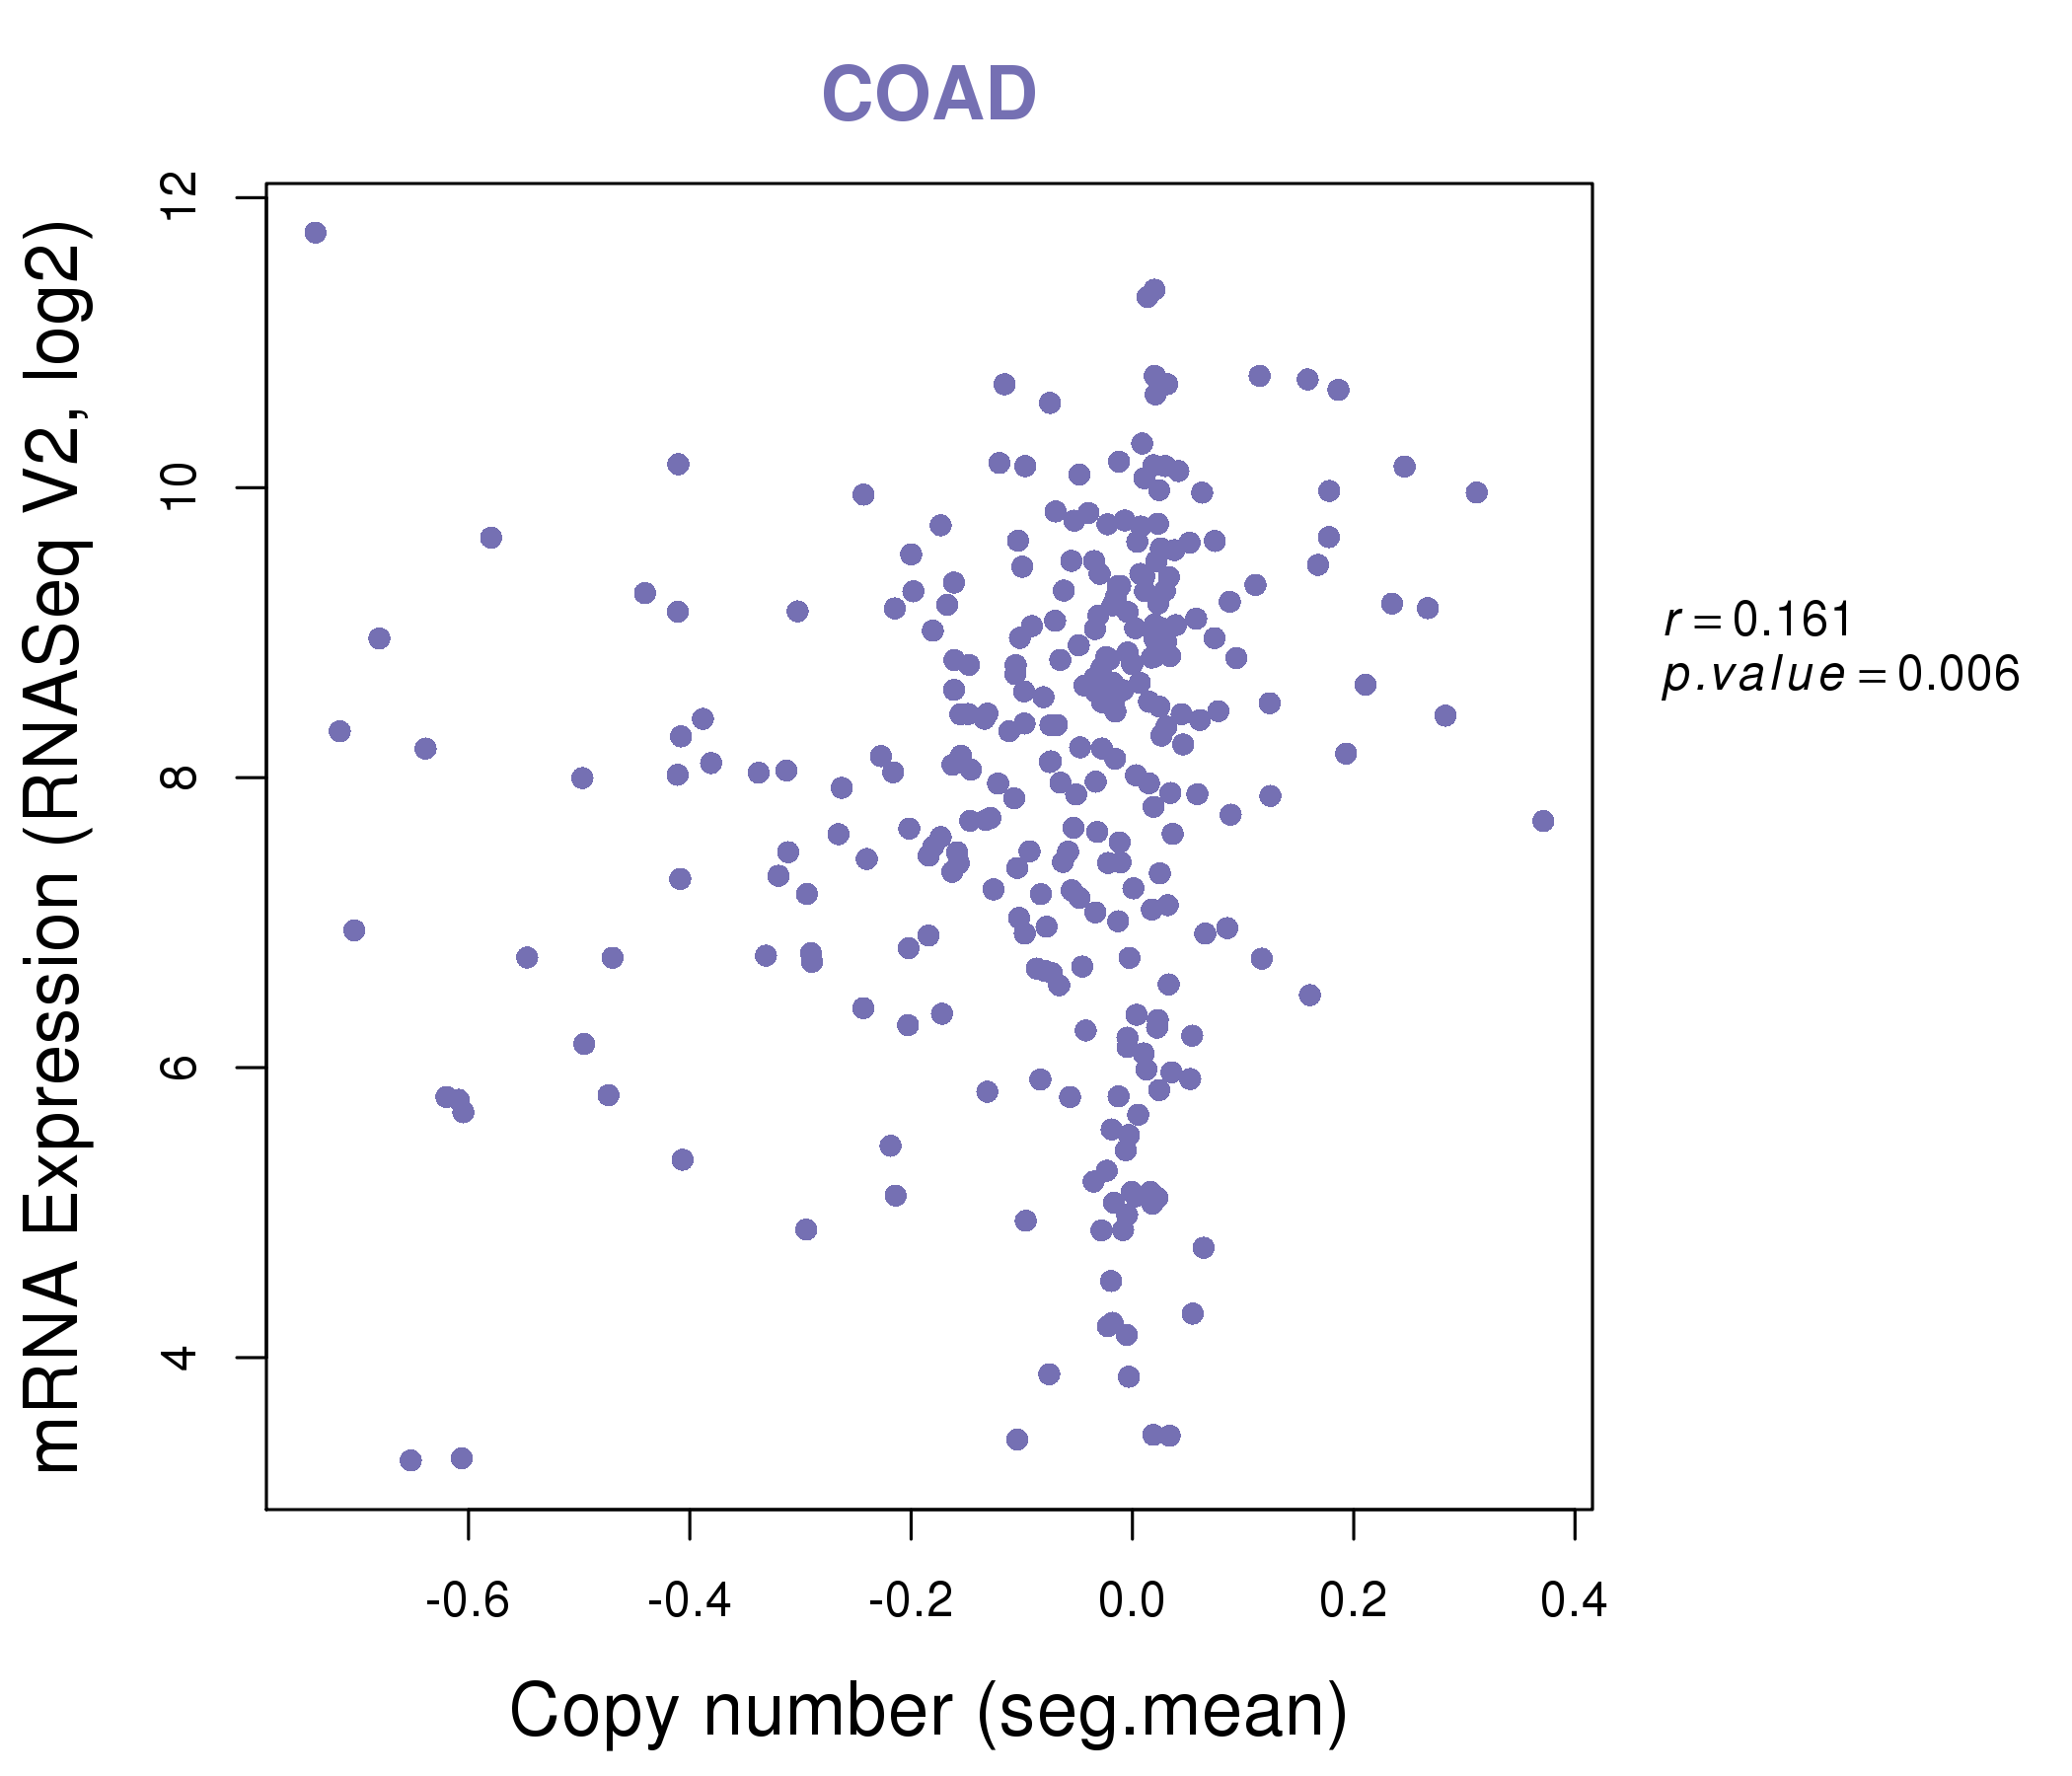
| * This plots show the correlation between CNV and gene expression. |
: Open all plots for all cancer types
 |
|
 |
|

| Top |
| Gene-Gene Network Information |
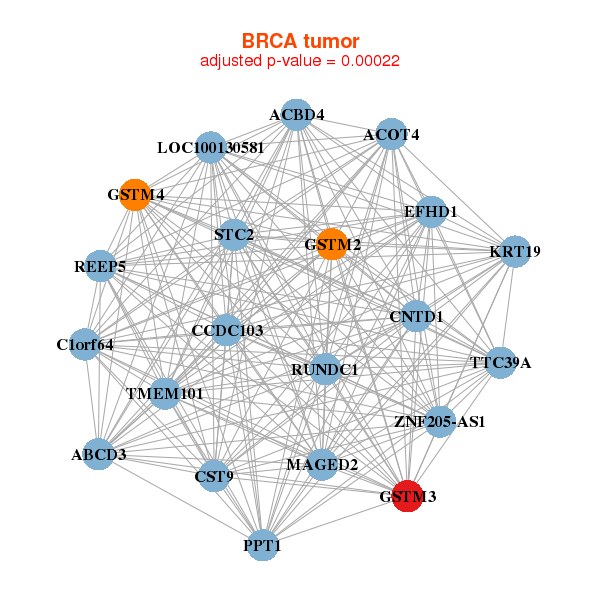
| * Co-Expression network figures were drawn using R package igraph. Only the top 20 genes with the highest correlations were shown. Red circle: input gene, orange circle: cell metabolism gene, sky circle: other gene |
: Open all plots for all cancer types
 |
| ||||
| ABCD3,ACBD4,ACOT4,C1orf64,CCDC103,CNTD1,CST9, EFHD1,GSTM2,GSTM3,GSTM4,KRT19,LOC100130581,MAGED2, ZNF205-AS1,PPT1,REEP5,RUNDC1,STC2,TMEM101,TTC39A | AAGAB,LINC00324,CAMK2N1,DNALI1,EFHD1,EIF2AK1,ERBB4, FOXA1,GLOD5,GSTM3,LYPD6B,MLPH,MYB,PPAPDC1B, PPT1,RFX6,SPA17,TMEM116,TSPAN13,TTC39A,XBP1 | ||||
 |
| ||||
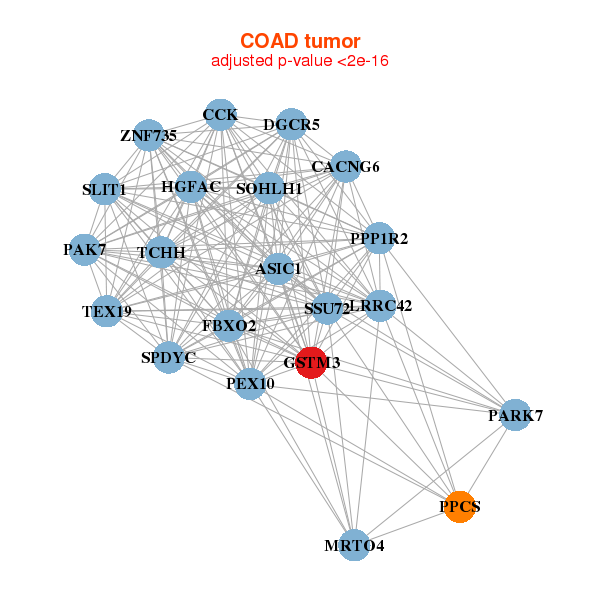
| ASIC1,CACNG6,CCK,DGCR5,FBXO2,GSTM3,HGFAC, LRRC42,MRTO4,PAK7,PARK7,PEX10,PPCS,PPP1R2, SLIT1,SOHLH1,SPDYC,SSU72,TCHH,TEX19,ZNF735 | ALDH1A1,ANO6,BEX1,BTC,LYRM9,C1QTNF3,C4orf3, CA11,CACNB2,DDHD2,ECM2,DENND6A,GSTM3,KRT222, CPQ,RGS5,SEC22C,STK33,TMEM64,XPA,ZNF639 |
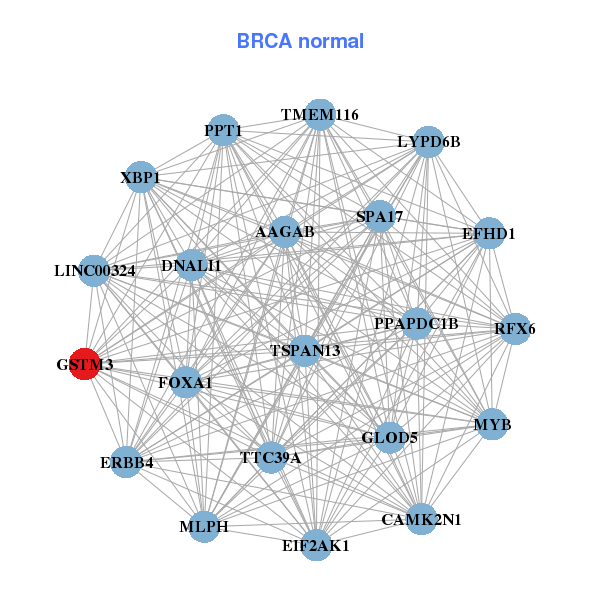

| * Co-Expression network figures were drawn using R package igraph. Only the top 20 genes with the highest correlations were shown. Red circle: input gene, orange circle: cell metabolism gene, sky circle: other gene |
: Open all plots for all cancer types
| Top |
: Open all interacting genes' information including KEGG pathway for all interacting genes from DAVID
| Top |
| Pharmacological Information for GSTM3 |
| DB Category | DB Name | DB's ID and Url link |
| * Gene Centered Interaction Network. |
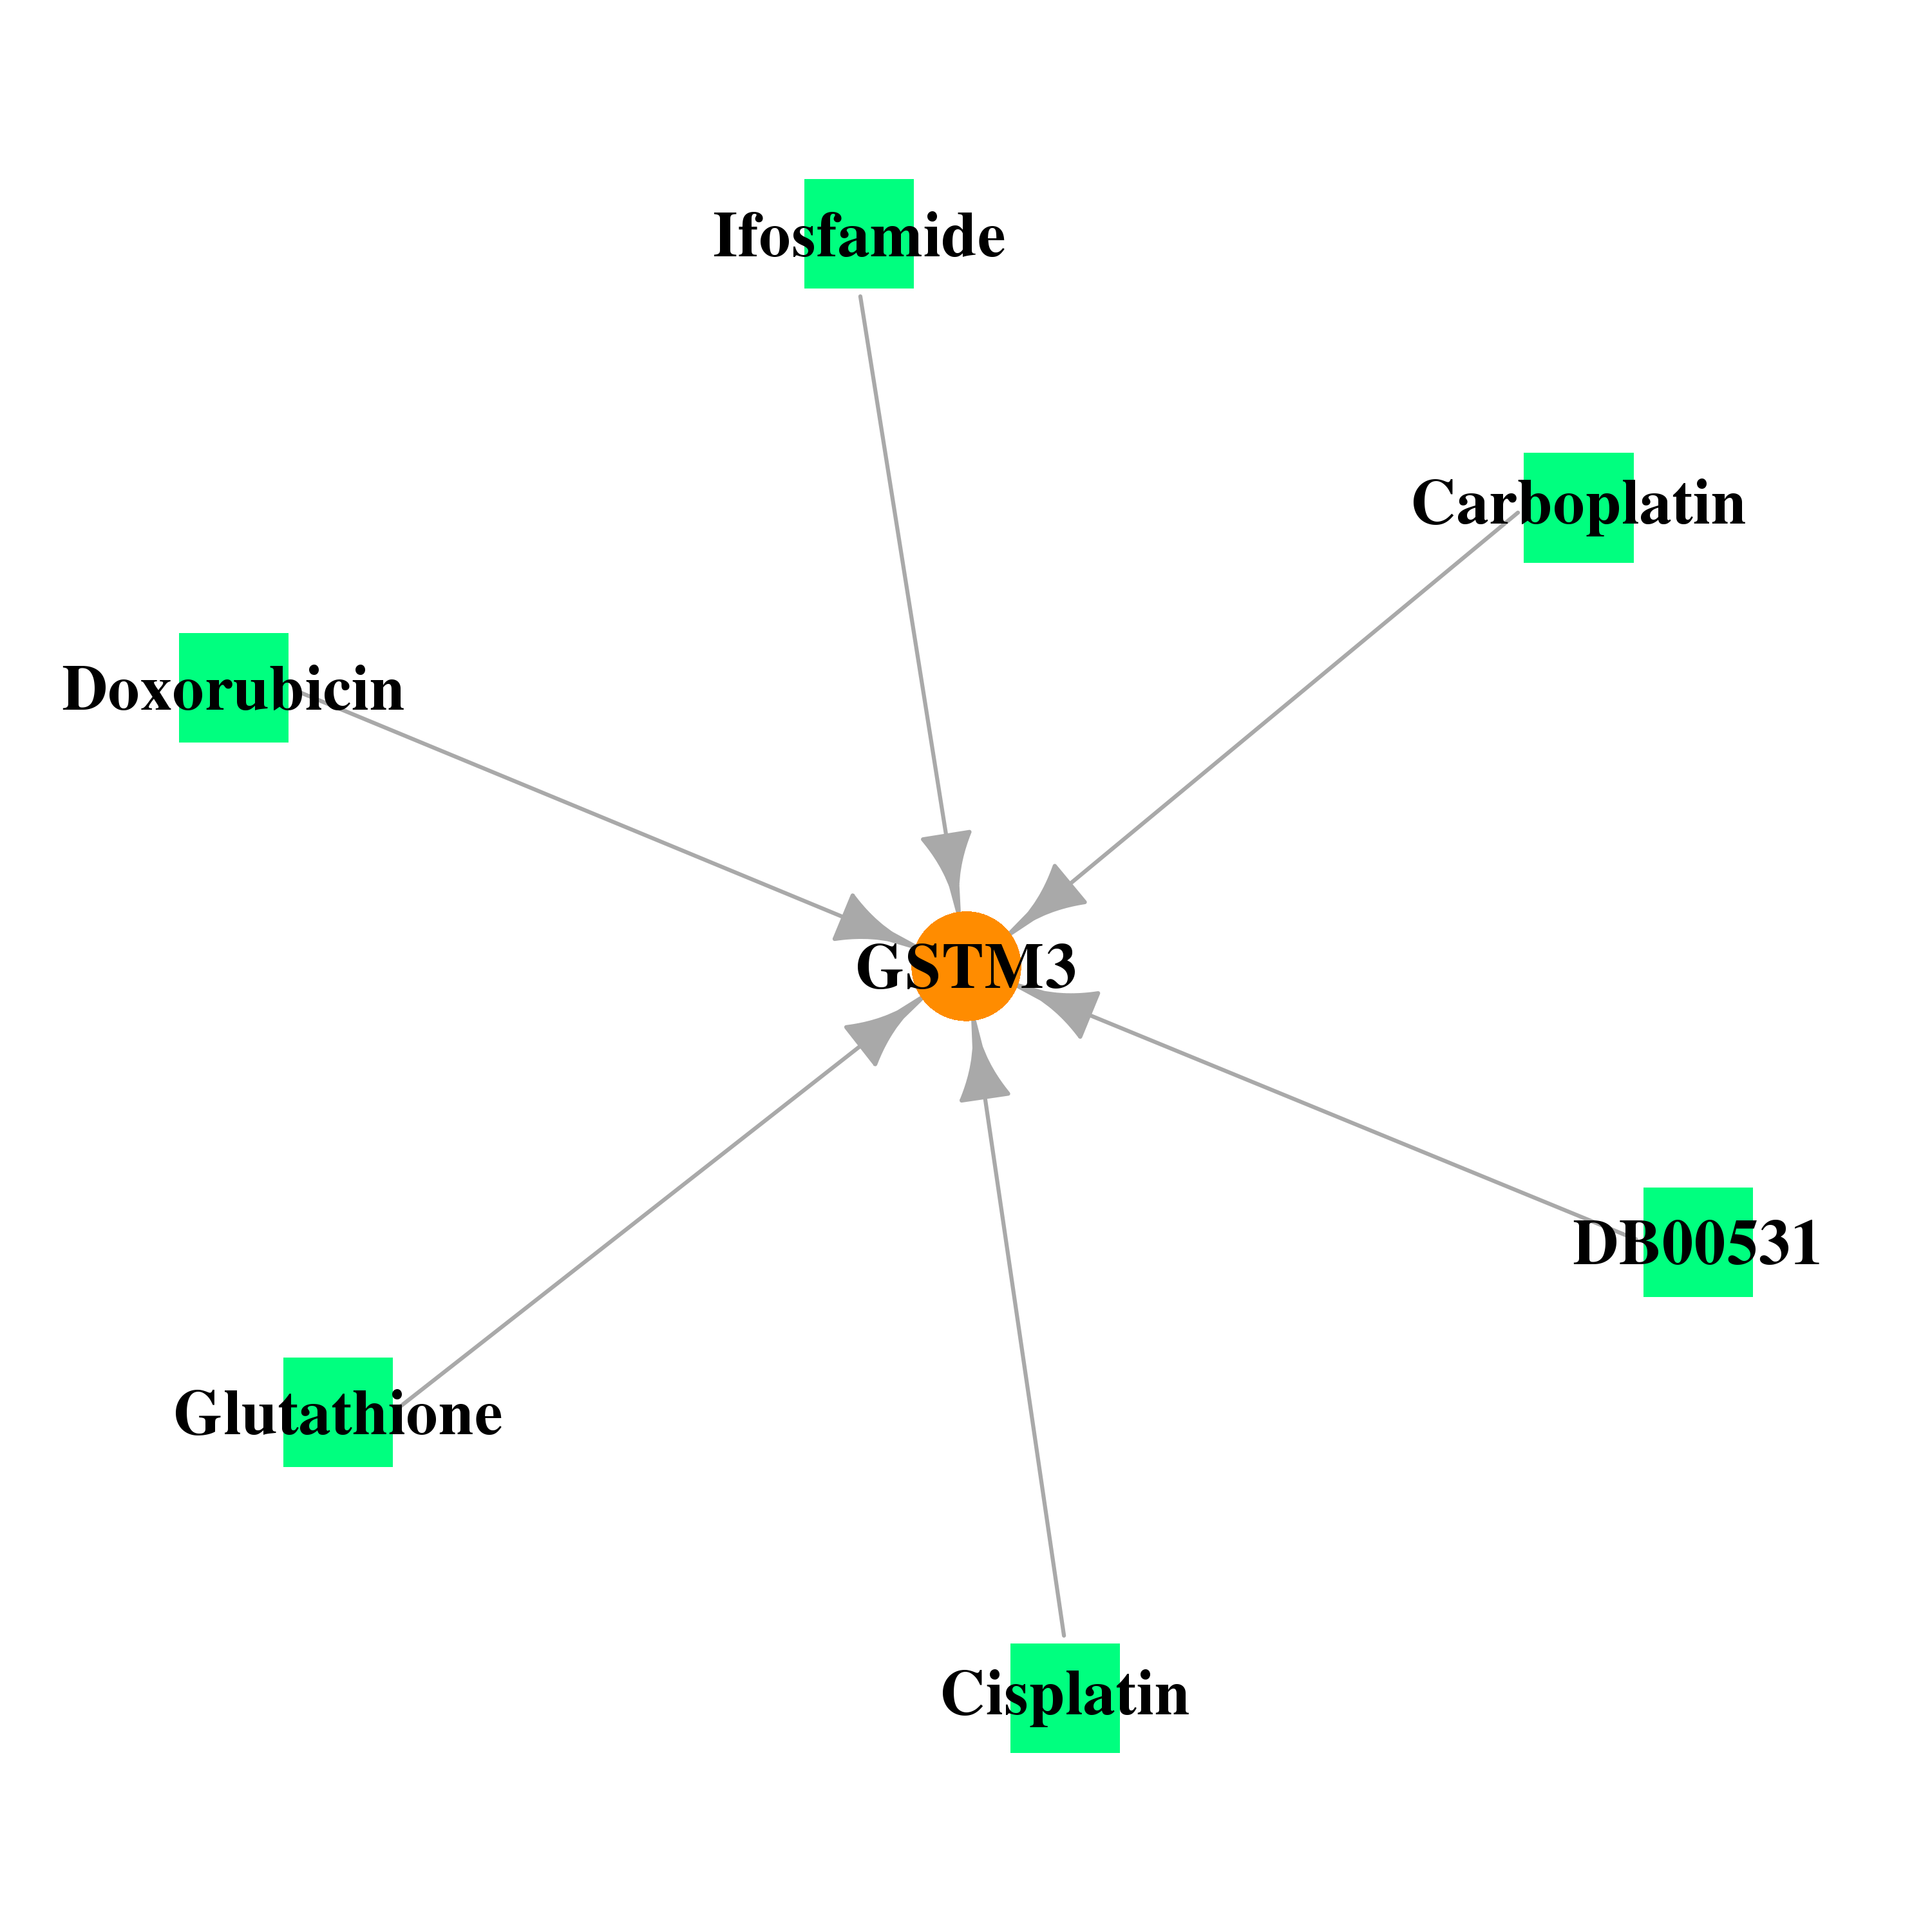 |
| * Drug Centered Interaction Network. |
| DrugBank ID | Target Name | Drug Groups | Generic Name | Drug Centered Network | Drug Structure |
| DB00143 | glutathione S-transferase mu 3 (brain) | approved; nutraceutical | Glutathione |  |  |
| DB00958 | glutathione S-transferase mu 3 (brain) | approved | Carboplatin | 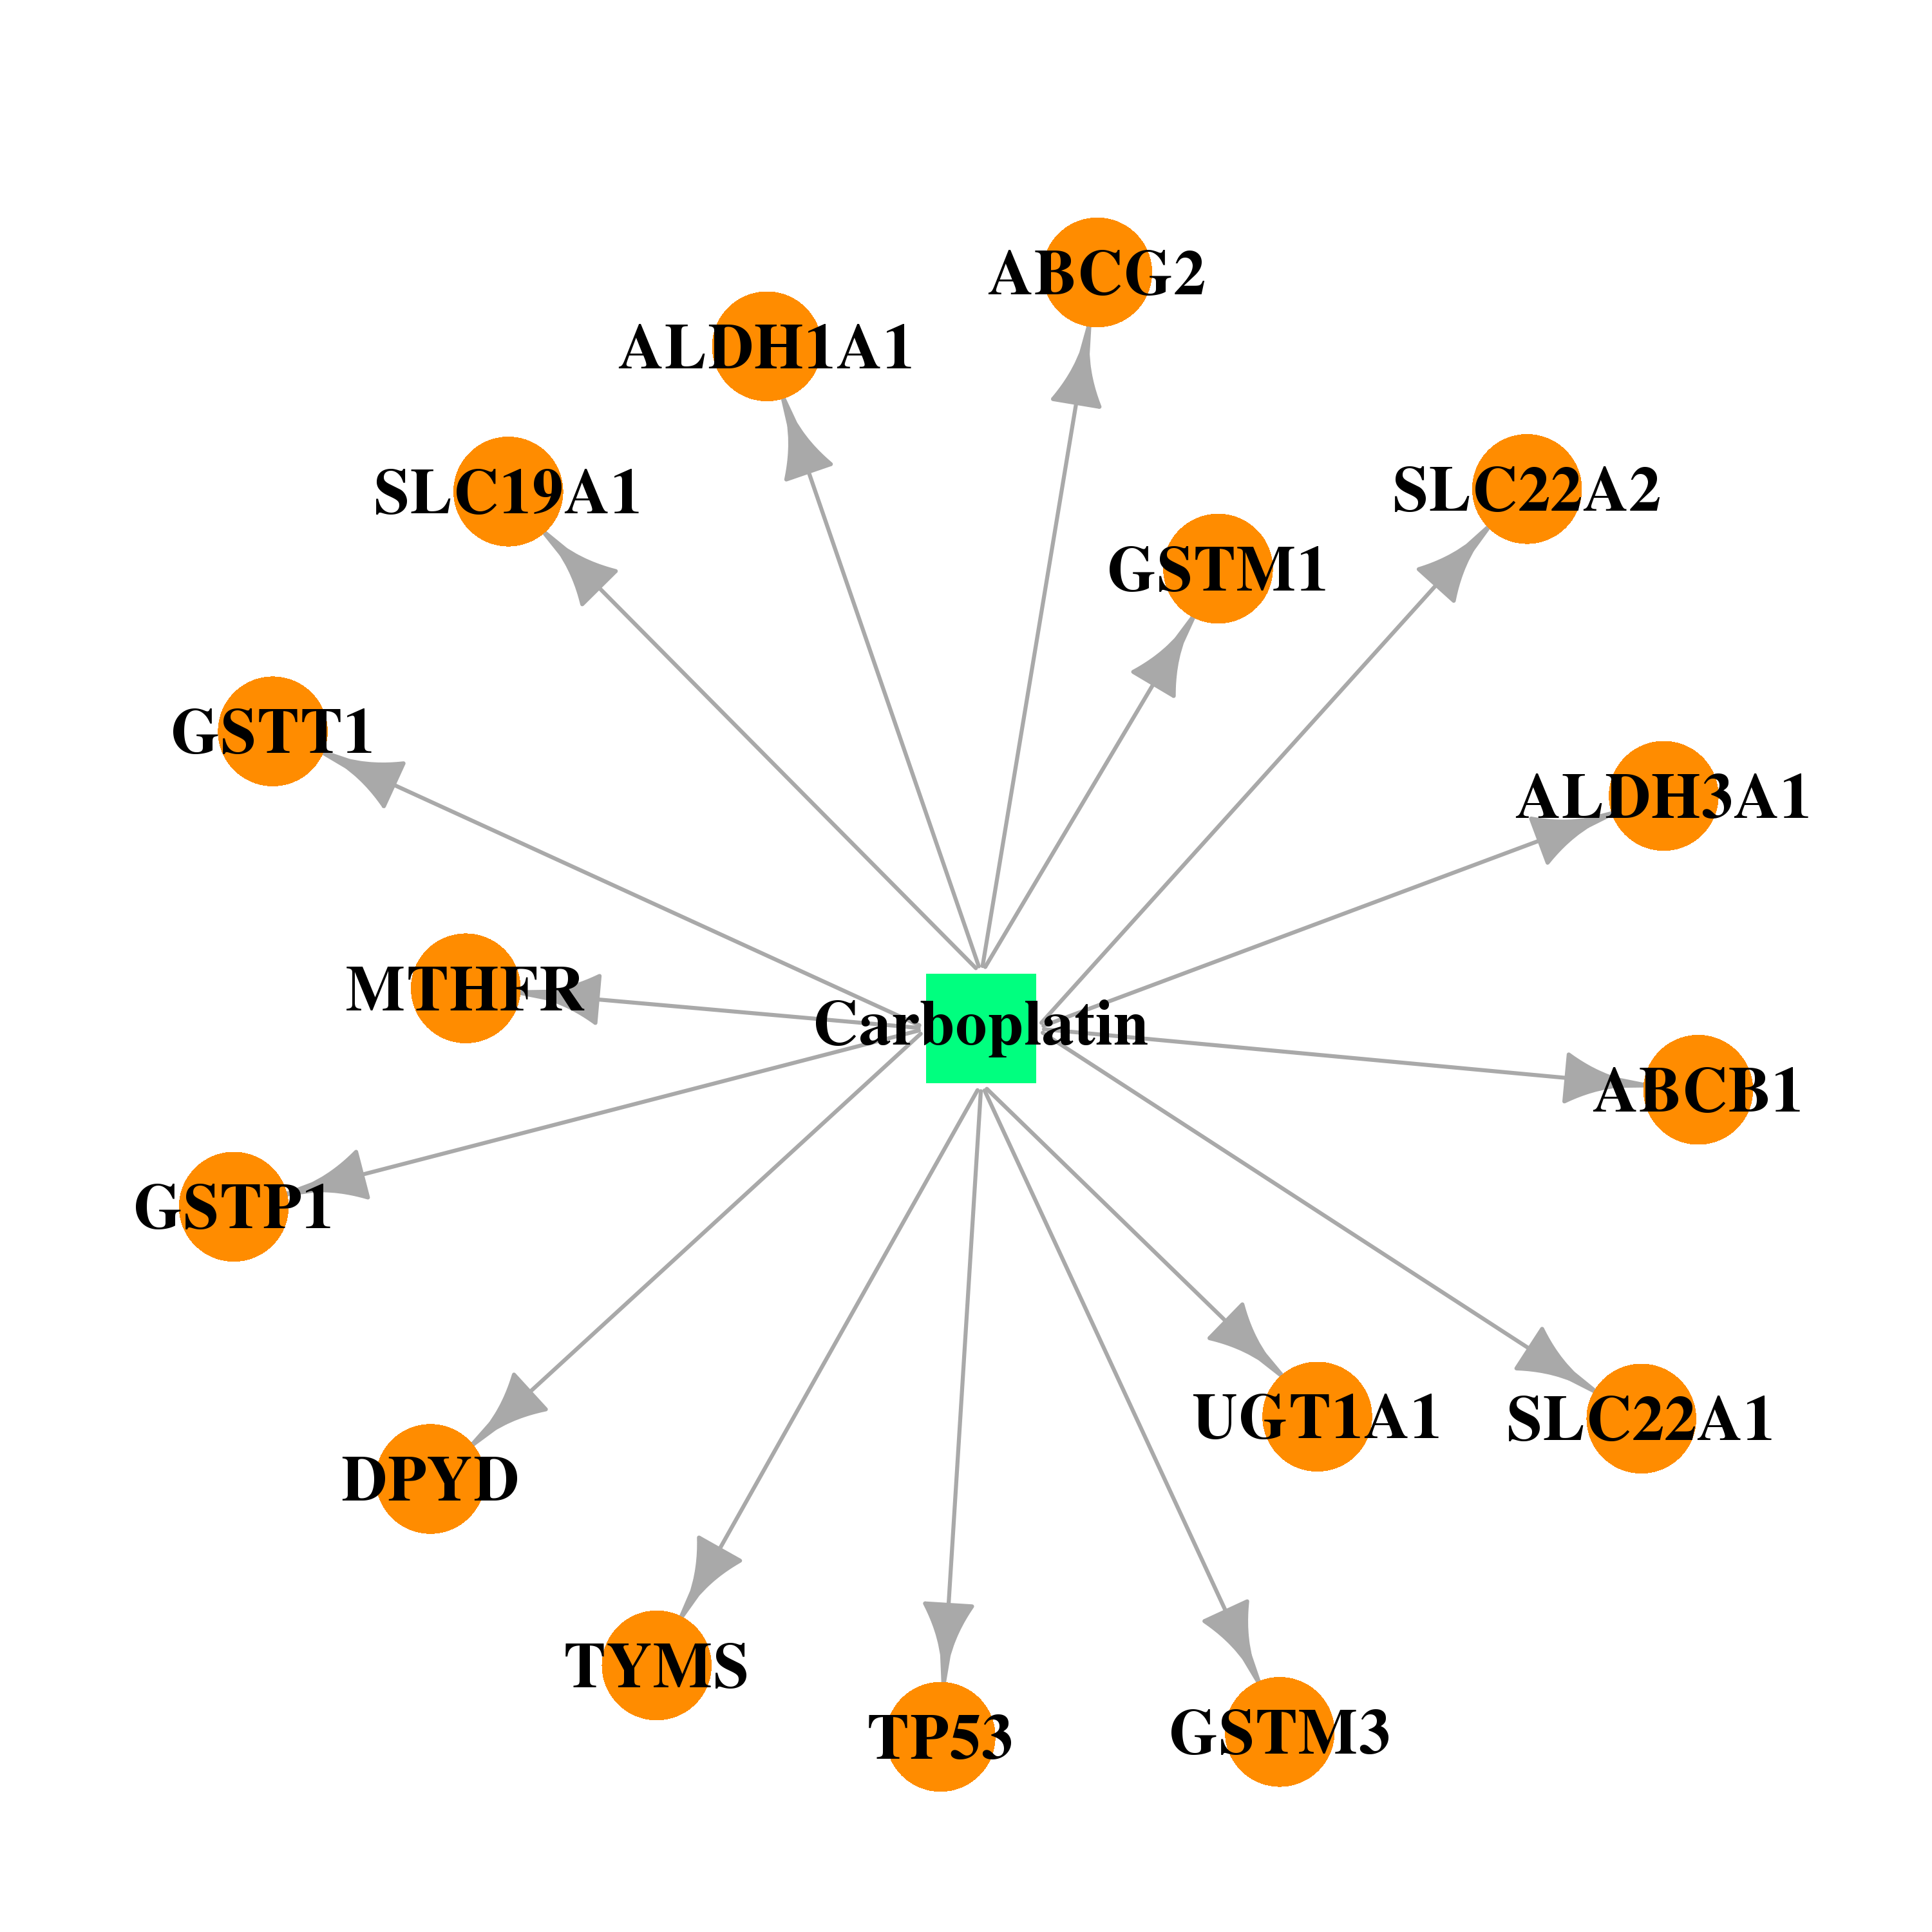 | 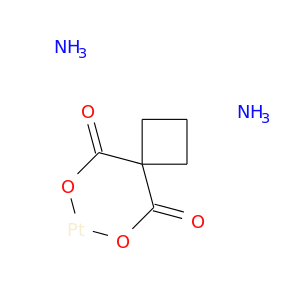 |
| DB00997 | glutathione S-transferase mu 3 (brain) | approved; investigational | Doxorubicin | 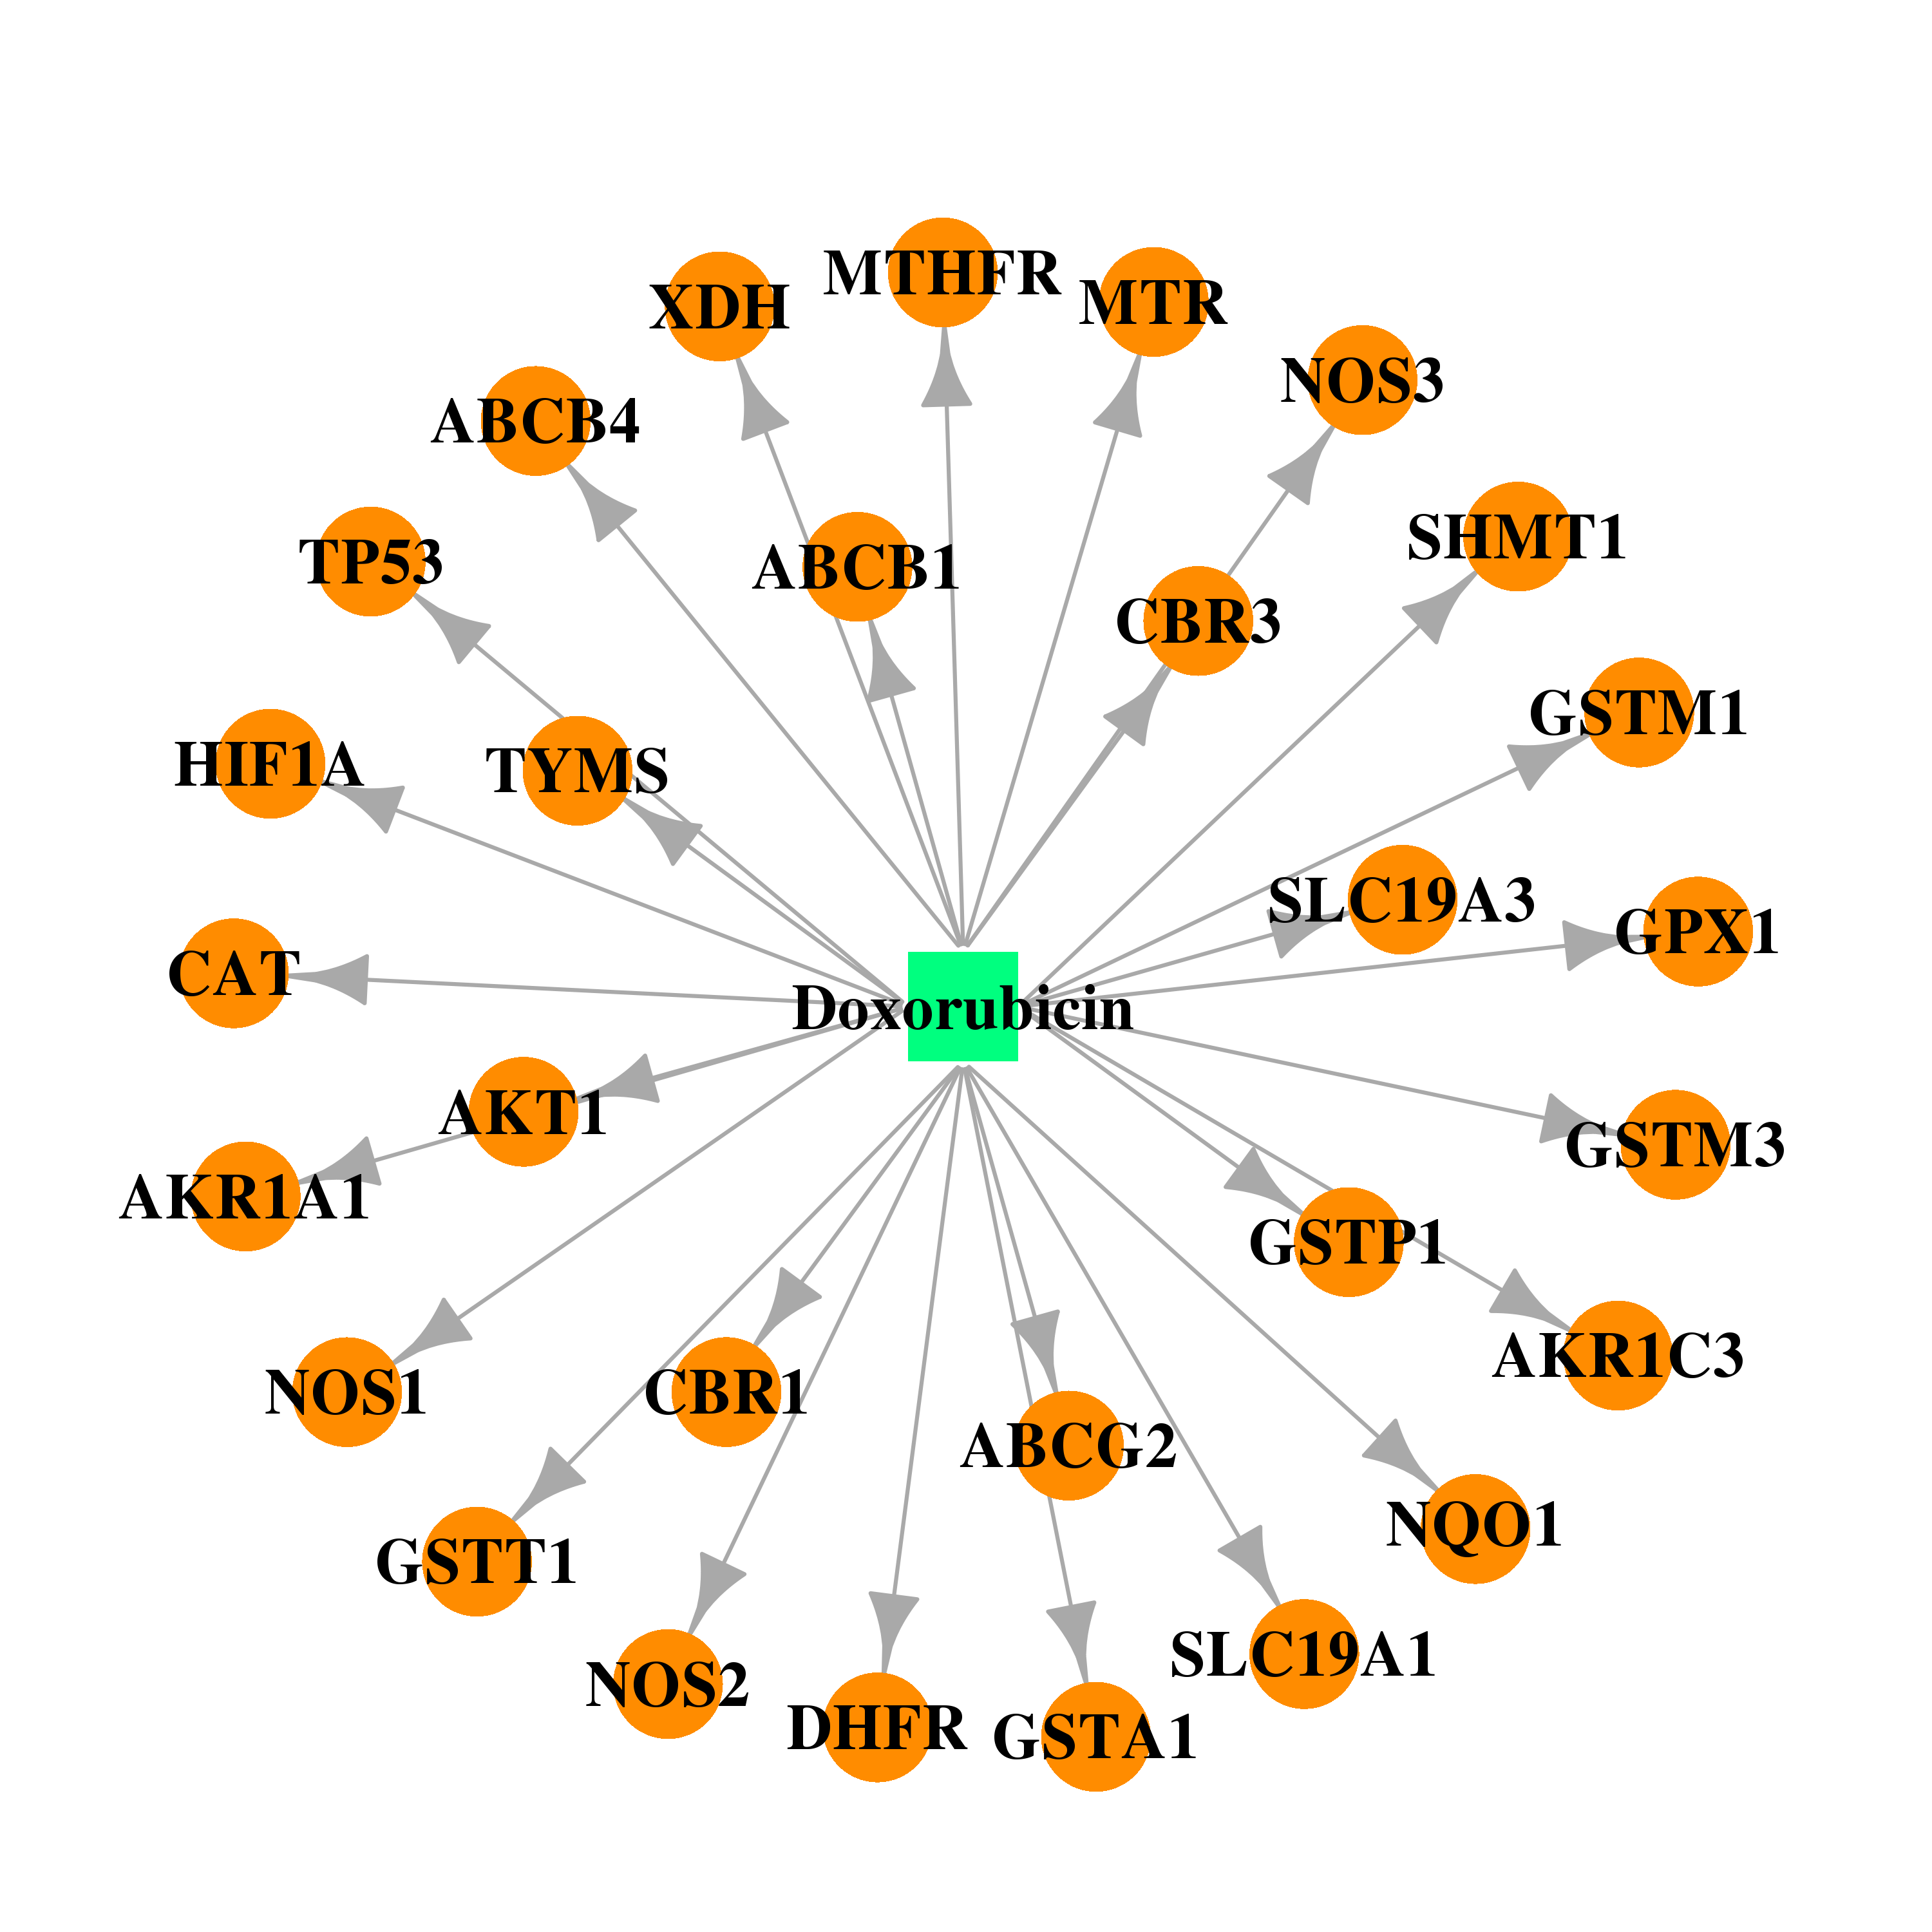 |  |
| DB01181 | glutathione S-transferase mu 3 (brain) | approved | Ifosfamide | 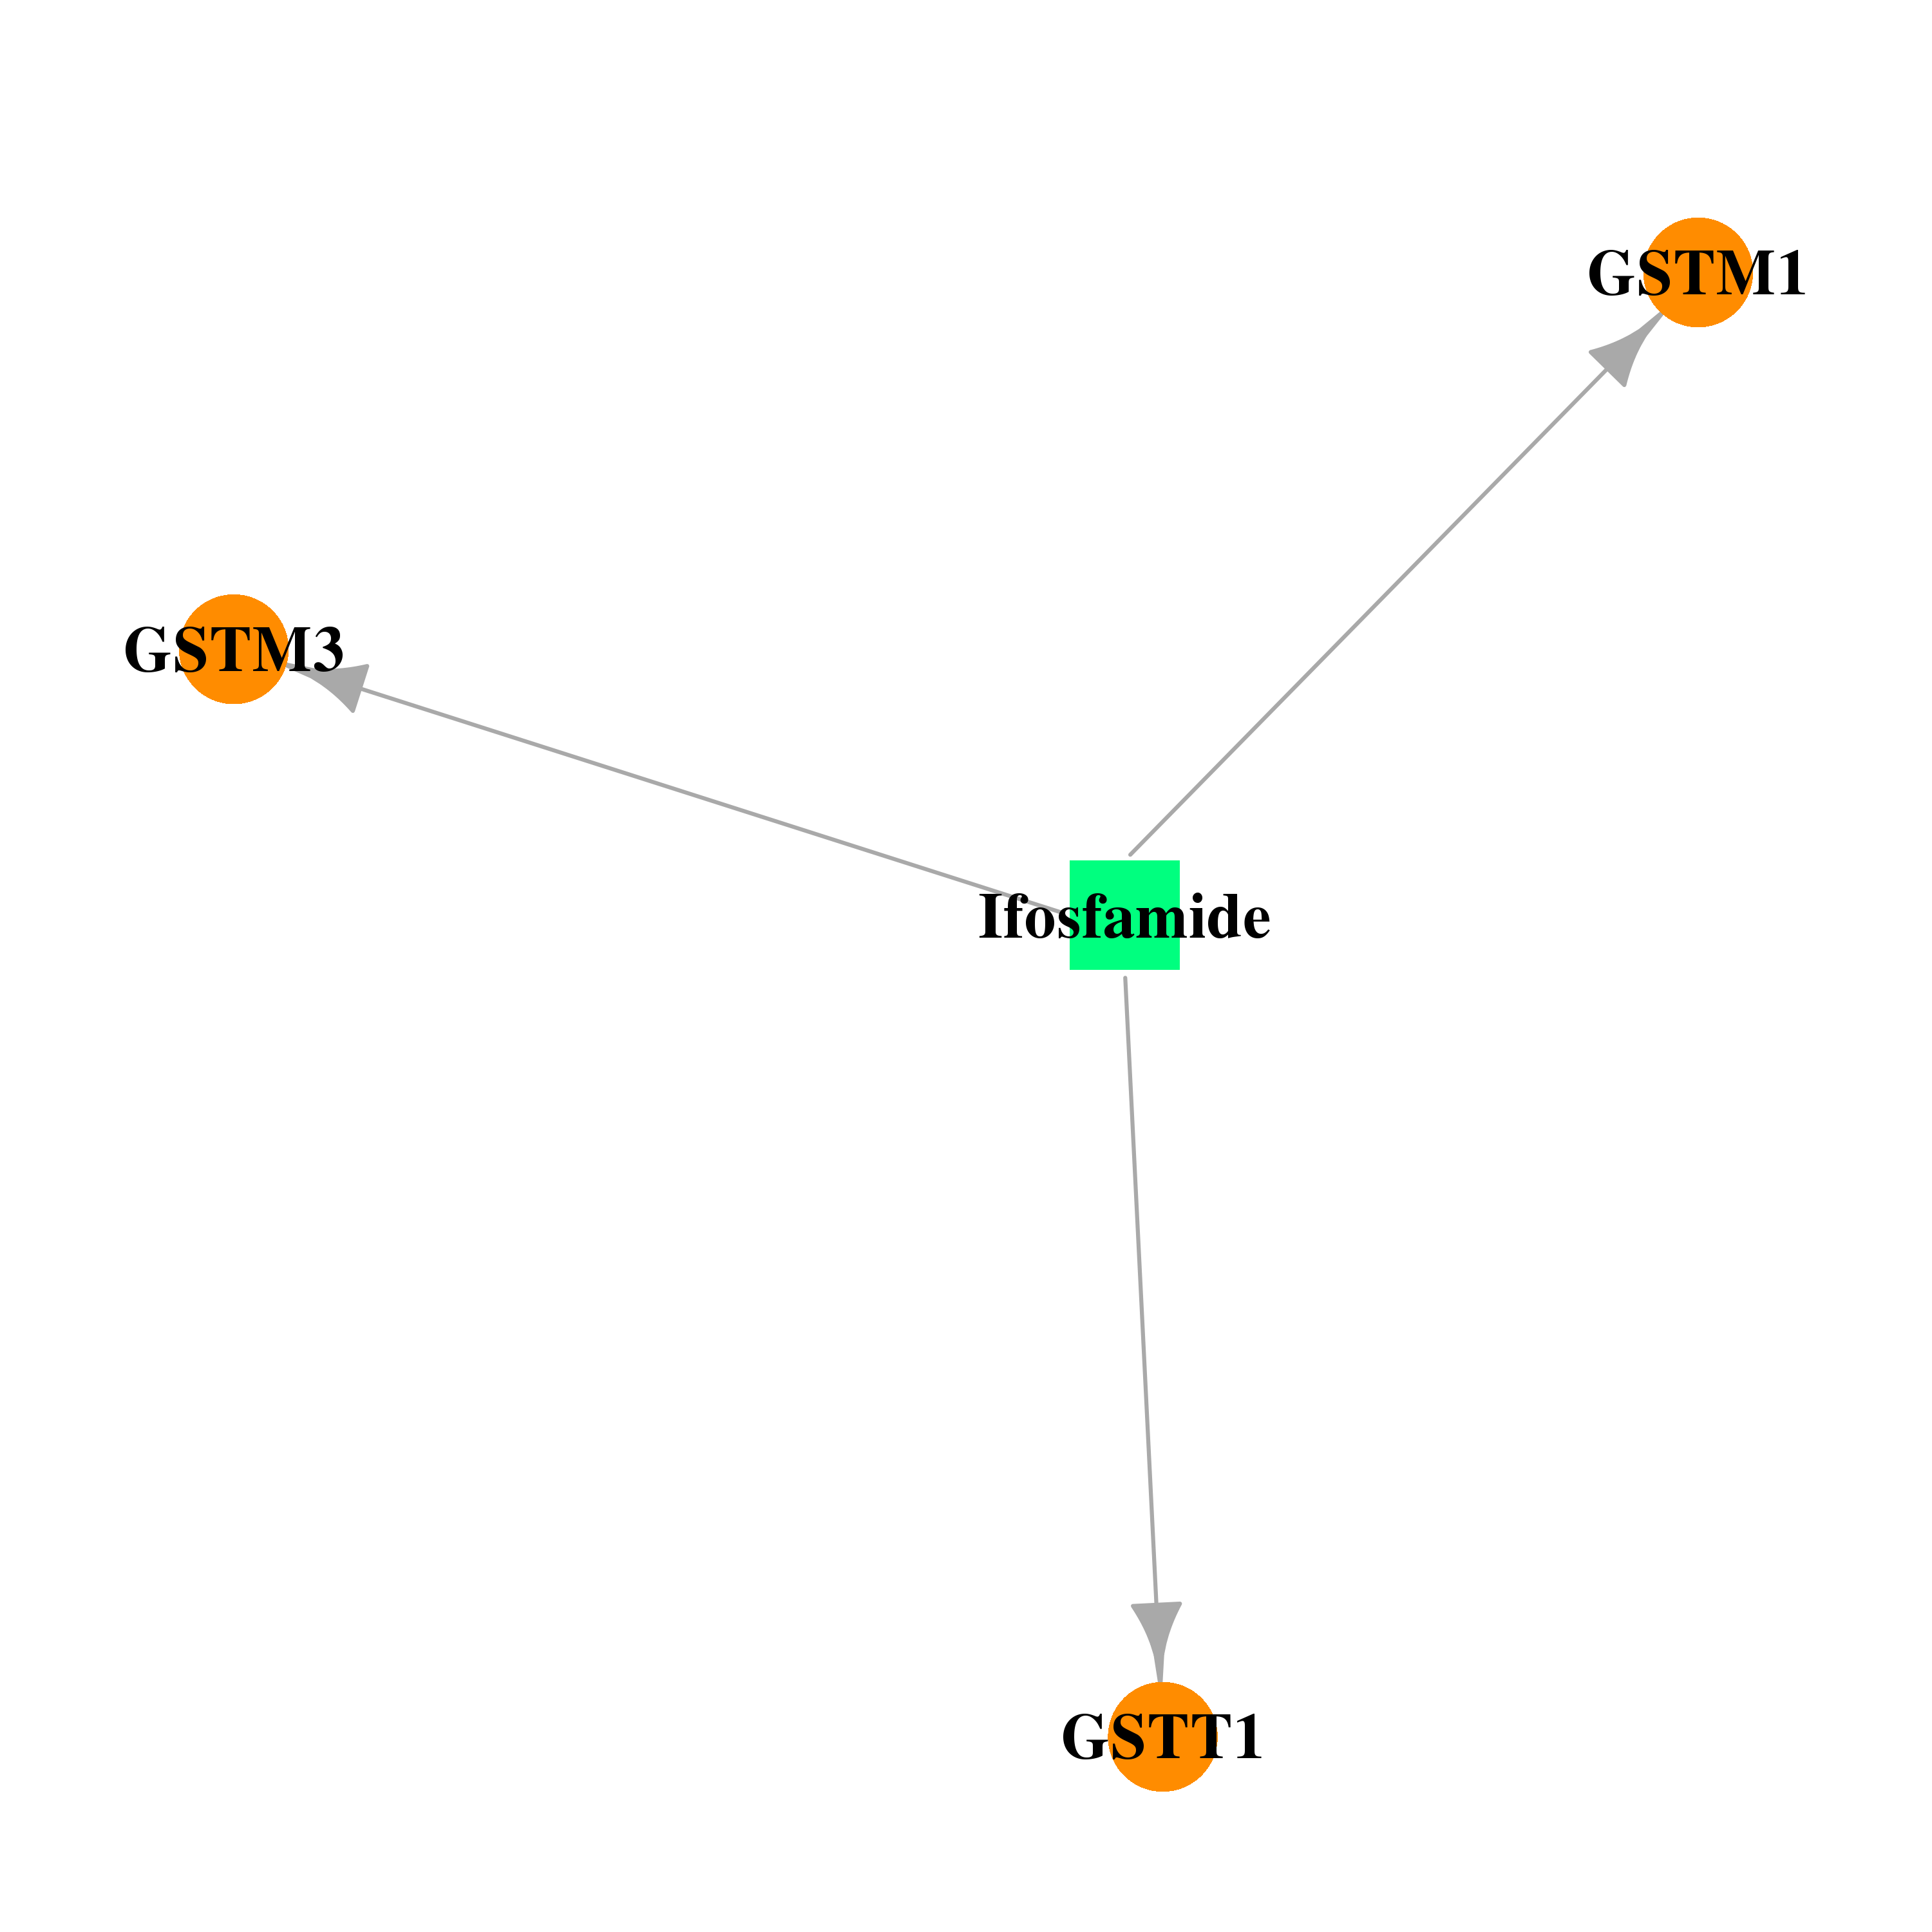 |  |
| DB00515 | glutathione S-transferase mu 3 (brain) | approved | Cisplatin |  |  |
| DB00531 | glutathione S-transferase mu 3 (brain) | approved; investigational | Cyclophosphamide | 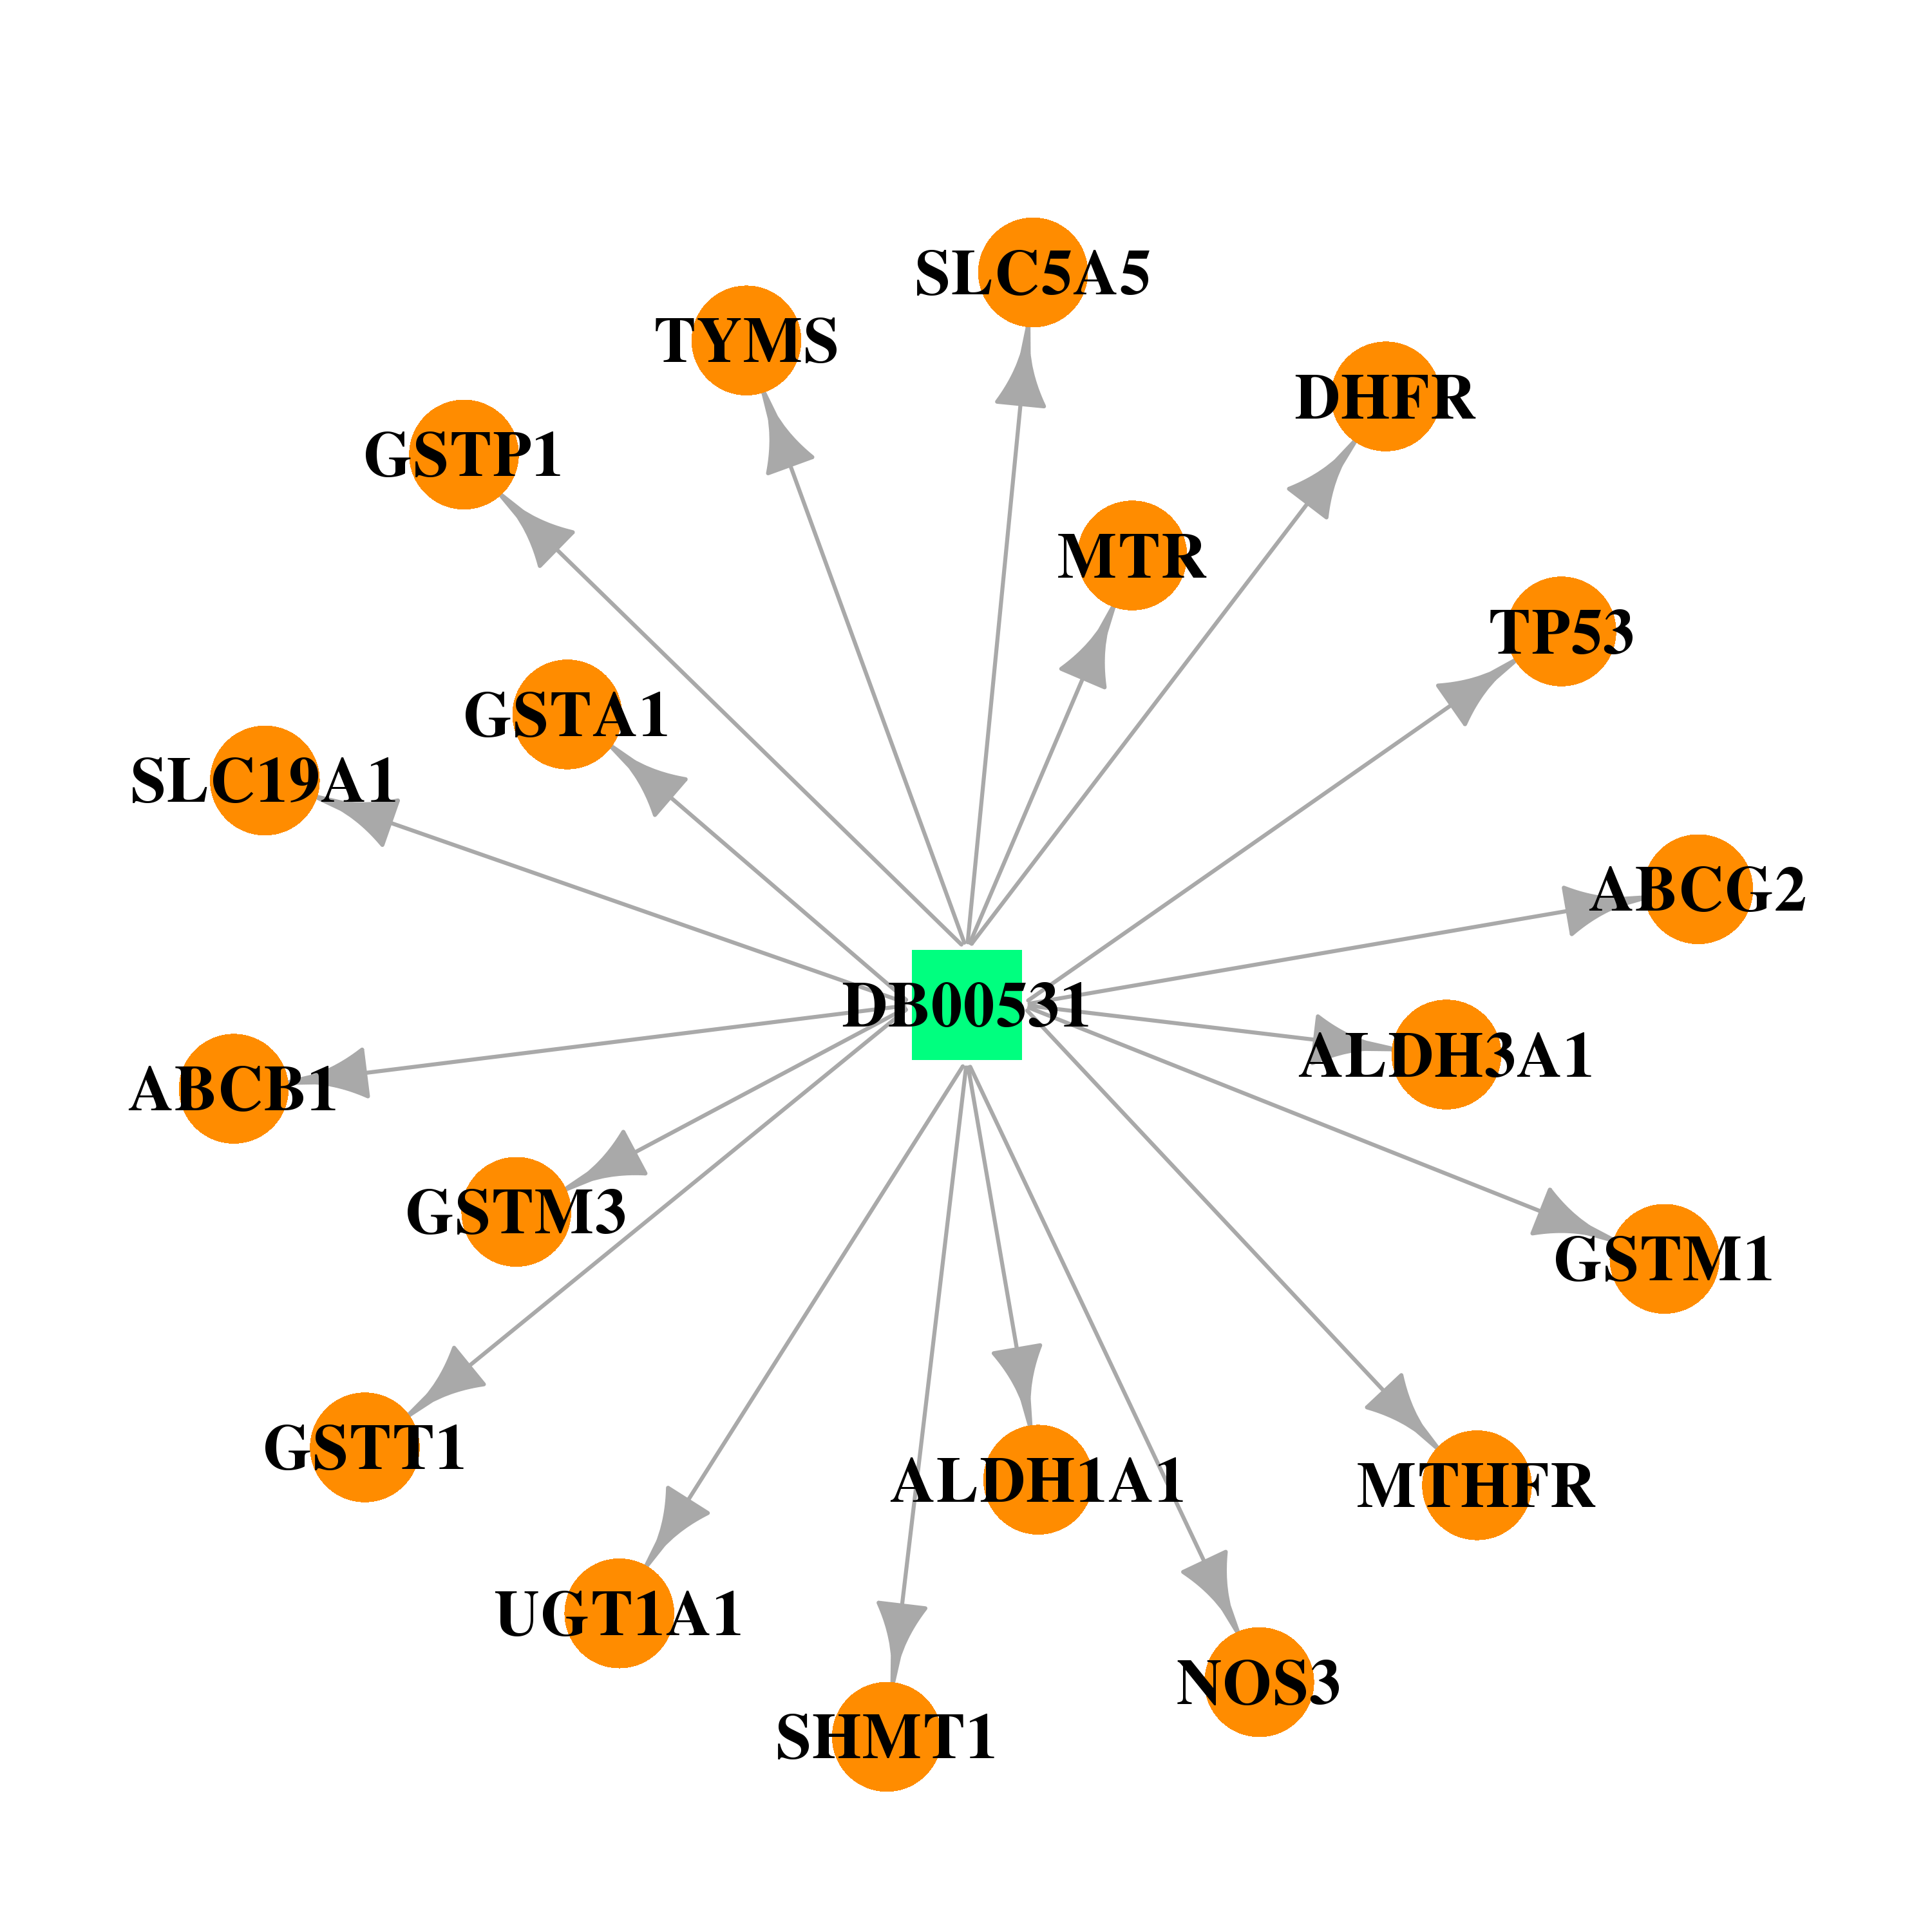 |  |
| Top |
| Cross referenced IDs for GSTM3 |
| * We obtained these cross-references from Uniprot database. It covers 150 different DBs, 18 categories. http://www.uniprot.org/help/cross_references_section |
: Open all cross reference information
|
Copyright © 2016-Present - The Univsersity of Texas Health Science Center at Houston @ |