|
||||||||||||||||||||||||||||||||||||||||||||||||||||||||||||||||||||||||||||||||||||||||||||||||||||||||||||||||||||||||||||||||||||||||||||||||||||||||||||||||||||||||||||||||||||||||||||||||||||||||||||||||||||||||||||||||||||||||||||||||||||||||||||||||||||||||||||||||||||||||||||||||||||||||||||||||||||||||||
| |
| Phenotypic Information (metabolism pathway, cancer, disease, phenome) |
| |
| |
| Gene-Gene Network Information: Co-Expression Network, Interacting Genes & KEGG |
| |
|


| Gene Summary for GUCY2C |
| Basic gene info. | Gene symbol | GUCY2C |
| Gene name | guanylate cyclase 2C | |
| Synonyms | DIAR6|GUC2C|MECIL|MUCIL|STAR | |
| Cytomap | UCSC genome browser: 12p12 | |
| Genomic location | chr12 :14765567-14849519 | |
| Type of gene | protein-coding | |
| RefGenes | NM_004963.3, | |
| Ensembl id | ENSG00000070019 | |
| Description | GC-CSTA receptorguanylate cyclase 2C (heat stable enterotoxin receptor)guanylyl cyclase ChSTARheat stable enterotoxin receptorheat-stable enterotoxin receptorintestinal guanylate cyclase | |
| Modification date | 20141220 | |
| dbXrefs | MIM : 601330 | |
| HGNC : HGNC | ||
| Ensembl : ENSG00000070019 | ||
| HPRD : 07529 | ||
| Vega : OTTHUMG00000168732 | ||
| Protein | UniProt: P25092 go to UniProt's Cross Reference DB Table | |
| Expression | CleanEX: HS_GUCY2C | |
| BioGPS: 2984 | ||
| Gene Expression Atlas: ENSG00000070019 | ||
| The Human Protein Atlas: ENSG00000070019 | ||
| Pathway | NCI Pathway Interaction Database: GUCY2C | |
| KEGG: GUCY2C | ||
| REACTOME: GUCY2C | ||
| ConsensusPathDB | ||
| Pathway Commons: GUCY2C | ||
| Metabolism | MetaCyc: GUCY2C | |
| HUMANCyc: GUCY2C | ||
| Regulation | Ensembl's Regulation: ENSG00000070019 | |
| miRBase: chr12 :14,765,567-14,849,519 | ||
| TargetScan: NM_004963 | ||
| cisRED: ENSG00000070019 | ||
| Context | iHOP: GUCY2C | |
| cancer metabolism search in PubMed: GUCY2C | ||
| UCL Cancer Institute: GUCY2C | ||
| Assigned class in ccmGDB | A - This gene has a literature evidence and it belongs to cancer gene. | |
| References showing role of GUCY2C in cancer cell metabolism | 1. Lin JE, Li P, Snook AE, Schulz S, Dasgupta A, et al. (2010) The hormone receptor GUCY2C suppresses intestinal tumor formation by inhibiting AKT signaling. Gastroenterology 138: 241-254. doi: 10.1053/j.gastro.2009.08.064. pmid: 2813361. go to article | |
| Top |
| Phenotypic Information for GUCY2C(metabolism pathway, cancer, disease, phenome) |
| Cancer | CGAP: GUCY2C |
| Familial Cancer Database: GUCY2C | |
| * This gene is included in those cancer gene databases. |
|
|
|
|
|
| . | ||||||||||||||||||||||||||||||||||||||||||||||||||||||||||||||||||||||||||||||||||||||||||||||||||||||||||||||||||||||||||||||||||||||||||||||||||||||||||||||||||||||||||||||||||||||||||||||||||||||||||||||||||||||||||||||||||||||||||||||||||||||||||||||||||||||||||||||||||||||||||||||||||||||||||||||||||||
Oncogene 1 | Significant driver gene in | |||||||||||||||||||||||||||||||||||||||||||||||||||||||||||||||||||||||||||||||||||||||||||||||||||||||||||||||||||||||||||||||||||||||||||||||||||||||||||||||||||||||||||||||||||||||||||||||||||||||||||||||||||||||||||||||||||||||||||||||||||||||||||||||||||||||||||||||||||||||||||||||||||||||||||||||||||||||||
| cf) number; DB name 1 Oncogene; http://nar.oxfordjournals.org/content/35/suppl_1/D721.long, 2 Tumor Suppressor gene; https://bioinfo.uth.edu/TSGene/, 3 Cancer Gene Census; http://www.nature.com/nrc/journal/v4/n3/abs/nrc1299.html, 4 CancerGenes; http://nar.oxfordjournals.org/content/35/suppl_1/D721.long, 5 Network of Cancer Gene; http://ncg.kcl.ac.uk/index.php, 1Therapeutic Vulnerabilities in Cancer; http://cbio.mskcc.org/cancergenomics/statius/ |
| KEGG_PURINE_METABOLISM | |
| OMIM | 601330; gene. 614616; phenotype. 614665; phenotype. |
| Orphanet | 314373; Chronic diarrhea due to guanylate cyclase 2C overactivity. 314376; Intestinal obstruction in the newborn due to guanylate cyclase 2C deficiency. |
| Disease | KEGG Disease: GUCY2C |
| MedGen: GUCY2C (Human Medical Genetics with Condition) | |
| ClinVar: GUCY2C | |
| Phenotype | MGI: GUCY2C (International Mouse Phenotyping Consortium) |
| PhenomicDB: GUCY2C | |
| Mutations for GUCY2C |
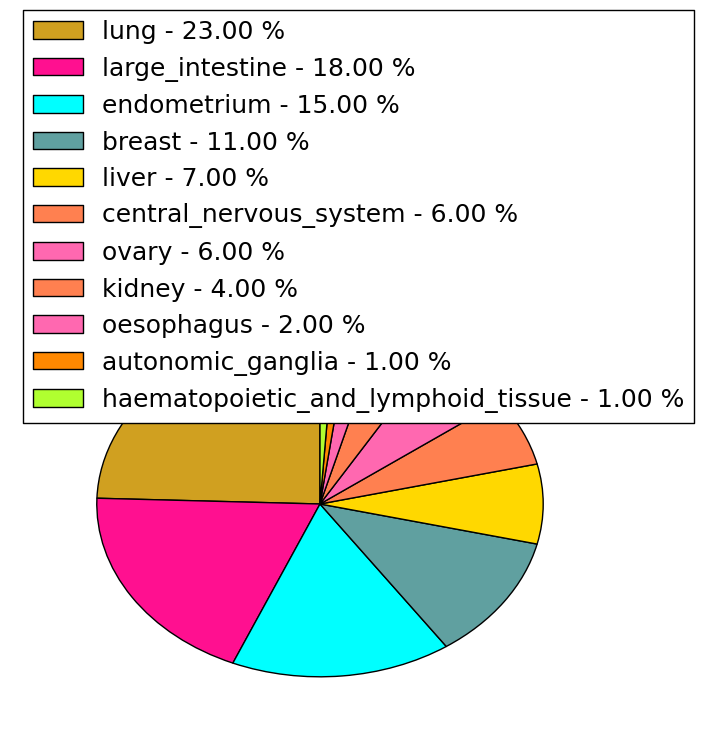
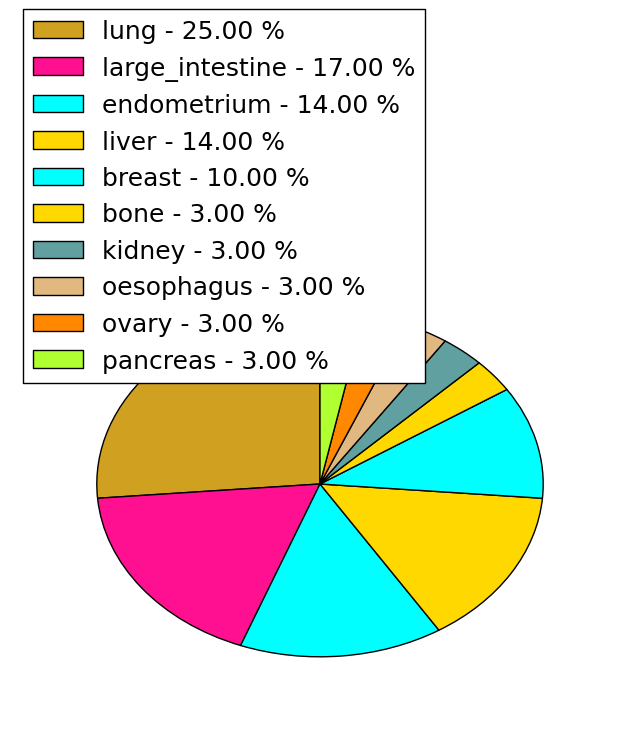
| * Under tables are showing count per each tissue to give us broad intuition about tissue specific mutation patterns.You can go to the detailed page for each mutation database's web site. |
| - Statistics for Tissue and Mutation type | Top |
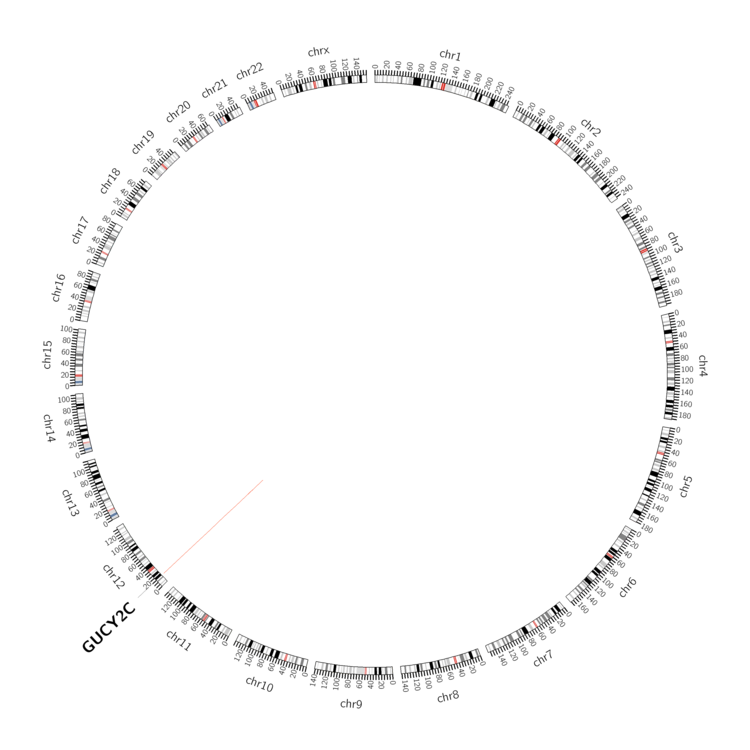 |
| - For Inter-chromosomal Variations |
| There's no inter-chromosomal structural variation. |
| - For Intra-chromosomal Variations |
| * Intra-chromosomal variantions includes 'intrachromosomal amplicon to amplicon', 'intrachromosomal amplicon to non-amplified dna', 'intrachromosomal deletion', 'intrachromosomal fold-back inversion', 'intrachromosomal inversion', 'intrachromosomal tandem duplication', 'Intrachromosomal unknown type', 'intrachromosomal with inverted orientation', 'intrachromosomal with non-inverted orientation'. |
 |
| Sample | Symbol_a | Chr_a | Start_a | End_a | Symbol_b | Chr_b | Start_b | End_b |
| ovary | GUCY2C | chr12 | 14785072 | 14785092 | GUCY2C | chr12 | 14787050 | 14787070 |
| ovary | GUCY2C | chr12 | 14824086 | 14824106 | GUCY2C | chr12 | 14825295 | 14825315 |
| cf) Tissue number; Tissue name (1;Breast, 2;Central_nervous_system, 3;Haematopoietic_and_lymphoid_tissue, 4;Large_intestine, 5;Liver, 6;Lung, 7;Ovary, 8;Pancreas, 9;Prostate, 10;Skin, 11;Soft_tissue, 12;Upper_aerodigestive_tract) |
| * From mRNA Sanger sequences, Chitars2.0 arranged chimeric transcripts. This table shows GUCY2C related fusion information. |
| ID | Head Gene | Tail Gene | Accession | Gene_a | qStart_a | qEnd_a | Chromosome_a | tStart_a | tEnd_a | Gene_a | qStart_a | qEnd_a | Chromosome_a | tStart_a | tEnd_a |
| Top |
| Mutation type/ Tissue ID | brca | cns | cerv | endome | haematopo | kidn | Lintest | liver | lung | ns | ovary | pancre | prost | skin | stoma | thyro | urina | |||
| Total # sample | 1 | 1 | ||||||||||||||||||
| GAIN (# sample) | 1 | |||||||||||||||||||
| LOSS (# sample) | 1 |
| cf) Tissue ID; Tissue type (1; Breast, 2; Central_nervous_system, 3; Cervix, 4; Endometrium, 5; Haematopoietic_and_lymphoid_tissue, 6; Kidney, 7; Large_intestine, 8; Liver, 9; Lung, 10; NS, 11; Ovary, 12; Pancreas, 13; Prostate, 14; Skin, 15; Stomach, 16; Thyroid, 17; Urinary_tract) |
| Top |
|
 |
| Top |
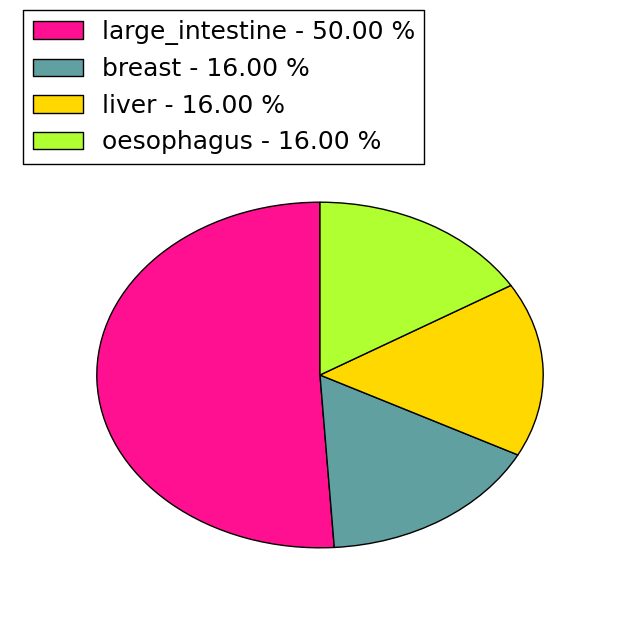
| Stat. for Non-Synonymous SNVs (# total SNVs=88) | (# total SNVs=28) |
 |  |
(# total SNVs=6) | (# total SNVs=1) |
 | 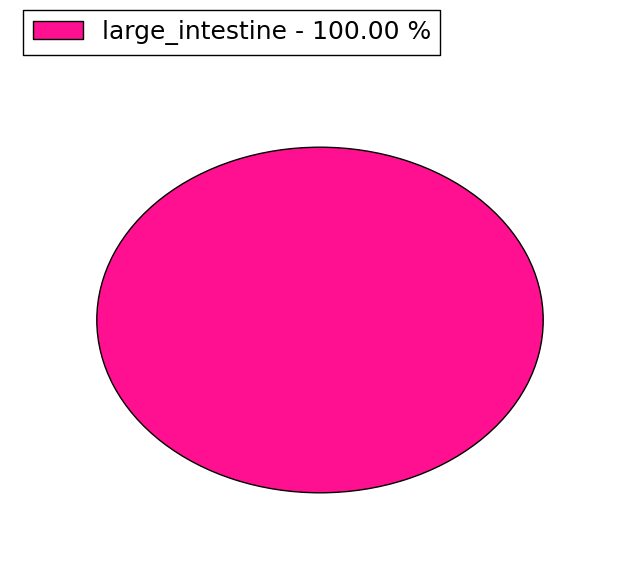 |
| Top |
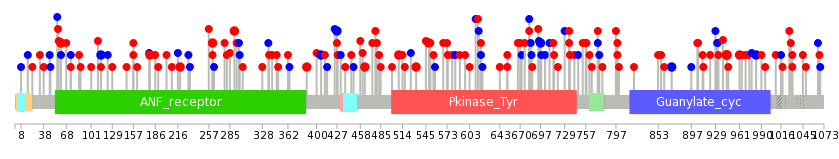
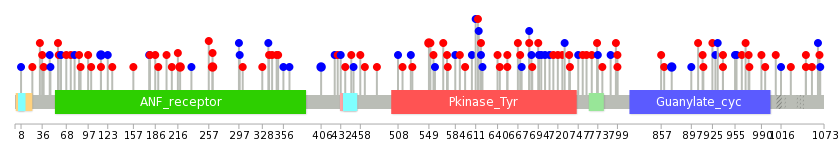
| * When you move the cursor on each content, you can see more deailed mutation information on the Tooltip. Those are primary_site,primary_histology,mutation(aa),pubmedID. |
| GRCh37 position | Mutation(aa) | Unique sampleID count |
| chr12:14827688-14827688 | p.R319* | 4 |
| chr12:14778829-14778829 | p.N757fs*8 | 4 |
| chr12:14832636-14832636 | p.R262Q | 3 |
| chr12:14772190-14772190 | p.G944R | 3 |
| chr12:14834281-14834281 | p.? | 3 |
| chr12:14778782-14778782 | p.R773* | 2 |
| chr12:14822720-14822720 | p.P406P | 2 |
| chr12:14805894-14805894 | p.D509N | 2 |
| chr12:14839148-14839148 | p.R114R | 2 |
| chr12:14773998-14773998 | p.W918* | 2 |
| Top |
|
 |
| Point Mutation/ Tissue ID | 1 | 2 | 3 | 4 | 5 | 6 | 7 | 8 | 9 | 10 | 11 | 12 | 13 | 14 | 15 | 16 | 17 | 18 | 19 | 20 |
| # sample | 3 | 7 | 1 | 14 | 1 | 6 | 3 | 2 | 1 | 11 | 9 | 4 | 38 | 7 | 1 | 14 | ||||
| # mutation | 3 | 7 | 1 | 14 | 1 | 6 | 3 | 2 | 1 | 12 | 9 | 4 | 46 | 11 | 1 | 16 | ||||
| nonsynonymous SNV | 3 | 4 | 1 | 9 | 4 | 3 | 1 | 1 | 9 | 5 | 3 | 26 | 7 | 13 | ||||||
| synonymous SNV | 3 | 5 | 1 | 2 | 1 | 3 | 4 | 1 | 20 | 4 | 1 | 3 |
| cf) Tissue ID; Tissue type (1; BLCA[Bladder Urothelial Carcinoma], 2; BRCA[Breast invasive carcinoma], 3; CESC[Cervical squamous cell carcinoma and endocervical adenocarcinoma], 4; COAD[Colon adenocarcinoma], 5; GBM[Glioblastoma multiforme], 6; Glioma Low Grade, 7; HNSC[Head and Neck squamous cell carcinoma], 8; KICH[Kidney Chromophobe], 9; KIRC[Kidney renal clear cell carcinoma], 10; KIRP[Kidney renal papillary cell carcinoma], 11; LAML[Acute Myeloid Leukemia], 12; LUAD[Lung adenocarcinoma], 13; LUSC[Lung squamous cell carcinoma], 14; OV[Ovarian serous cystadenocarcinoma ], 15; PAAD[Pancreatic adenocarcinoma], 16; PRAD[Prostate adenocarcinoma], 17; SKCM[Skin Cutaneous Melanoma], 18:STAD[Stomach adenocarcinoma], 19:THCA[Thyroid carcinoma], 20:UCEC[Uterine Corpus Endometrial Carcinoma]) |
| Top |
| * We represented just top 10 SNVs. When you move the cursor on each content, you can see more deailed mutation information on the Tooltip. Those are primary_site, primary_histology, mutation(aa), pubmedID. |
| Genomic Position | Mutation(aa) | Unique sampleID count |
| chr12:14832636 | p.R262L | 3 |
| chr12:14822720 | p.I871I | 2 |
| chr12:14834368 | p.E219K | 2 |
| chr12:14839148 | p.P406P | 2 |
| chr12:14804406 | p.G549C | 2 |
| chr12:14774139 | p.R114R | 2 |
| chr12:14840978 | p.R653H | 1 |
| chr12:14774971 | p.S568C | 1 |
| chr12:14796510 | p.G428S | 1 |
| chr12:14798208 | p.K990Q | 1 |
| * Copy number data were extracted from TCGA using R package TCGA-Assembler. The URLs of all public data files on TCGA DCC data server were gathered on Jan-05-2015. Function ProcessCNAData in TCGA-Assembler package was used to obtain gene-level copy number value which is calculated as the average copy number of the genomic region of a gene. |
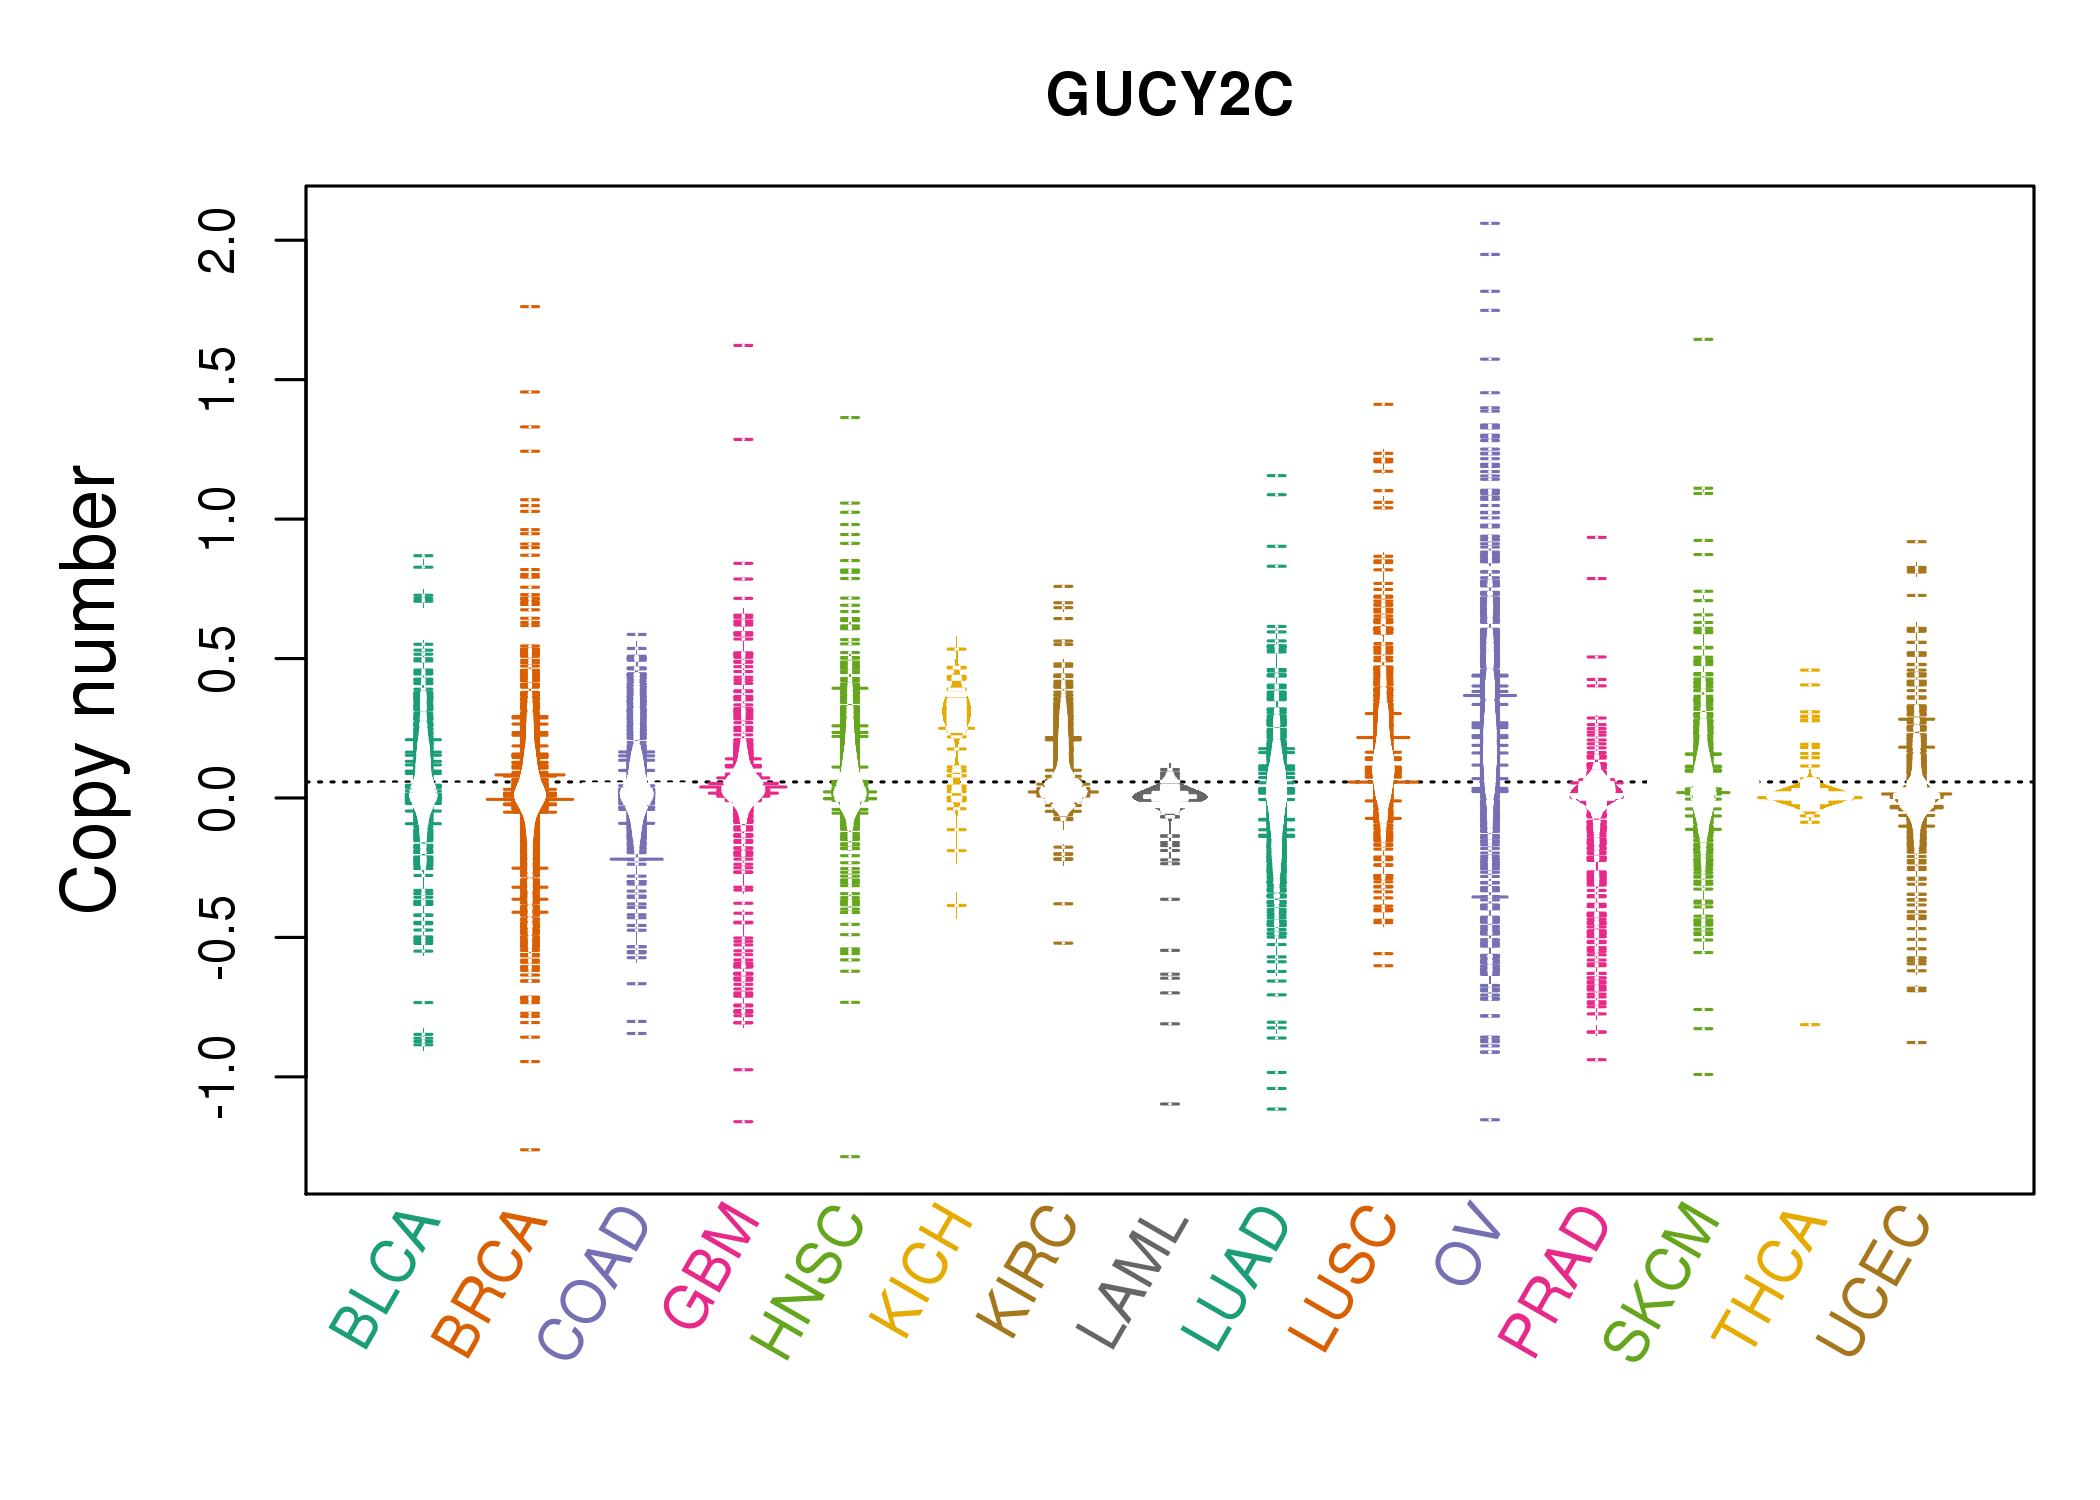 |
| cf) Tissue ID[Tissue type]: BLCA[Bladder Urothelial Carcinoma], BRCA[Breast invasive carcinoma], CESC[Cervical squamous cell carcinoma and endocervical adenocarcinoma], COAD[Colon adenocarcinoma], GBM[Glioblastoma multiforme], Glioma Low Grade, HNSC[Head and Neck squamous cell carcinoma], KICH[Kidney Chromophobe], KIRC[Kidney renal clear cell carcinoma], KIRP[Kidney renal papillary cell carcinoma], LAML[Acute Myeloid Leukemia], LUAD[Lung adenocarcinoma], LUSC[Lung squamous cell carcinoma], OV[Ovarian serous cystadenocarcinoma ], PAAD[Pancreatic adenocarcinoma], PRAD[Prostate adenocarcinoma], SKCM[Skin Cutaneous Melanoma], STAD[Stomach adenocarcinoma], THCA[Thyroid carcinoma], UCEC[Uterine Corpus Endometrial Carcinoma] |
| Top |
| Gene Expression for GUCY2C |
| * CCLE gene expression data were extracted from CCLE_Expression_Entrez_2012-10-18.res: Gene-centric RMA-normalized mRNA expression data. |
 |
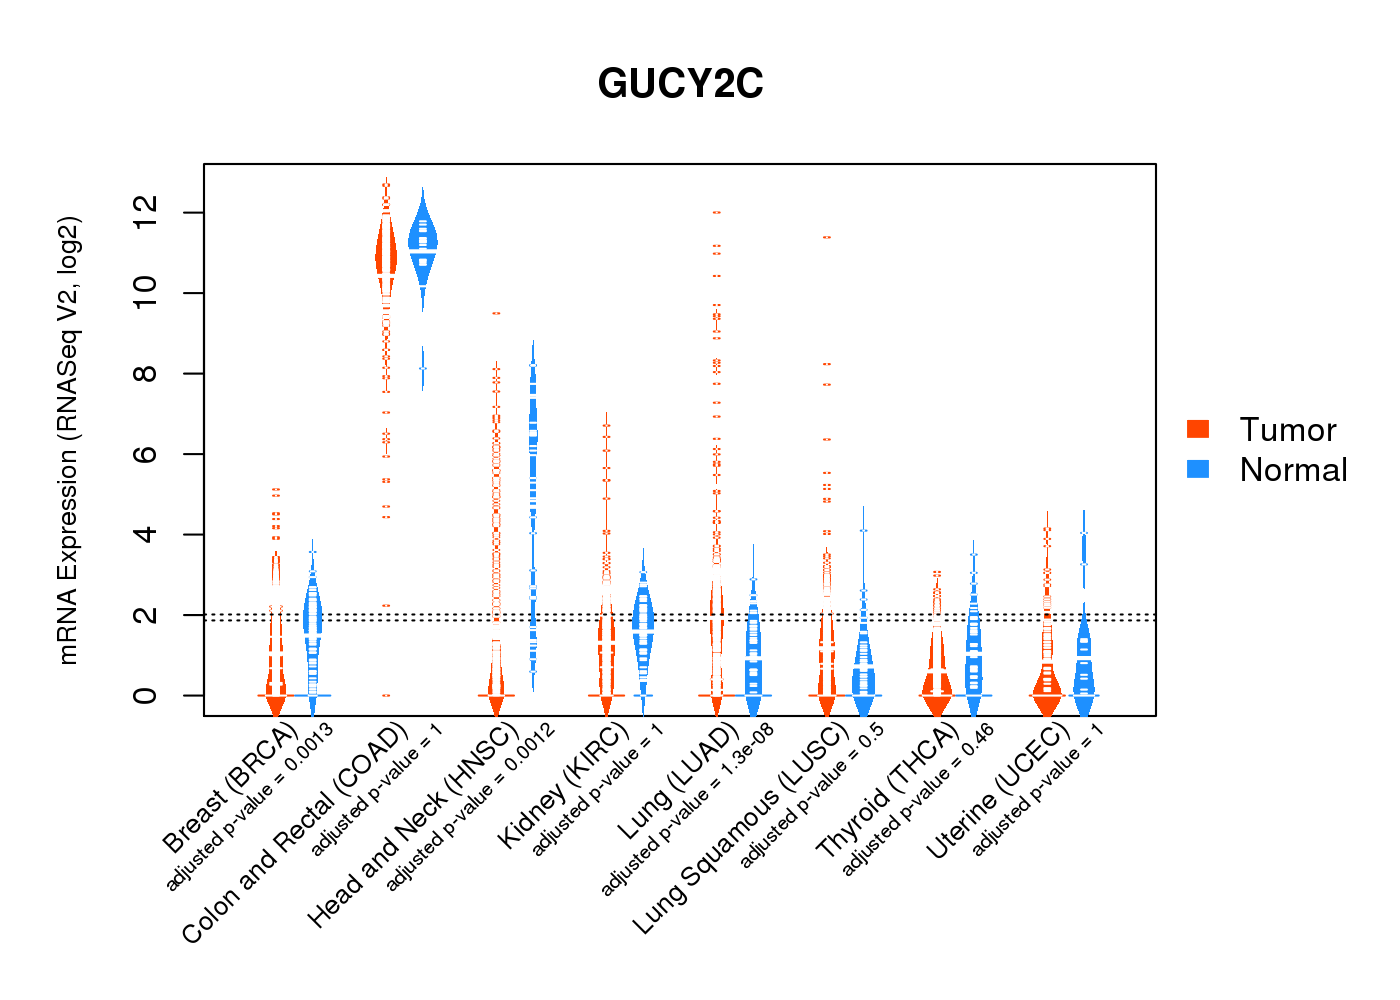
| * Normalized gene expression data of RNASeqV2 was extracted from TCGA using R package TCGA-Assembler. The URLs of all public data files on TCGA DCC data server were gathered at Jan-05-2015. Only eight cancer types have enough normal control samples for differential expression analysis. (t test, adjusted p<0.05 (using Benjamini-Hochberg FDR)) |
 |
| Top |
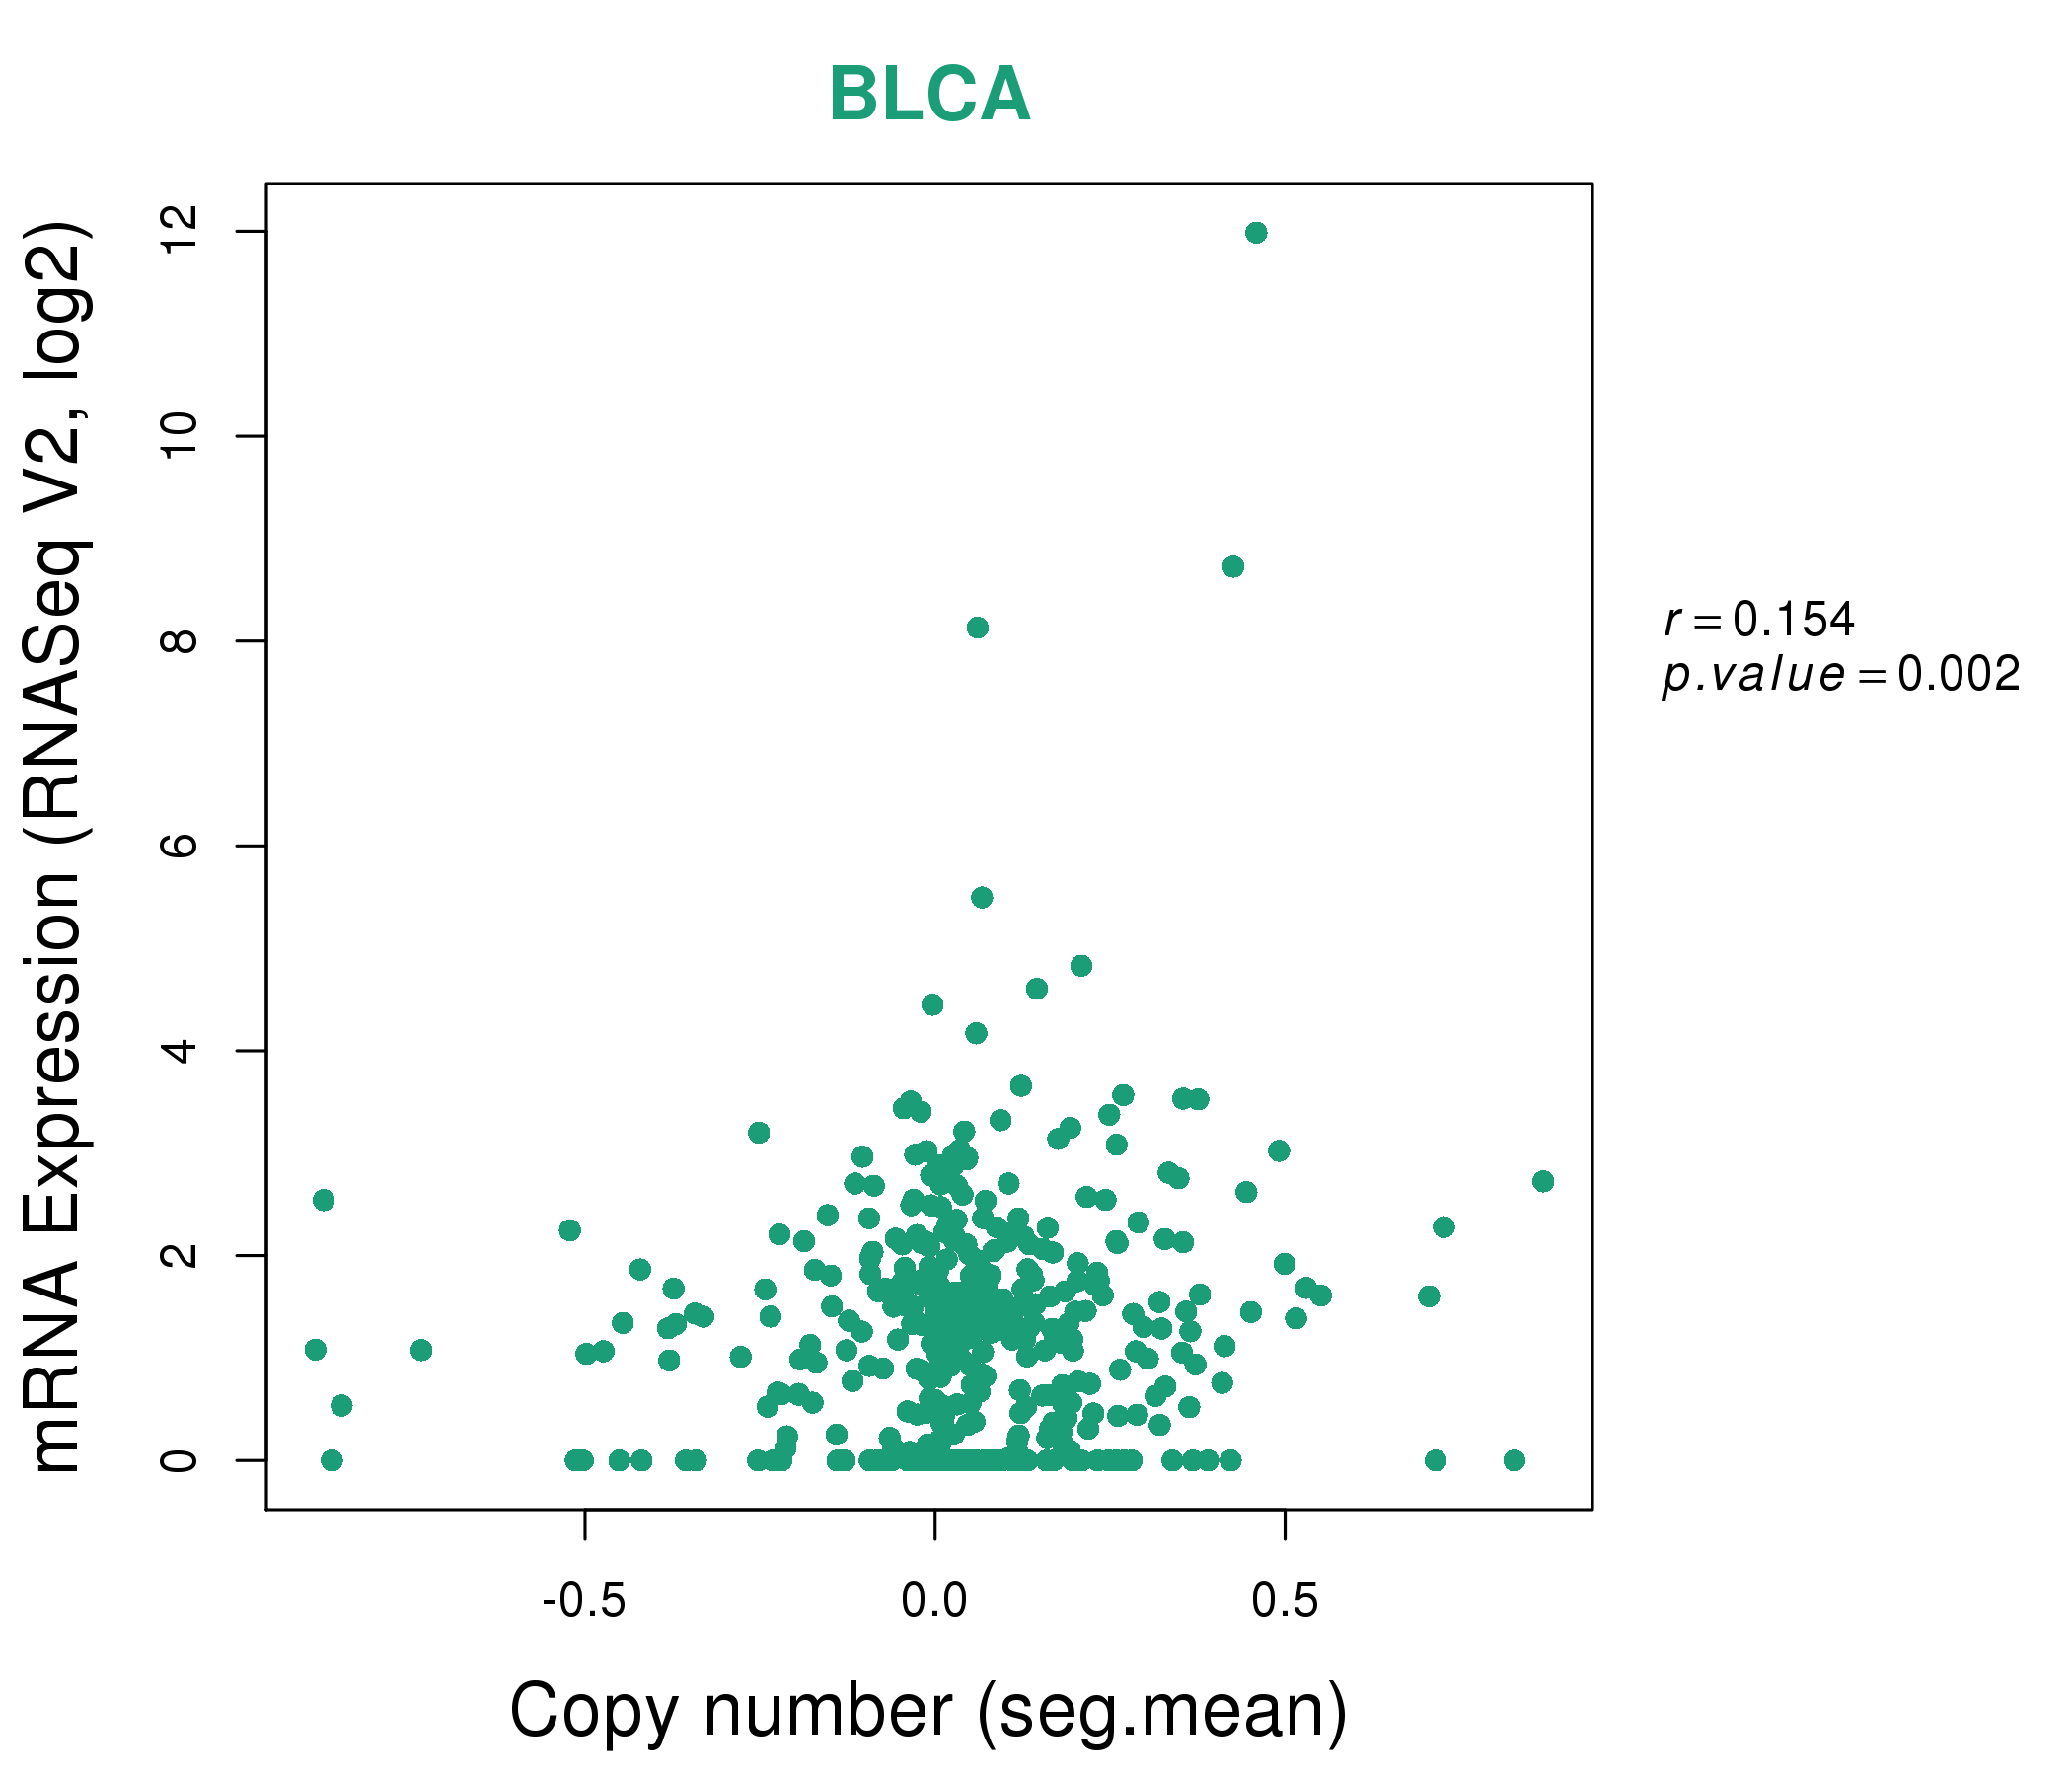
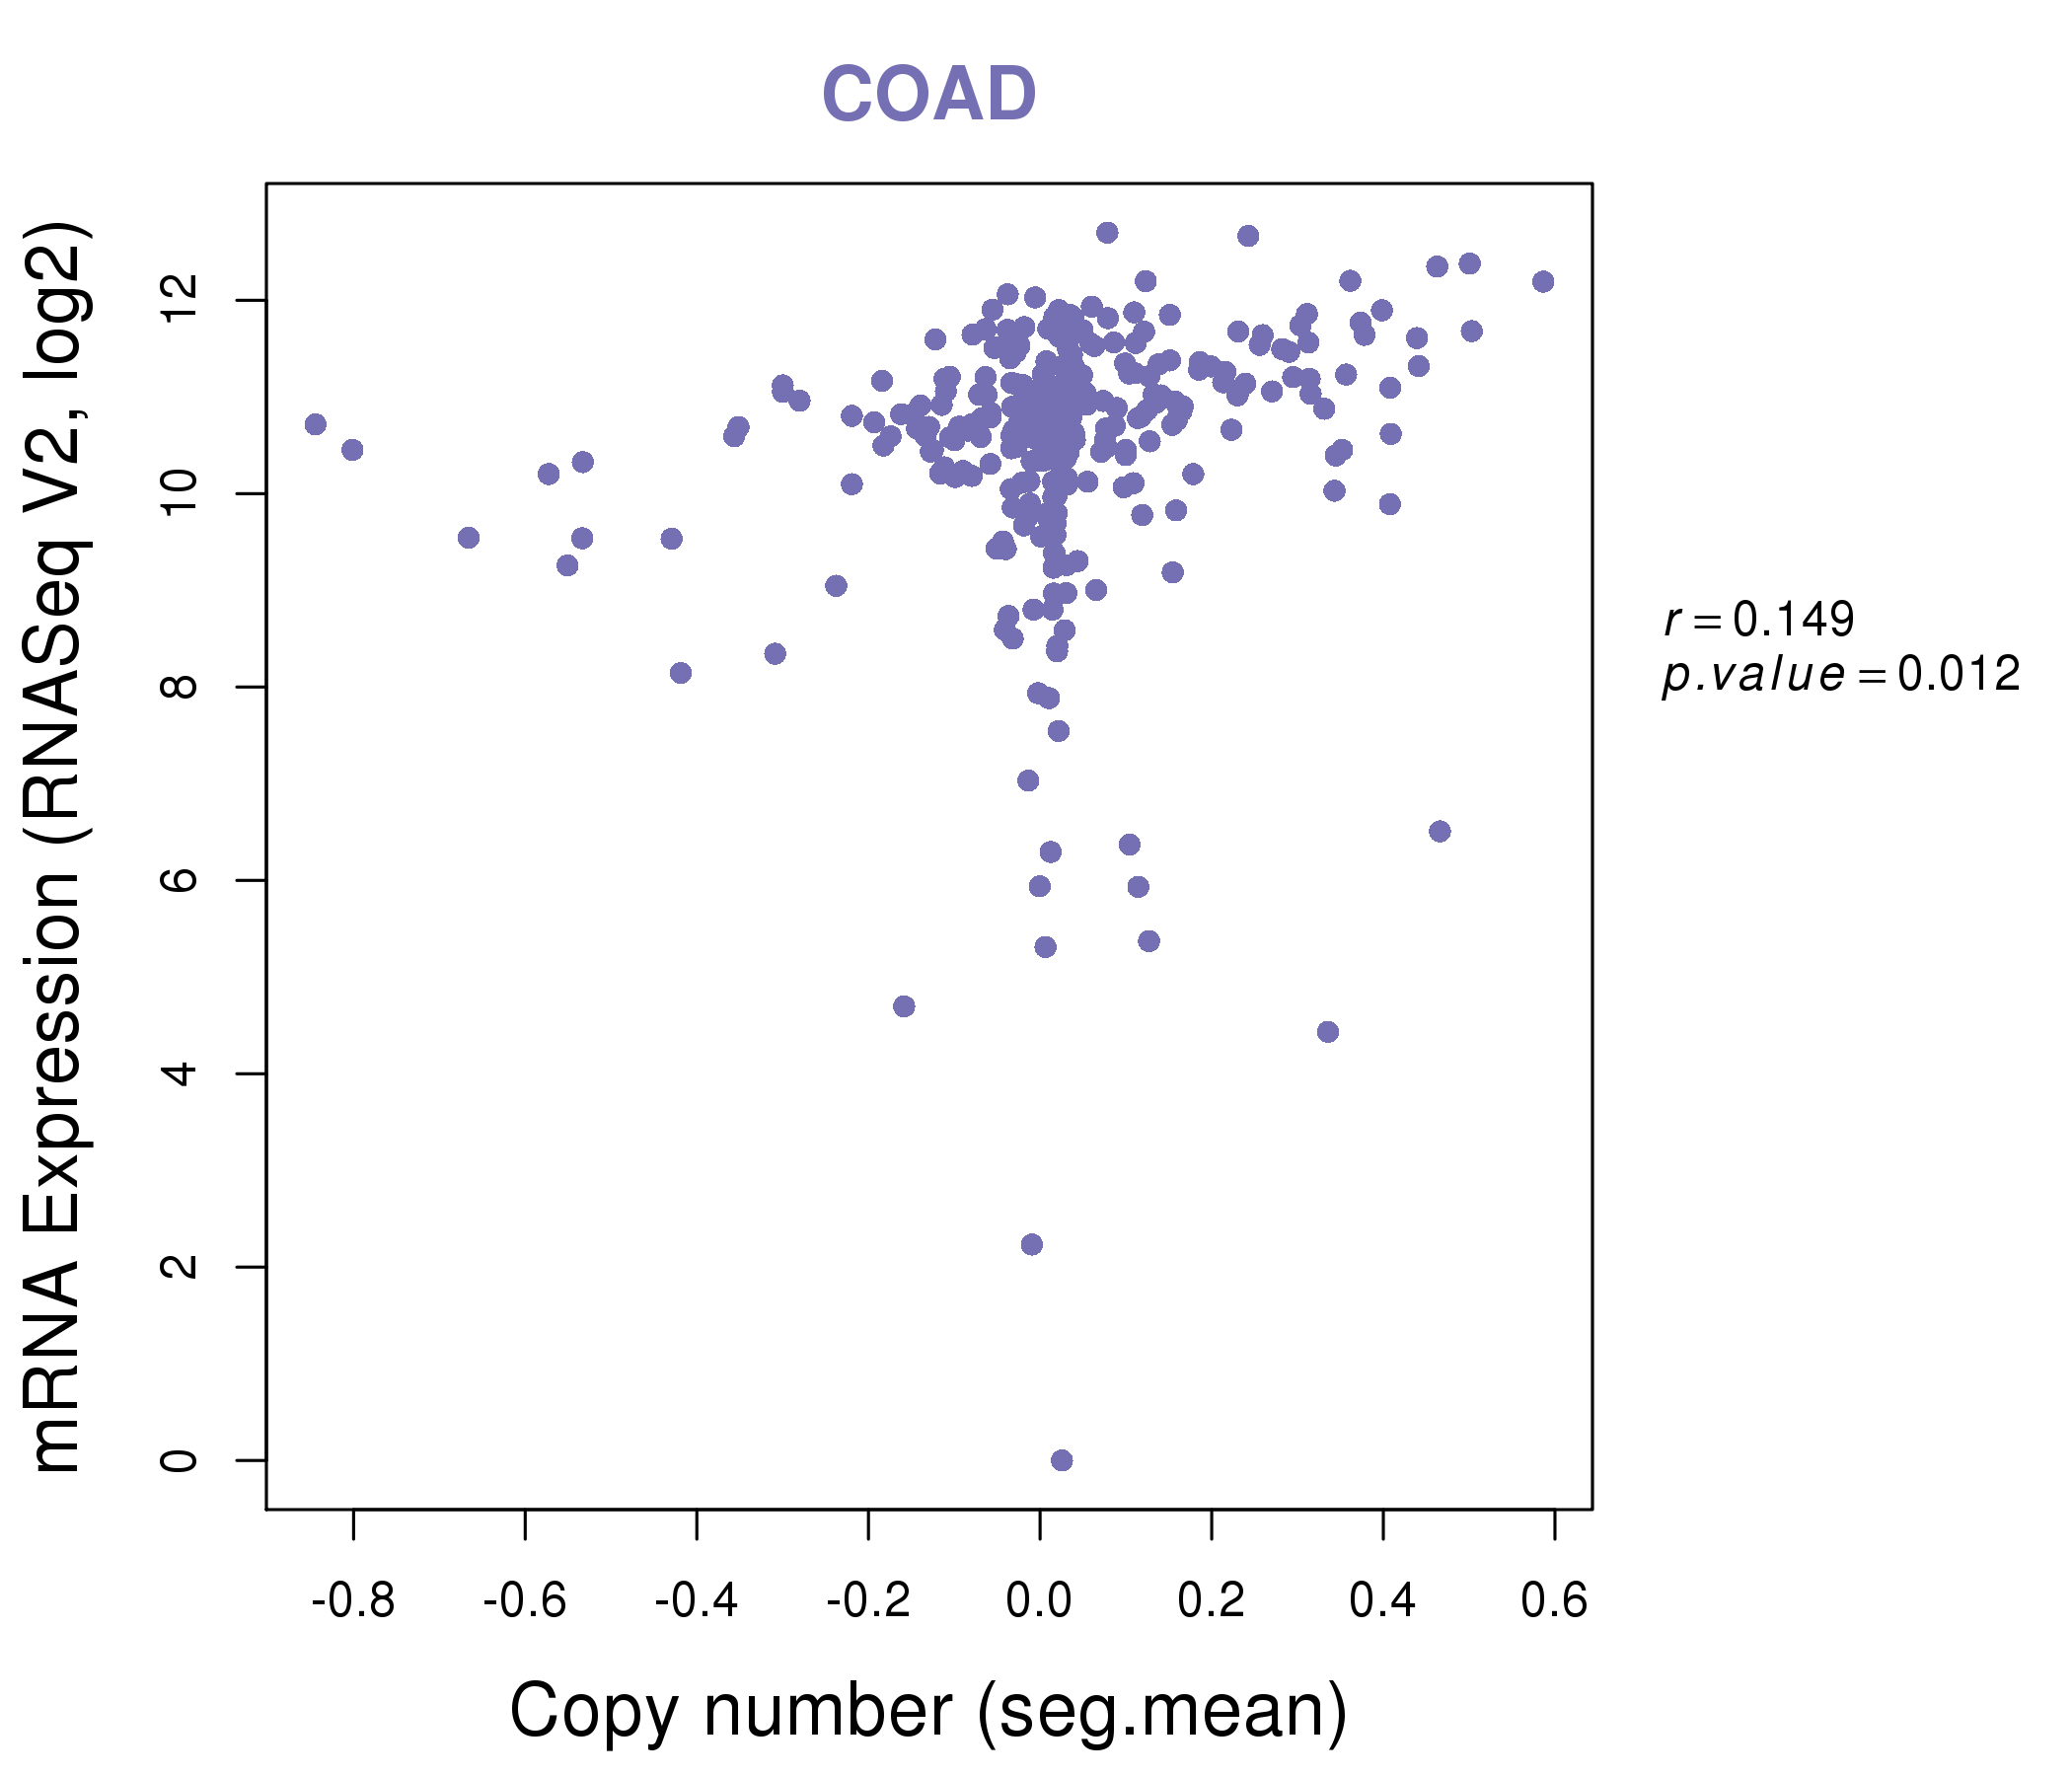
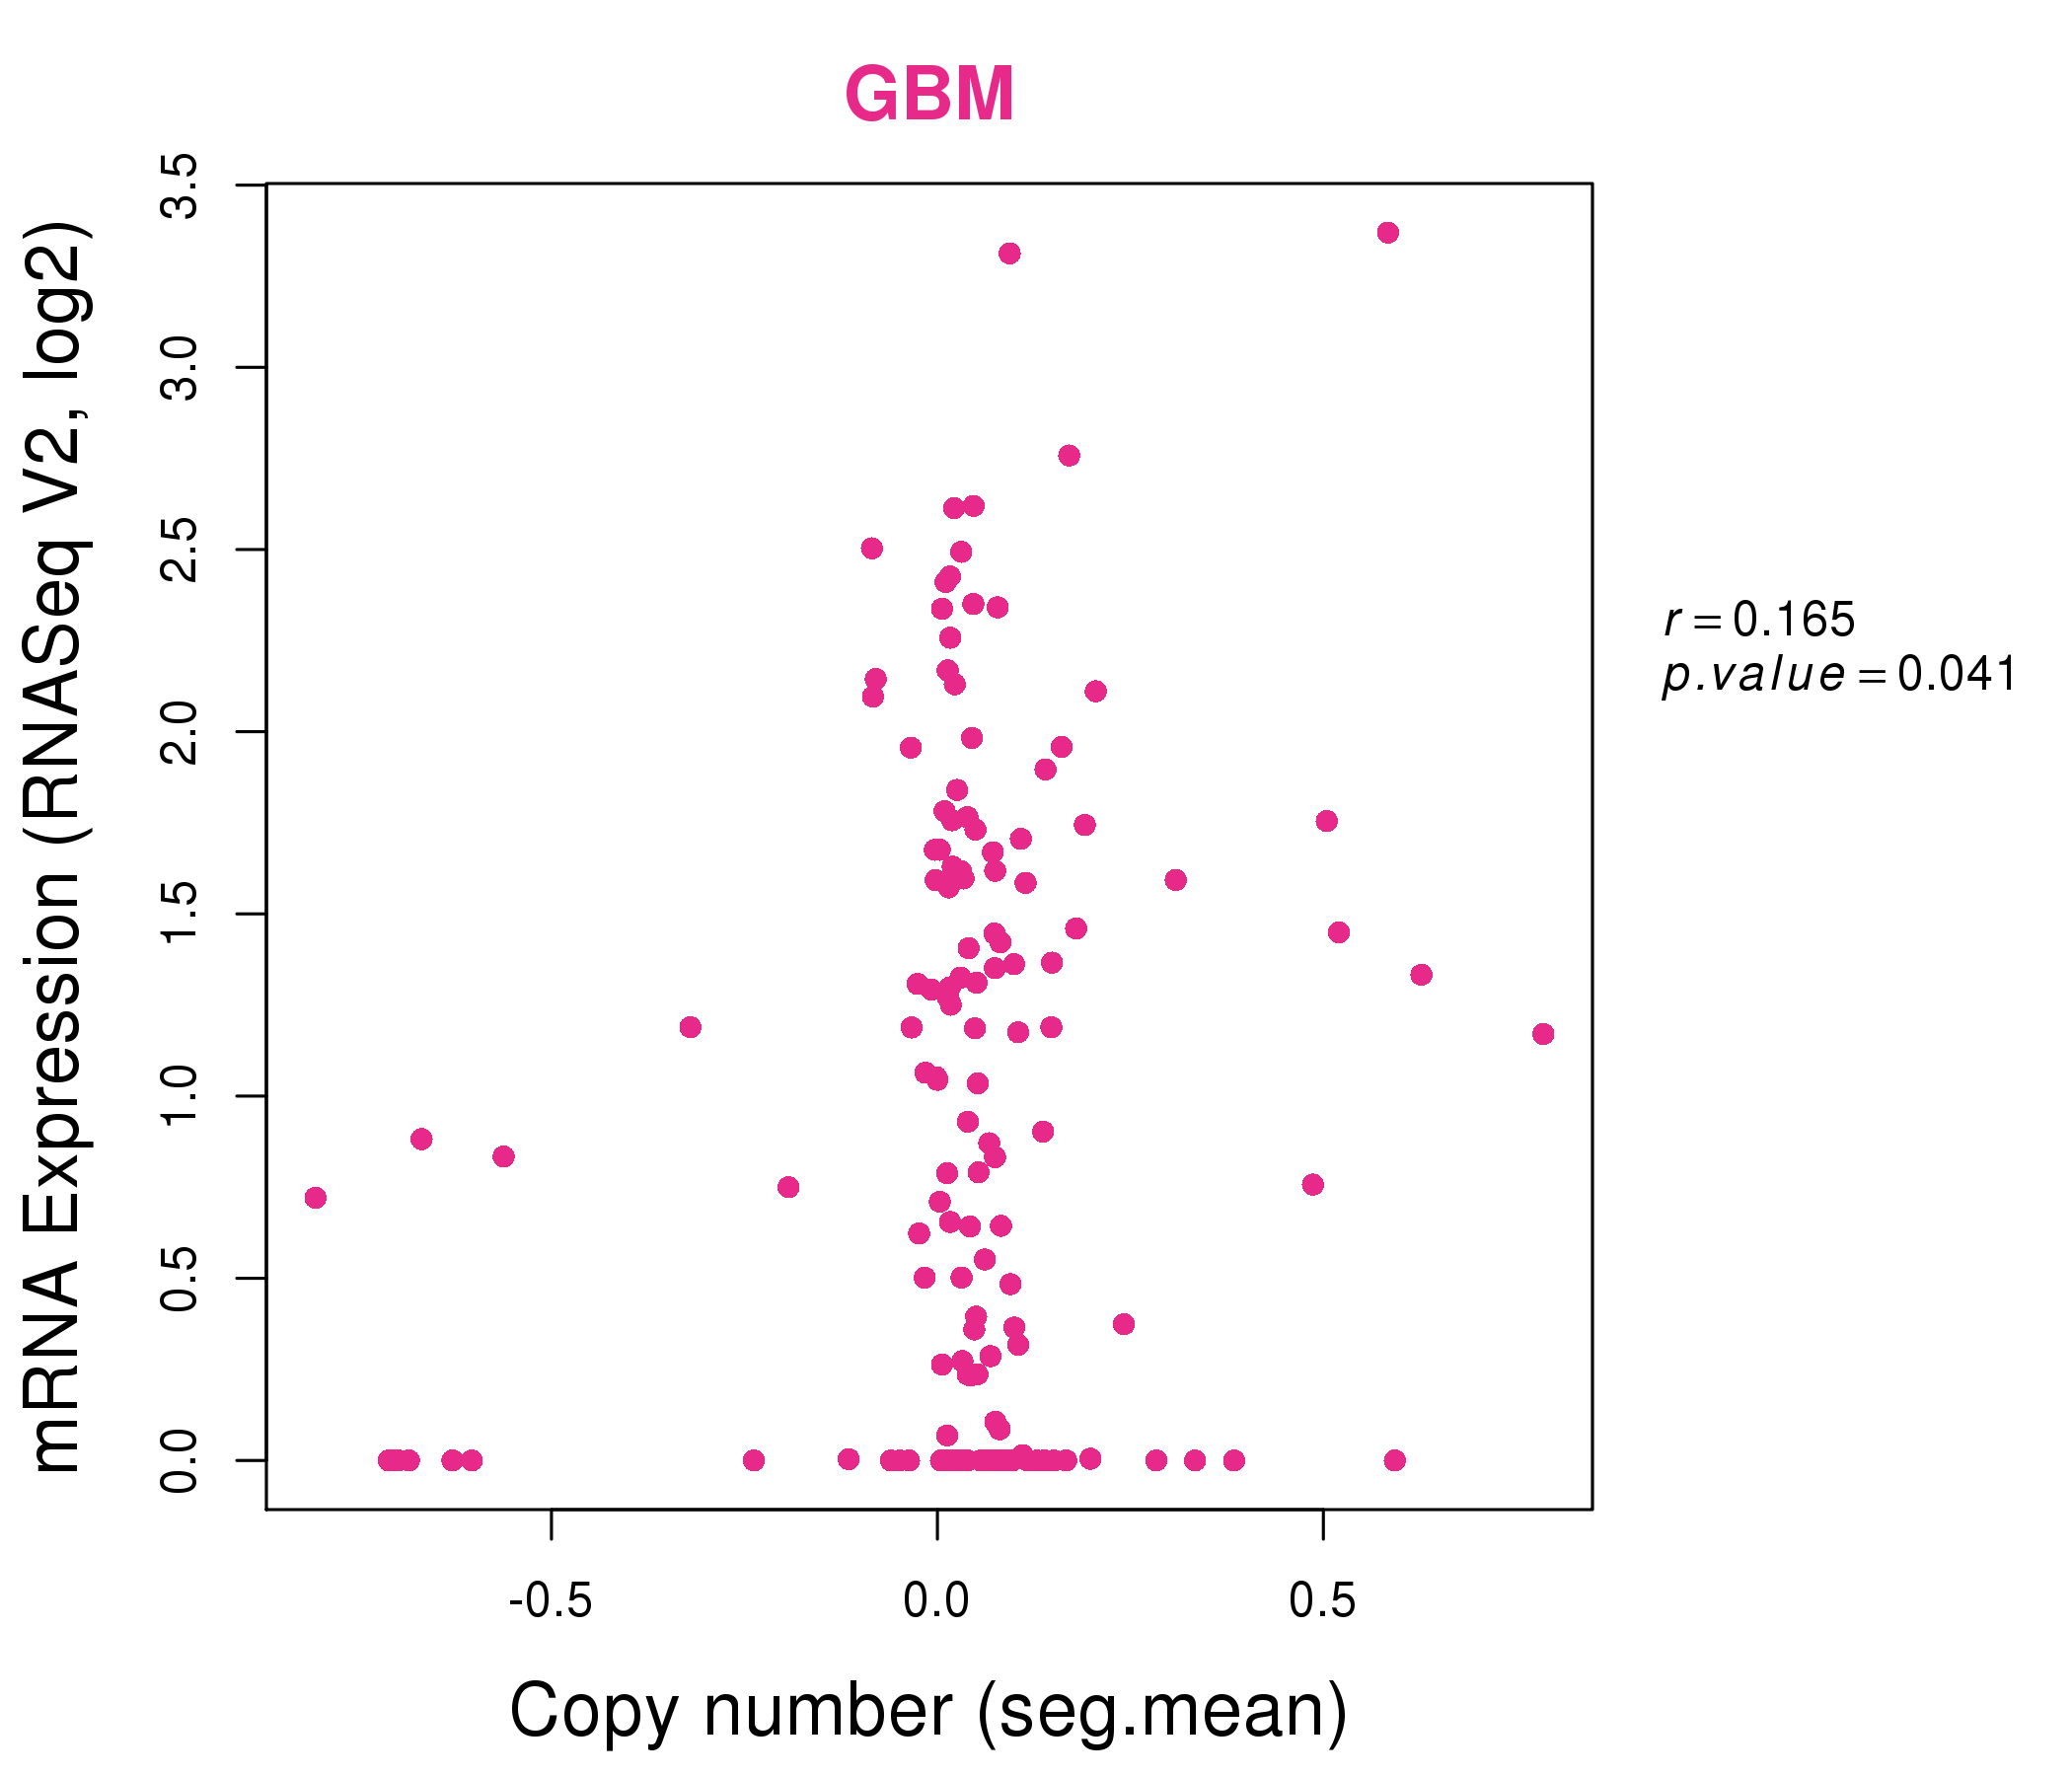
| * This plots show the correlation between CNV and gene expression. |
: Open all plots for all cancer types
 |
|
 |
|

| Top |
| Gene-Gene Network Information |
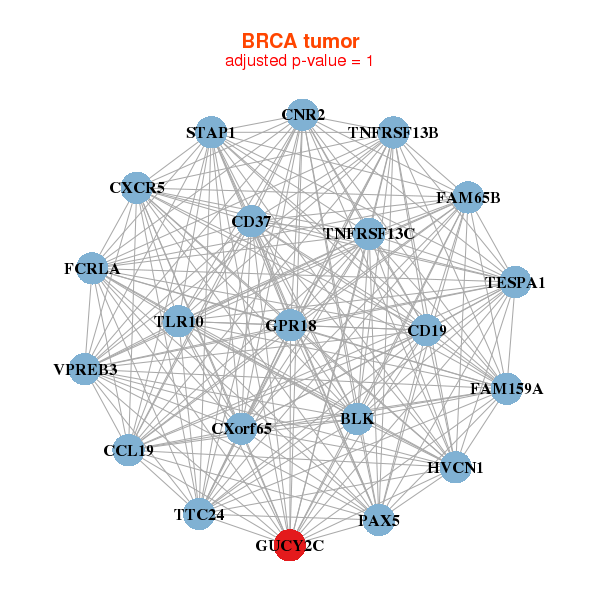
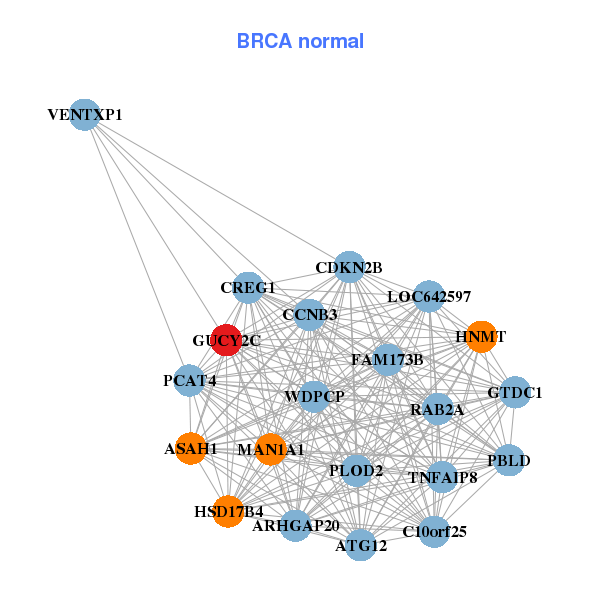
| * Co-Expression network figures were drawn using R package igraph. Only the top 20 genes with the highest correlations were shown. Red circle: input gene, orange circle: cell metabolism gene, sky circle: other gene |
: Open all plots for all cancer types
 |
|
| BLK,CCL19,CD19,CD37,CNR2,CXCR5,CXorf65, FAM159A,FAM65B,FCRLA,GPR18,GUCY2C,HVCN1,TESPA1, PAX5,STAP1,TLR10,TNFRSF13B,TNFRSF13C,TTC24,VPREB3 | ARHGAP20,ASAH1,ATG12,C10orf25,WDPCP,CCNB3,CDKN2B, CREG1,FAM173B,PCAT4,GTDC1,GUCY2C,HNMT,HSD17B4, LOC642597,MAN1A1,PBLD,PLOD2,RAB2A,TNFAIP8,VENTXP1 |
 |
|
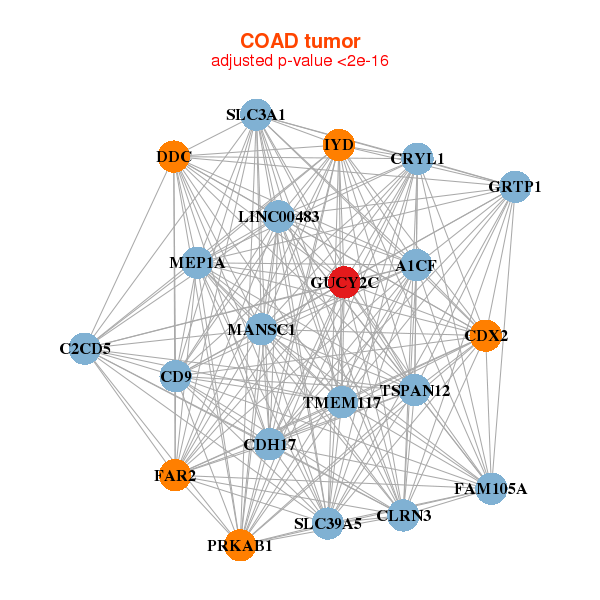
| A1CF,LINC00483,CD9,CDH17,CDX2,CLRN3,CRYL1, DDC,FAM105A,FAR2,GRTP1,GUCY2C,IYD,C2CD5, MANSC1,MEP1A,PRKAB1,SLC39A5,SLC3A1,TMEM117,TSPAN12 | ANKS4B,BTNL3,LRRC75A,CES2,CXADR,EPS8L3,FMO5, GUCY2C,HSD17B11,IYD,MOGAT2,NGEF,RNF128,SLC39A14, SMPD3,SNX24,STRADB,TMBIM6,USH1C,USP37,VIL1 |

| * Co-Expression network figures were drawn using R package igraph. Only the top 20 genes with the highest correlations were shown. Red circle: input gene, orange circle: cell metabolism gene, sky circle: other gene |
: Open all plots for all cancer types
| Top |
: Open all interacting genes' information including KEGG pathway for all interacting genes from DAVID
| Top |
| Pharmacological Information for GUCY2C |
| There's no related Drug. |
| Top |
| Cross referenced IDs for GUCY2C |
| * We obtained these cross-references from Uniprot database. It covers 150 different DBs, 18 categories. http://www.uniprot.org/help/cross_references_section |
: Open all cross reference information
|
Copyright © 2016-Present - The Univsersity of Texas Health Science Center at Houston @ |