|
||||||||||||||||||||
| |
| Phenotypic Information (metabolism pathway, cancer, disease, phenome) |
| |
| |
| Gene-Gene Network Information: Co-Expression Network, Interacting Genes & KEGG |
| |
|


| Gene Summary for GUK1 |
| Top |
| Phenotypic Information for GUK1(metabolism pathway, cancer, disease, phenome) |
| Cancer | CGAP: GUK1 |
| Familial Cancer Database: GUK1 | |
| * This gene is included in those cancer gene databases. |
|
|
|
|
|
| . | ||||||||||||||
Oncogene 1 | Significant driver gene in | |||||||||||||||||||
| cf) number; DB name 1 Oncogene; http://nar.oxfordjournals.org/content/35/suppl_1/D721.long, 2 Tumor Suppressor gene; https://bioinfo.uth.edu/TSGene/, 3 Cancer Gene Census; http://www.nature.com/nrc/journal/v4/n3/abs/nrc1299.html, 4 CancerGenes; http://nar.oxfordjournals.org/content/35/suppl_1/D721.long, 5 Network of Cancer Gene; http://ncg.kcl.ac.uk/index.php, 1Therapeutic Vulnerabilities in Cancer; http://cbio.mskcc.org/cancergenomics/statius/ |
| KEGG_PURINE_METABOLISM REACTOME_ABACAVIR_TRANSPORT_AND_METABOLISM REACTOME_METABOLISM_OF_NUCLEOTIDES | |
| OMIM | 139270; gene. |
| Orphanet | |
| Disease | KEGG Disease: GUK1 |
| MedGen: GUK1 (Human Medical Genetics with Condition) | |
| ClinVar: GUK1 | |
| Phenotype | MGI: GUK1 (International Mouse Phenotyping Consortium) |
| PhenomicDB: GUK1 | |
| Mutations for GUK1 |
| * Under tables are showing count per each tissue to give us broad intuition about tissue specific mutation patterns.You can go to the detailed page for each mutation database's web site. |
| There's no structural variation information in COSMIC data for this gene. |
| * From mRNA Sanger sequences, Chitars2.0 arranged chimeric transcripts. This table shows GUK1 related fusion information. |
| ID | Head Gene | Tail Gene | Accession | Gene_a | qStart_a | qEnd_a | Chromosome_a | tStart_a | tEnd_a | Gene_a | qStart_a | qEnd_a | Chromosome_a | tStart_a | tEnd_a |
| DA131615 | GUK1 | 1 | 65 | 1 | 228328003 | 228328067 | ARF1 | 62 | 629 | 1 | 228284778 | 228285698 | |
| BM827801 | GUK1 | 1 | 218 | 1 | 228328004 | 228333769 | ARFGAP1 | 216 | 329 | 20 | 61916216 | 61917060 | |
| BF987582 | GUK1 | 1 | 111 | 1 | 228333478 | 228333590 | GUK1 | 105 | 356 | 1 | 228332908 | 228333159 | |
| BU676367 | GUK1 | 14 | 64 | 1 | 228336597 | 228336647 | RP9 | 64 | 594 | 7 | 33134577 | 33136167 | |
| BE939838 | GUK1 | 14 | 149 | 1 | 228335219 | 228336098 | KDM5C | 141 | 285 | X | 53228198 | 53228342 | |
| BI051269 | GUK1 | 1 | 258 | 1 | 228336090 | 228336555 | SMARCC1 | 243 | 389 | 3 | 47632258 | 47651631 | |
| BG742639 | GUK1 | 1 | 498 | 1 | 228333052 | 228333551 | FADS2 | 492 | 907 | 11 | 61634285 | 61634704 | |
| BQ012719 | GUK1 | 18 | 120 | 1 | 228336550 | 228336652 | CGA | 115 | 444 | 6 | 87795223 | 87795552 | |
| BF766114 | GUK1 | 1 | 184 | 1 | 228335348 | 228336409 | GUK1 | 177 | 383 | 1 | 228328849 | 228333277 | |
| CF529503 | GUK1 | 18 | 120 | 1 | 228336550 | 228336652 | CGA | 115 | 444 | 6 | 87795223 | 87795552 | |
| Top |
| There's no copy number variation information in COSMIC data for this gene. |
| Top |
|
 |
| Top |
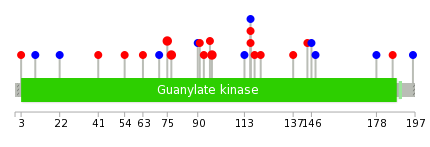
| Stat. for Non-Synonymous SNVs (# total SNVs=12) | (# total SNVs=8) |
 |  |
(# total SNVs=0) | (# total SNVs=0) |
| Top |
| * When you move the cursor on each content, you can see more deailed mutation information on the Tooltip. Those are primary_site,primary_histology,mutation(aa),pubmedID. |
| GRCh37 position | Mutation(aa) | Unique sampleID count |
| chr1:228334618-228334618 | p.S77L | 2 |
| chr1:228335144-228335144 | p.I97F | 2 |
| chr1:228334611-228334611 | p.E75K | 2 |
| chr1:228335217-228335217 | p.S121F | 1 |
| chr1:228335125-228335125 | p.A90A | 1 |
| chr1:228335335-228335335 | p.R137P | 1 |
| chr1:228333221-228333221 | p.G3A | 1 |
| chr1:228335126-228335126 | p.V91M | 1 |
| chr1:228335356-228335356 | p.S144I | 1 |
| chr1:228333243-228333243 | p.S10S | 1 |
| Top |
|
 |
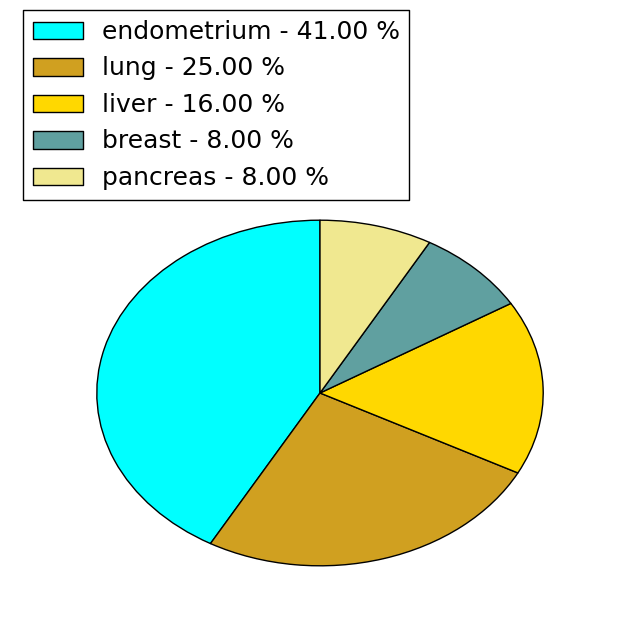
| Point Mutation/ Tissue ID | 1 | 2 | 3 | 4 | 5 | 6 | 7 | 8 | 9 | 10 | 11 | 12 | 13 | 14 | 15 | 16 | 17 | 18 | 19 | 20 |
| # sample | 1 | 4 | 1 | 3 | 4 | 1 | 7 | |||||||||||||
| # mutation | 1 | 4 | 1 | 3 | 4 | 1 | 8 | |||||||||||||
| nonsynonymous SNV | 2 | 1 | 2 | 3 | 1 | 6 | ||||||||||||||
| synonymous SNV | 1 | 2 | 1 | 1 | 2 |
| cf) Tissue ID; Tissue type (1; BLCA[Bladder Urothelial Carcinoma], 2; BRCA[Breast invasive carcinoma], 3; CESC[Cervical squamous cell carcinoma and endocervical adenocarcinoma], 4; COAD[Colon adenocarcinoma], 5; GBM[Glioblastoma multiforme], 6; Glioma Low Grade, 7; HNSC[Head and Neck squamous cell carcinoma], 8; KICH[Kidney Chromophobe], 9; KIRC[Kidney renal clear cell carcinoma], 10; KIRP[Kidney renal papillary cell carcinoma], 11; LAML[Acute Myeloid Leukemia], 12; LUAD[Lung adenocarcinoma], 13; LUSC[Lung squamous cell carcinoma], 14; OV[Ovarian serous cystadenocarcinoma ], 15; PAAD[Pancreatic adenocarcinoma], 16; PRAD[Prostate adenocarcinoma], 17; SKCM[Skin Cutaneous Melanoma], 18:STAD[Stomach adenocarcinoma], 19:THCA[Thyroid carcinoma], 20:UCEC[Uterine Corpus Endometrial Carcinoma]) |
| Top |
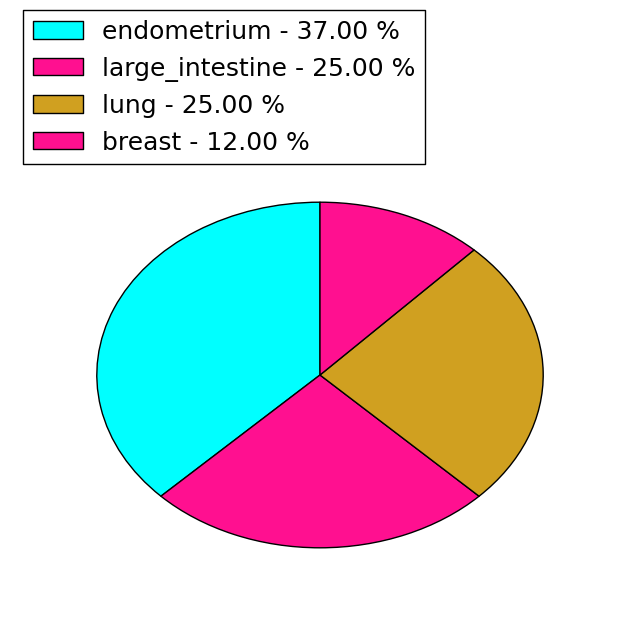
| * We represented just top 10 SNVs. When you move the cursor on each content, you can see more deailed mutation information on the Tooltip. Those are primary_site, primary_histology, mutation(aa), pubmedID. |
| Genomic Position | Mutation(aa) | Unique sampleID count |
| chr1:228334611 | p.E96K,GUK1 | 2 |
| chr1:228335132 | p.T134T,GUK1 | 1 |
| chr1:228336392 | p.R137Q,GUK1 | 1 |
| chr1:228335142 | p.R137R,GUK1 | 1 |
| chr1:228333221 | p.R158P,GUK1 | 1 |
| chr1:228335158 | p.G24A,GUK1 | 1 |
| chr1:228333243 | p.S165I,GUK1 | 1 |
| chr1:228335194 | p.S31S,GUK1 | 1 |
| chr1:228333279 | p.R169R,GUK1 | 1 |
| chr1:228335202 | p.K43K,GUK1 | 1 |
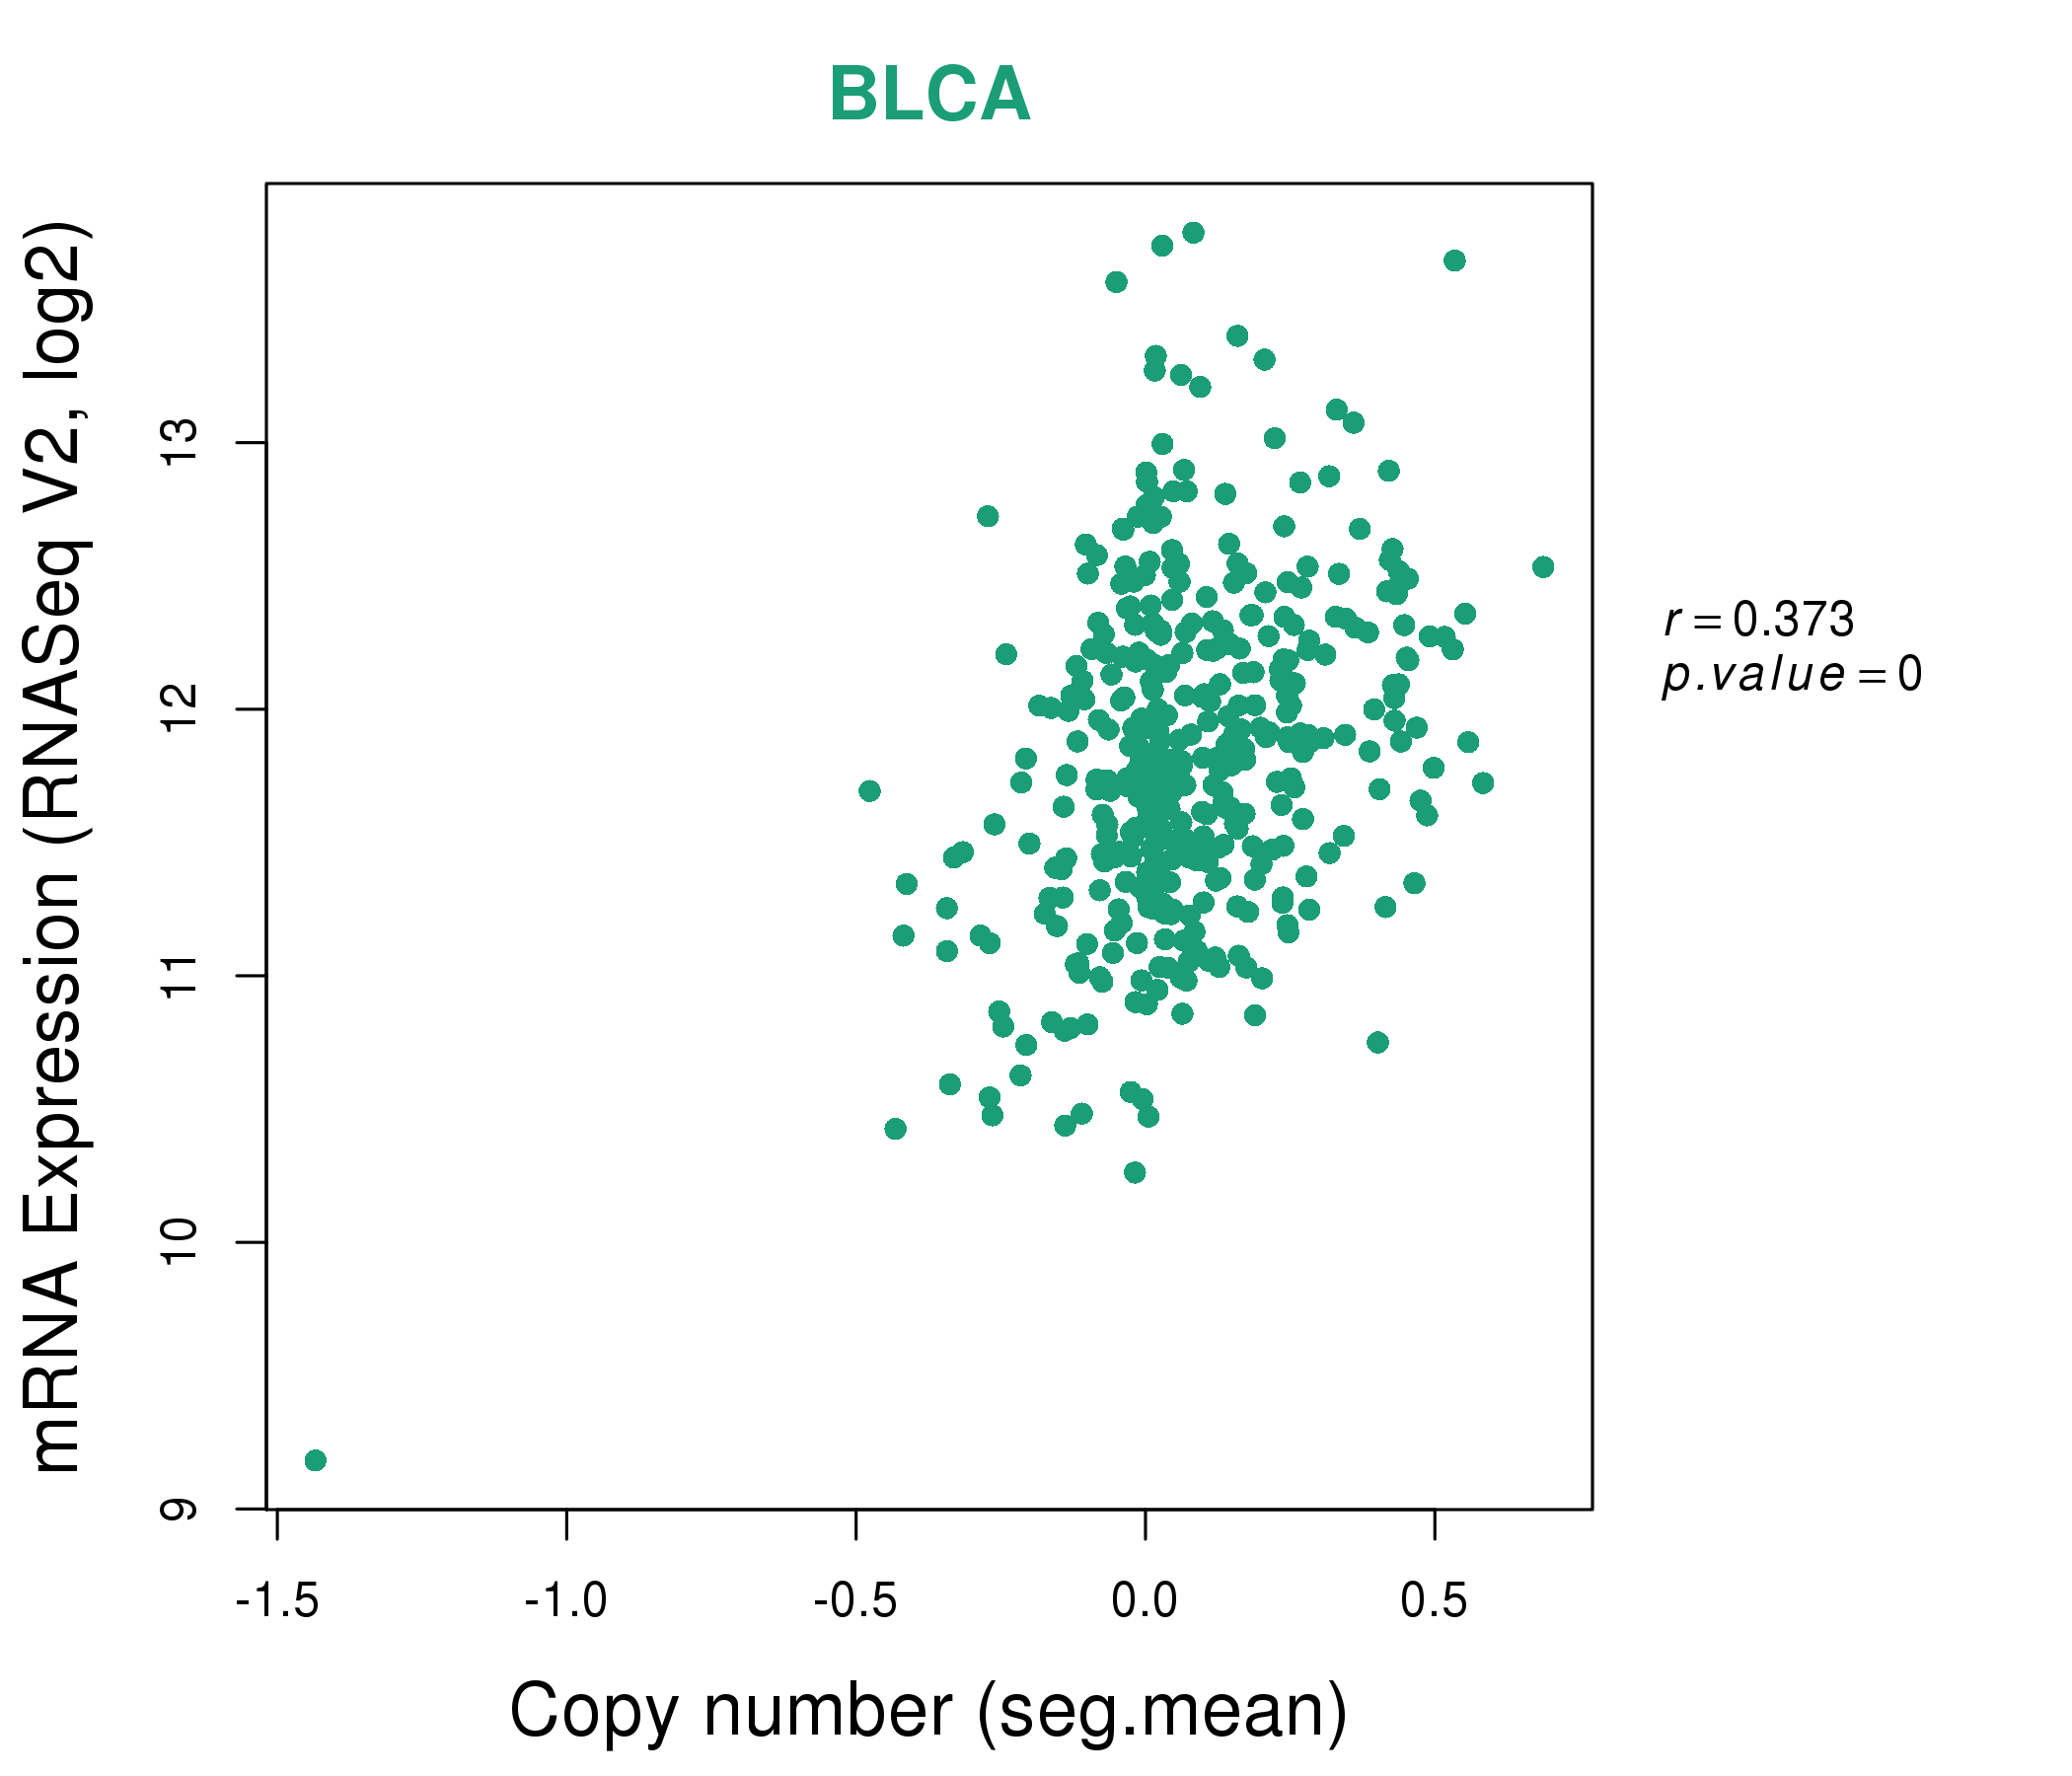
| * Copy number data were extracted from TCGA using R package TCGA-Assembler. The URLs of all public data files on TCGA DCC data server were gathered on Jan-05-2015. Function ProcessCNAData in TCGA-Assembler package was used to obtain gene-level copy number value which is calculated as the average copy number of the genomic region of a gene. |
 |
| cf) Tissue ID[Tissue type]: BLCA[Bladder Urothelial Carcinoma], BRCA[Breast invasive carcinoma], CESC[Cervical squamous cell carcinoma and endocervical adenocarcinoma], COAD[Colon adenocarcinoma], GBM[Glioblastoma multiforme], Glioma Low Grade, HNSC[Head and Neck squamous cell carcinoma], KICH[Kidney Chromophobe], KIRC[Kidney renal clear cell carcinoma], KIRP[Kidney renal papillary cell carcinoma], LAML[Acute Myeloid Leukemia], LUAD[Lung adenocarcinoma], LUSC[Lung squamous cell carcinoma], OV[Ovarian serous cystadenocarcinoma ], PAAD[Pancreatic adenocarcinoma], PRAD[Prostate adenocarcinoma], SKCM[Skin Cutaneous Melanoma], STAD[Stomach adenocarcinoma], THCA[Thyroid carcinoma], UCEC[Uterine Corpus Endometrial Carcinoma] |
| Top |
| Gene Expression for GUK1 |
| * CCLE gene expression data were extracted from CCLE_Expression_Entrez_2012-10-18.res: Gene-centric RMA-normalized mRNA expression data. |
 |
| * Normalized gene expression data of RNASeqV2 was extracted from TCGA using R package TCGA-Assembler. The URLs of all public data files on TCGA DCC data server were gathered at Jan-05-2015. Only eight cancer types have enough normal control samples for differential expression analysis. (t test, adjusted p<0.05 (using Benjamini-Hochberg FDR)) |
 |
| Top |
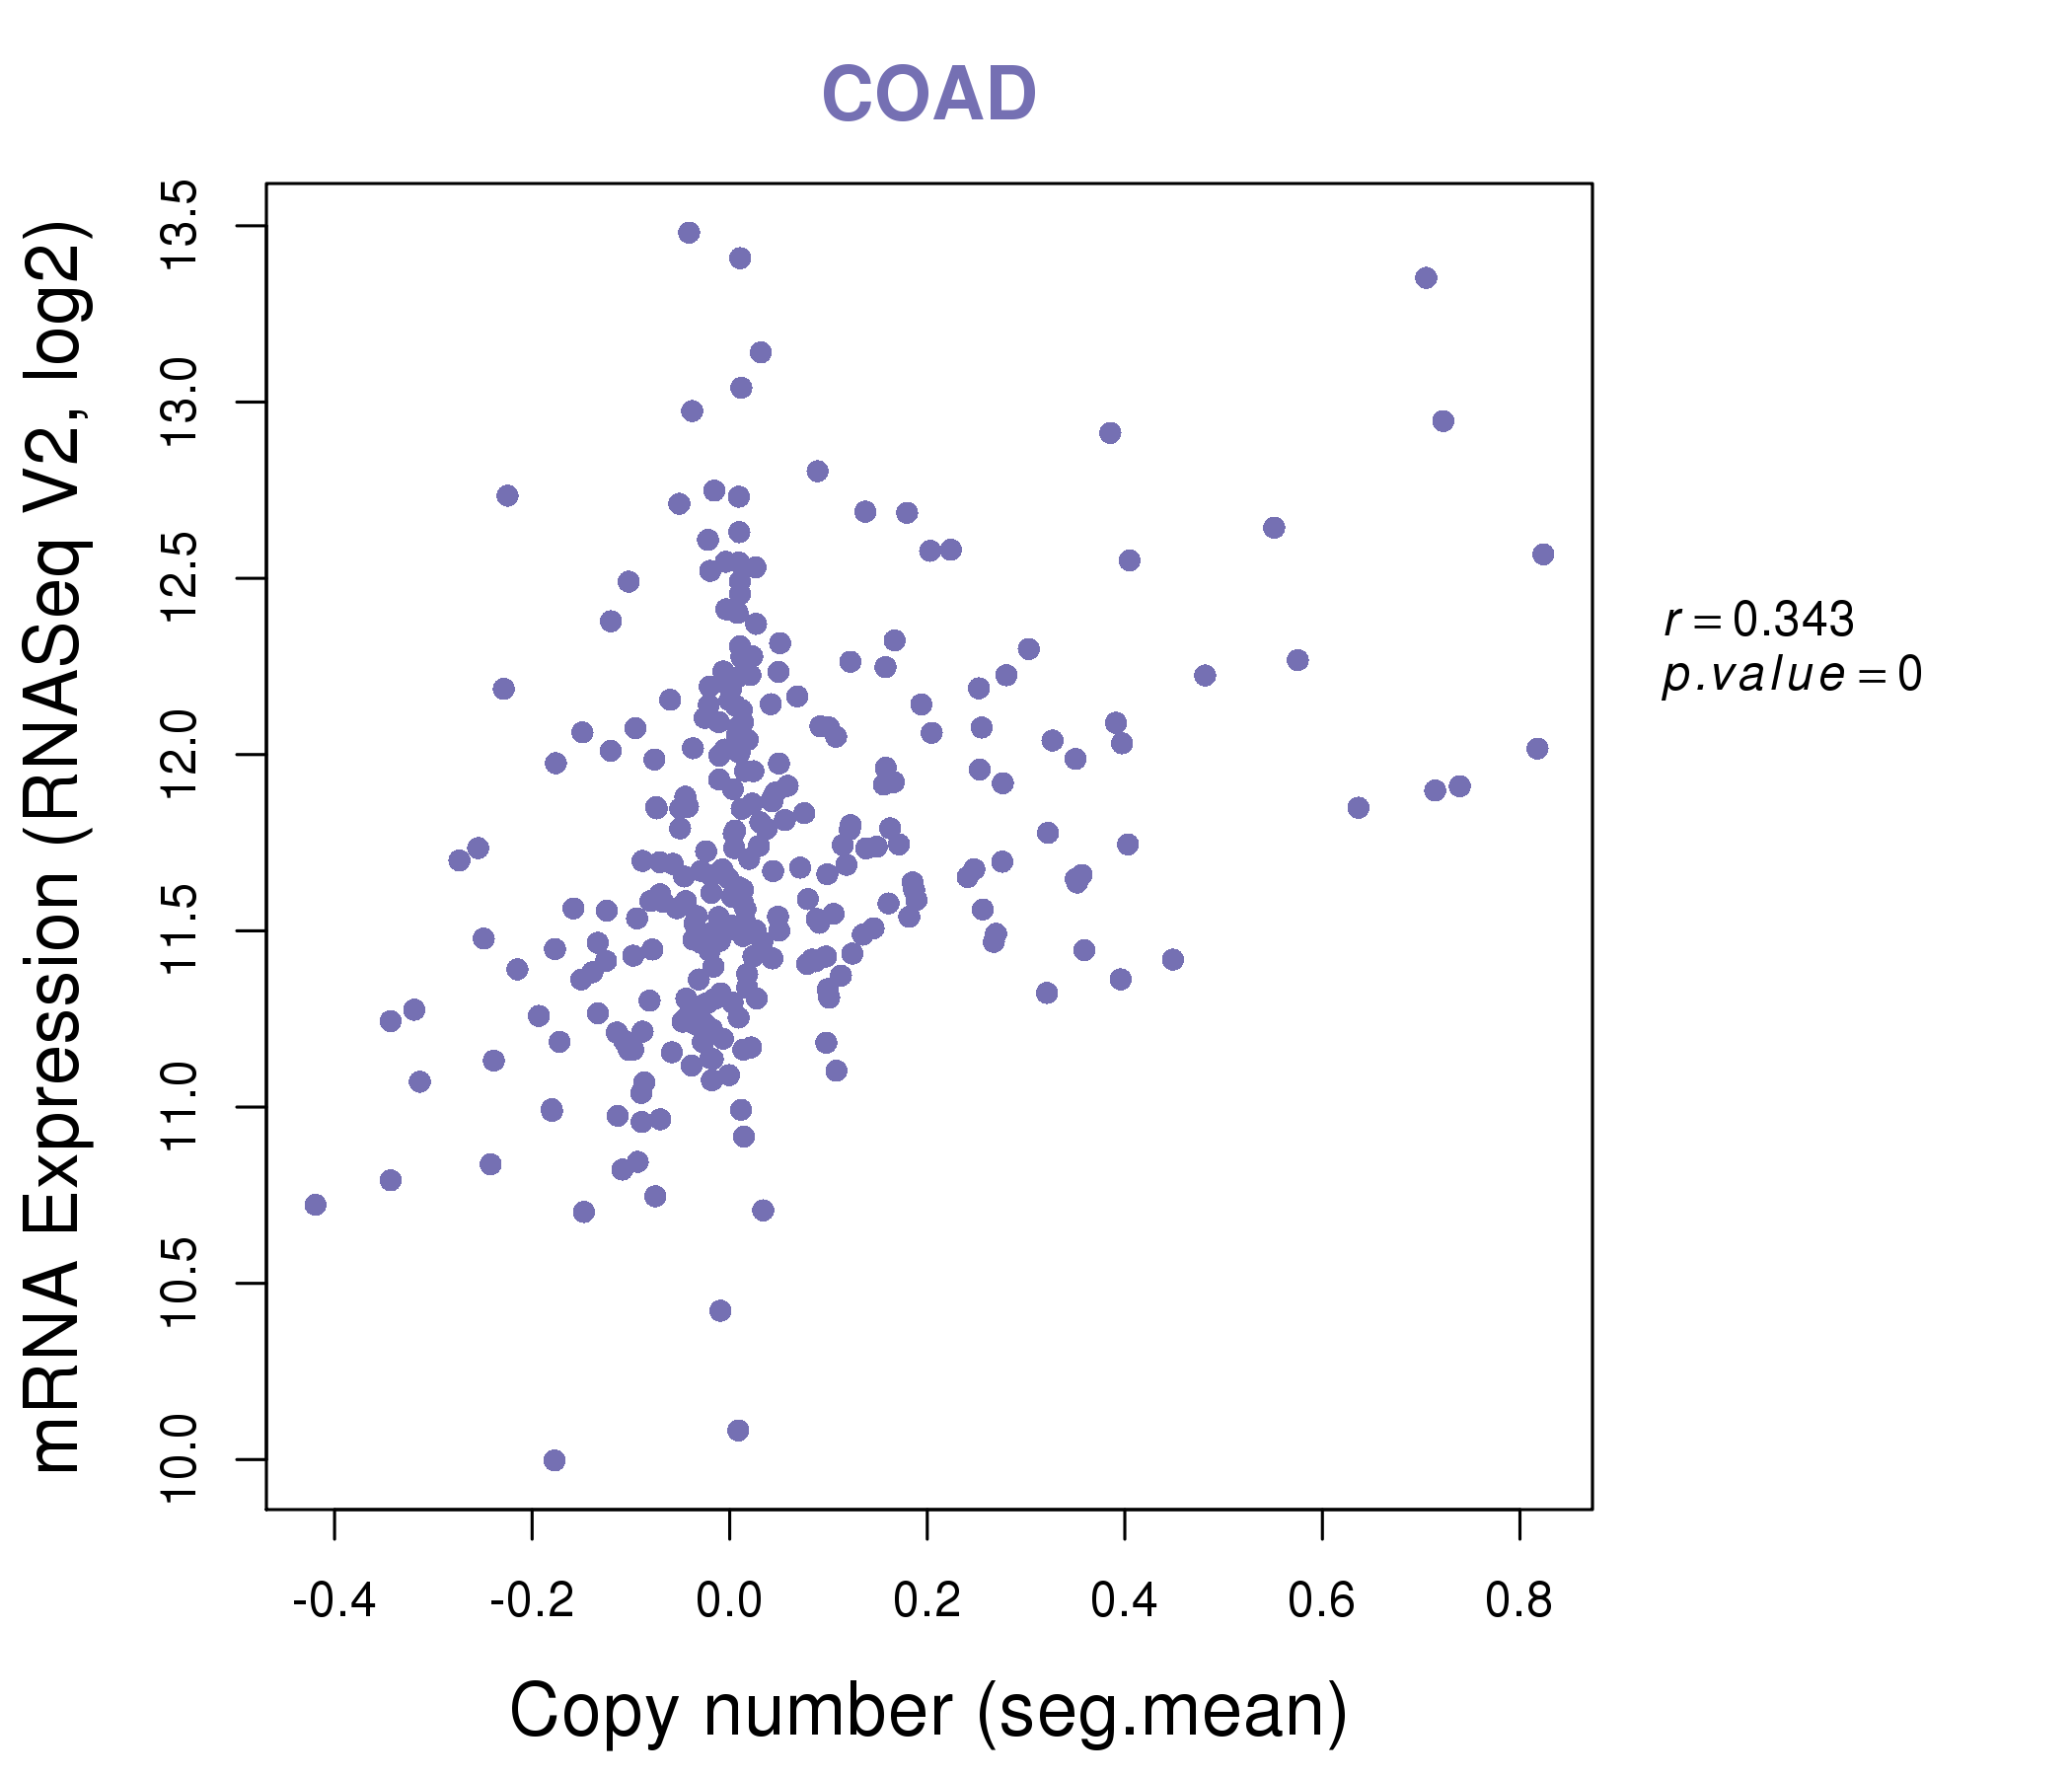
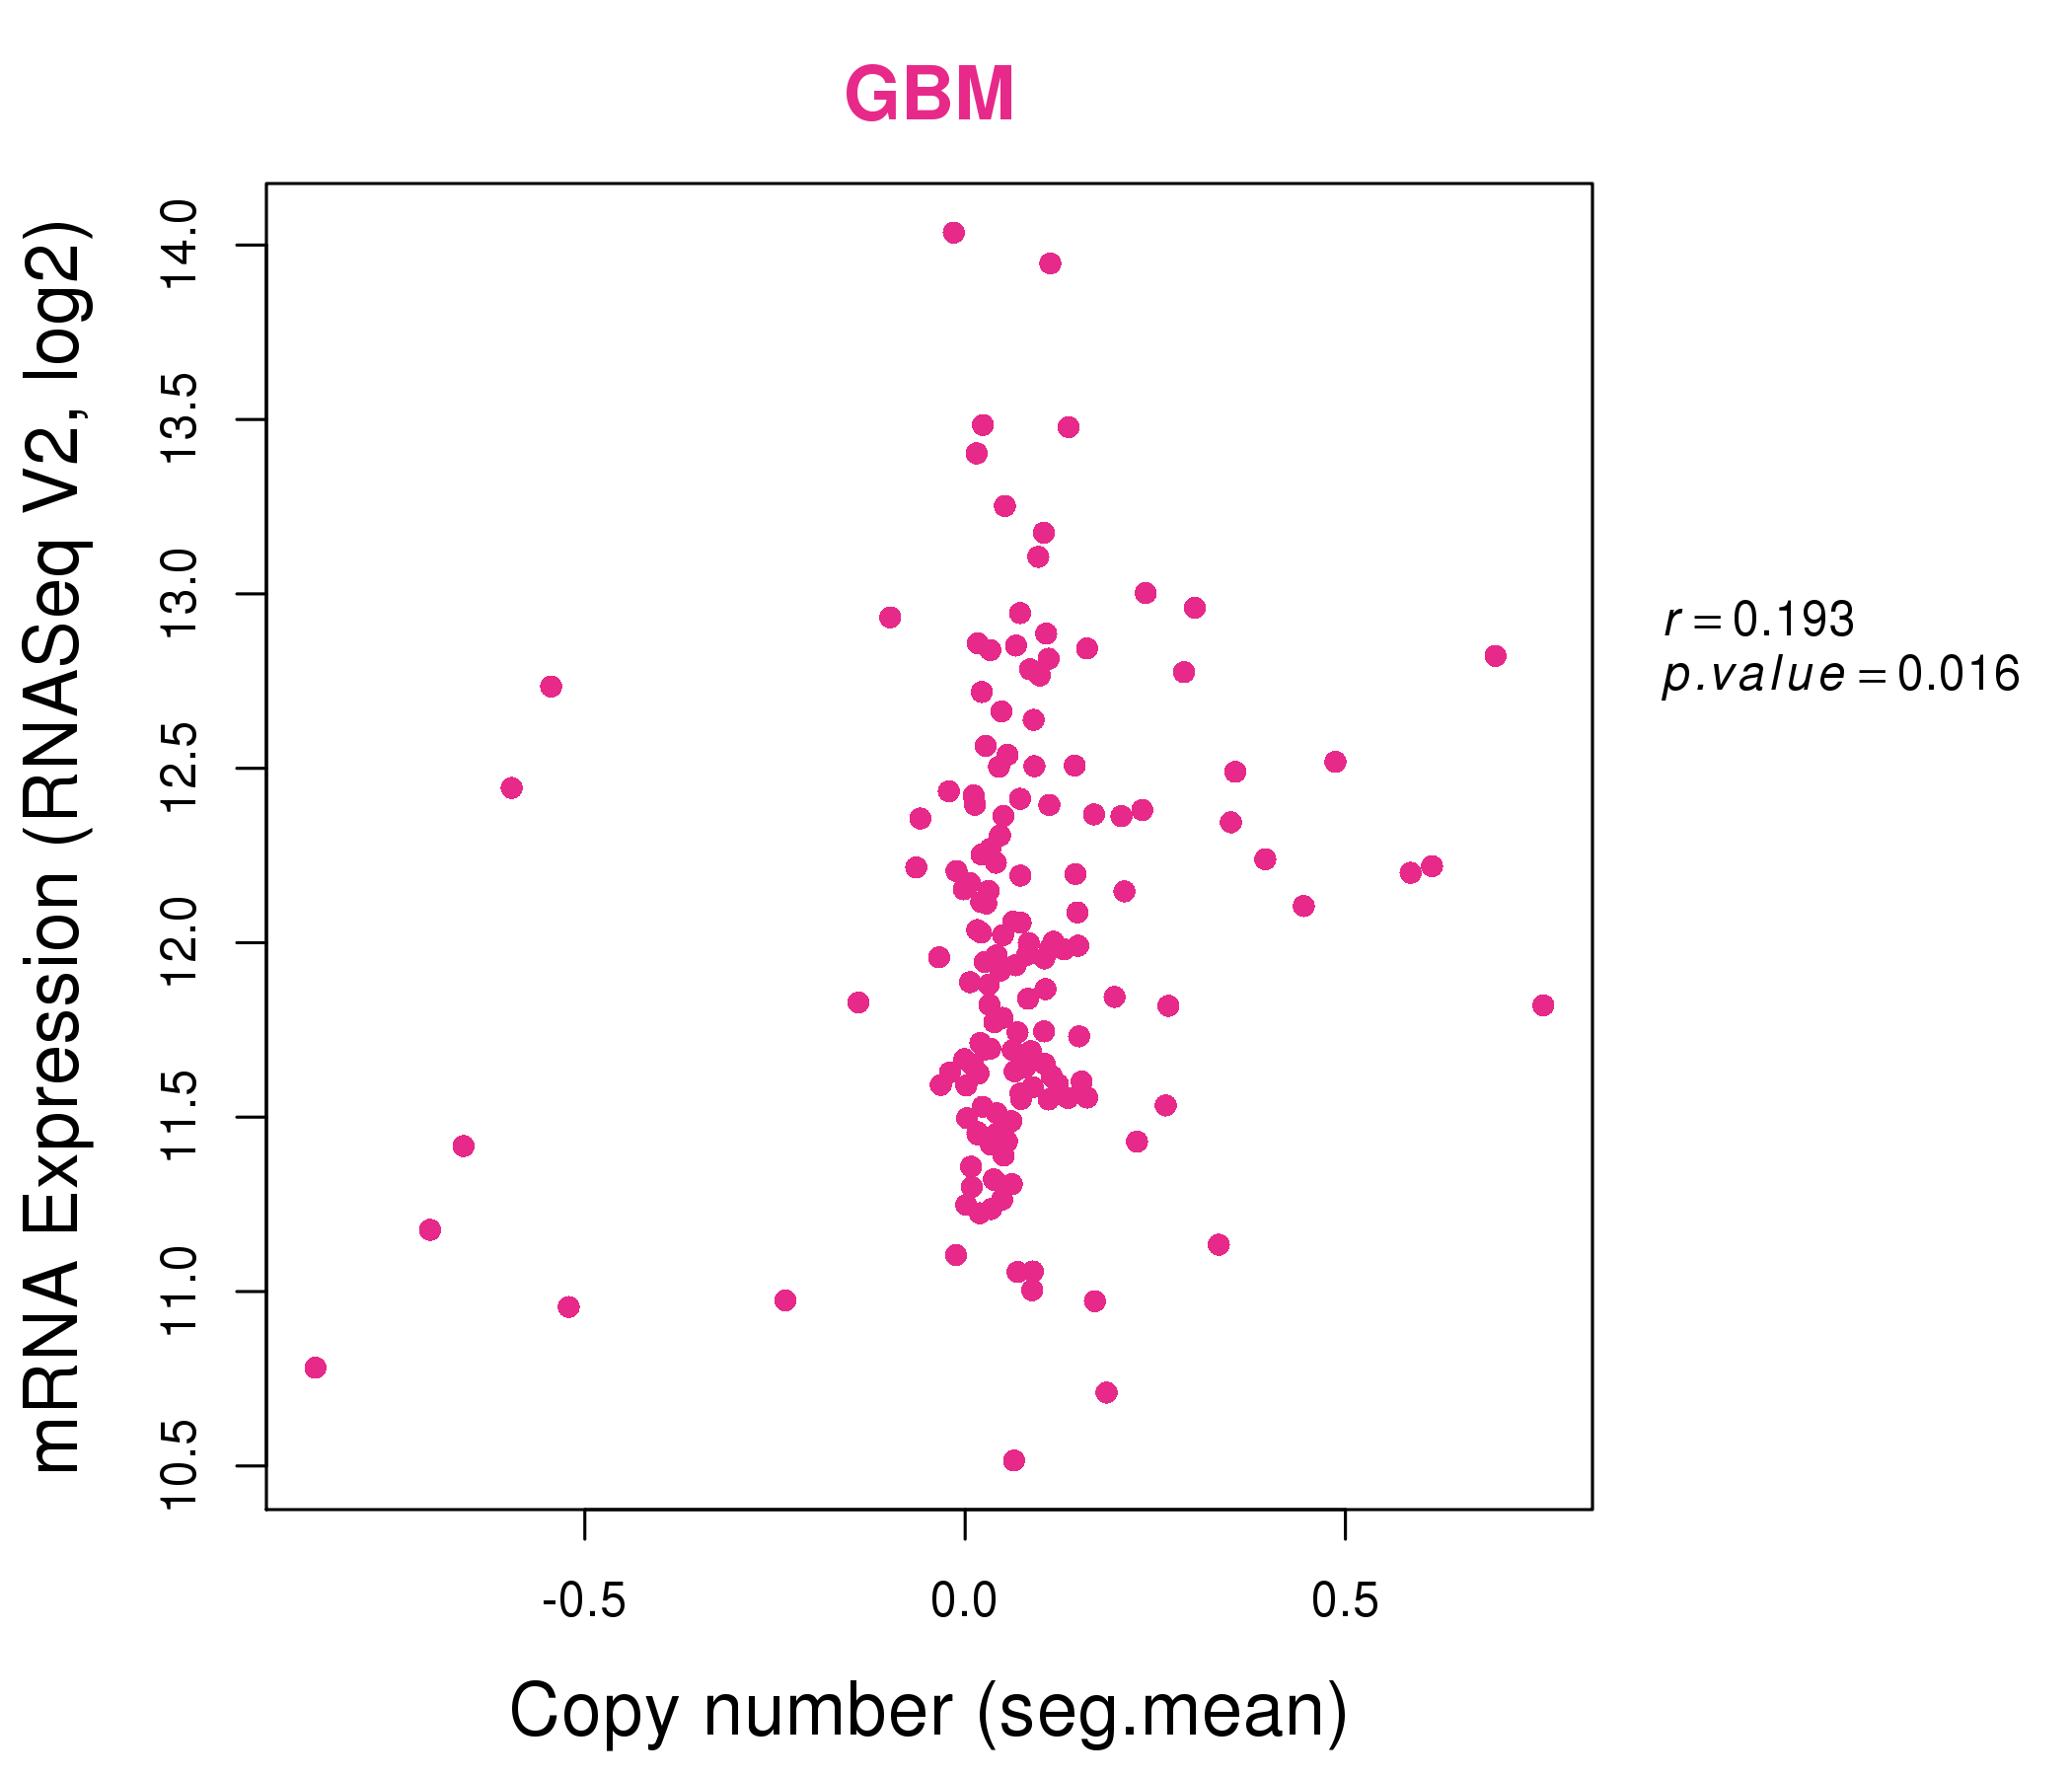
| * This plots show the correlation between CNV and gene expression. |
: Open all plots for all cancer types
 |
|
 |
|

| Top |
| Gene-Gene Network Information |
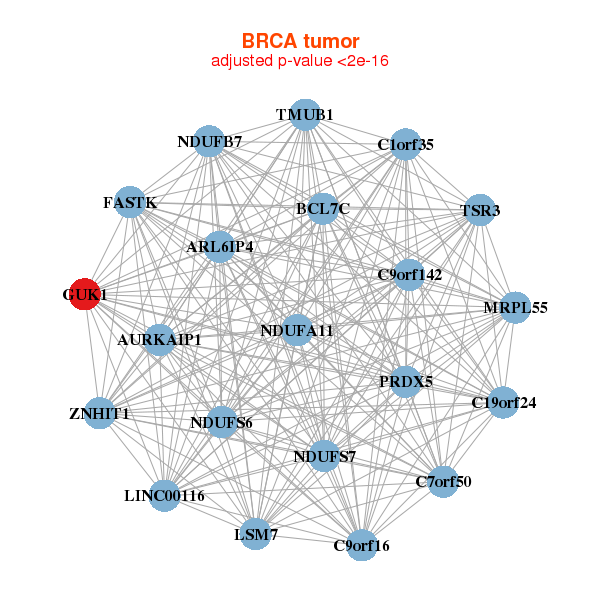
| * Co-Expression network figures were drawn using R package igraph. Only the top 20 genes with the highest correlations were shown. Red circle: input gene, orange circle: cell metabolism gene, sky circle: other gene |
: Open all plots for all cancer types
 |
| ||||
| ARL6IP4,AURKAIP1,BCL7C,TSR3,C19orf24,C1orf35,C7orf50, C9orf142,C9orf16,FASTK,GUK1,LSM7,MRPL55,LINC00116, NDUFA11,NDUFB7,NDUFS6,NDUFS7,PRDX5,TMUB1,ZNHIT1 | BAD,LAMTOR4,CCDC124,CHMP2A,DPM3,FAM195B,FKBP8, GNB2,GUK1,JMJD8,JOSD2,MBD3,MPG,MRPL28, RABAC1,ROMO1,RPS19BP1,SCAND1,SSNA1,TBCB,ZNHIT1 | ||||
 |
| ||||
| ARF1,ATP6V0B,AURKAIP1,COX7A2,DPM3,GUK1,HAX1, JTB,KRTCAP2,NAA38,MPG,MRPL54,MRPL55,MTX1, PSMB4,LAMTOR2,S100A6,SCO2,TMEM183A,TMEM219,TSPO | COX14,IFT43,SZRD1,DYNLT1,GUK1,MYEOV2,NDUFA13, NDUFA7,NDUFB7,POLR2F,PSENEN,PSMB1,PSMB4,PSMD8, PSMD9,RNF181,SCNM1,SNX17,TRAPPC3,UBL5,UQCR11 |

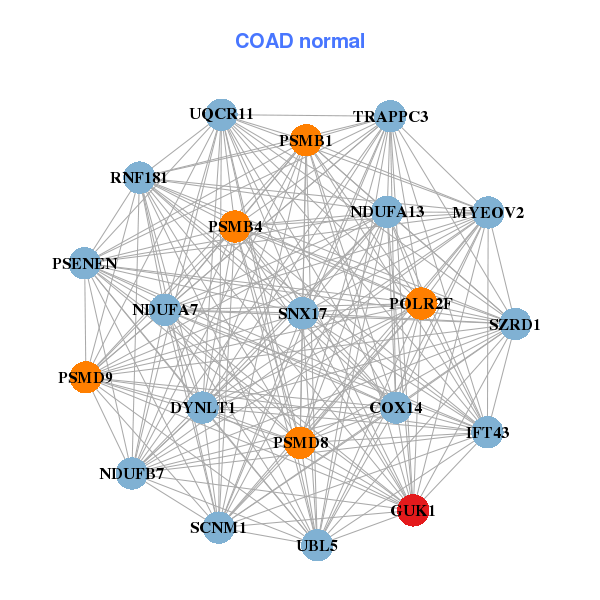
| * Co-Expression network figures were drawn using R package igraph. Only the top 20 genes with the highest correlations were shown. Red circle: input gene, orange circle: cell metabolism gene, sky circle: other gene |
: Open all plots for all cancer types
| Top |
: Open all interacting genes' information including KEGG pathway for all interacting genes from DAVID
| Top |
| Pharmacological Information for GUK1 |
| DB Category | DB Name | DB's ID and Url link |
| Chemistry | ChEMBL | CHEMBL4989; -. |
| Organism-specific databases | PharmGKB | PA29072; -. |
| Organism-specific databases | CTD | 2987; -. |
| * Gene Centered Interaction Network. |
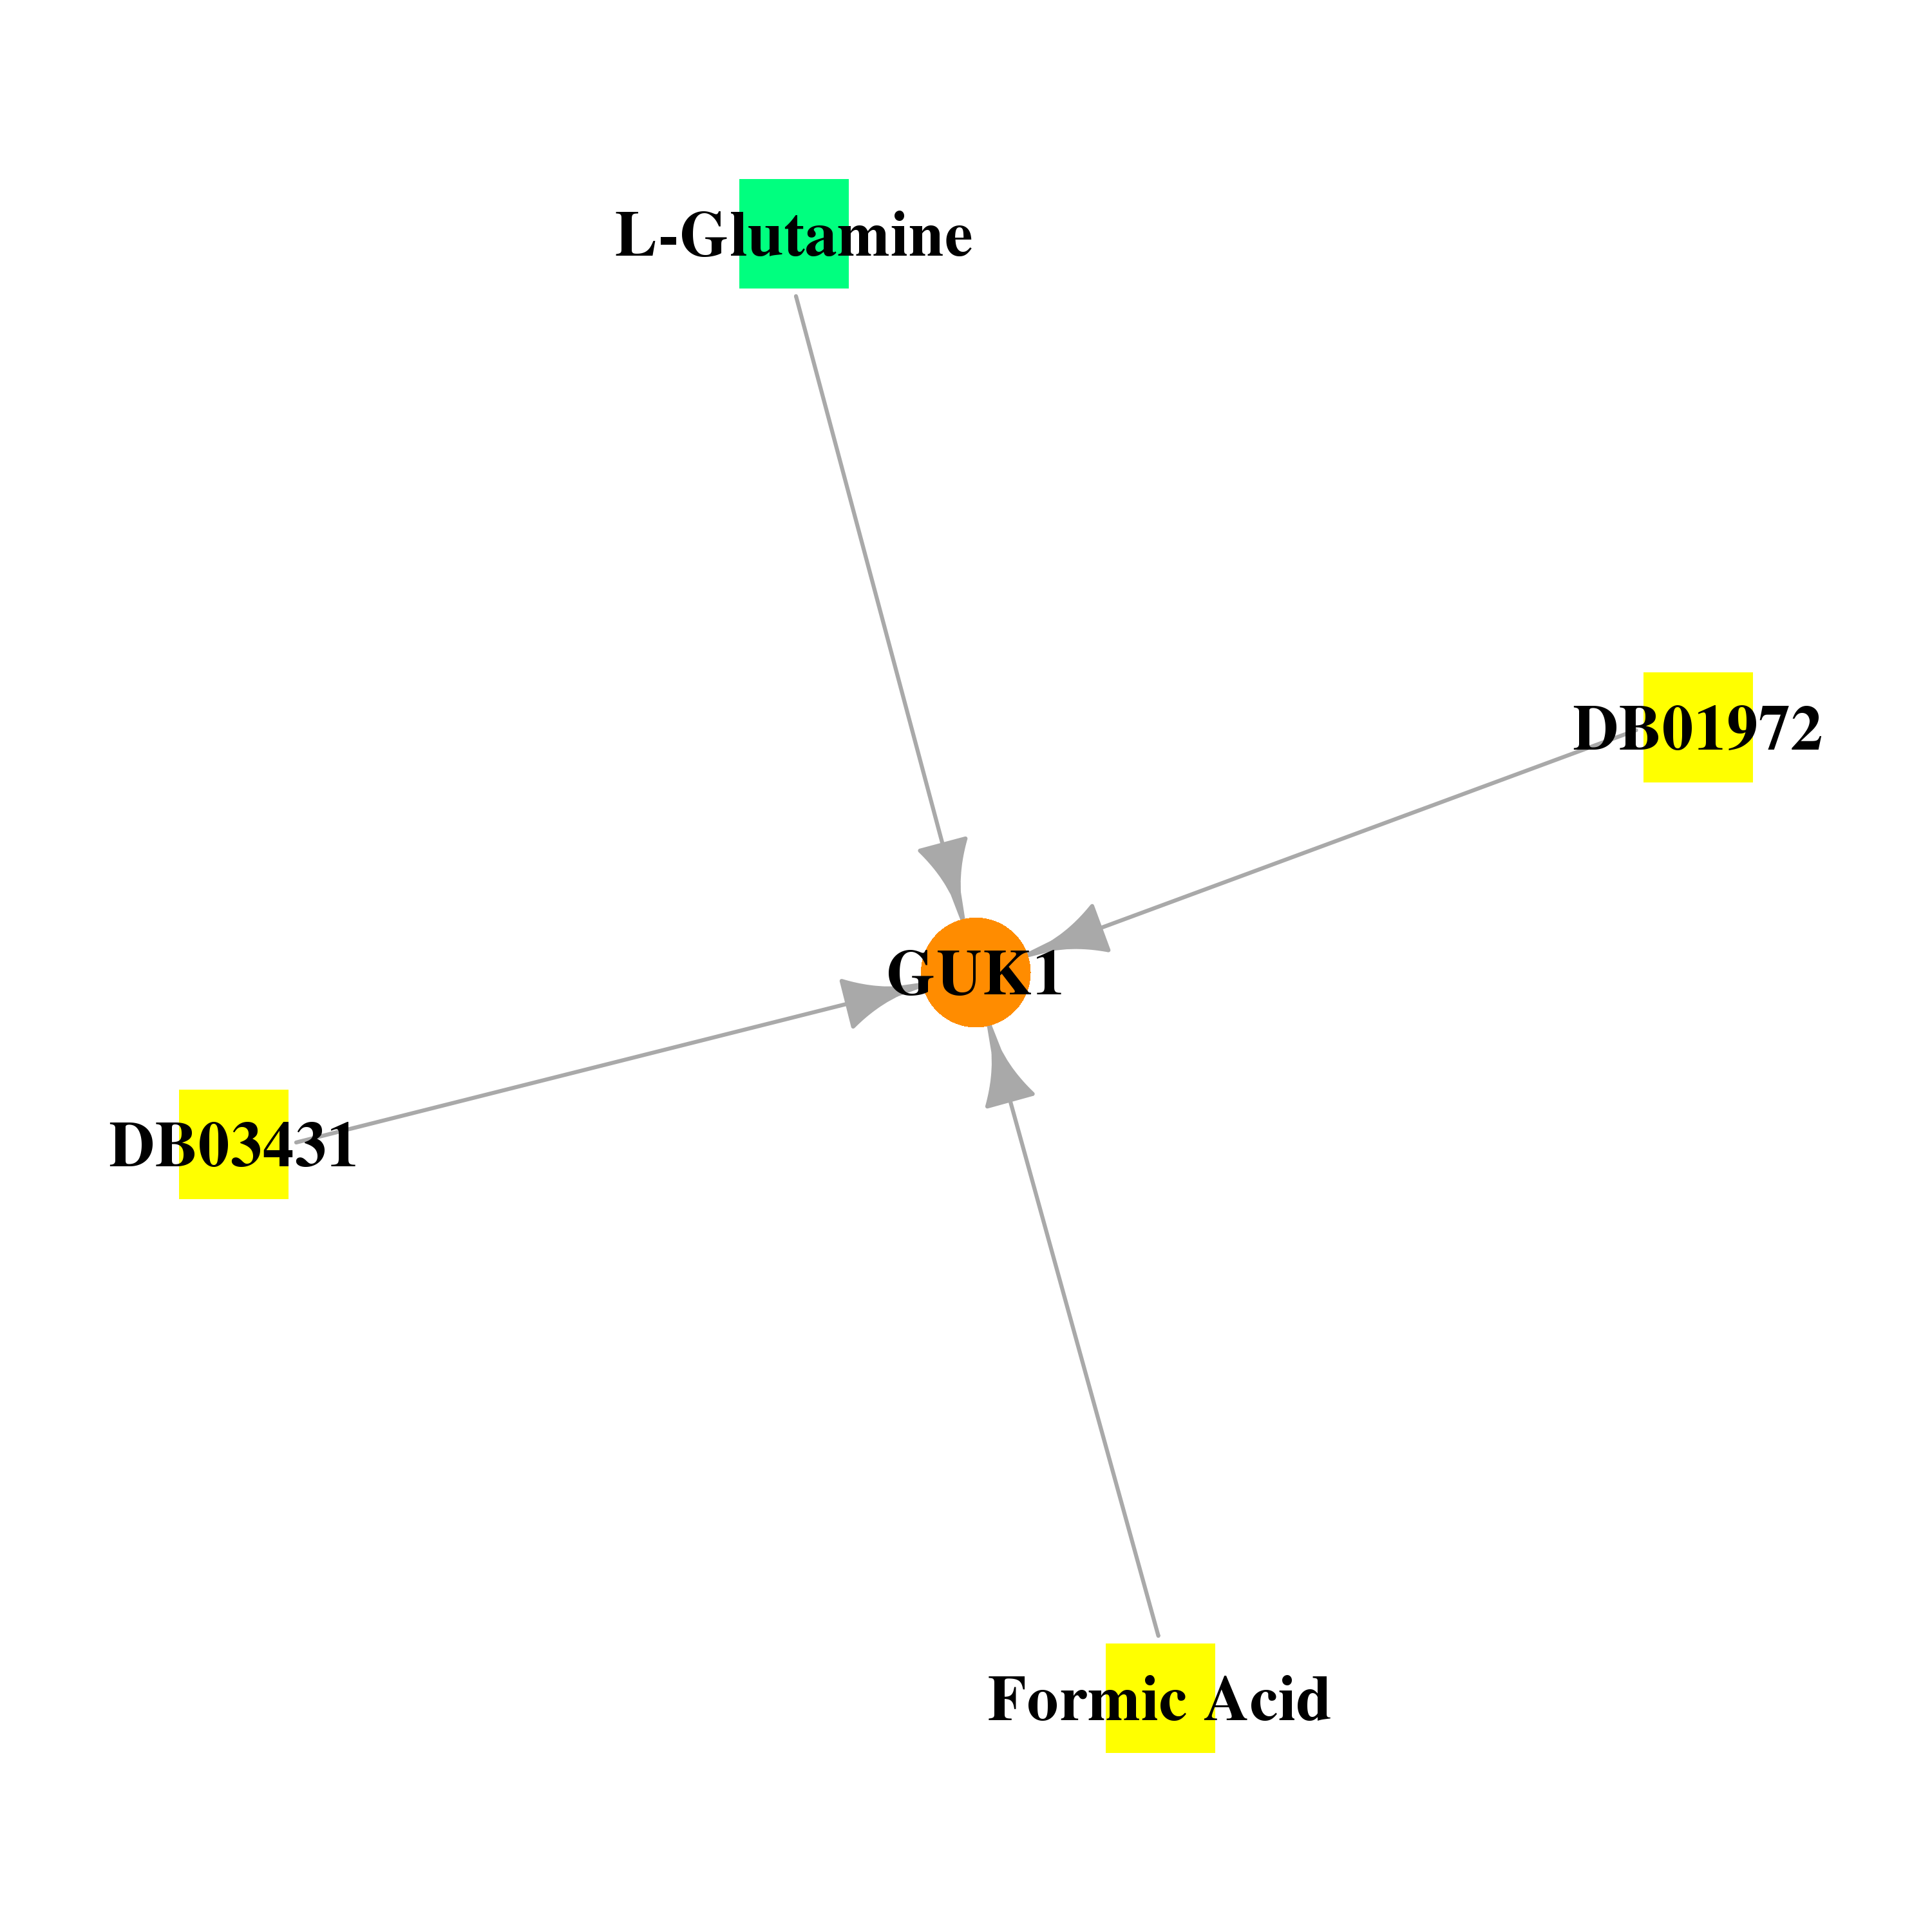 |
| * Drug Centered Interaction Network. |
| DrugBank ID | Target Name | Drug Groups | Generic Name | Drug Centered Network | Drug Structure |
| DB01972 | guanylate kinase 1 | experimental | Guanosine-5'-Monophosphate | 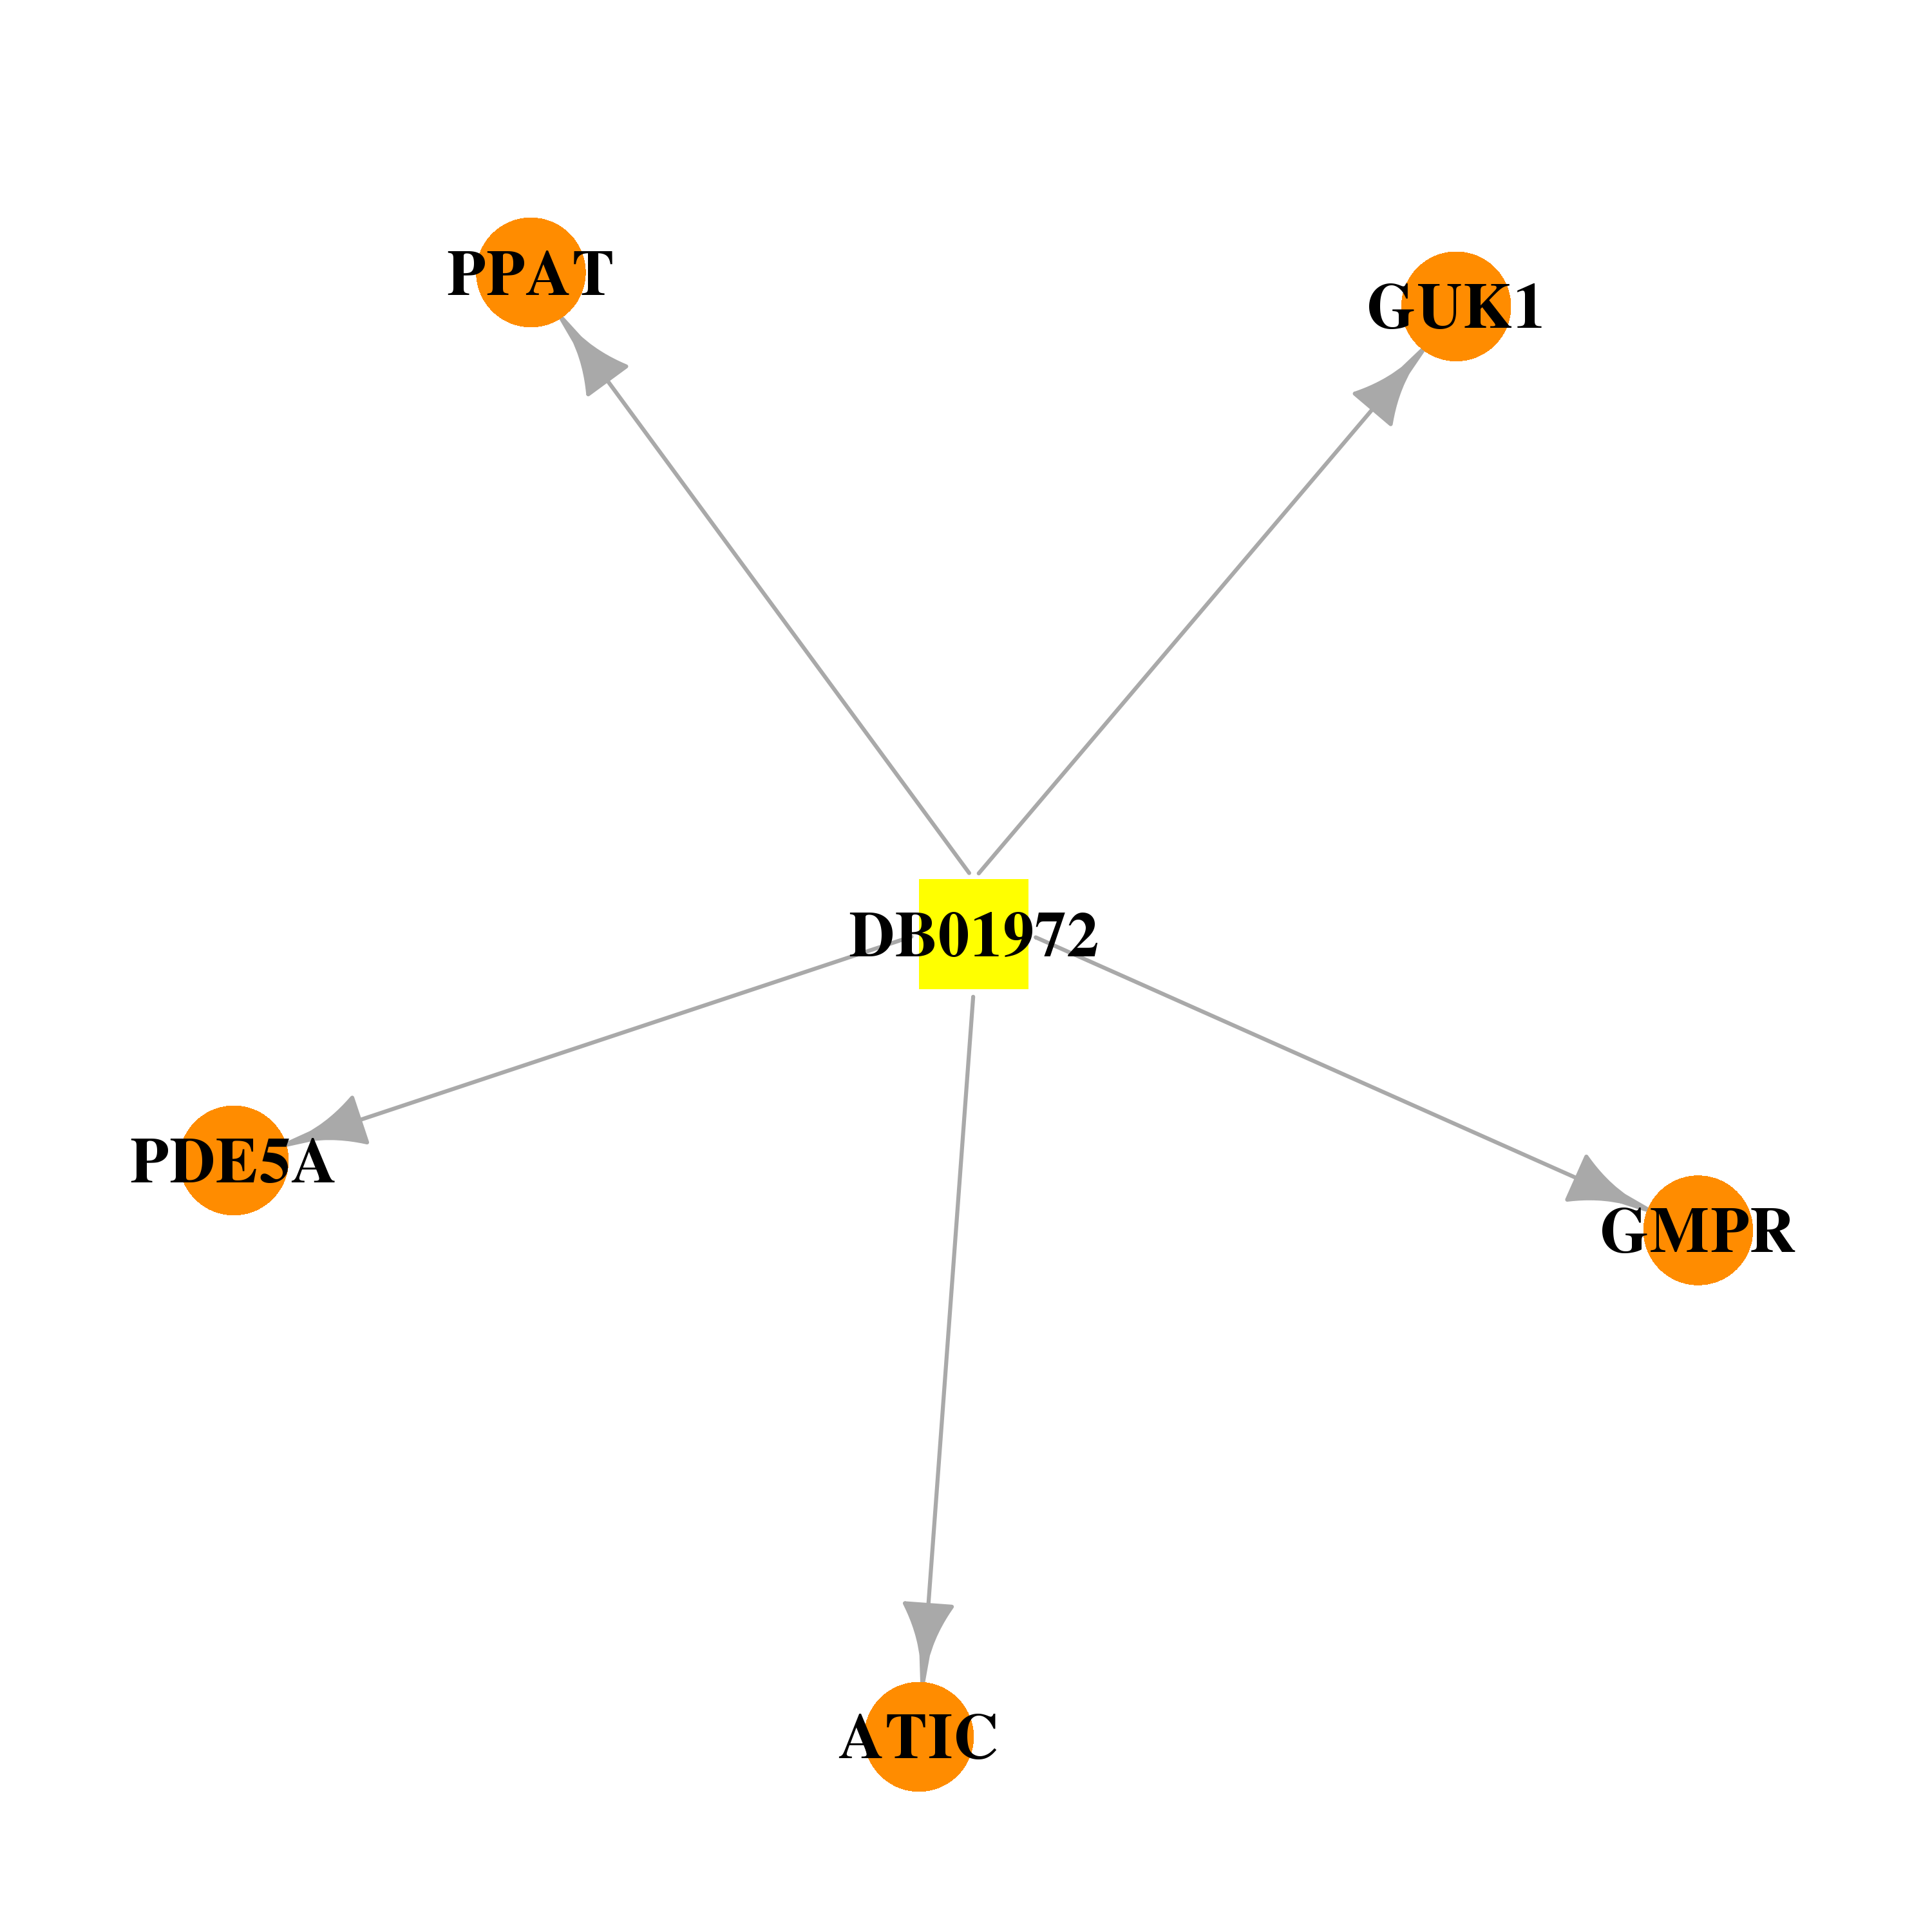 | 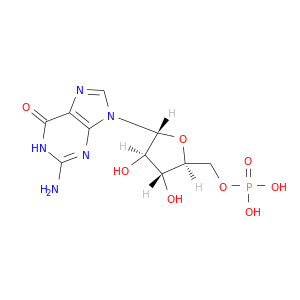 |
| DB03431 | guanylate kinase 1 | experimental | Adenosine-5'-Diphosphate | 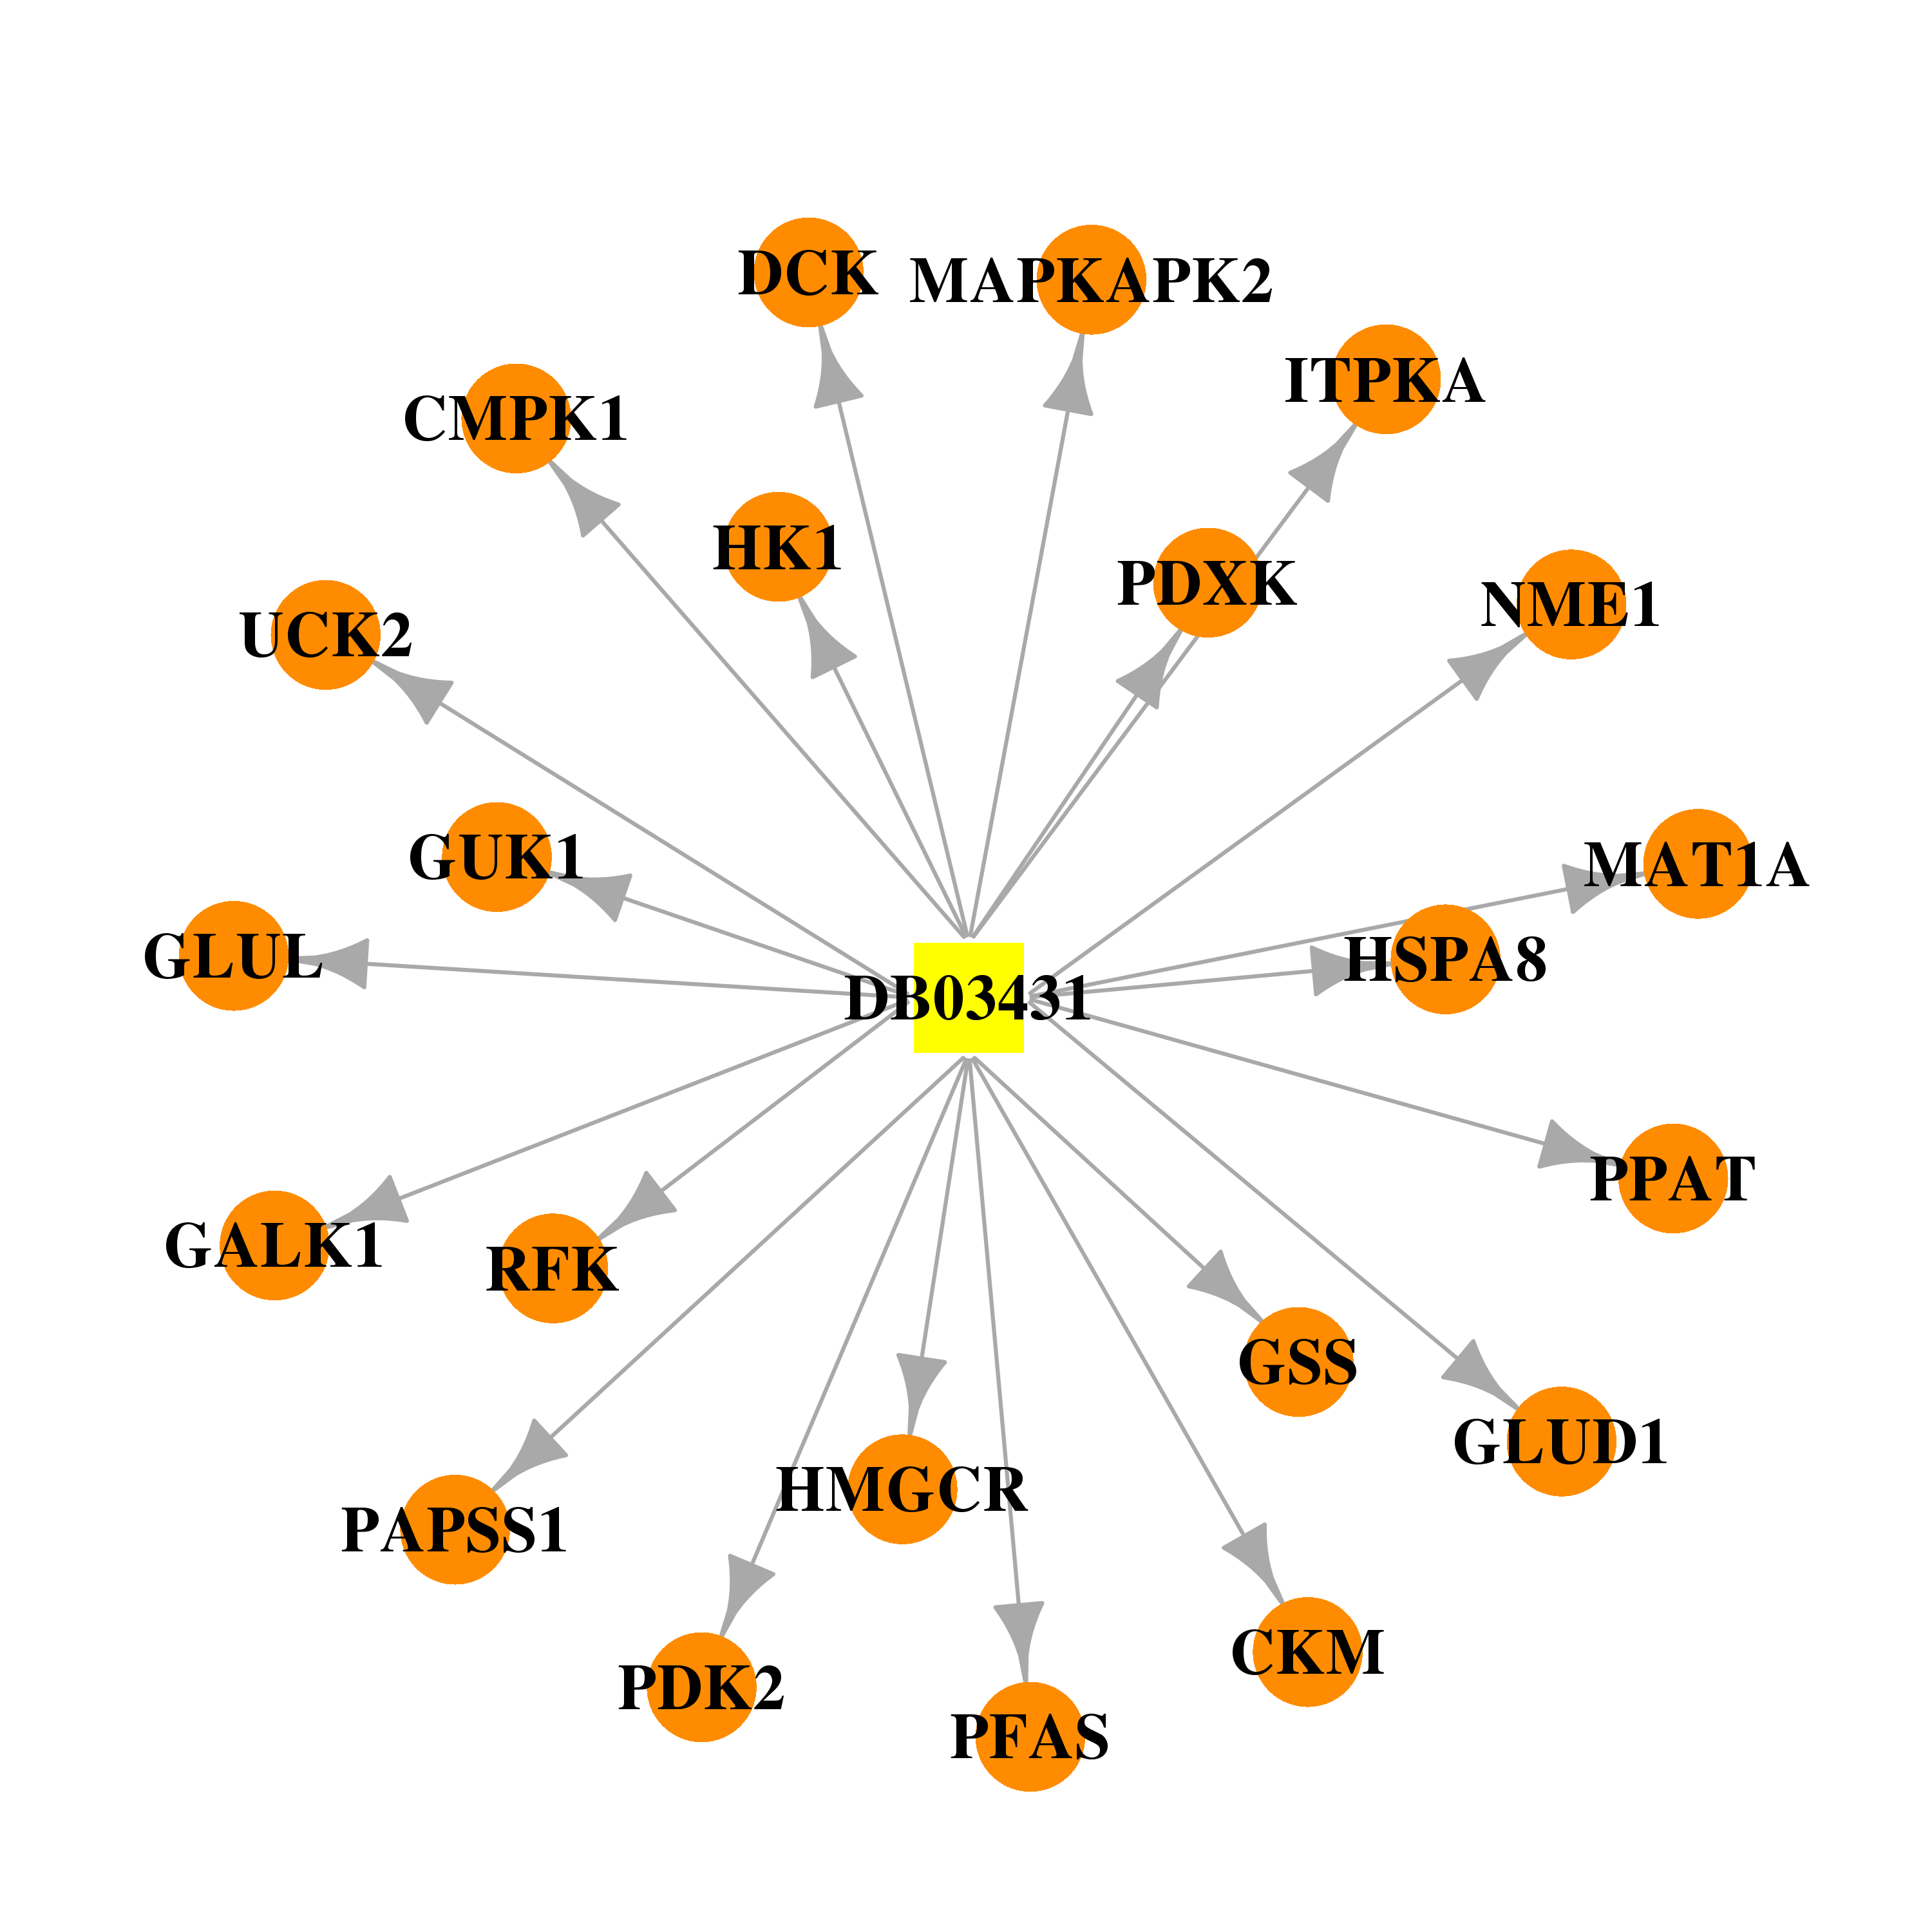 | 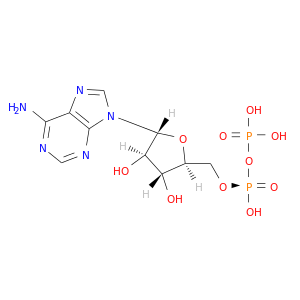 |
| DB01942 | guanylate kinase 1 | experimental | Formic Acid |  |  |
| DB00130 | guanylate kinase 1 | approved; nutraceutical; investigational | L-Glutamine |  |  |
| Top |
| Cross referenced IDs for GUK1 |
| * We obtained these cross-references from Uniprot database. It covers 150 different DBs, 18 categories. http://www.uniprot.org/help/cross_references_section |
: Open all cross reference information
|
Copyright © 2016-Present - The Univsersity of Texas Health Science Center at Houston @ |