|
||||||||||||||||||||
| |
| Phenotypic Information (metabolism pathway, cancer, disease, phenome) |
| |
| |
| Gene-Gene Network Information: Co-Expression Network, Interacting Genes & KEGG |
| |
|


| Gene Summary for ALG5 |
| Basic gene info. | Gene symbol | ALG5 |
| Gene name | ALG5, dolichyl-phosphate beta-glucosyltransferase | |
| Synonyms | bA421P11.2 | |
| Cytomap | UCSC genome browser: 13q13.3 | |
| Genomic location | chr13 :37523907-37573504 | |
| Type of gene | protein-coding | |
| RefGenes | NM_001142364.1, NM_013338.4, | |
| Ensembl id | ENSG00000120697 | |
| Description | Alg5, S. cerevisiae, homolog ofasparagine-linked glycosylation 5 homolog (S. cerevisiae, dolichyl-phosphate beta-glucosyltransferase)asparagine-linked glycosylation 5 homolog (yeast, dolichyl-phosphate beta-glucosyltransferase)asparagine-linked glycosy | |
| Modification date | 20141207 | |
| dbXrefs | MIM : 604565 | |
| HGNC : HGNC | ||
| Ensembl : ENSG00000120697 | ||
| HPRD : 05193 | ||
| Vega : OTTHUMG00000016741 | ||
| Protein | UniProt: go to UniProt's Cross Reference DB Table | |
| Expression | CleanEX: HS_ALG5 | |
| BioGPS: 29880 | ||
| Gene Expression Atlas: ENSG00000120697 | ||
| The Human Protein Atlas: ENSG00000120697 | ||
| Pathway | NCI Pathway Interaction Database: ALG5 | |
| KEGG: ALG5 | ||
| REACTOME: ALG5 | ||
| ConsensusPathDB | ||
| Pathway Commons: ALG5 | ||
| Metabolism | MetaCyc: ALG5 | |
| HUMANCyc: ALG5 | ||
| Regulation | Ensembl's Regulation: ENSG00000120697 | |
| miRBase: chr13 :37,523,907-37,573,504 | ||
| TargetScan: NM_001142364 | ||
| cisRED: ENSG00000120697 | ||
| Context | iHOP: ALG5 | |
| cancer metabolism search in PubMed: ALG5 | ||
| UCL Cancer Institute: ALG5 | ||
| Assigned class in ccmGDB | C | |
| Top |
| Phenotypic Information for ALG5(metabolism pathway, cancer, disease, phenome) |
| Cancer | CGAP: ALG5 |
| Familial Cancer Database: ALG5 | |
| * This gene is included in those cancer gene databases. |
|
|
|
|
|
| . | ||||||||||||||
Oncogene 1 | Significant driver gene in | |||||||||||||||||||
| cf) number; DB name 1 Oncogene; http://nar.oxfordjournals.org/content/35/suppl_1/D721.long, 2 Tumor Suppressor gene; https://bioinfo.uth.edu/TSGene/, 3 Cancer Gene Census; http://www.nature.com/nrc/journal/v4/n3/abs/nrc1299.html, 4 CancerGenes; http://nar.oxfordjournals.org/content/35/suppl_1/D721.long, 5 Network of Cancer Gene; http://ncg.kcl.ac.uk/index.php, 1Therapeutic Vulnerabilities in Cancer; http://cbio.mskcc.org/cancergenomics/statius/ |
| REACTOME_METABOLISM_OF_PROTEINS | |
| OMIM | |
| Orphanet | |
| Disease | KEGG Disease: ALG5 |
| MedGen: ALG5 (Human Medical Genetics with Condition) | |
| ClinVar: ALG5 | |
| Phenotype | MGI: ALG5 (International Mouse Phenotyping Consortium) |
| PhenomicDB: ALG5 | |
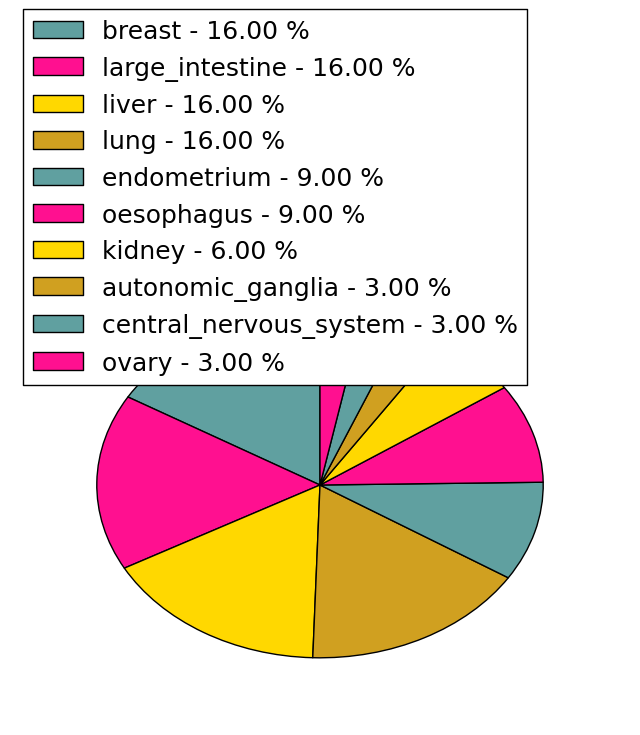
| Mutations for ALG5 |
| * Under tables are showing count per each tissue to give us broad intuition about tissue specific mutation patterns.You can go to the detailed page for each mutation database's web site. |
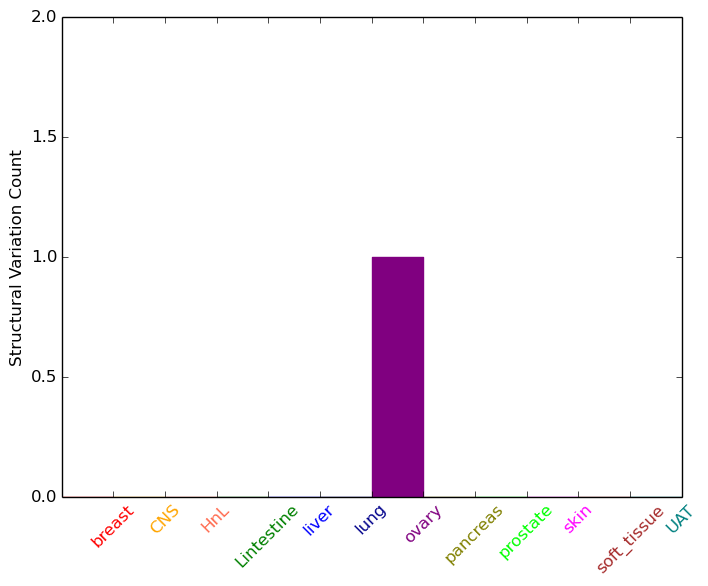
| - Statistics for Tissue and Mutation type | Top |
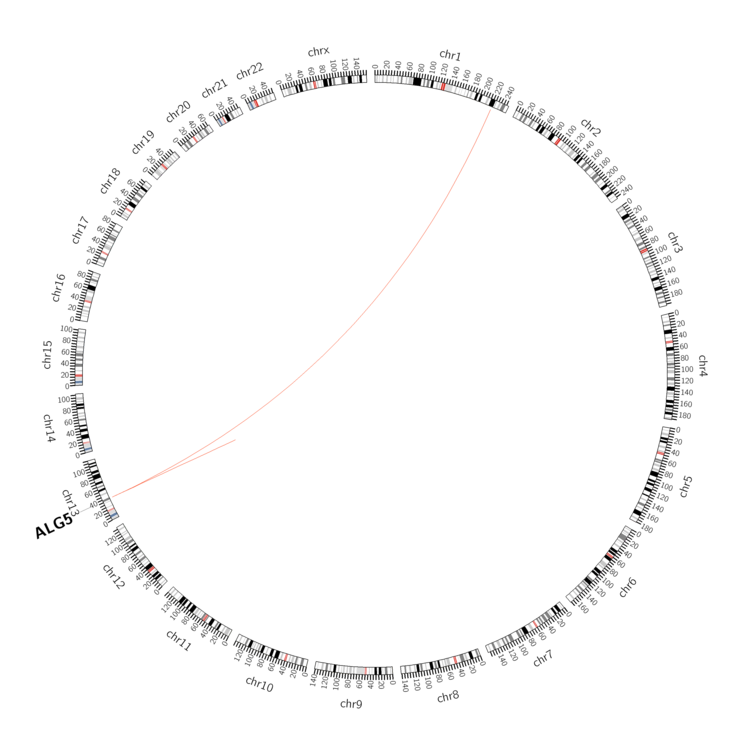 |
| - For Inter-chromosomal Variations |
| * Inter-chromosomal variantions includes 'interchromosomal amplicon to amplicon', 'interchromosomal amplicon to non-amplified dna', 'interchromosomal insertion', 'Interchromosomal unknown type'. |
 |
| - For Intra-chromosomal Variations |
| * Intra-chromosomal variantions includes 'intrachromosomal amplicon to amplicon', 'intrachromosomal amplicon to non-amplified dna', 'intrachromosomal deletion', 'intrachromosomal fold-back inversion', 'intrachromosomal inversion', 'intrachromosomal tandem duplication', 'Intrachromosomal unknown type', 'intrachromosomal with inverted orientation', 'intrachromosomal with non-inverted orientation'. |
 |
| Sample | Symbol_a | Chr_a | Start_a | End_a | Symbol_b | Chr_b | Start_b | End_b |
| ovary | ALG5 | chr13 | 37545544 | 37545564 | ALG5 | chr13 | 37545798 | 37545818 |
| ovary | ALG5 | chr13 | 37568744 | 37568764 | chr1 | 221362755 | 221362775 |
| cf) Tissue number; Tissue name (1;Breast, 2;Central_nervous_system, 3;Haematopoietic_and_lymphoid_tissue, 4;Large_intestine, 5;Liver, 6;Lung, 7;Ovary, 8;Pancreas, 9;Prostate, 10;Skin, 11;Soft_tissue, 12;Upper_aerodigestive_tract) |
| * From mRNA Sanger sequences, Chitars2.0 arranged chimeric transcripts. This table shows ALG5 related fusion information. |
| ID | Head Gene | Tail Gene | Accession | Gene_a | qStart_a | qEnd_a | Chromosome_a | tStart_a | tEnd_a | Gene_a | qStart_a | qEnd_a | Chromosome_a | tStart_a | tEnd_a |
| HM245395 | PIGU | 1 | 230 | 20 | 33203846 | 33225710 | ALG5 | 218 | 616 | 13 | 37524107 | 37546195 | |
| HM245394 | ALG5 | 1 | 272 | 13 | 37559764 | 37567805 | PIGU | 273 | 750 | 20 | 33162997 | 33176411 | |
| BF815383 | ALG5 | 4 | 306 | 13 | 37524095 | 37539828 | PRKCA | 306 | 486 | 17 | 64524798 | 64524978 | |
| Top |
| There's no copy number variation information in COSMIC data for this gene. |
| Top |
|
 |
| Top |
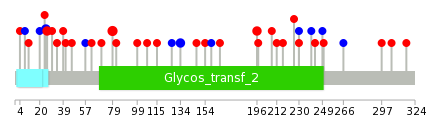
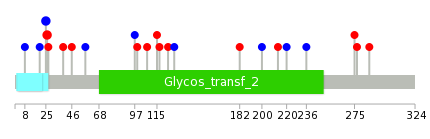
| Stat. for Non-Synonymous SNVs (# total SNVs=31) | (# total SNVs=5) |
 |  |
(# total SNVs=0) | (# total SNVs=0) |
| Top |
| * When you move the cursor on each content, you can see more deailed mutation information on the Tooltip. Those are primary_site,primary_histology,mutation(aa),pubmedID. |
| GRCh37 position | Mutation(aa) | Unique sampleID count |
| chr13:37569565-37569565 | p.R79W | 3 |
| chr13:37524129-37524129 | p.R309* | 3 |
| chr13:37563723-37563723 | p.? | 2 |
| chr13:37546148-37546148 | p.S196C | 2 |
| chr13:37569724-37569724 | p.V26I | 2 |
| chr13:37569725-37569725 | p.I25I | 2 |
| chr13:37563666-37563666 | p.V134V | 2 |
| chr13:37539835-37539835 | p.Y217C | 1 |
| chr13:37573428-37573428 | p.L4F | 1 |
| chr13:37563687-37563687 | p.Y127Y | 1 |
| Top |
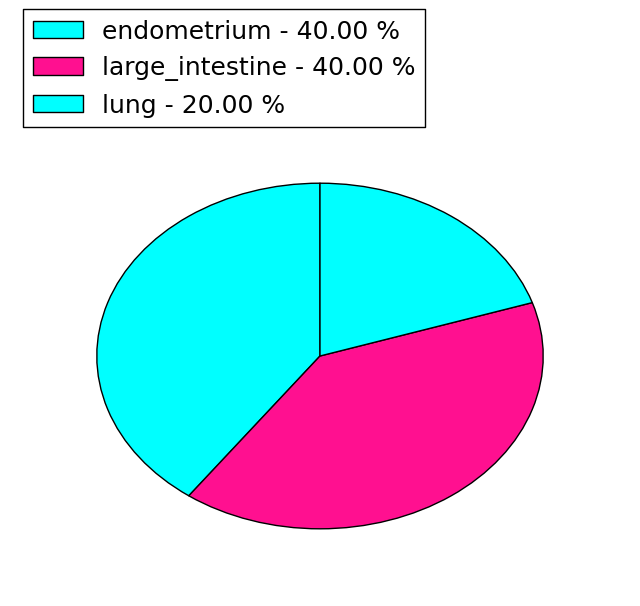
|
 |
| Point Mutation/ Tissue ID | 1 | 2 | 3 | 4 | 5 | 6 | 7 | 8 | 9 | 10 | 11 | 12 | 13 | 14 | 15 | 16 | 17 | 18 | 19 | 20 |
| # sample | 1 | 1 | 5 | 1 | 1 | 3 | 6 | 2 | 3 | |||||||||||
| # mutation | 1 | 1 | 4 | 1 | 1 | 3 | 6 | 2 | 2 | |||||||||||
| nonsynonymous SNV | 1 | 3 | 1 | 1 | 2 | 2 | 1 | 1 | ||||||||||||
| synonymous SNV | 1 | 1 | 1 | 4 | 1 | 1 |
| cf) Tissue ID; Tissue type (1; BLCA[Bladder Urothelial Carcinoma], 2; BRCA[Breast invasive carcinoma], 3; CESC[Cervical squamous cell carcinoma and endocervical adenocarcinoma], 4; COAD[Colon adenocarcinoma], 5; GBM[Glioblastoma multiforme], 6; Glioma Low Grade, 7; HNSC[Head and Neck squamous cell carcinoma], 8; KICH[Kidney Chromophobe], 9; KIRC[Kidney renal clear cell carcinoma], 10; KIRP[Kidney renal papillary cell carcinoma], 11; LAML[Acute Myeloid Leukemia], 12; LUAD[Lung adenocarcinoma], 13; LUSC[Lung squamous cell carcinoma], 14; OV[Ovarian serous cystadenocarcinoma ], 15; PAAD[Pancreatic adenocarcinoma], 16; PRAD[Prostate adenocarcinoma], 17; SKCM[Skin Cutaneous Melanoma], 18:STAD[Stomach adenocarcinoma], 19:THCA[Thyroid carcinoma], 20:UCEC[Uterine Corpus Endometrial Carcinoma]) |
| Top |
| * We represented just top 10 SNVs. When you move the cursor on each content, you can see more deailed mutation information on the Tooltip. Those are primary_site, primary_histology, mutation(aa), pubmedID. |
| Genomic Position | Mutation(aa) | Unique sampleID count |
| chr13:37569724 | p.I25I,ALG5 | 2 |
| chr13:37569725 | p.V26I,ALG5 | 2 |
| chr13:37524141 | p.F220F,ALG5 | 1 |
| chr13:37567776 | p.R213L,ALG5 | 1 |
| chr13:37526712 | p.L20L,ALG5 | 1 |
| chr13:37567800 | p.G200G,ALG5 | 1 |
| chr13:37539735 | p.L8L,ALG5 | 1 |
| chr13:37569629 | p.R182H,ALG5 | 1 |
| chr13:37539757 | p.I129I,ALG5 | 1 |
| chr13:37569662 | p.S124Y,ALG5 | 1 |
| * Copy number data were extracted from TCGA using R package TCGA-Assembler. The URLs of all public data files on TCGA DCC data server were gathered on Jan-05-2015. Function ProcessCNAData in TCGA-Assembler package was used to obtain gene-level copy number value which is calculated as the average copy number of the genomic region of a gene. |
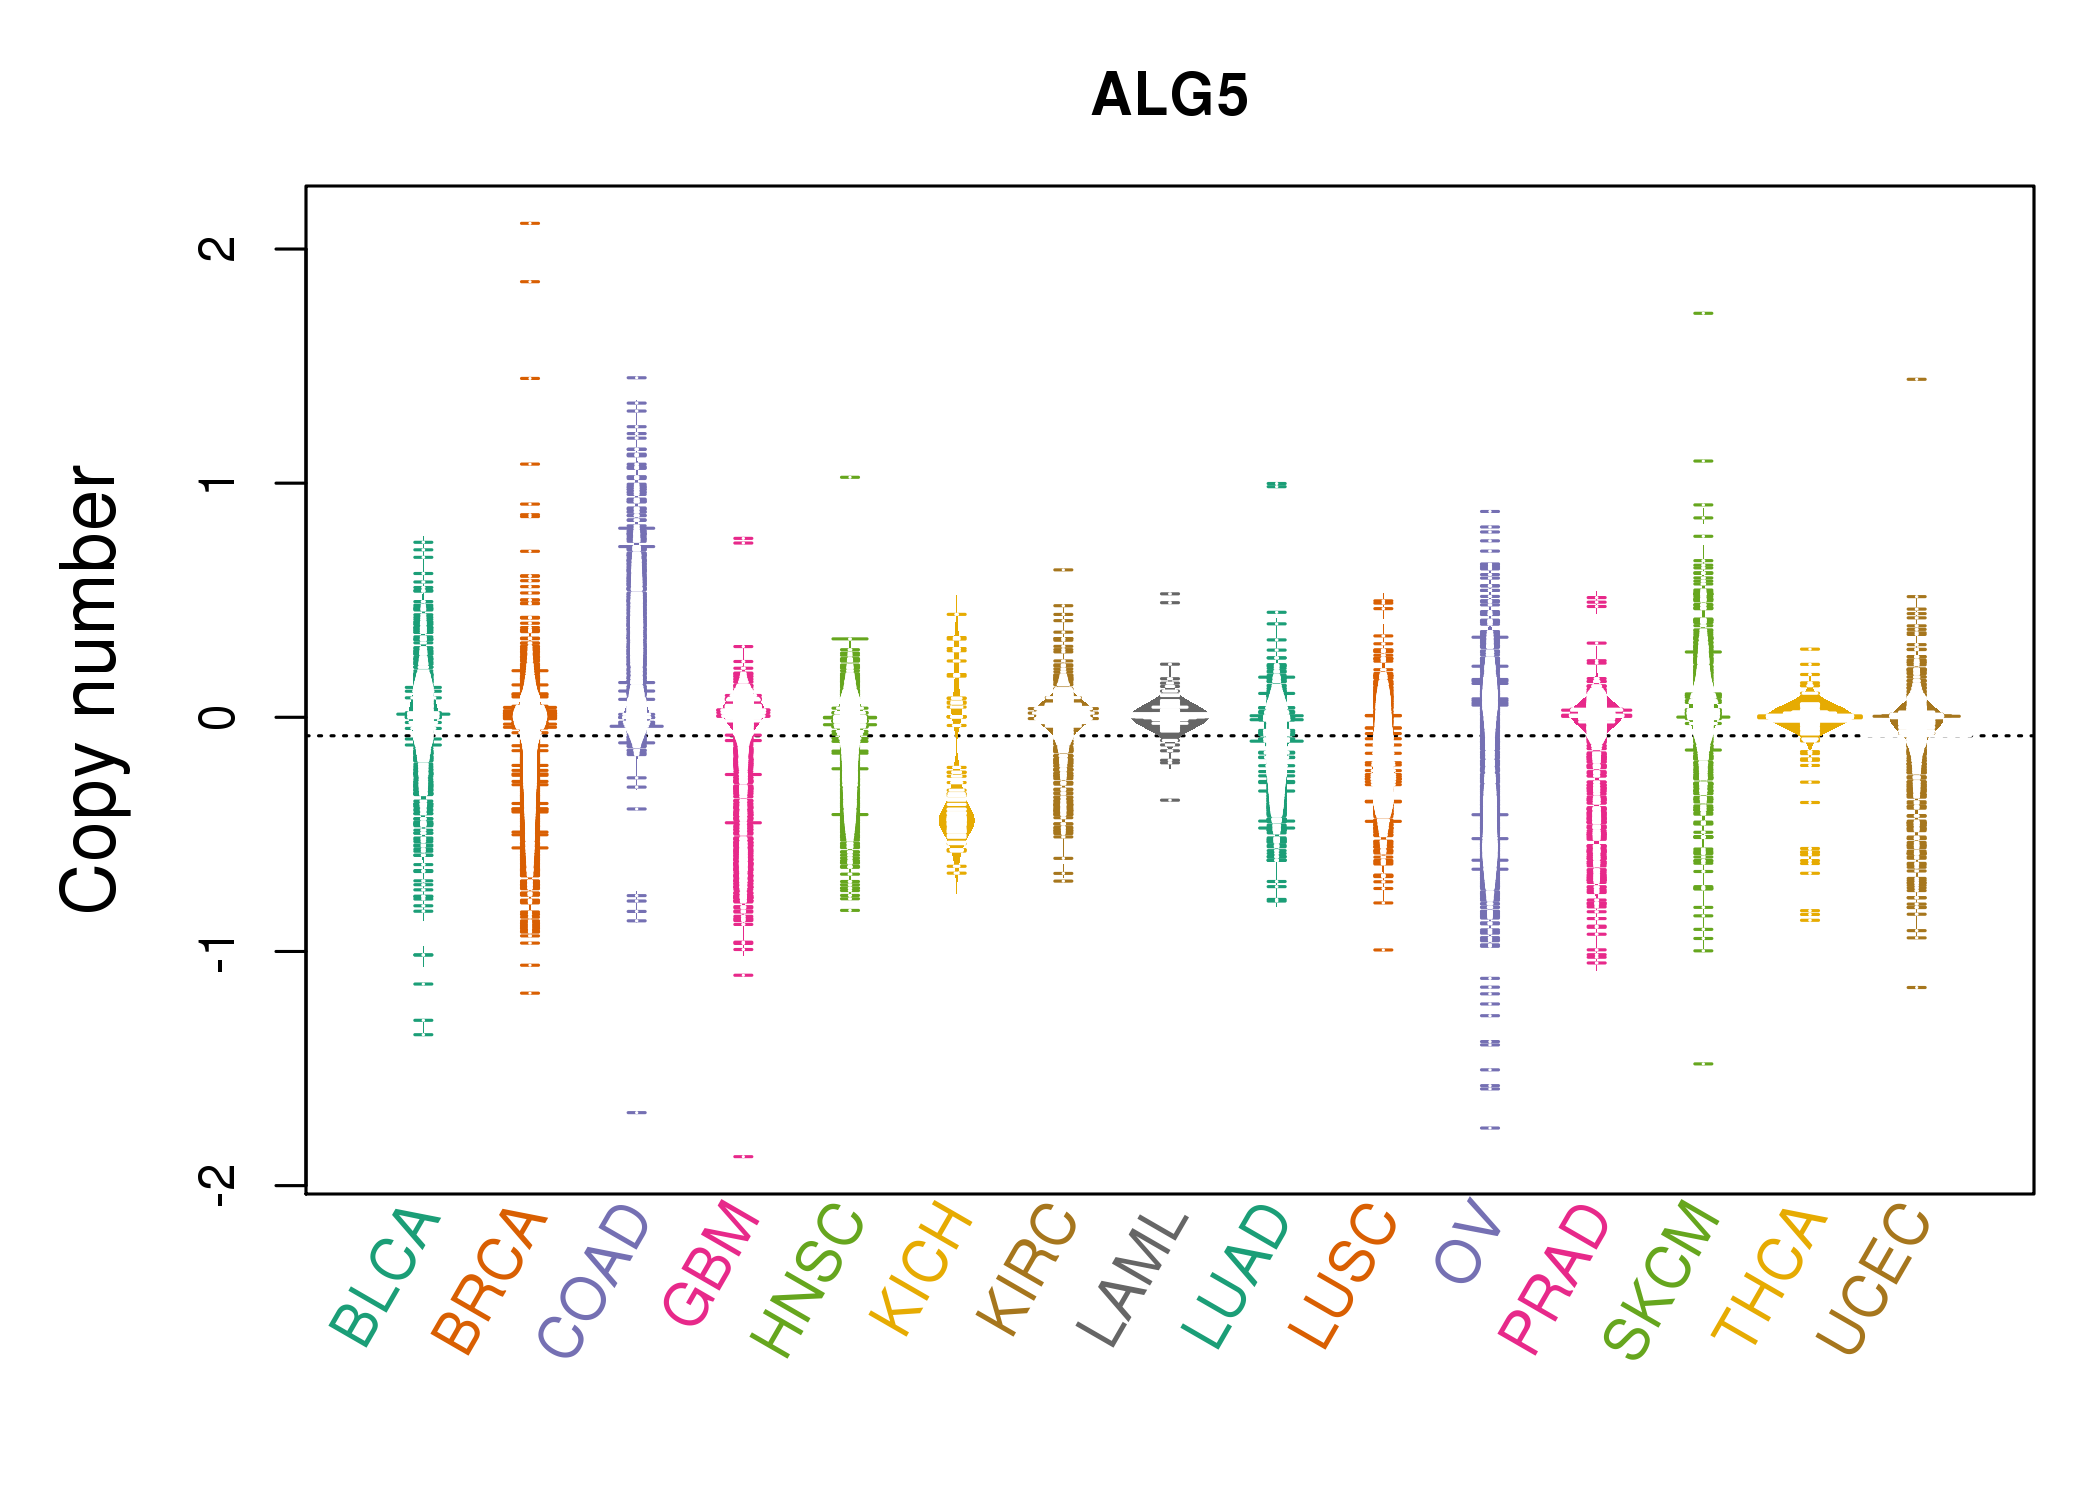 |
| cf) Tissue ID[Tissue type]: BLCA[Bladder Urothelial Carcinoma], BRCA[Breast invasive carcinoma], CESC[Cervical squamous cell carcinoma and endocervical adenocarcinoma], COAD[Colon adenocarcinoma], GBM[Glioblastoma multiforme], Glioma Low Grade, HNSC[Head and Neck squamous cell carcinoma], KICH[Kidney Chromophobe], KIRC[Kidney renal clear cell carcinoma], KIRP[Kidney renal papillary cell carcinoma], LAML[Acute Myeloid Leukemia], LUAD[Lung adenocarcinoma], LUSC[Lung squamous cell carcinoma], OV[Ovarian serous cystadenocarcinoma ], PAAD[Pancreatic adenocarcinoma], PRAD[Prostate adenocarcinoma], SKCM[Skin Cutaneous Melanoma], STAD[Stomach adenocarcinoma], THCA[Thyroid carcinoma], UCEC[Uterine Corpus Endometrial Carcinoma] |
| Top |
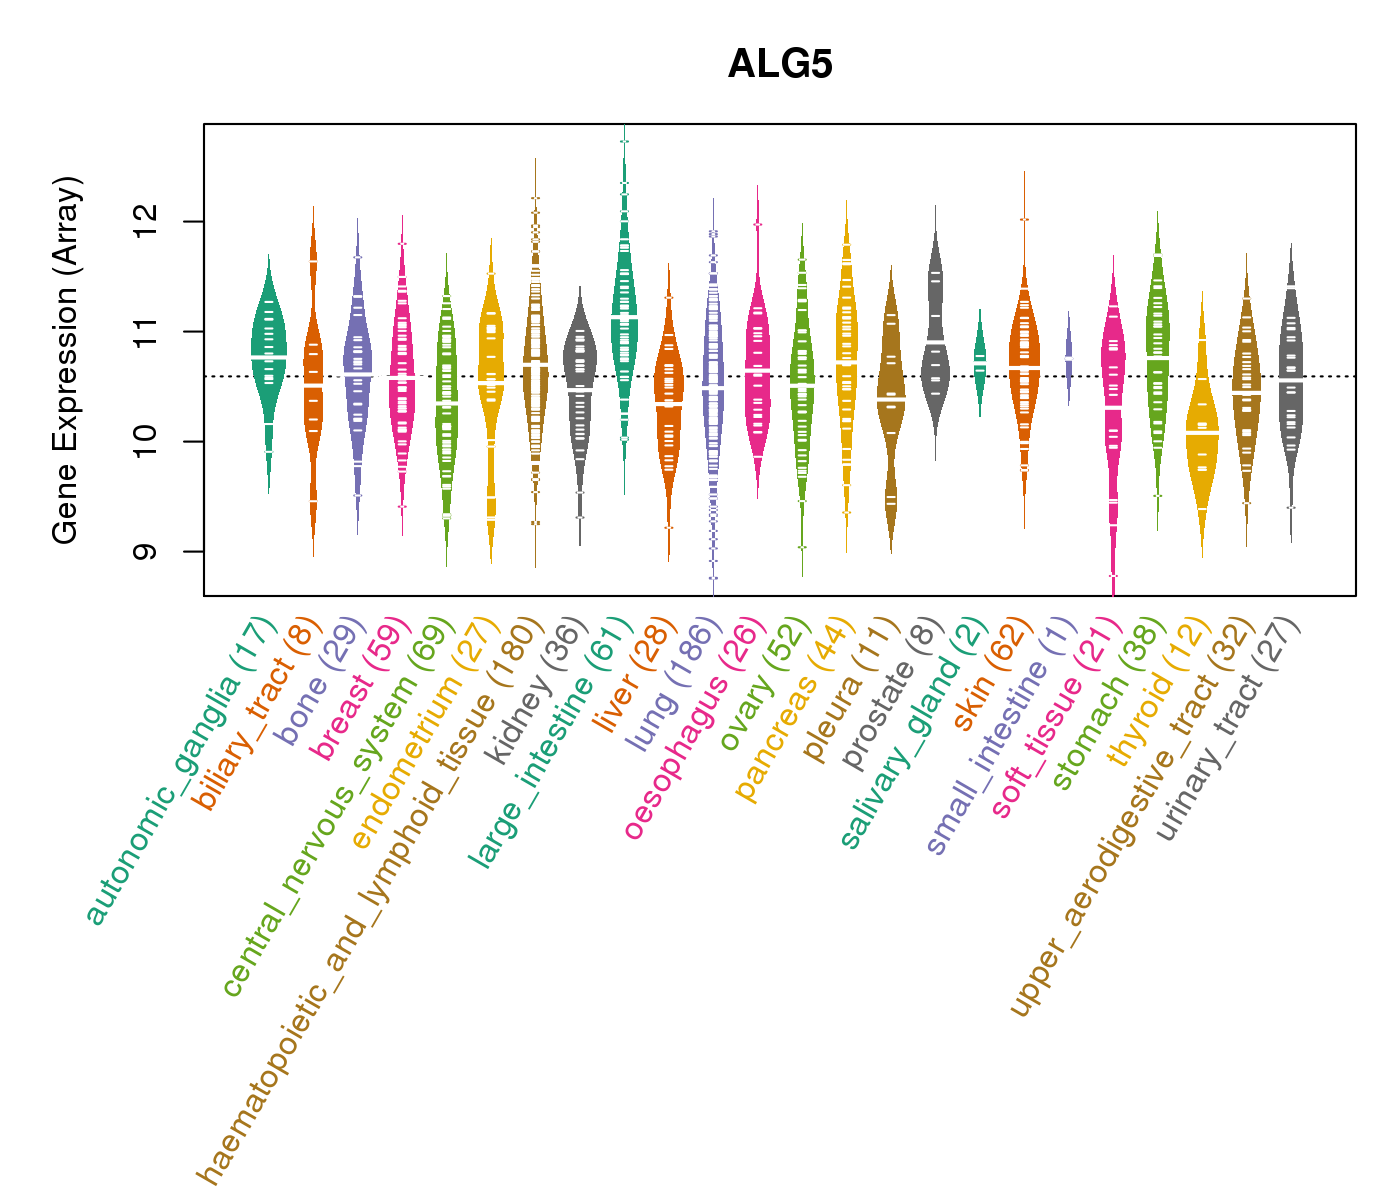
| Gene Expression for ALG5 |
| * CCLE gene expression data were extracted from CCLE_Expression_Entrez_2012-10-18.res: Gene-centric RMA-normalized mRNA expression data. |
 |
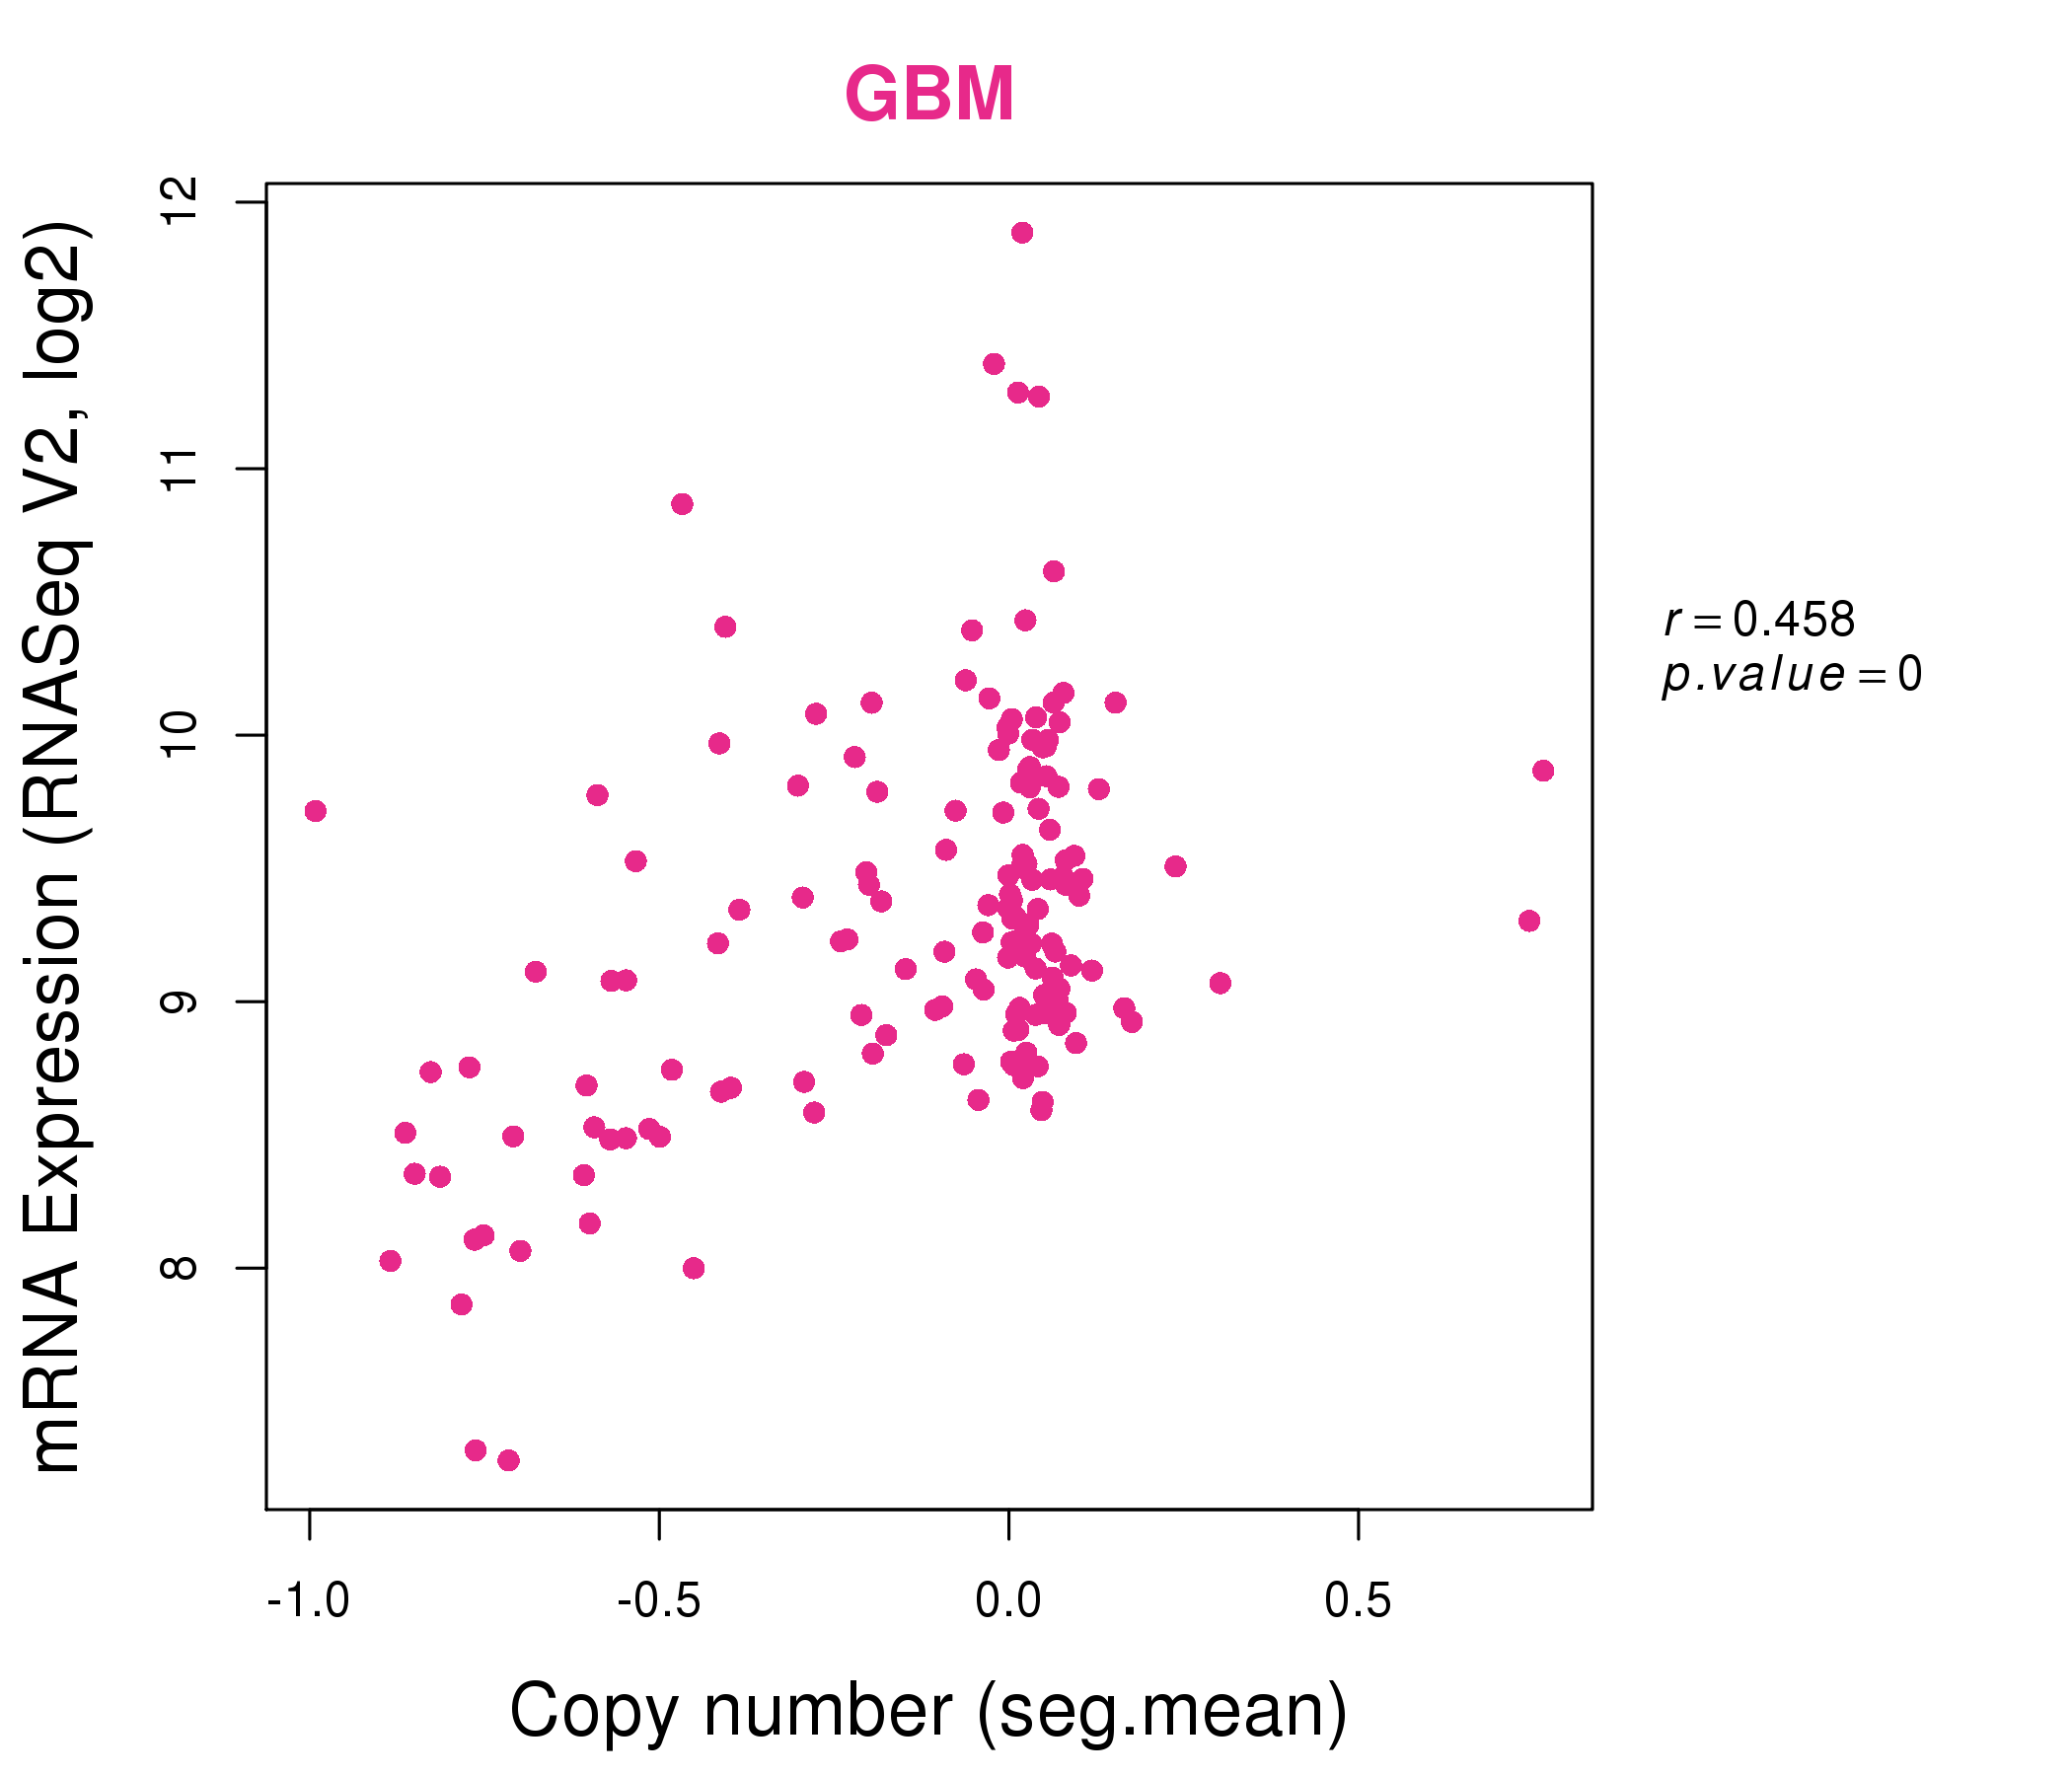
| * Normalized gene expression data of RNASeqV2 was extracted from TCGA using R package TCGA-Assembler. The URLs of all public data files on TCGA DCC data server were gathered at Jan-05-2015. Only eight cancer types have enough normal control samples for differential expression analysis. (t test, adjusted p<0.05 (using Benjamini-Hochberg FDR)) |
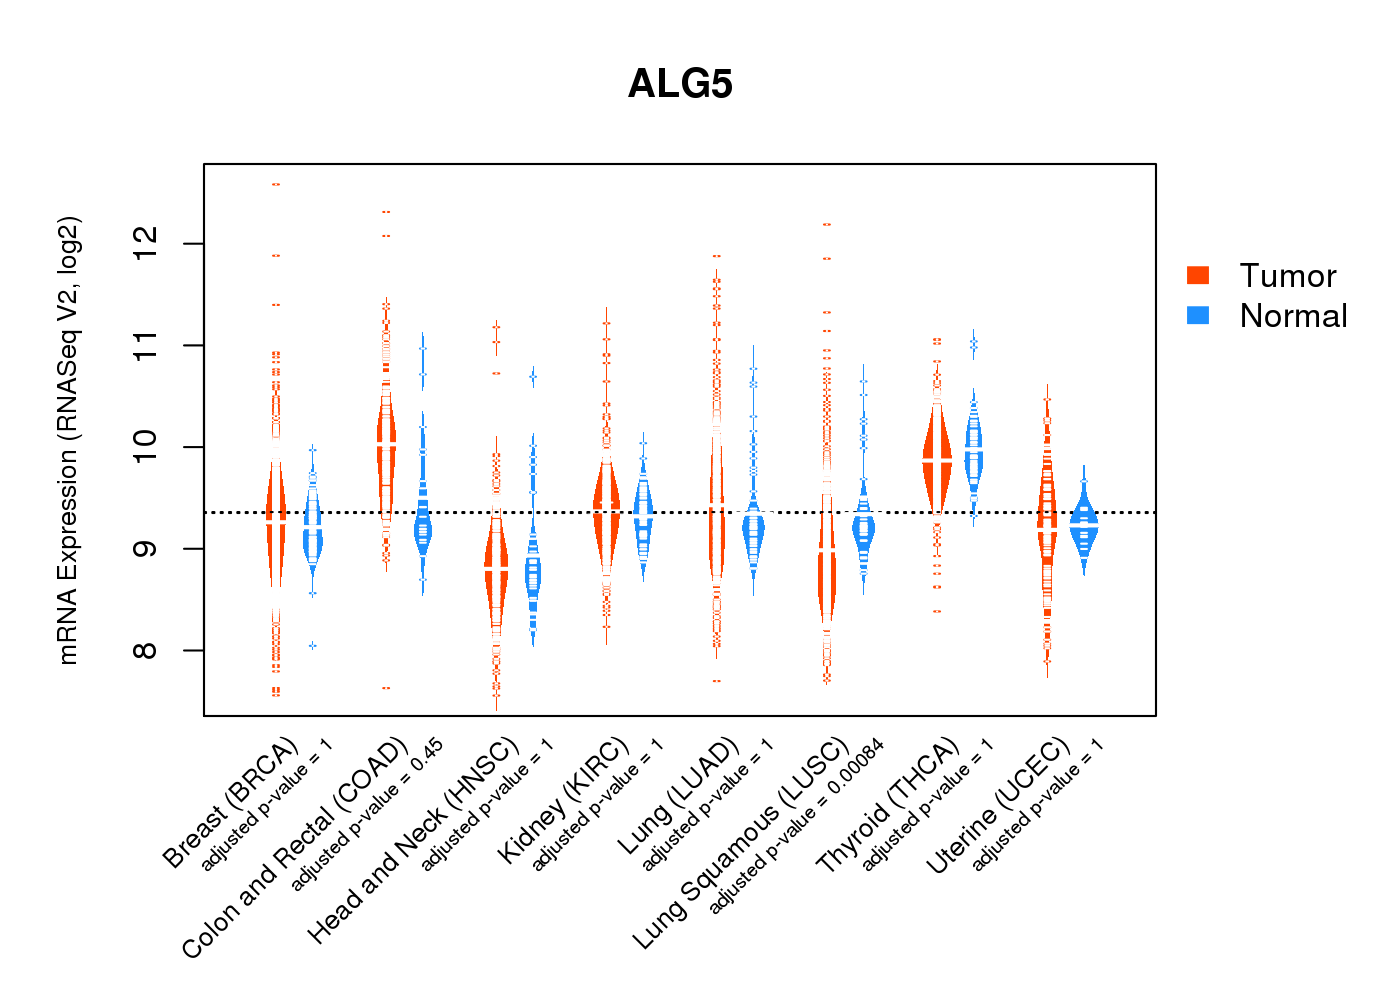 |
| Top |
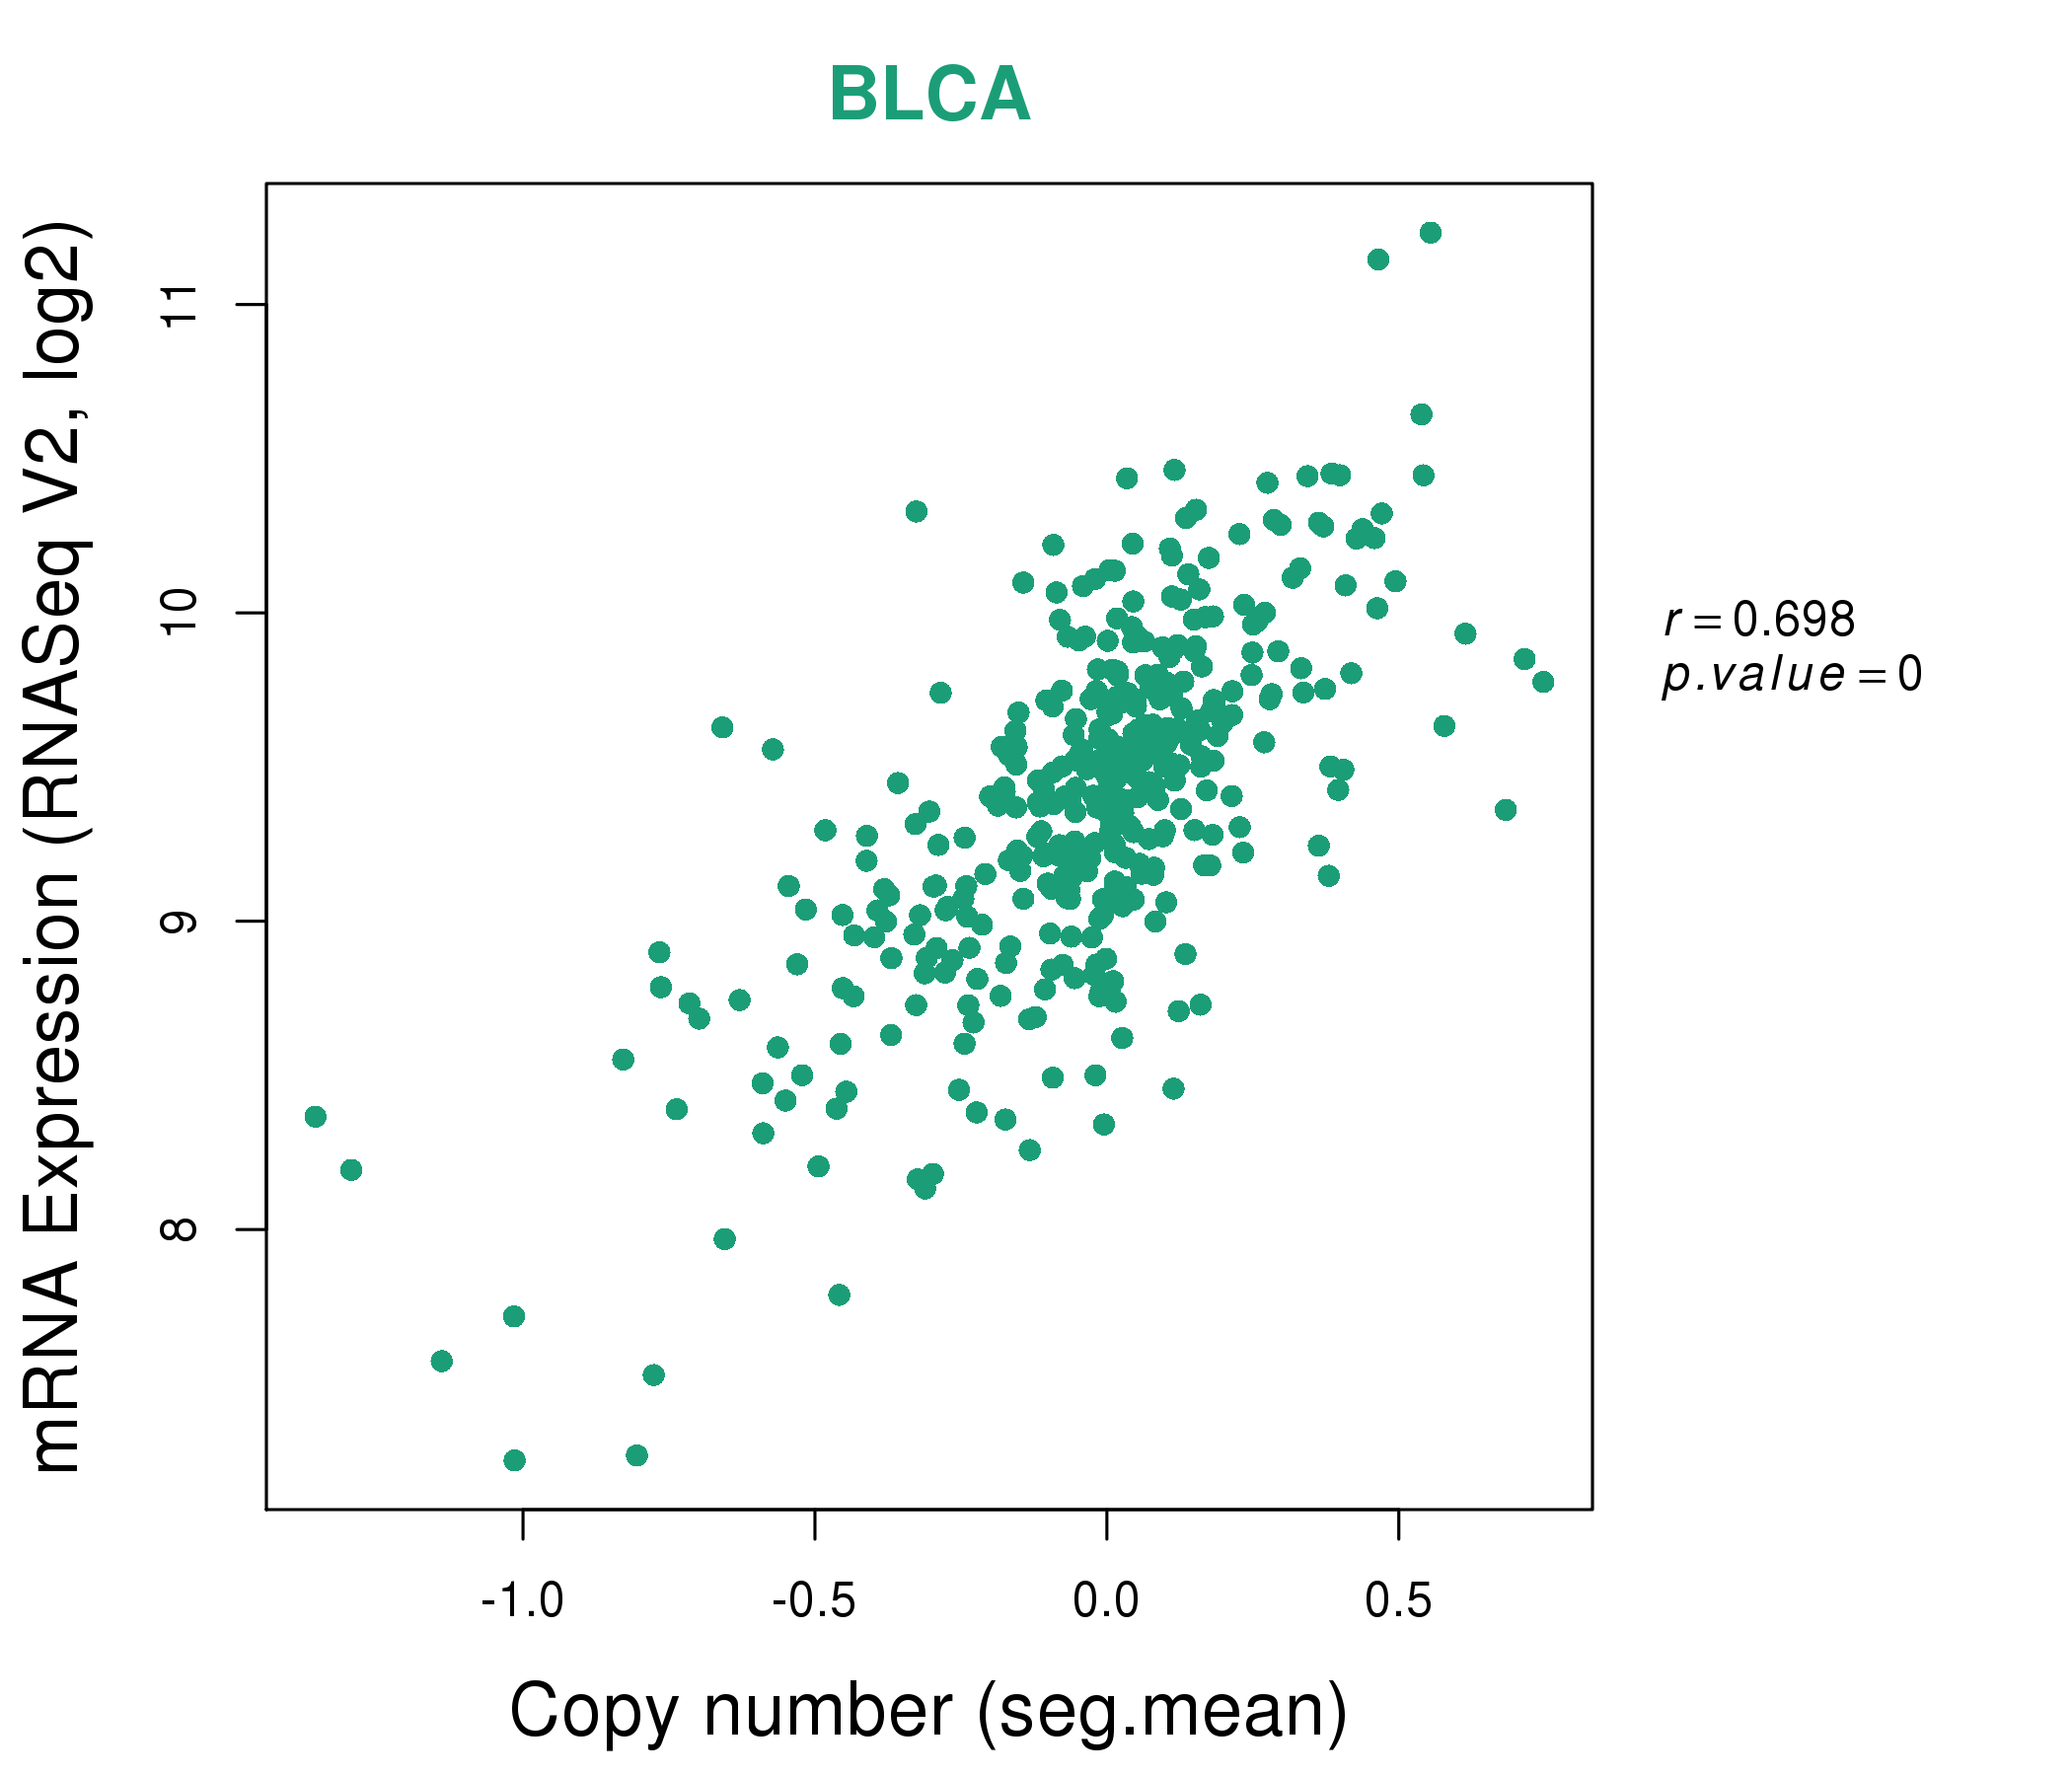
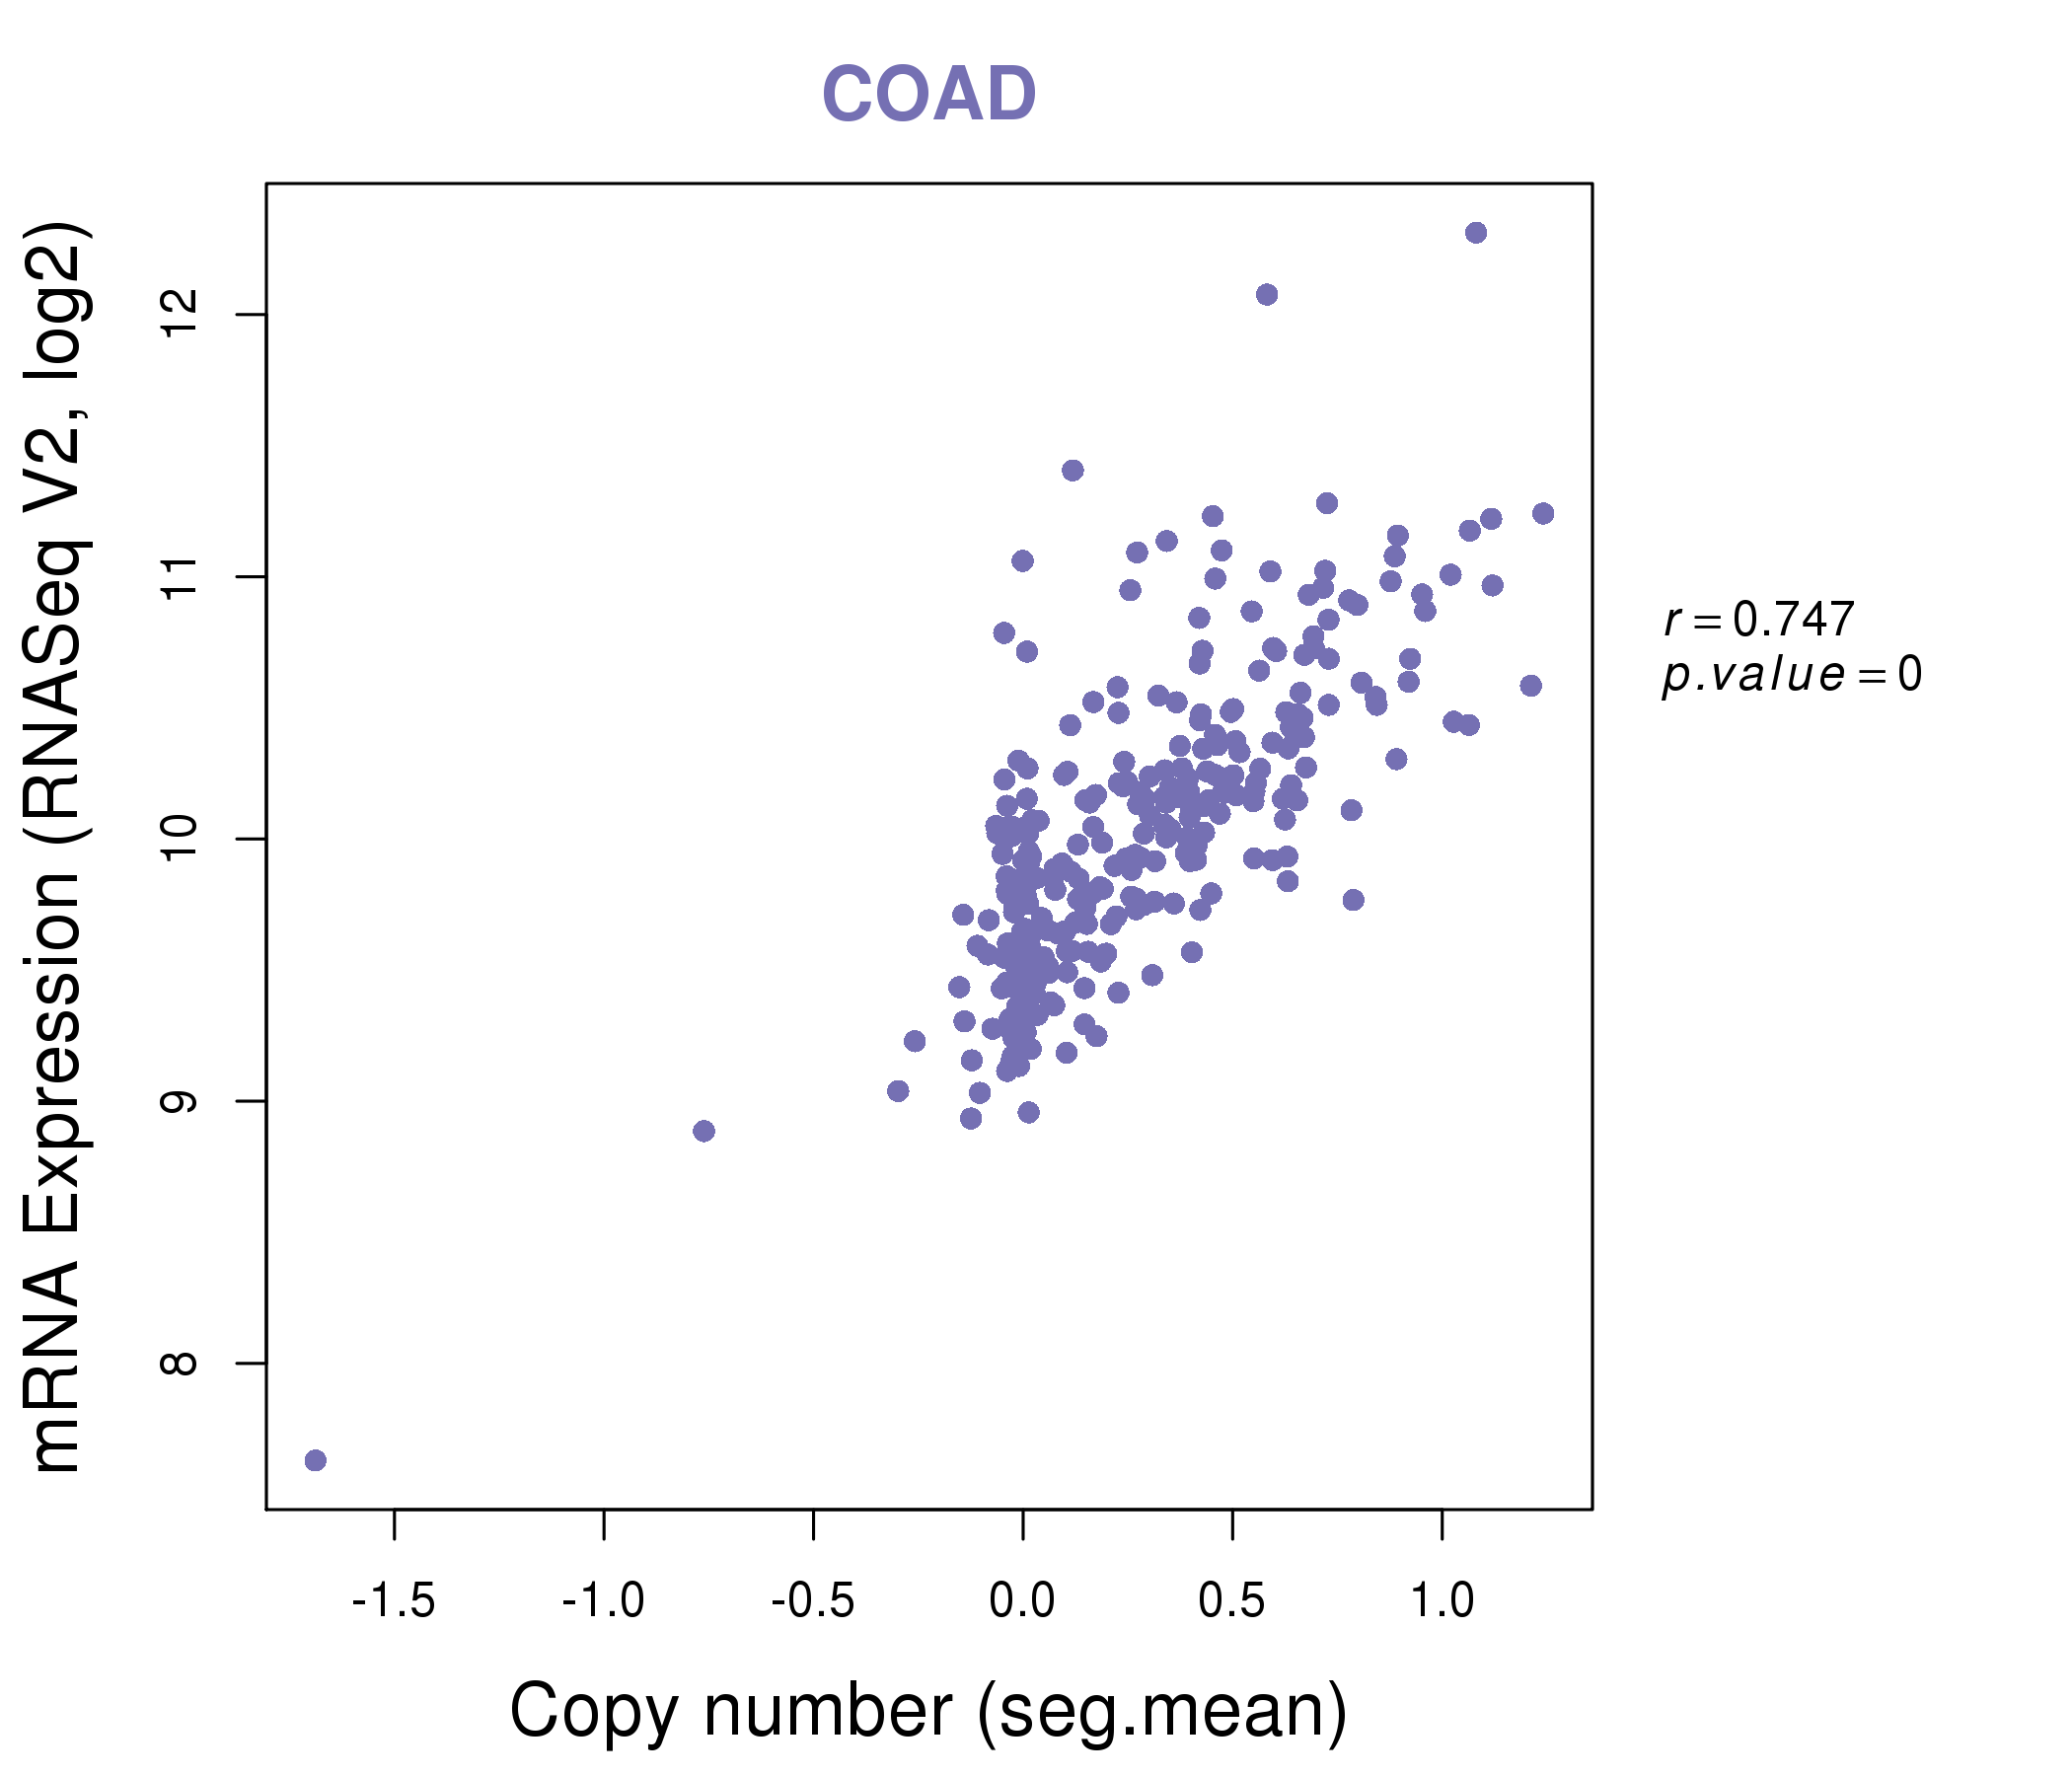
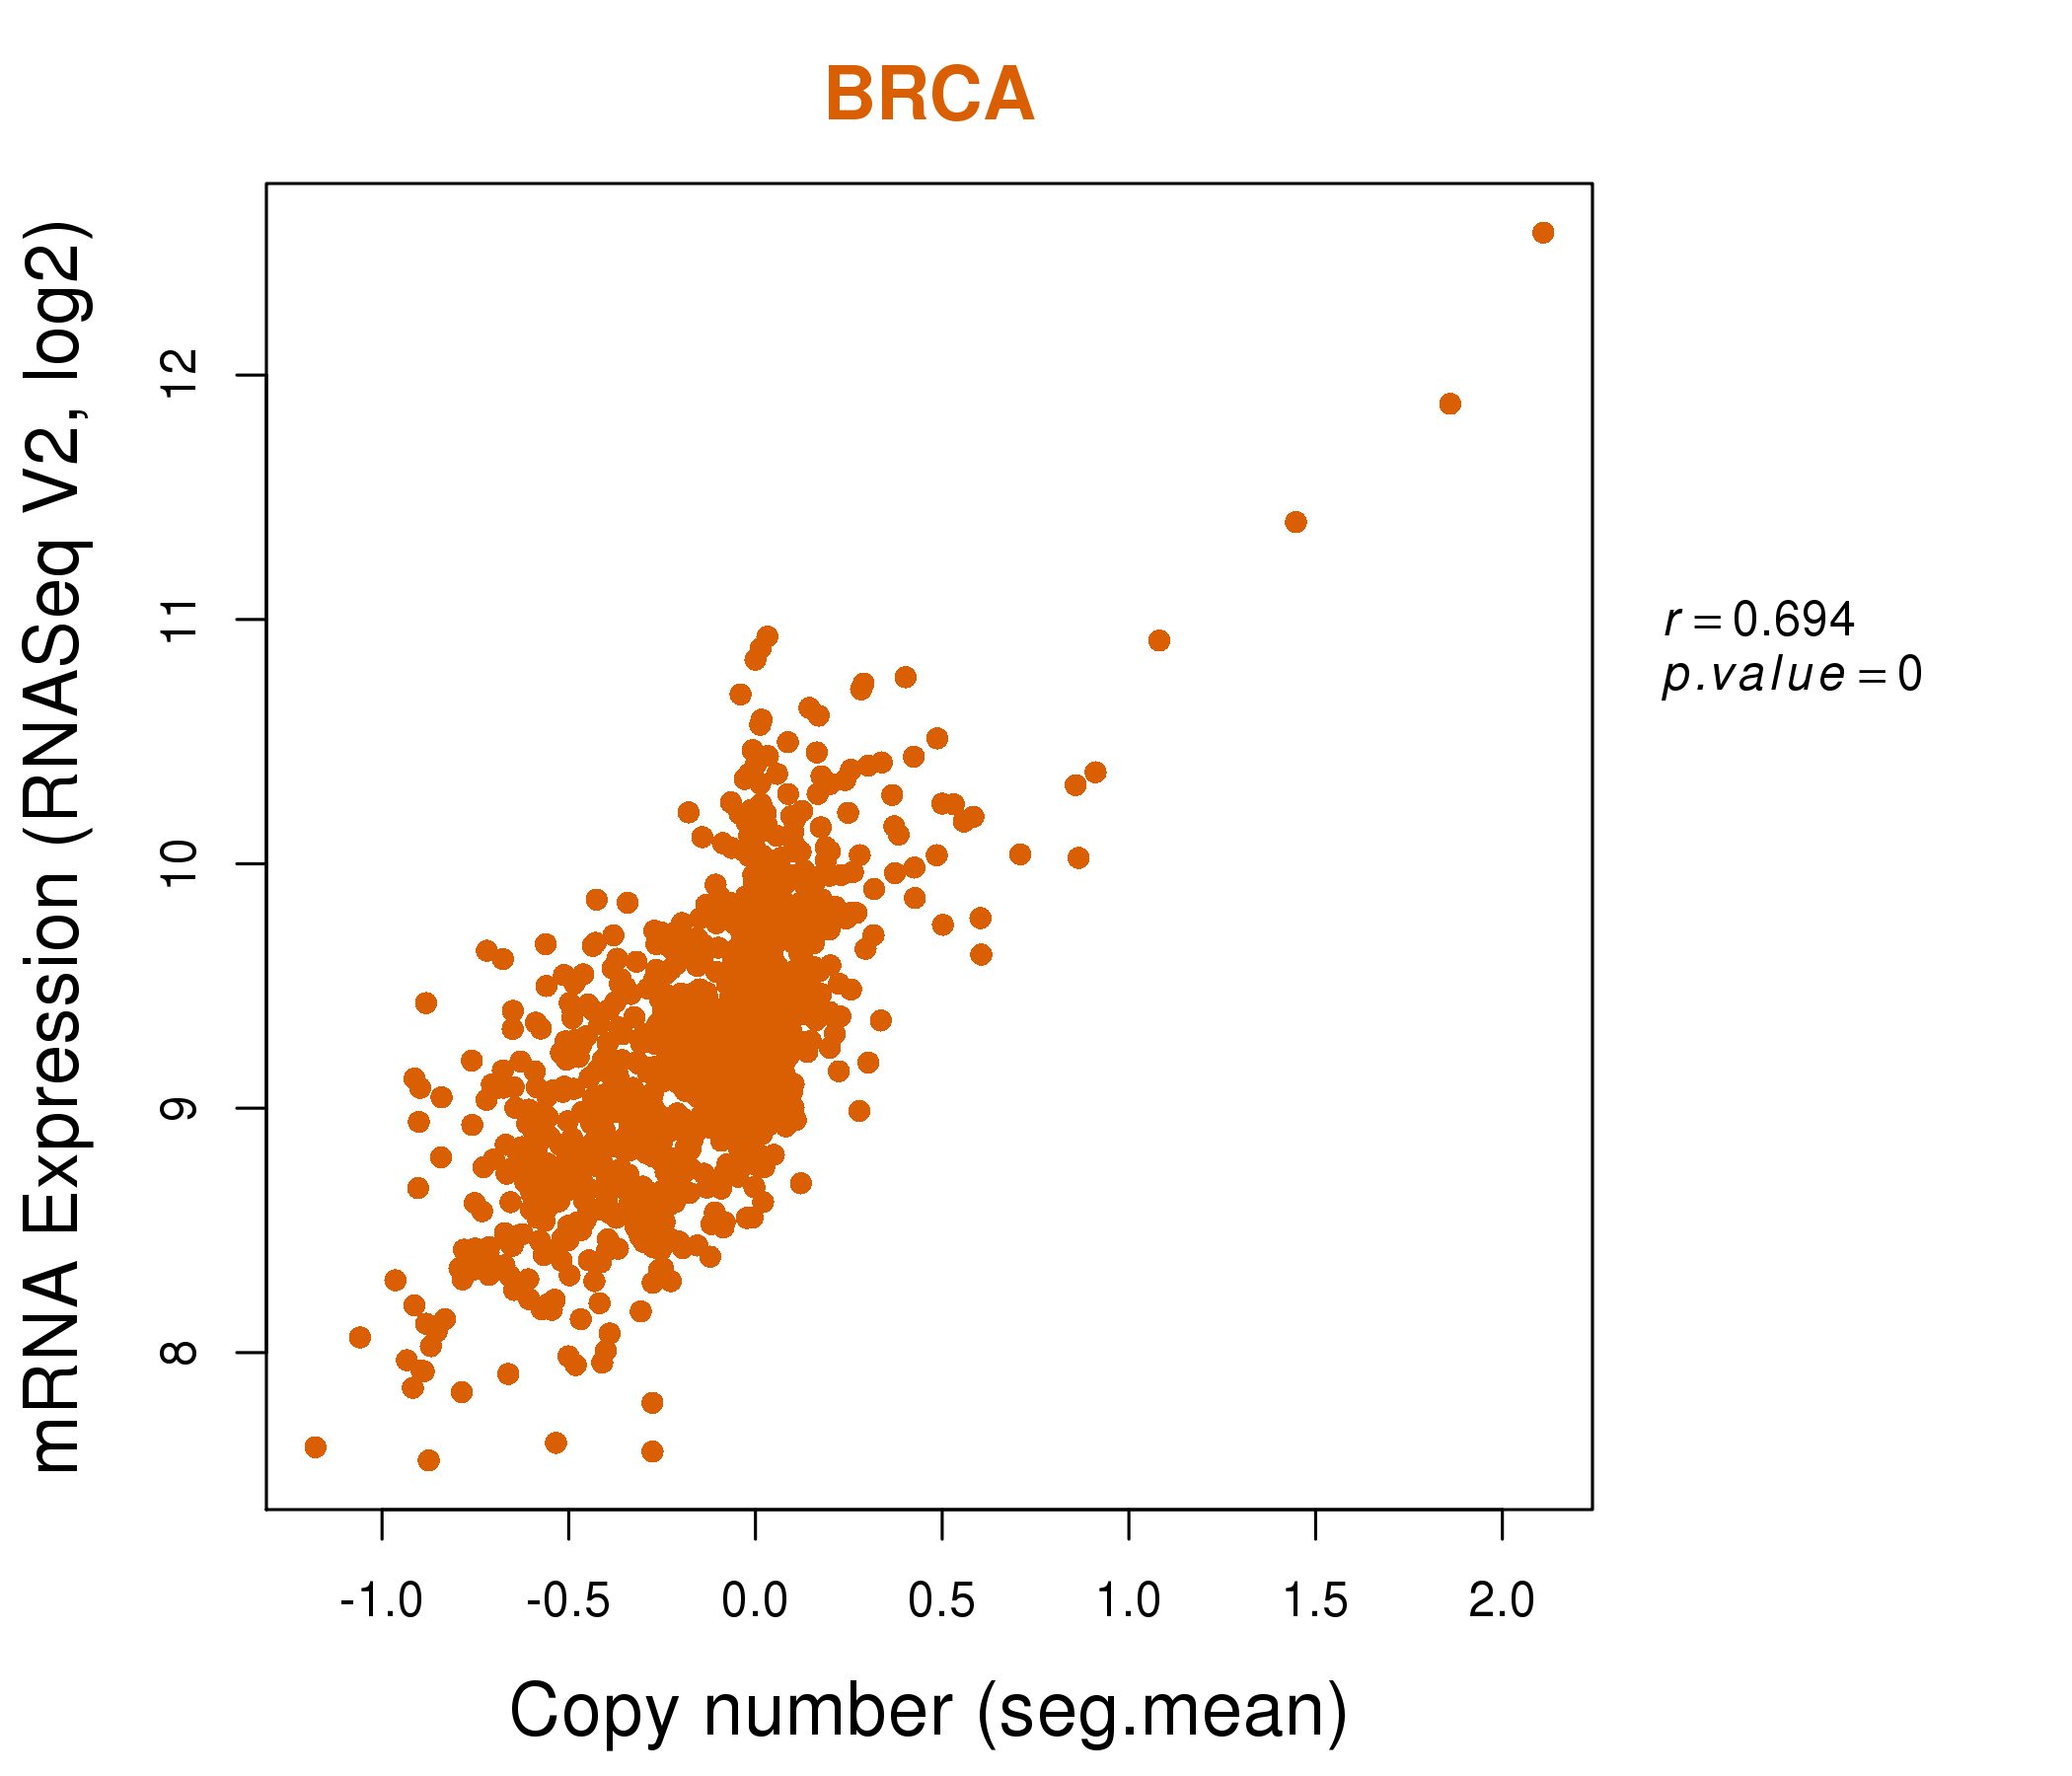
| * This plots show the correlation between CNV and gene expression. |
: Open all plots for all cancer types
 |
|
 |
|
| Top |
| Gene-Gene Network Information |
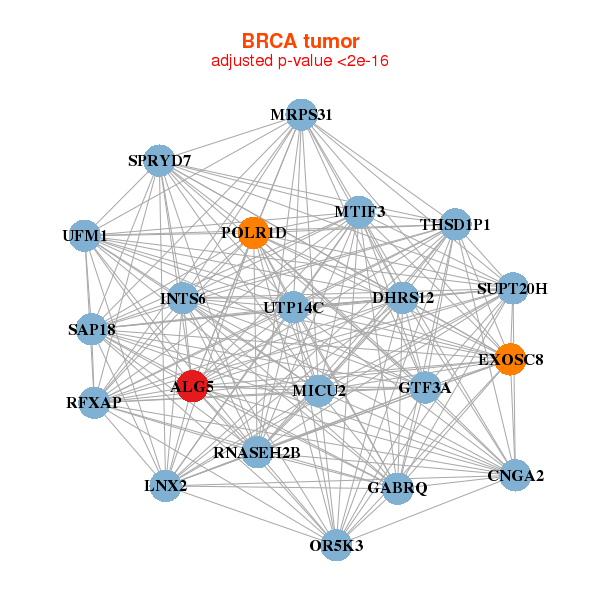
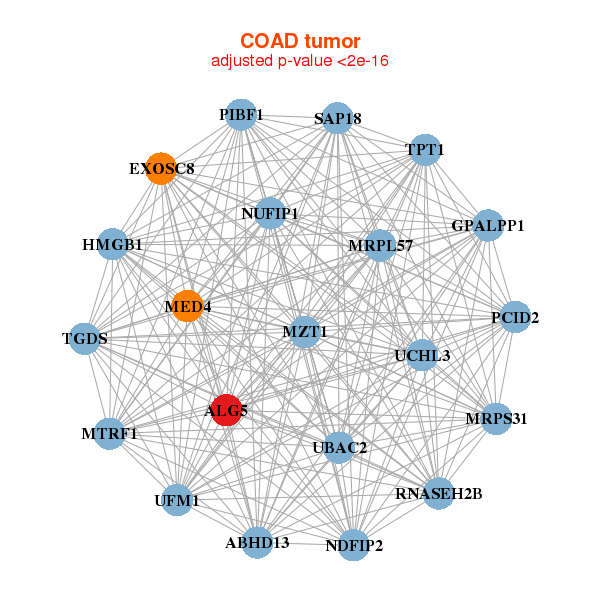
| * Co-Expression network figures were drawn using R package igraph. Only the top 20 genes with the highest correlations were shown. Red circle: input gene, orange circle: cell metabolism gene, sky circle: other gene |
: Open all plots for all cancer types
 |
|
| ALG5,SPRYD7,CNGA2,DHRS12,MICU2,EXOSC8,SUPT20H, GABRQ,GTF3A,INTS6,LNX2,MRPS31,MTIF3,OR5K3, POLR1D,RFXAP,RNASEH2B,SAP18,THSD1P1,UFM1,UTP14C | ALG5,ATP6V0E1,C18orf32,C1GALT1C1,CDC42,CETN2,DAD1, DERL2,MYL12B,ORMDL2,POLR2K,PPCS,PRR13,PSMD10, SFT2D1,SNRPB2,TMCO1,TMEM59,TSPAN31,TXNDC12,WDR61 |
 |
|
| ABHD13,ALG5,MZT1,EXOSC8,HMGB1,GPALPP1,MED4, MRPL57,MRPS31,MTRF1,NDFIP2,NUFIP1,PCID2,PIBF1, RNASEH2B,SAP18,TGDS,TPT1,UBAC2,UCHL3,UFM1 | ALG5,C14orf119,COA6,CCNC,CKLF,DPM1,GLRX3, LAMTOR5,HSBP1,MED31,MRPL32,MRPS23,OSTC,PHF5A, SELT,SEP15,TMEM126A,TMEM165,TOMM5,TOMM6,WDR61 |

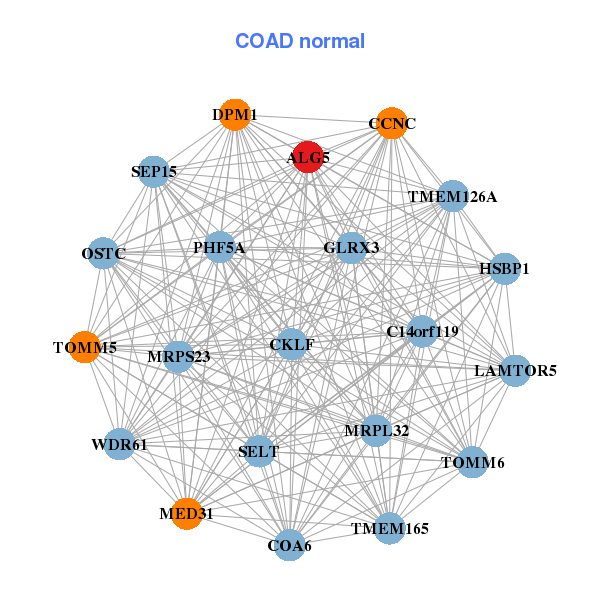
| * Co-Expression network figures were drawn using R package igraph. Only the top 20 genes with the highest correlations were shown. Red circle: input gene, orange circle: cell metabolism gene, sky circle: other gene |
: Open all plots for all cancer types
| Top |
: Open all interacting genes' information including KEGG pathway for all interacting genes from DAVID
| Top |
| Pharmacological Information for ALG5 |
| There's no related Drug. |
| Top |
| Cross referenced IDs for ALG5 |
| * We obtained these cross-references from Uniprot database. It covers 150 different DBs, 18 categories. http://www.uniprot.org/help/cross_references_section |
: Open all cross reference information
|
Copyright © 2016-Present - The Univsersity of Texas Health Science Center at Houston @ |