|
||||||||||||||||||||
| |
| Phenotypic Information (metabolism pathway, cancer, disease, phenome) |
| |
| |
| Gene-Gene Network Information: Co-Expression Network, Interacting Genes & KEGG |
| |
|


| Gene Summary for PYCR2 |
| Top |
| Phenotypic Information for PYCR2(metabolism pathway, cancer, disease, phenome) |
| Cancer | CGAP: PYCR2 |
| Familial Cancer Database: PYCR2 | |
| * This gene is included in those cancer gene databases. |
|
|
|
|
|
|
| ||||||||||||||
Oncogene 1 | Significant driver gene in | |||||||||||||||||||
| cf) number; DB name 1 Oncogene; http://nar.oxfordjournals.org/content/35/suppl_1/D721.long, 2 Tumor Suppressor gene; https://bioinfo.uth.edu/TSGene/, 3 Cancer Gene Census; http://www.nature.com/nrc/journal/v4/n3/abs/nrc1299.html, 4 CancerGenes; http://nar.oxfordjournals.org/content/35/suppl_1/D721.long, 5 Network of Cancer Gene; http://ncg.kcl.ac.uk/index.php, 1Therapeutic Vulnerabilities in Cancer; http://cbio.mskcc.org/cancergenomics/statius/ |
| KEGG_ARGININE_AND_PROLINE_METABOLISM | |
| OMIM | |
| Orphanet | |
| Disease | KEGG Disease: PYCR2 |
| MedGen: PYCR2 (Human Medical Genetics with Condition) | |
| ClinVar: PYCR2 | |
| Phenotype | MGI: PYCR2 (International Mouse Phenotyping Consortium) |
| PhenomicDB: PYCR2 | |
| Mutations for PYCR2 |
| * Under tables are showing count per each tissue to give us broad intuition about tissue specific mutation patterns.You can go to the detailed page for each mutation database's web site. |
| There's no structural variation information in COSMIC data for this gene. |
| * From mRNA Sanger sequences, Chitars2.0 arranged chimeric transcripts. This table shows PYCR2 related fusion information. |
| ID | Head Gene | Tail Gene | Accession | Gene_a | qStart_a | qEnd_a | Chromosome_a | tStart_a | tEnd_a | Gene_a | qStart_a | qEnd_a | Chromosome_a | tStart_a | tEnd_a |
| Top |
| There's no copy number variation information in COSMIC data for this gene. |
| Top |
|
 |
| Top |
| Stat. for Non-Synonymous SNVs (# total SNVs=14) | (# total SNVs=4) |
 |  |
(# total SNVs=0) | (# total SNVs=0) |
| Top |
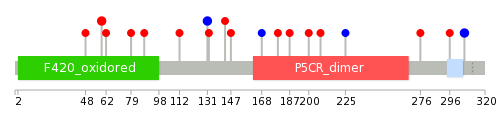
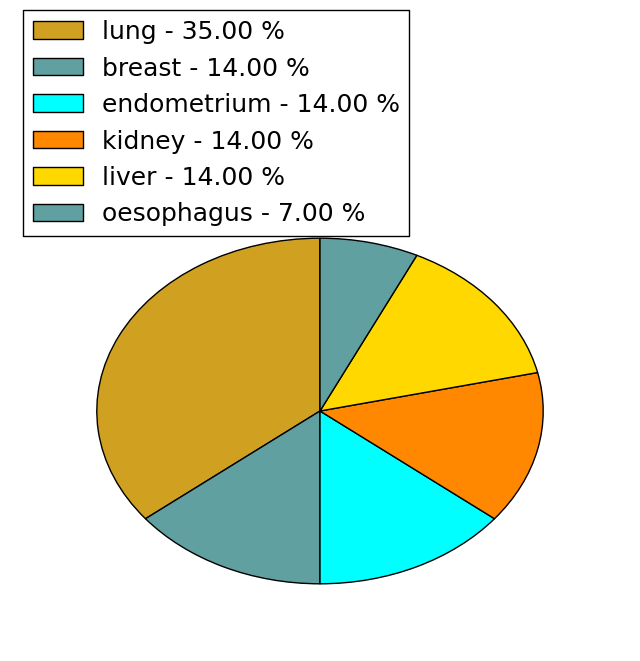
| * When you move the cursor on each content, you can see more deailed mutation information on the Tooltip. Those are primary_site,primary_histology,mutation(aa),pubmedID. |
| GRCh37 position | Mutation(aa) | Unique sampleID count |
| chr1:226110046-226110046 | p.T59M | 2 |
| chr1:226108200-226108200 | p.G306G | 2 |
| chr1:226109705-226109705 | p.G131G | 2 |
| chr1:226109261-226109261 | p.Q208H | 1 |
| chr1:226109987-226109987 | p.L79V | 1 |
| chr1:226109287-226109287 | p.R200C | 1 |
| chr1:226110038-226110038 | p.H62N | 1 |
| chr1:226109325-226109325 | p.A187V | 1 |
| chr1:226109562-226109562 | p.A179V | 1 |
| chr1:226110080-226110080 | p.M48V | 1 |
| Top |
|
 |
| Point Mutation/ Tissue ID | 1 | 2 | 3 | 4 | 5 | 6 | 7 | 8 | 9 | 10 | 11 | 12 | 13 | 14 | 15 | 16 | 17 | 18 | 19 | 20 |
| # sample | 1 | 1 | 1 | 5 | 1 | 2 | 2 | |||||||||||||
| # mutation | 1 | 1 | 1 | 5 | 1 | 2 | 2 | |||||||||||||
| nonsynonymous SNV | 1 | 1 | 1 | 5 | 1 | 1 | 2 | |||||||||||||
| synonymous SNV | 1 |
| cf) Tissue ID; Tissue type (1; BLCA[Bladder Urothelial Carcinoma], 2; BRCA[Breast invasive carcinoma], 3; CESC[Cervical squamous cell carcinoma and endocervical adenocarcinoma], 4; COAD[Colon adenocarcinoma], 5; GBM[Glioblastoma multiforme], 6; Glioma Low Grade, 7; HNSC[Head and Neck squamous cell carcinoma], 8; KICH[Kidney Chromophobe], 9; KIRC[Kidney renal clear cell carcinoma], 10; KIRP[Kidney renal papillary cell carcinoma], 11; LAML[Acute Myeloid Leukemia], 12; LUAD[Lung adenocarcinoma], 13; LUSC[Lung squamous cell carcinoma], 14; OV[Ovarian serous cystadenocarcinoma ], 15; PAAD[Pancreatic adenocarcinoma], 16; PRAD[Prostate adenocarcinoma], 17; SKCM[Skin Cutaneous Melanoma], 18:STAD[Stomach adenocarcinoma], 19:THCA[Thyroid carcinoma], 20:UCEC[Uterine Corpus Endometrial Carcinoma]) |
| Top |
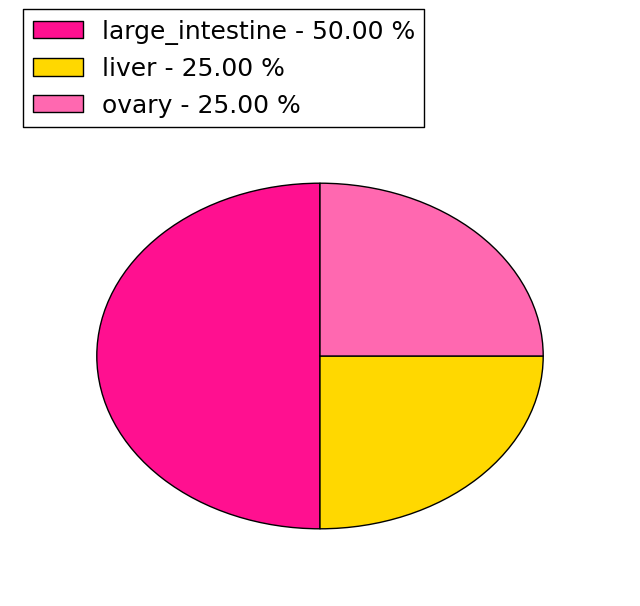
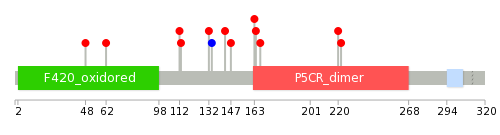
| * We represented just top 10 SNVs. When you move the cursor on each content, you can see more deailed mutation information on the Tooltip. Those are primary_site, primary_histology, mutation(aa), pubmedID. |
| Genomic Position | Mutation(aa) | Unique sampleID count |
| chr1:226109325 | p.A113V,PYCR2 | 1 |
| chr1:226109606 | p.E164D | 1 |
| chr1:226109611 | p.E163Q | 1 |
| chr1:226109657 | p.Q147H | 1 |
| chr1:226109671 | p.V143L | 1 |
| chr1:226109704 | p.A132T | 1 |
| chr1:226109762 | p.Q112H | 1 |
| chr1:226108231 | p.H62N,PYCR2 | 1 |
| chr1:226110038 | p.M48V,PYCR2 | 1 |
| chr1:226108237 | p.T222I,PYCR2 | 1 |
| * Copy number data were extracted from TCGA using R package TCGA-Assembler. The URLs of all public data files on TCGA DCC data server were gathered on Jan-05-2015. Function ProcessCNAData in TCGA-Assembler package was used to obtain gene-level copy number value which is calculated as the average copy number of the genomic region of a gene. |
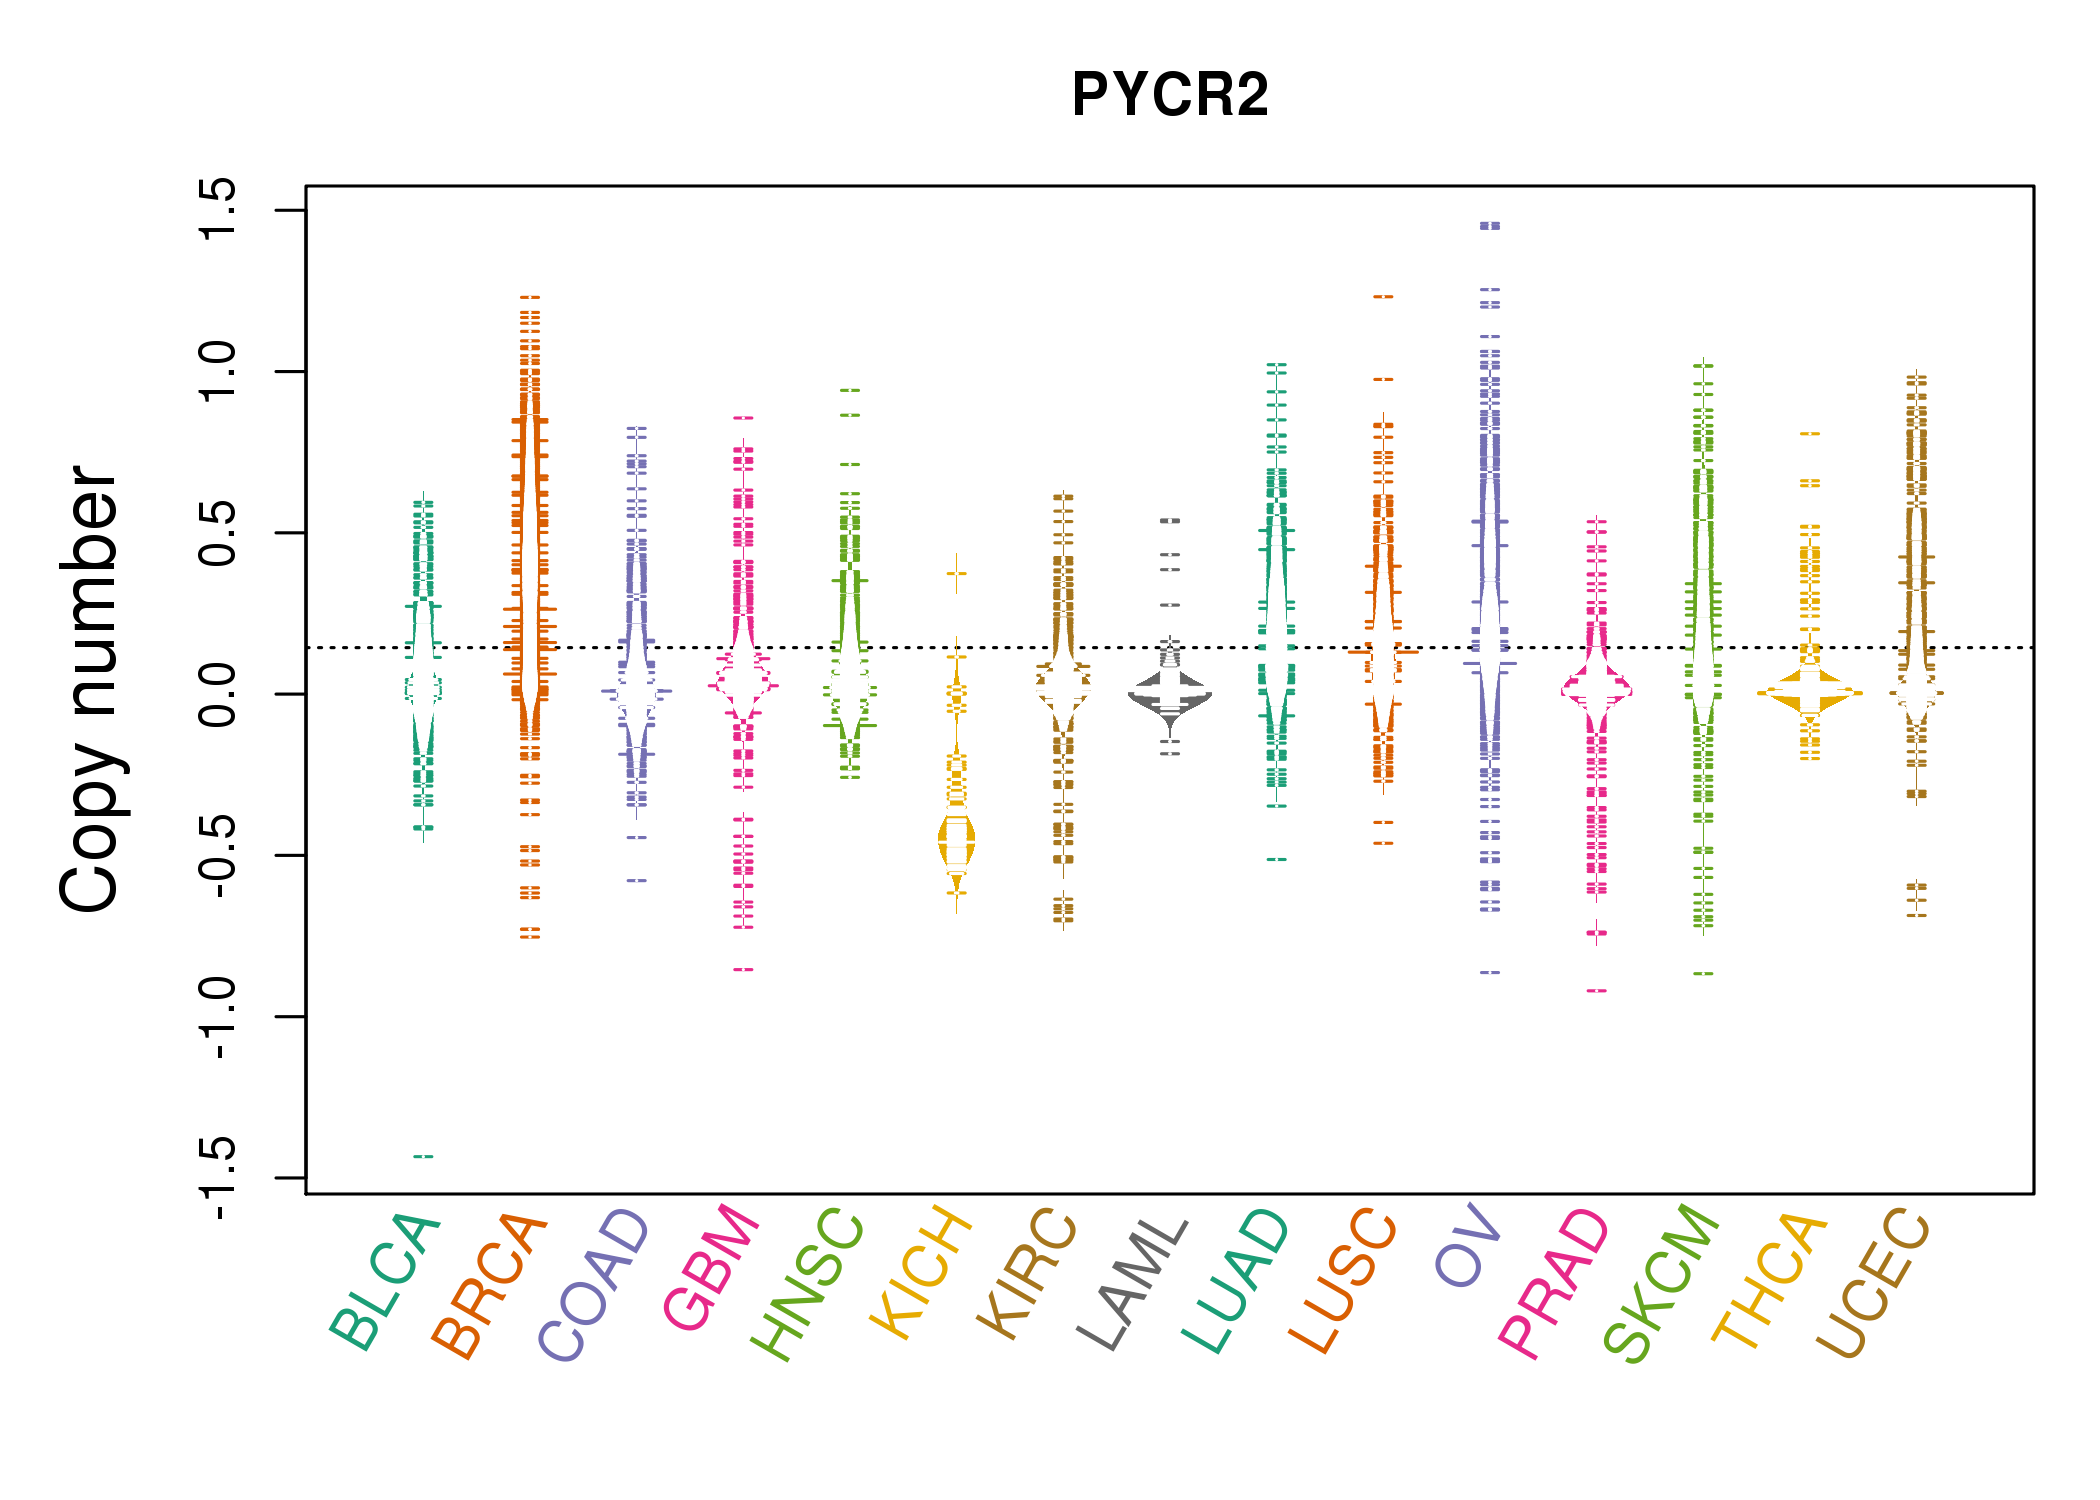 |
| cf) Tissue ID[Tissue type]: BLCA[Bladder Urothelial Carcinoma], BRCA[Breast invasive carcinoma], CESC[Cervical squamous cell carcinoma and endocervical adenocarcinoma], COAD[Colon adenocarcinoma], GBM[Glioblastoma multiforme], Glioma Low Grade, HNSC[Head and Neck squamous cell carcinoma], KICH[Kidney Chromophobe], KIRC[Kidney renal clear cell carcinoma], KIRP[Kidney renal papillary cell carcinoma], LAML[Acute Myeloid Leukemia], LUAD[Lung adenocarcinoma], LUSC[Lung squamous cell carcinoma], OV[Ovarian serous cystadenocarcinoma ], PAAD[Pancreatic adenocarcinoma], PRAD[Prostate adenocarcinoma], SKCM[Skin Cutaneous Melanoma], STAD[Stomach adenocarcinoma], THCA[Thyroid carcinoma], UCEC[Uterine Corpus Endometrial Carcinoma] |
| Top |
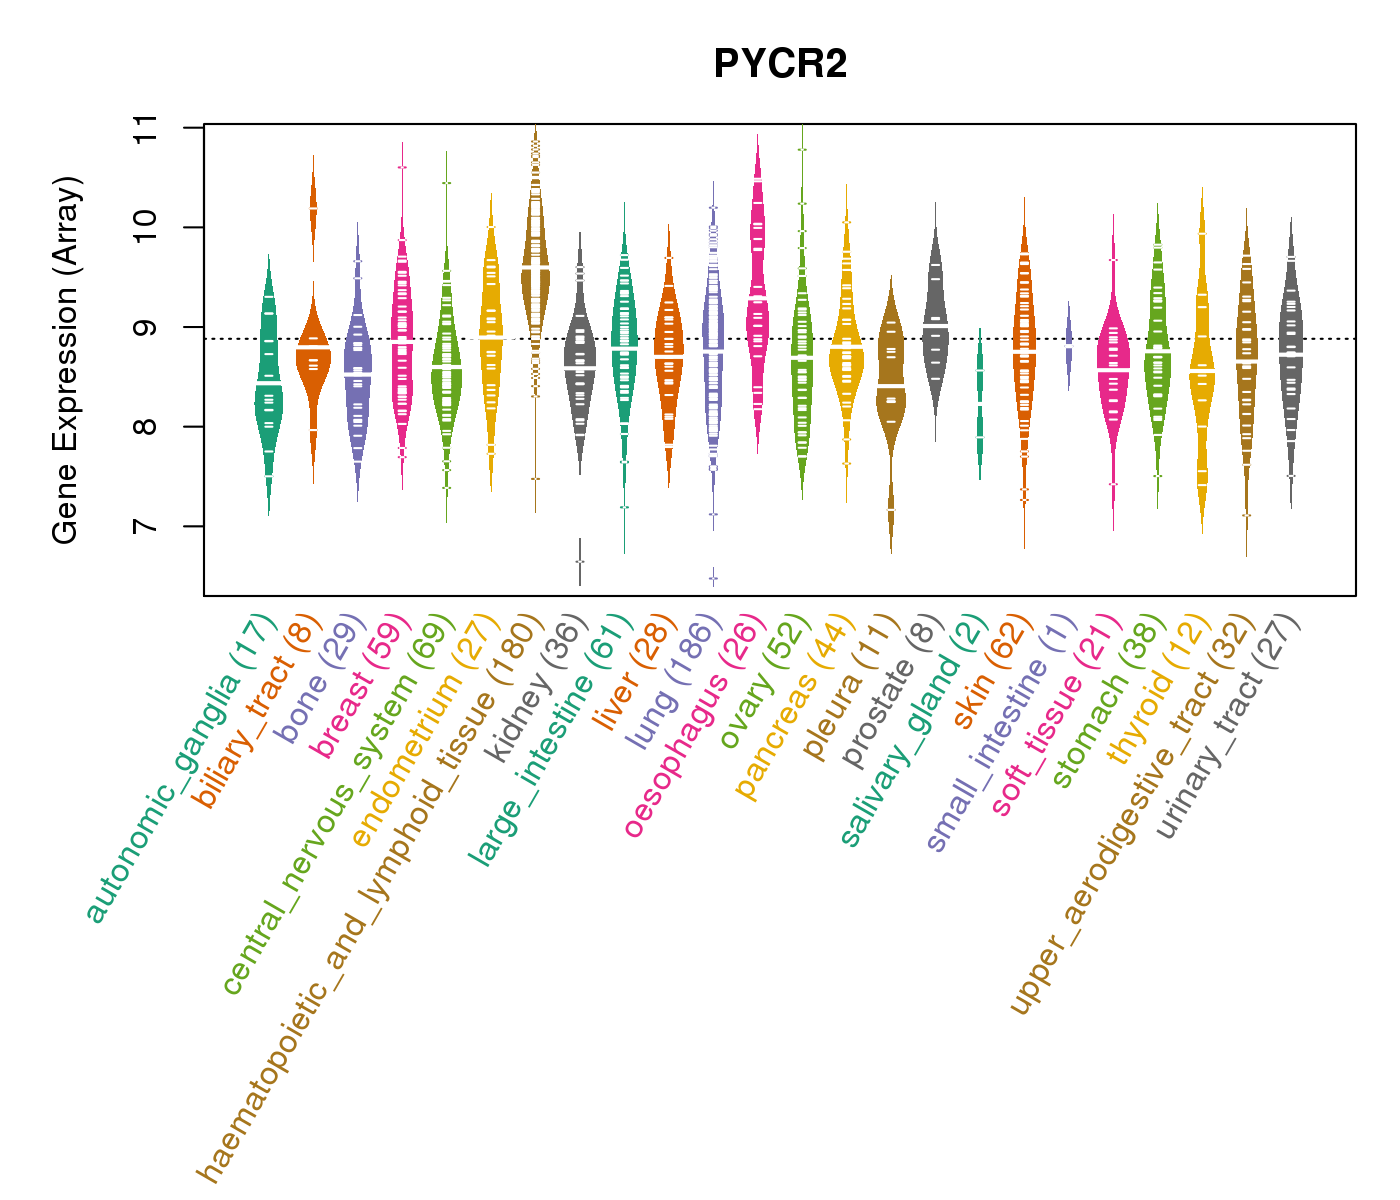
| Gene Expression for PYCR2 |
| * CCLE gene expression data were extracted from CCLE_Expression_Entrez_2012-10-18.res: Gene-centric RMA-normalized mRNA expression data. |
 |
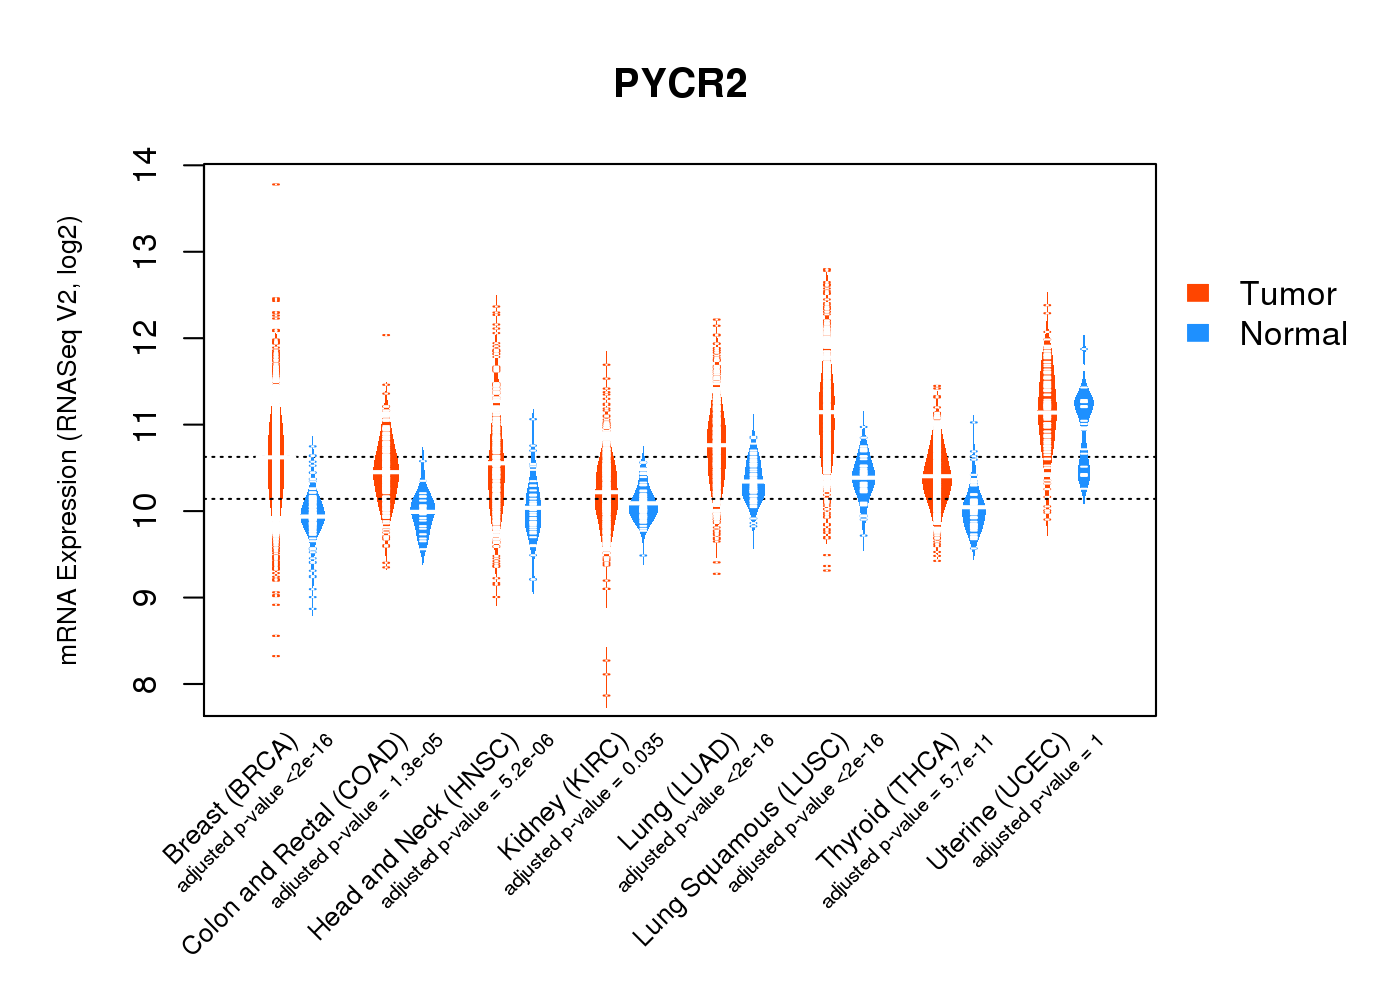
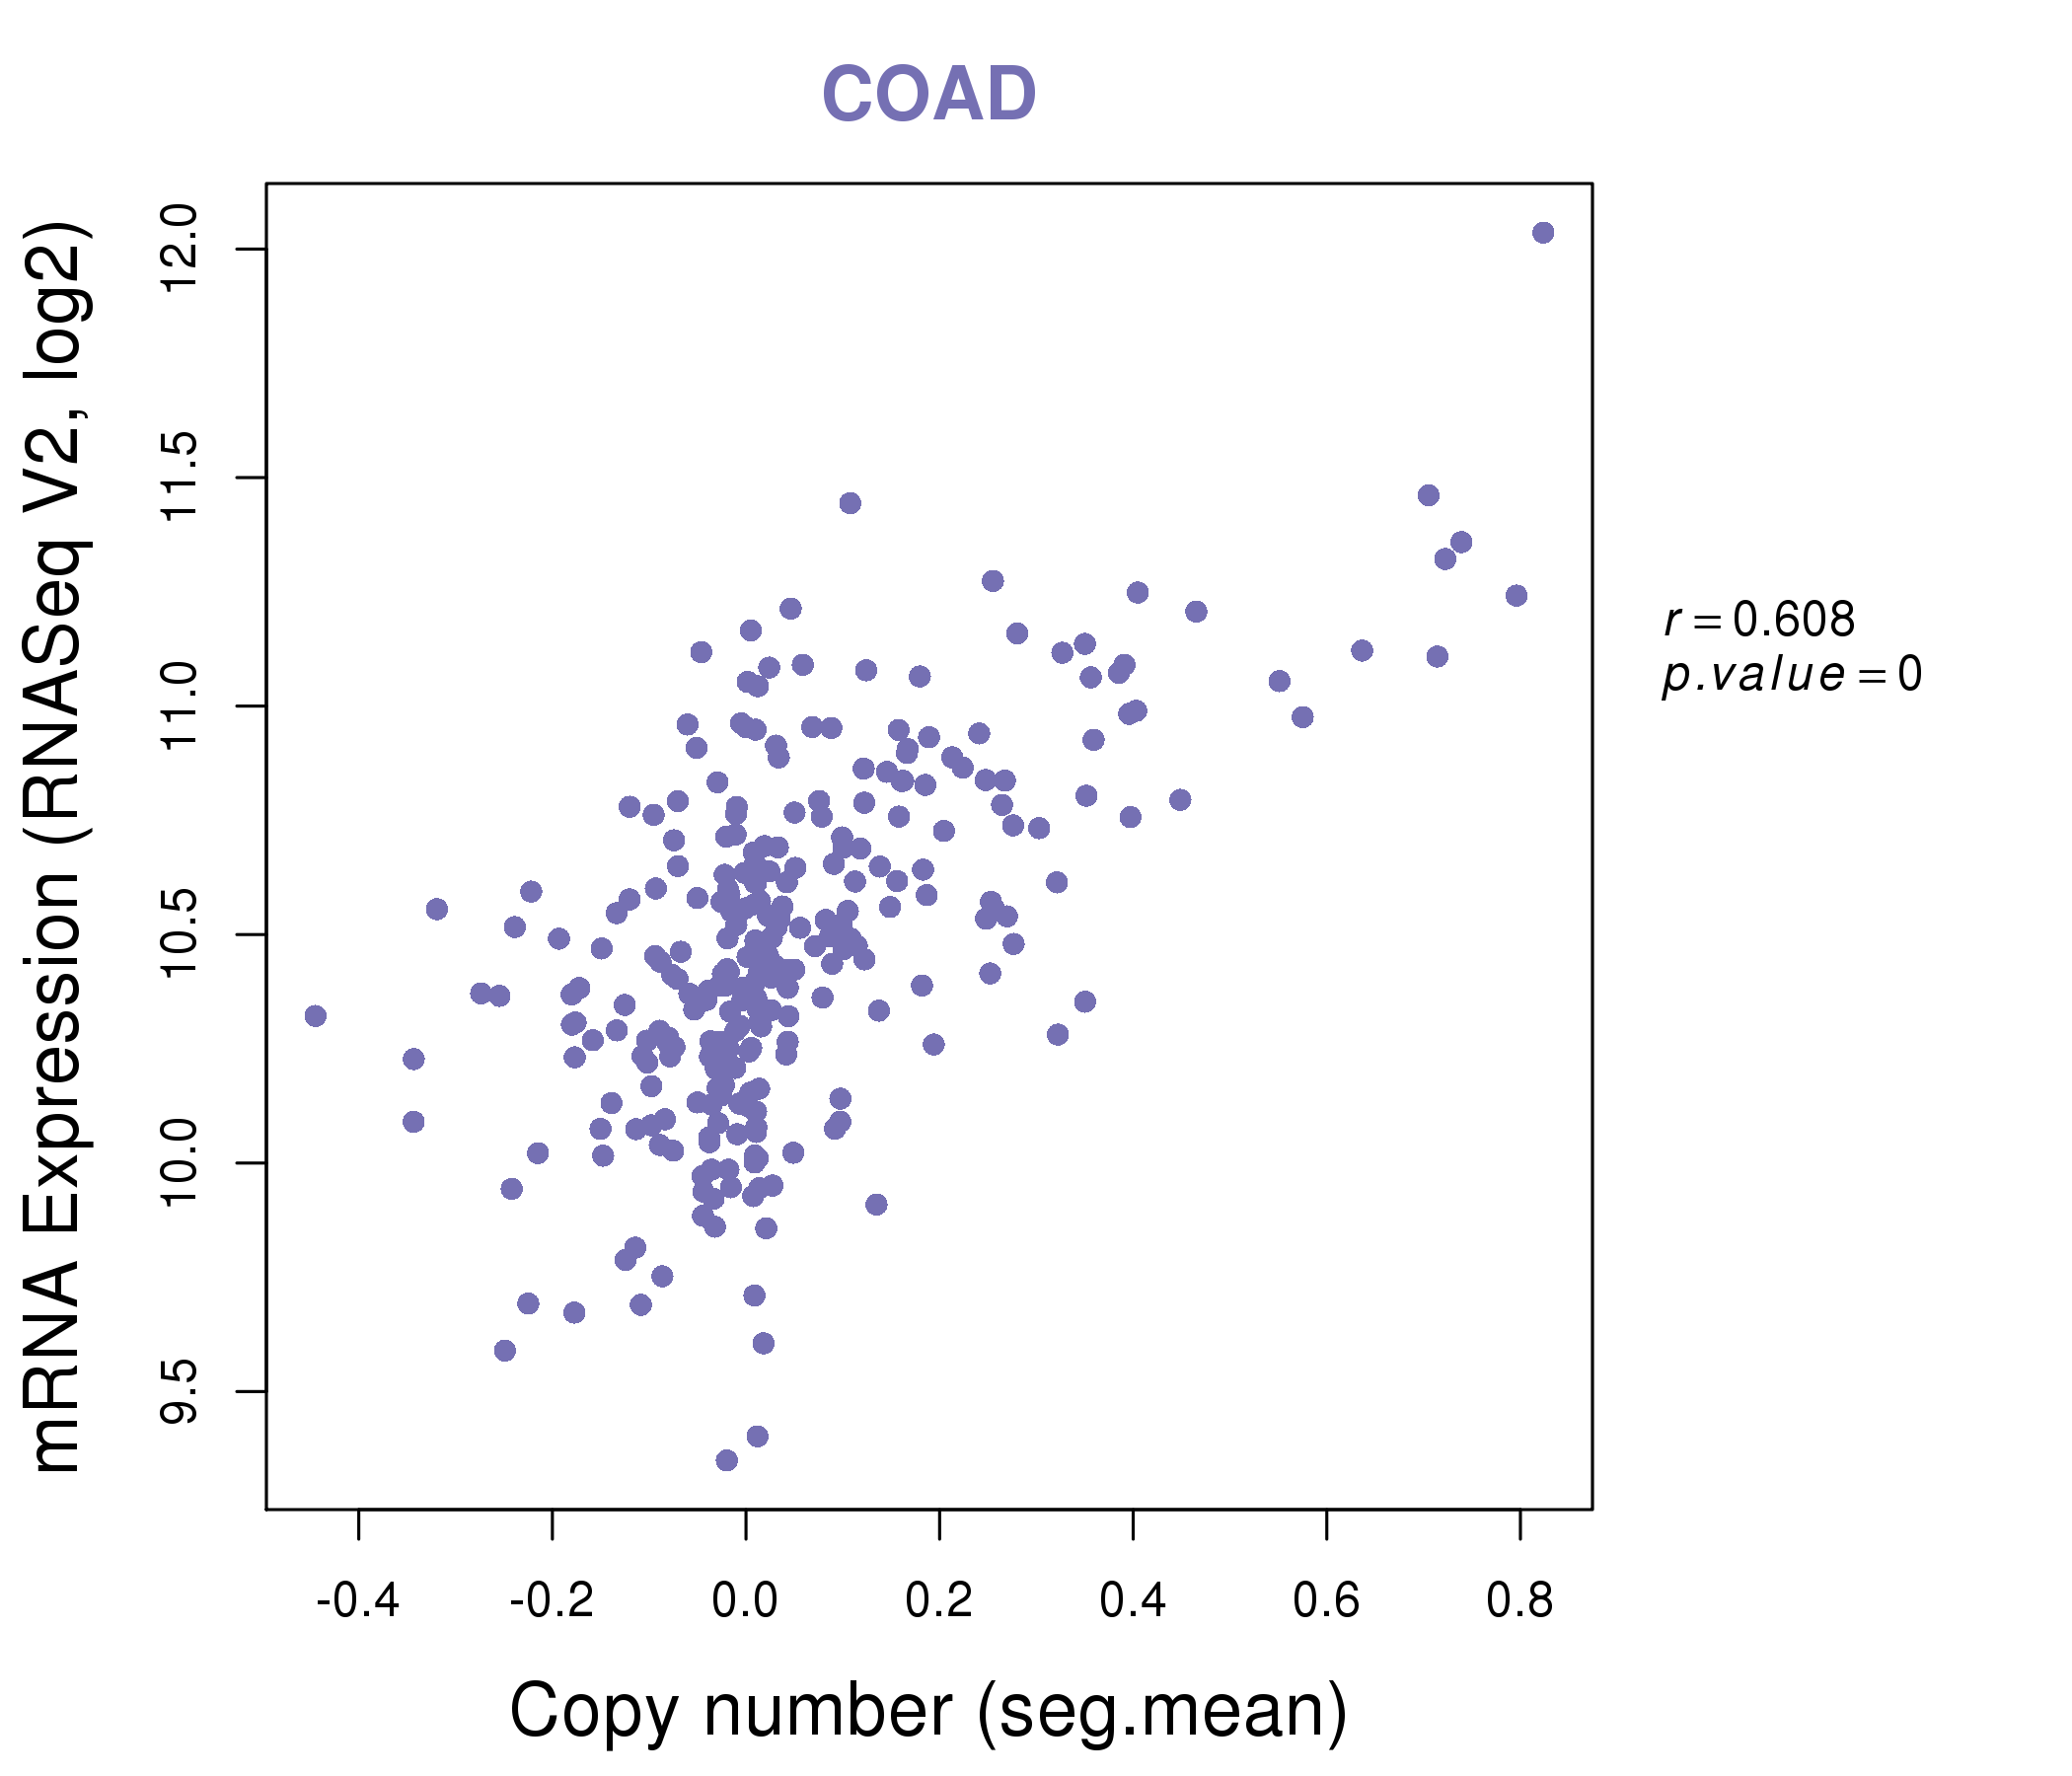
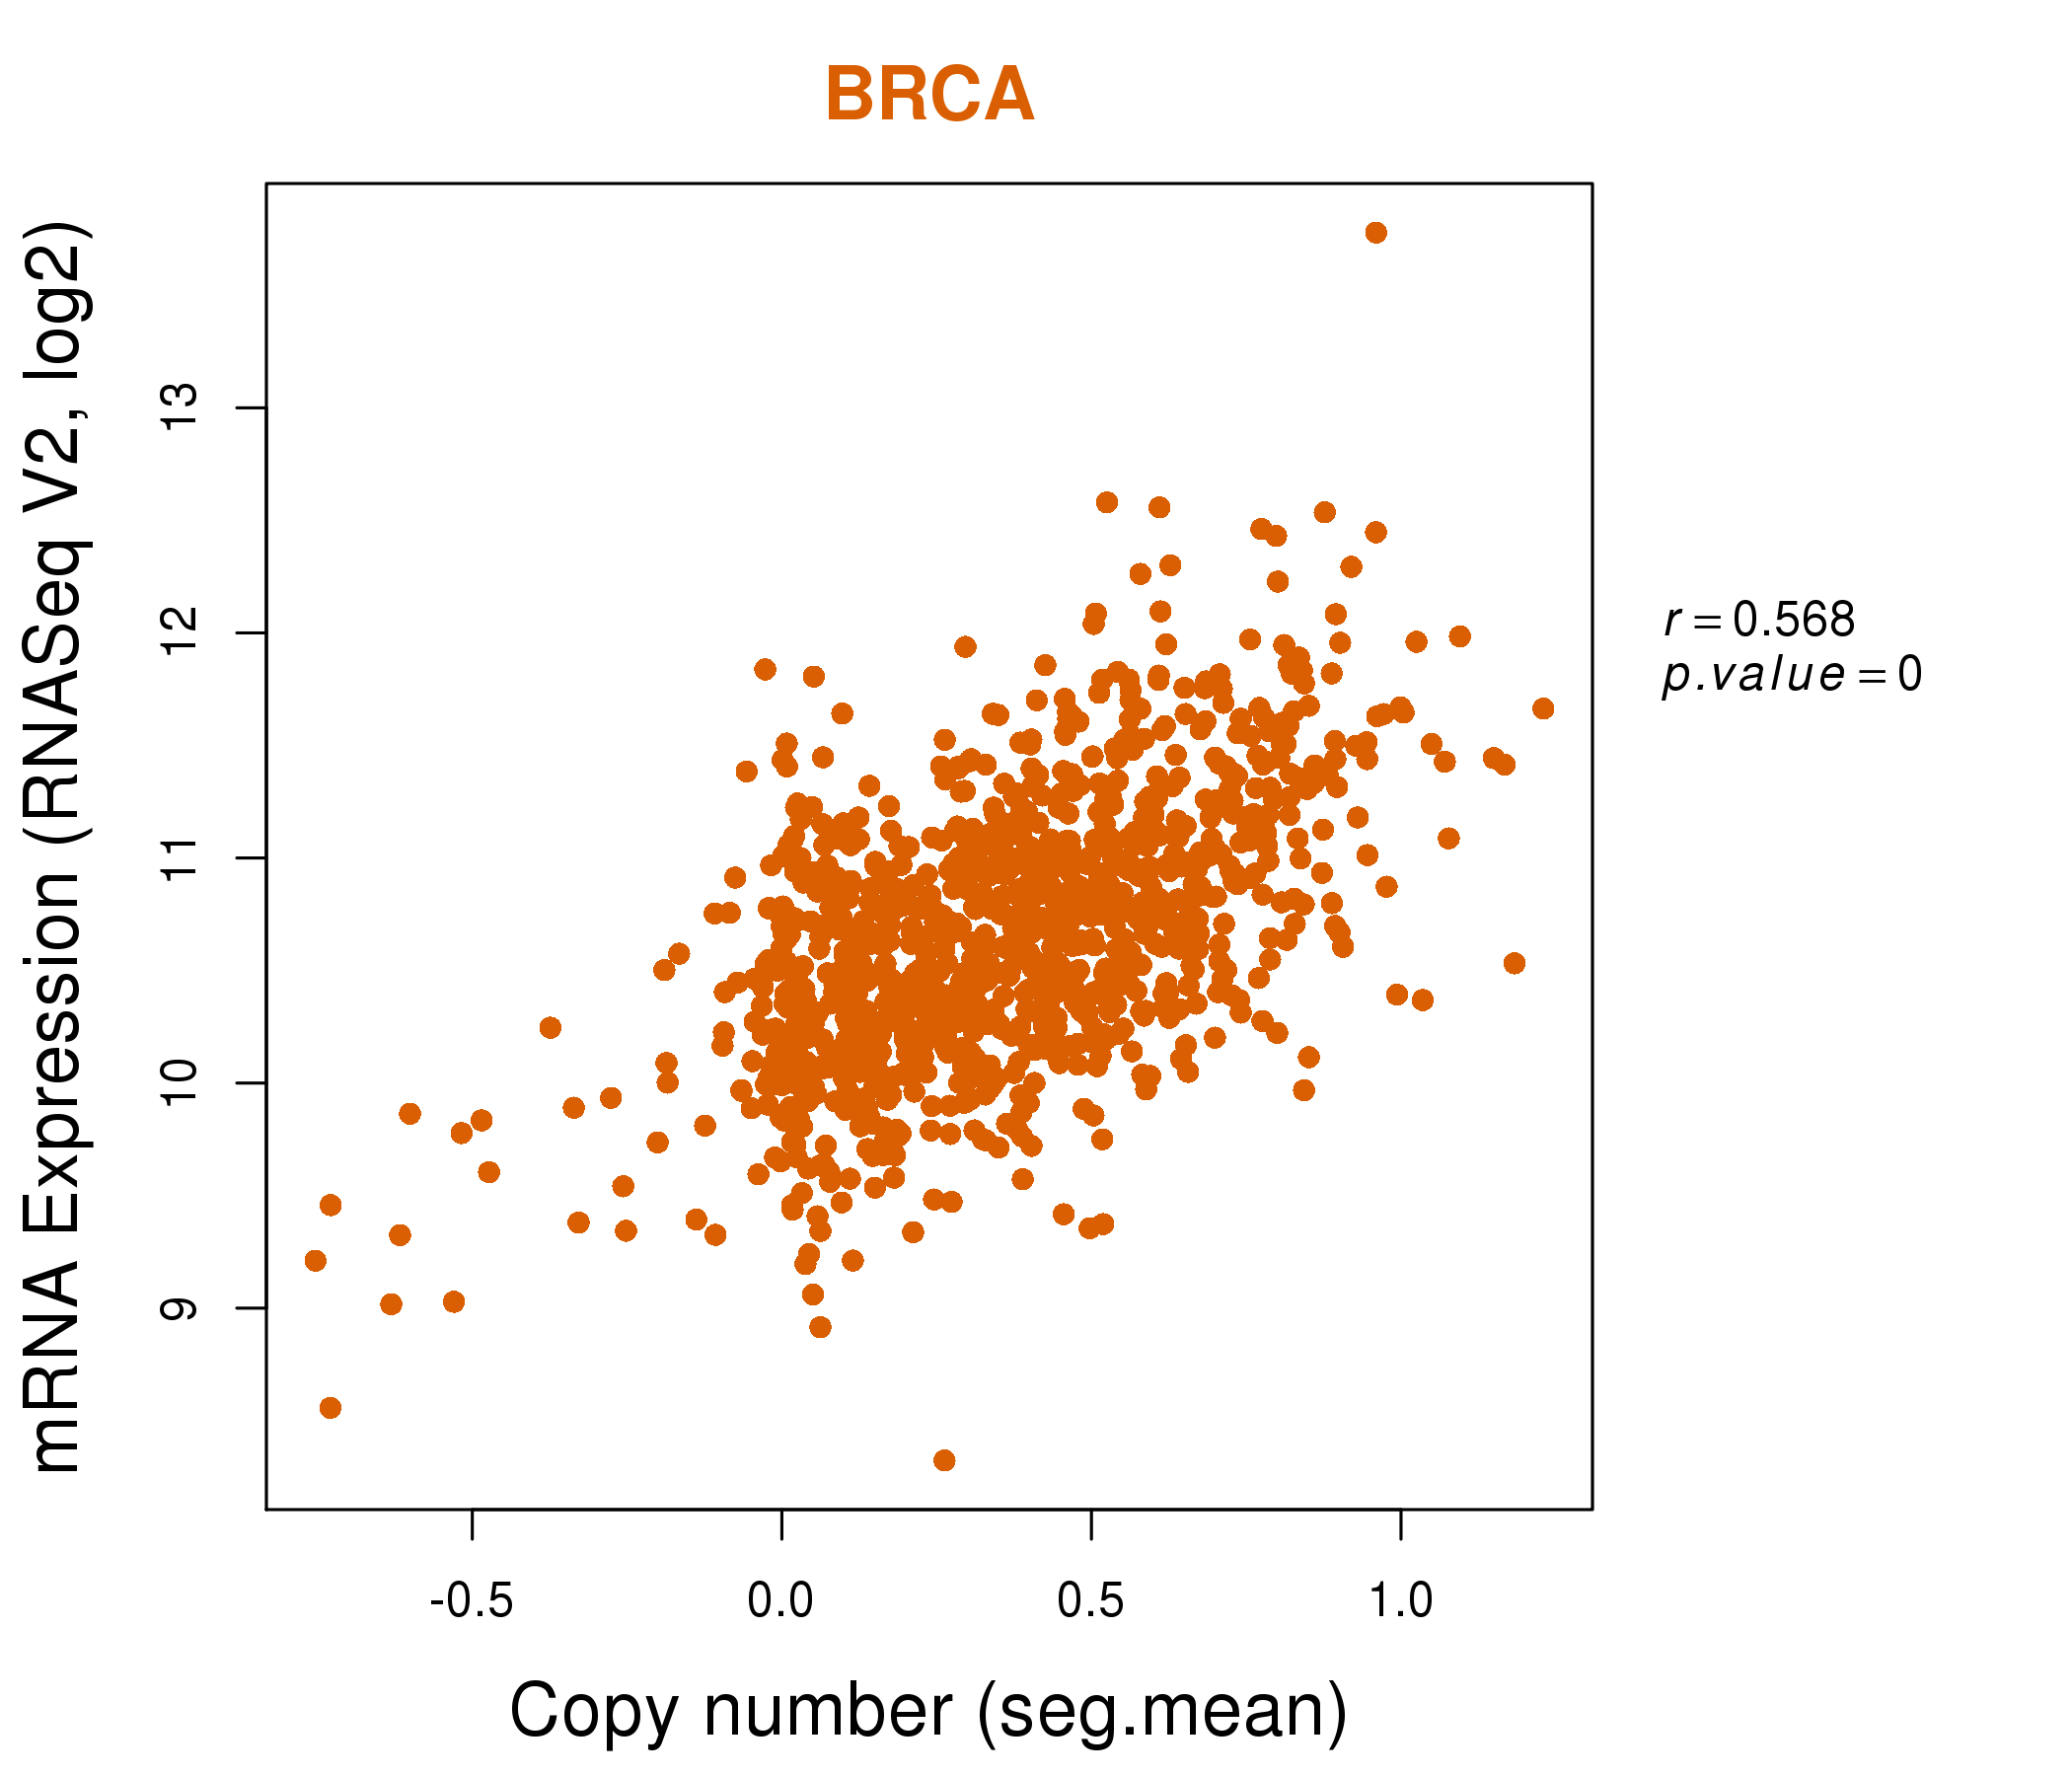
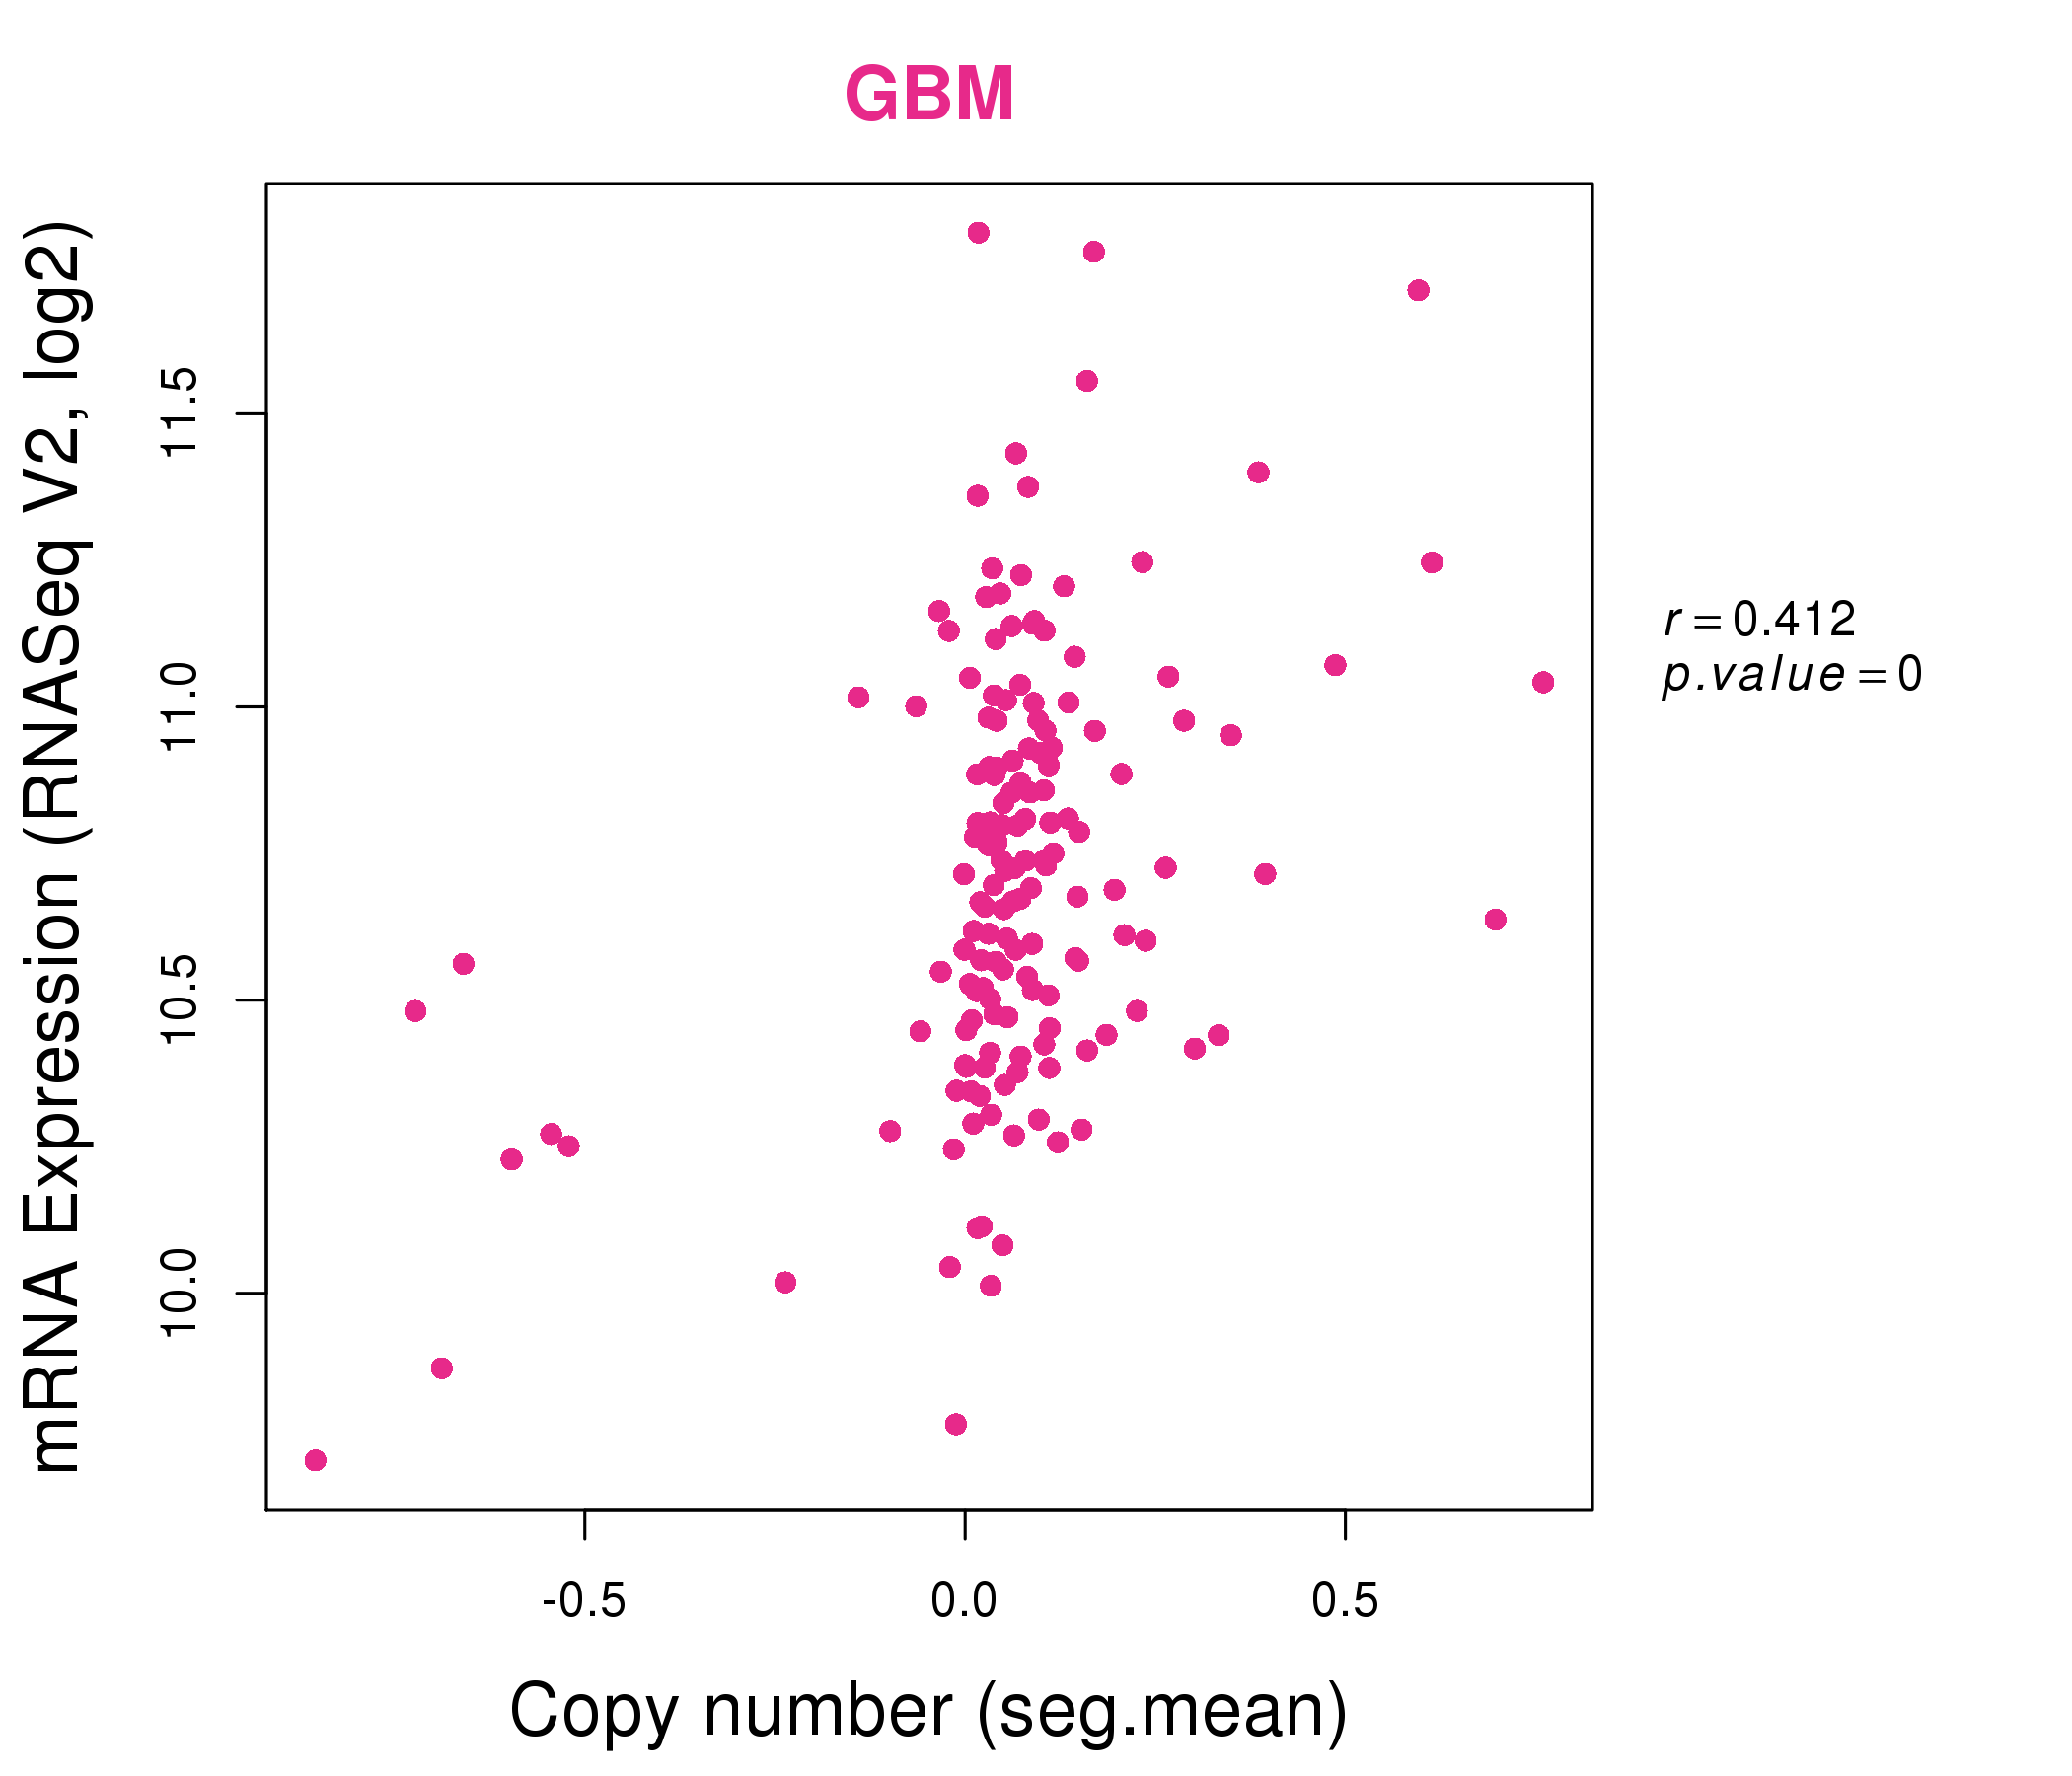
| * Normalized gene expression data of RNASeqV2 was extracted from TCGA using R package TCGA-Assembler. The URLs of all public data files on TCGA DCC data server were gathered at Jan-05-2015. Only eight cancer types have enough normal control samples for differential expression analysis. (t test, adjusted p<0.05 (using Benjamini-Hochberg FDR)) |
 |
| Top |
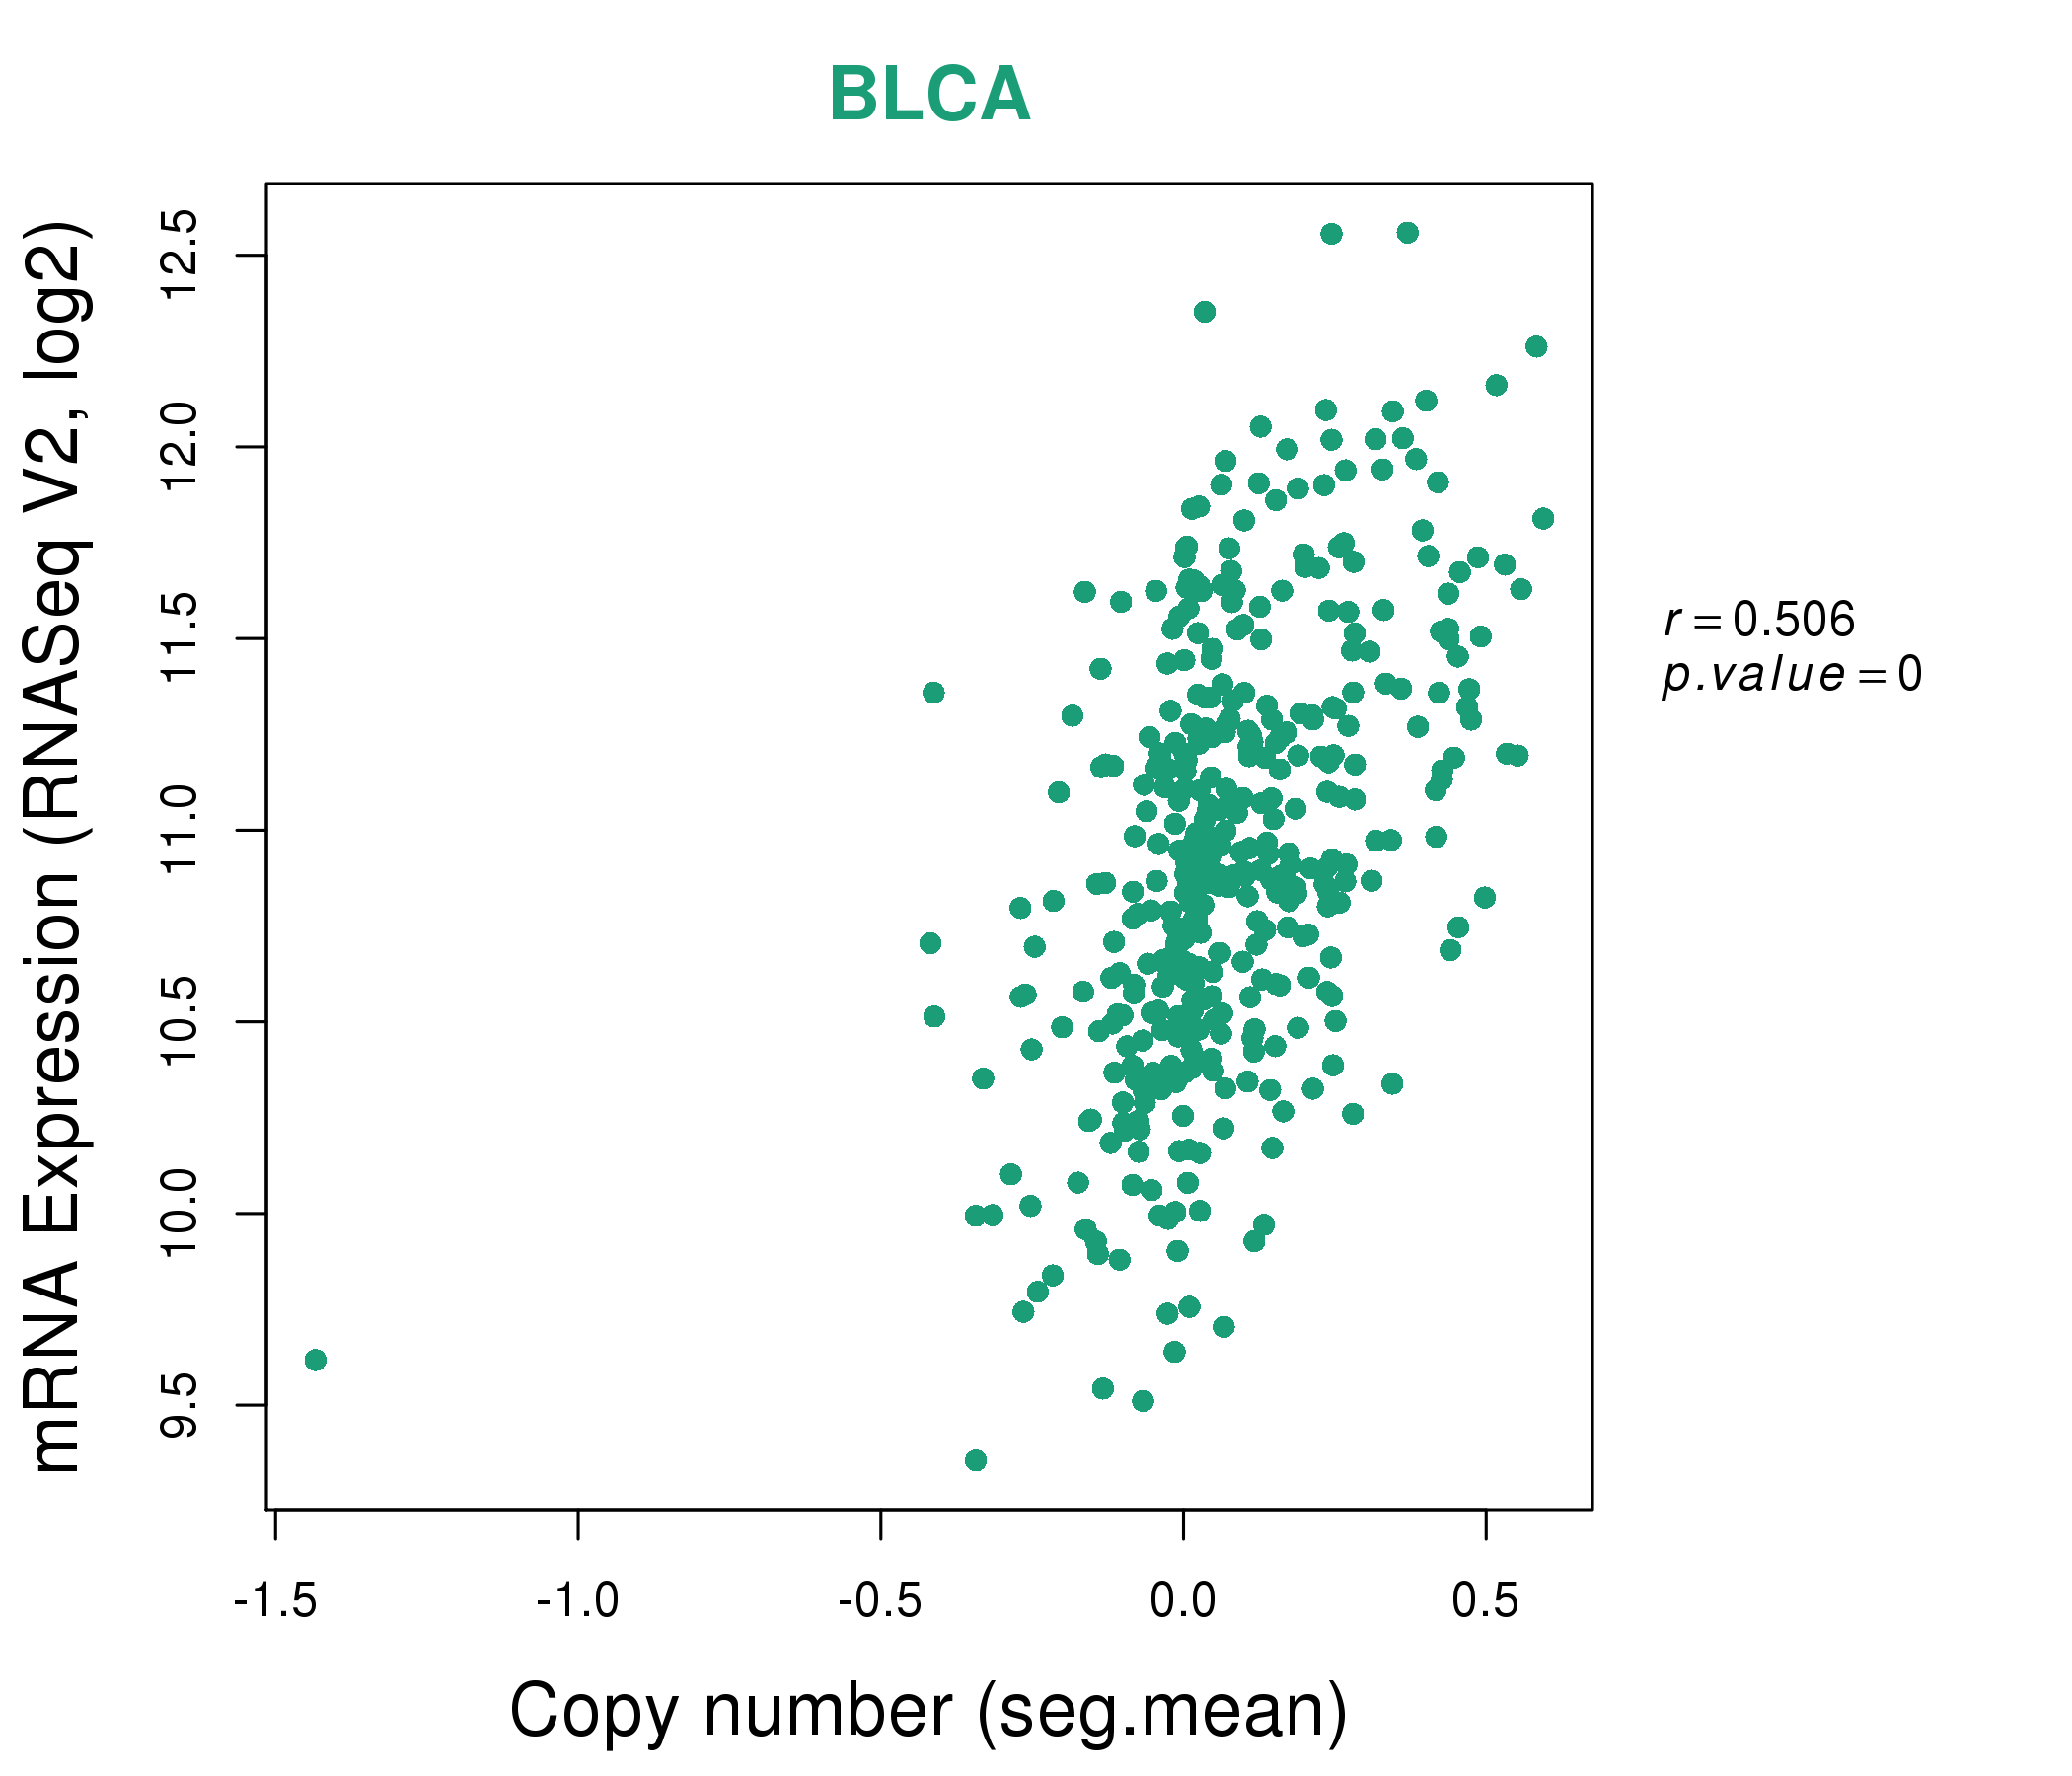
| * This plots show the correlation between CNV and gene expression. |
: Open all plots for all cancer types
 |
|
 |
|
| Top |
| Gene-Gene Network Information |
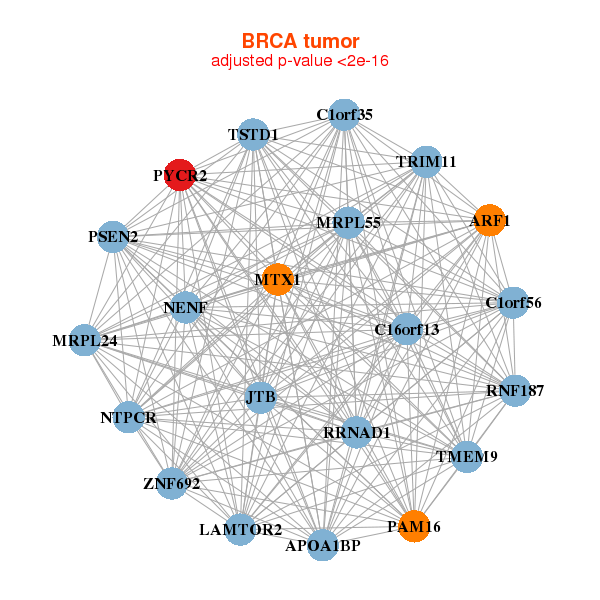
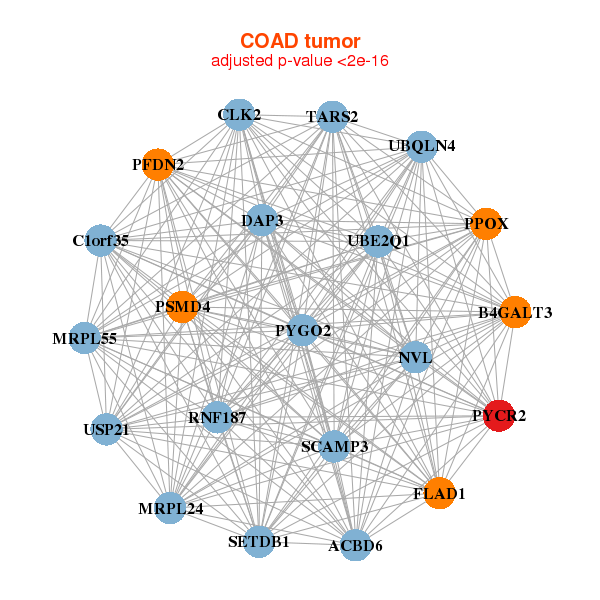
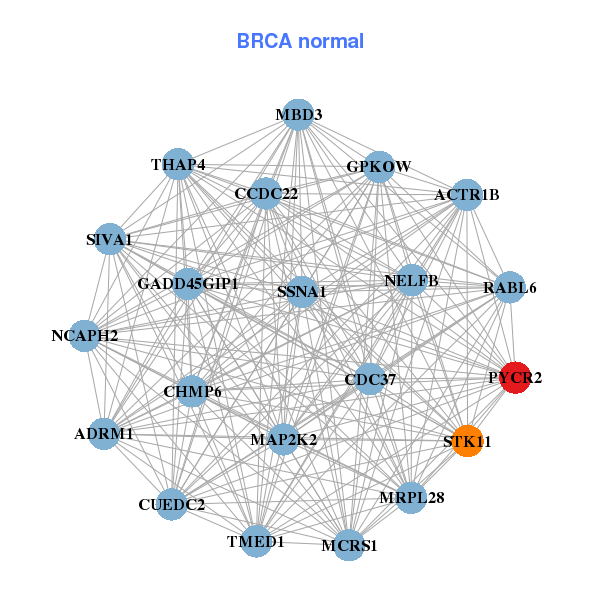
| * Co-Expression network figures were drawn using R package igraph. Only the top 20 genes with the highest correlations were shown. Red circle: input gene, orange circle: cell metabolism gene, sky circle: other gene |
: Open all plots for all cancer types
 |
| ||||
| APOA1BP,ARF1,C16orf13,C1orf35,C1orf56,NTPCR,RRNAD1, JTB,MRPL24,MRPL55,MTX1,NENF,PSEN2,PYCR2, RNF187,LAMTOR2,PAM16,TMEM9,TRIM11,TSTD1,ZNF692 | ACTR1B,ADRM1,RABL6,CCDC22,CDC37,CHMP6,NELFB, CUEDC2,GADD45GIP1,GPKOW,MAP2K2,MBD3,MCRS1,MRPL28, NCAPH2,PYCR2,SIVA1,SSNA1,STK11,THAP4,TMED1 | ||||
 |
| ||||
| ACBD6,B4GALT3,C1orf35,CLK2,DAP3,FLAD1,MRPL24, MRPL55,NVL,PFDN2,PPOX,PSMD4,PYCR2,PYGO2, RNF187,SCAMP3,SETDB1,TARS2,UBE2Q1,UBQLN4,USP21 | ARMCX3,C11orf84,CCDC124,COQ10A,CWC27,DCPS,DEF8, DYX1C1,MARS,PHKA1,POLR3H,PRPS1,PYCR2,RAD51D, SLC36A4,SRP68,TRMT61A,TSR1,TUBG1,UPF3B,XPOT |
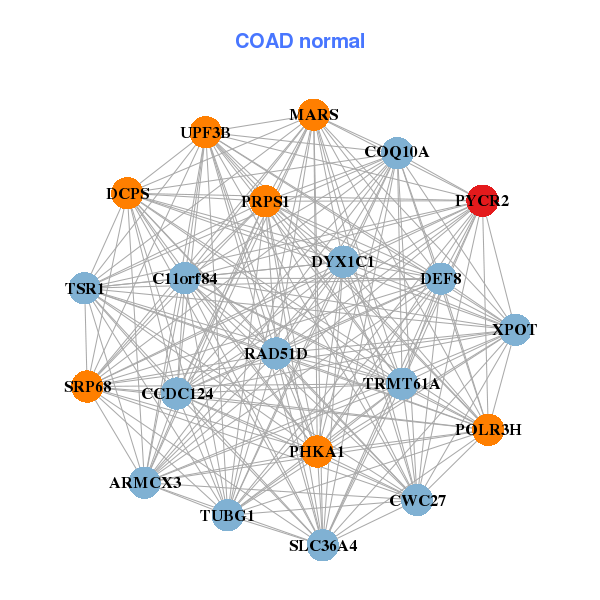
| * Co-Expression network figures were drawn using R package igraph. Only the top 20 genes with the highest correlations were shown. Red circle: input gene, orange circle: cell metabolism gene, sky circle: other gene |
: Open all plots for all cancer types
| Top |
: Open all interacting genes' information including KEGG pathway for all interacting genes from DAVID
| Top |
| Pharmacological Information for PYCR2 |
| DB Category | DB Name | DB's ID and Url link |
| * Gene Centered Interaction Network. |
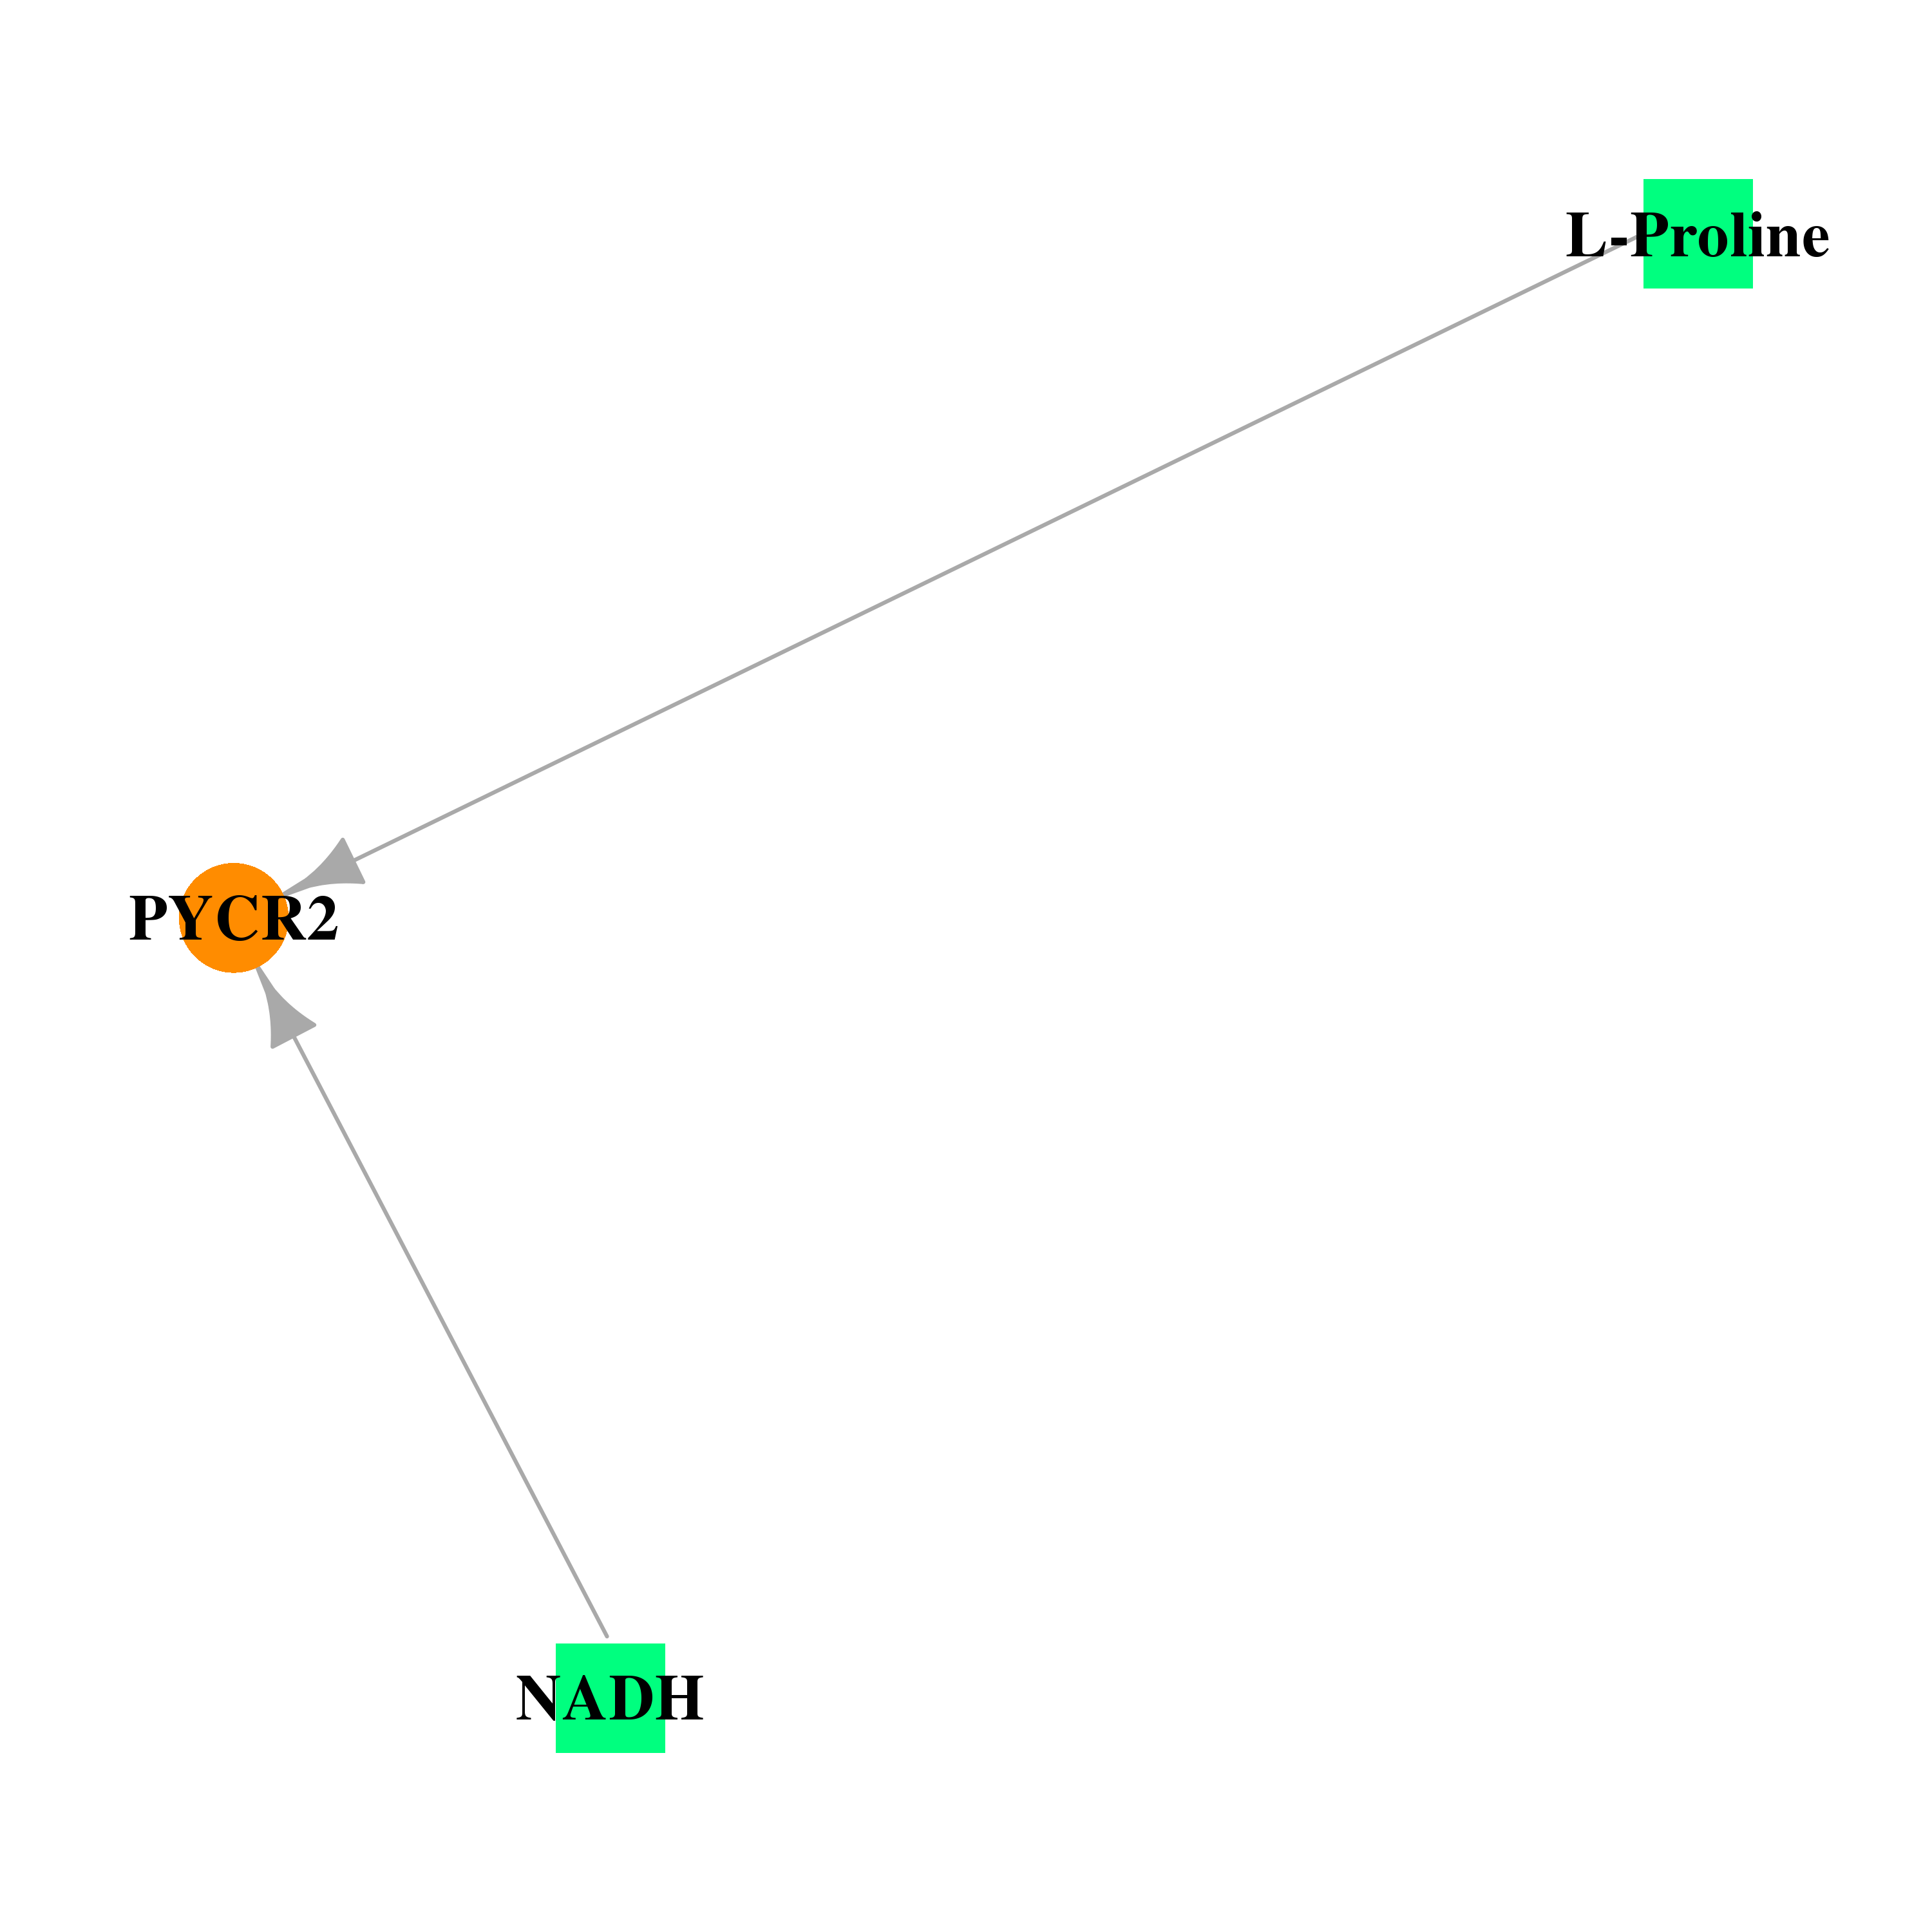 |
| * Drug Centered Interaction Network. |
| DrugBank ID | Target Name | Drug Groups | Generic Name | Drug Centered Network | Drug Structure |
| DB00157 | pyrroline-5-carboxylate reductase family, member 2 | approved; nutraceutical | NADH |  |  |
| DB00172 | pyrroline-5-carboxylate reductase family, member 2 | approved; nutraceutical | L-Proline | 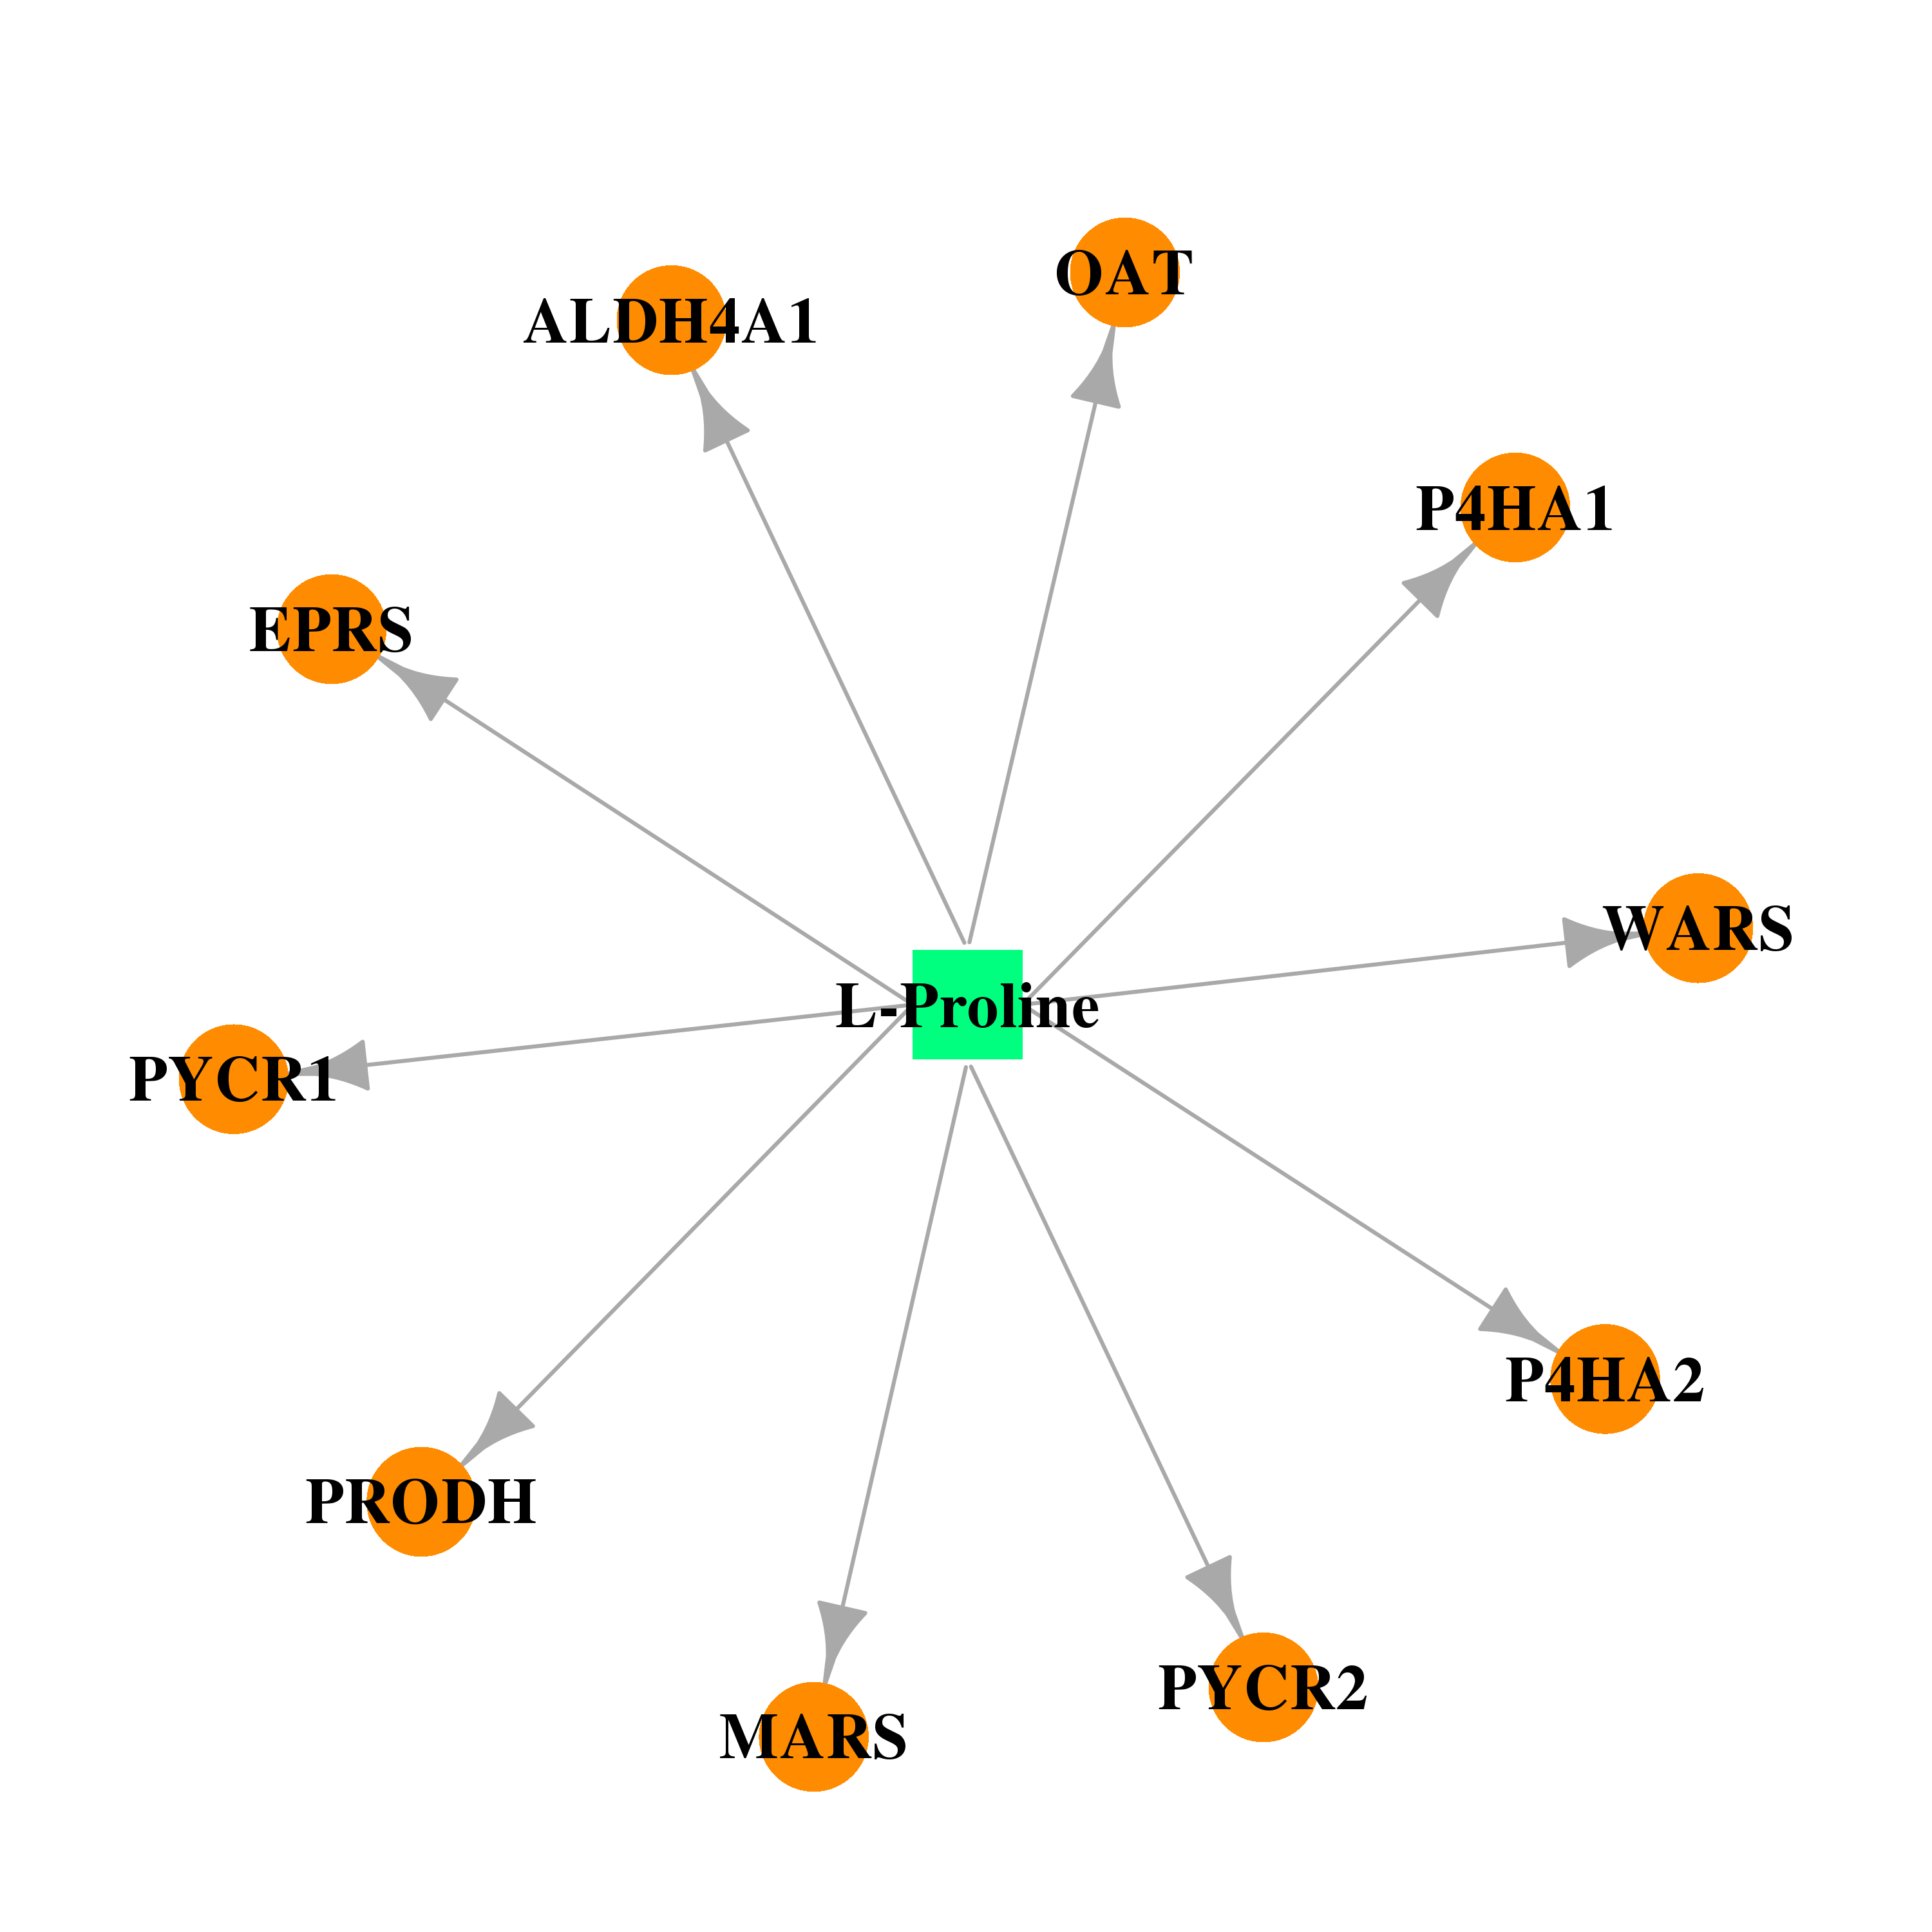 | 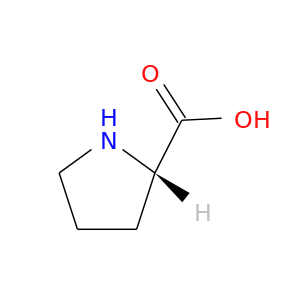 |
| Top |
| Cross referenced IDs for PYCR2 |
| * We obtained these cross-references from Uniprot database. It covers 150 different DBs, 18 categories. http://www.uniprot.org/help/cross_references_section |
: Open all cross reference information
|
Copyright © 2016-Present - The Univsersity of Texas Health Science Center at Houston @ |