|
||||||||||||||||||||||||||||||||||||||||||||||||||||||||||||||||||||||||||||||||||||||||||||||||||||||||||||||||||||||||||||||||||||||||||||||||||||||||||||||||||||||||||||||||||||||||||||||||||||||||||||||||||||||||||||||||||||||||||||||||||||||||||||||||||||||||||||||||||||||||||||||||||||||||||||||||||||||||||
| |
| Phenotypic Information (metabolism pathway, cancer, disease, phenome) |
| |
| |
| Gene-Gene Network Information: Co-Expression Network, Interacting Genes & KEGG |
| |
|


| Gene Summary for SEC61A1 |
| Basic gene info. | Gene symbol | SEC61A1 |
| Gene name | Sec61 alpha 1 subunit (S. cerevisiae) | |
| Synonyms | HSEC61|SEC61|SEC61A | |
| Cytomap | UCSC genome browser: 3q21.3 | |
| Genomic location | chr3 :127771211-127790526 | |
| Type of gene | protein-coding | |
| RefGenes | NM_013336.3, | |
| Ensembl id | ENSG00000058262 | |
| Description | Sec61 alpha-1protein transport protein SEC61 alpha subunitprotein transport protein Sec61 subunit alphaprotein transport protein Sec61 subunit alpha isoform 1sec61 homolog | |
| Modification date | 20141207 | |
| dbXrefs | MIM : 609213 | |
| HGNC : HGNC | ||
| Ensembl : ENSG00000058262 | ||
| HPRD : 15316 | ||
| Vega : OTTHUMG00000159624 | ||
| Protein | UniProt: go to UniProt's Cross Reference DB Table | |
| Expression | CleanEX: HS_SEC61A1 | |
| BioGPS: 29927 | ||
| Gene Expression Atlas: ENSG00000058262 | ||
| The Human Protein Atlas: ENSG00000058262 | ||
| Pathway | NCI Pathway Interaction Database: SEC61A1 | |
| KEGG: SEC61A1 | ||
| REACTOME: SEC61A1 | ||
| ConsensusPathDB | ||
| Pathway Commons: SEC61A1 | ||
| Metabolism | MetaCyc: SEC61A1 | |
| HUMANCyc: SEC61A1 | ||
| Regulation | Ensembl's Regulation: ENSG00000058262 | |
| miRBase: chr3 :127,771,211-127,790,526 | ||
| TargetScan: NM_013336 | ||
| cisRED: ENSG00000058262 | ||
| Context | iHOP: SEC61A1 | |
| cancer metabolism search in PubMed: SEC61A1 | ||
| UCL Cancer Institute: SEC61A1 | ||
| Assigned class in ccmGDB | C | |
| Top |
| Phenotypic Information for SEC61A1(metabolism pathway, cancer, disease, phenome) |
| Cancer | CGAP: SEC61A1 |
| Familial Cancer Database: SEC61A1 | |
| * This gene is included in those cancer gene databases. |
|
|
|
|
|
| . | ||||||||||||||||||||||||||||||||||||||||||||||||||||||||||||||||||||||||||||||||||||||||||||||||||||||||||||||||||||||||||||||||||||||||||||||||||||||||||||||||||||||||||||||||||||||||||||||||||||||||||||||||||||||||||||||||||||||||||||||||||||||||||||||||||||||||||||||||||||||||||||||||||||||||||||||||||||
Oncogene 1 | Significant driver gene in | |||||||||||||||||||||||||||||||||||||||||||||||||||||||||||||||||||||||||||||||||||||||||||||||||||||||||||||||||||||||||||||||||||||||||||||||||||||||||||||||||||||||||||||||||||||||||||||||||||||||||||||||||||||||||||||||||||||||||||||||||||||||||||||||||||||||||||||||||||||||||||||||||||||||||||||||||||||||||
| cf) number; DB name 1 Oncogene; http://nar.oxfordjournals.org/content/35/suppl_1/D721.long, 2 Tumor Suppressor gene; https://bioinfo.uth.edu/TSGene/, 3 Cancer Gene Census; http://www.nature.com/nrc/journal/v4/n3/abs/nrc1299.html, 4 CancerGenes; http://nar.oxfordjournals.org/content/35/suppl_1/D721.long, 5 Network of Cancer Gene; http://ncg.kcl.ac.uk/index.php, 1Therapeutic Vulnerabilities in Cancer; http://cbio.mskcc.org/cancergenomics/statius/ |
| REACTOME_METABOLISM_OF_PROTEINS | |
| Mutations for SEC61A1 |
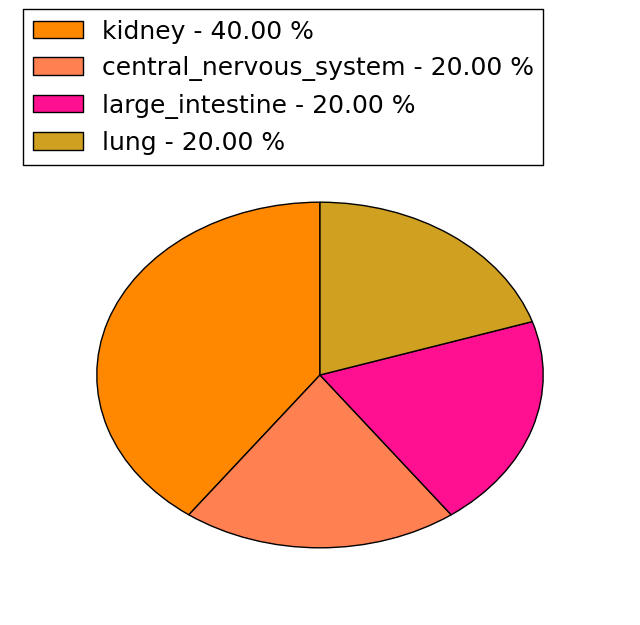
| * Under tables are showing count per each tissue to give us broad intuition about tissue specific mutation patterns.You can go to the detailed page for each mutation database's web site. |
| There's no structural variation information in COSMIC data for this gene. |
| * From mRNA Sanger sequences, Chitars2.0 arranged chimeric transcripts. This table shows SEC61A1 related fusion information. |
| ID | Head Gene | Tail Gene | Accession | Gene_a | qStart_a | qEnd_a | Chromosome_a | tStart_a | tEnd_a | Gene_a | qStart_a | qEnd_a | Chromosome_a | tStart_a | tEnd_a |
| BF959743 | DIDO1 | 14 | 368 | 20 | 61538603 | 61541296 | SEC61A1 | 360 | 431 | 3 | 127789080 | 127789151 | |
| AW105324 | SEC61A1 | 1 | 193 | 3 | 127790242 | 127790434 | CCT5 | 190 | 315 | 5 | 10262662 | 10263302 | |
| DA769011 | SNHG1 | 1 | 66 | 11 | 62622486 | 62622551 | SEC61A1 | 66 | 518 | 3 | 127785924 | 127788431 | |
| DA580258 | ZC3H11A | 1 | 155 | 1 | 203764776 | 203764930 | SEC61A1 | 156 | 562 | 3 | 127775637 | 127783815 | |
| AA405428 | SEC61A1 | 41 | 149 | 3 | 127787546 | 127787654 | SEC61A1 | 144 | 392 | 3 | 127788221 | 127788468 | |
| AW939919 | SEC61A1 | 1 | 136 | 3 | 127789016 | 127789152 | SEC61A1 | 119 | 223 | 3 | 127789165 | 127789271 | |
| AW897979 | GUCY1A3 | 12 | 488 | 4 | 156653270 | 156653746 | SEC61A1 | 478 | 636 | 3 | 127788885 | 127789044 | |
| BE835544 | UBTF | 1 | 278 | 17 | 42285808 | 42286084 | SEC61A1 | 275 | 432 | 3 | 127789422 | 127789579 | |
| BF748943 | SEC61A1 | 16 | 253 | 3 | 127789430 | 127789668 | SEC61A1 | 247 | 596 | 3 | 127788923 | 127789272 | |
| Top |
| Mutation type/ Tissue ID | brca | cns | cerv | endome | haematopo | kidn | Lintest | liver | lung | ns | ovary | pancre | prost | skin | stoma | thyro | urina | |||
| Total # sample | 1 | |||||||||||||||||||
| GAIN (# sample) | ||||||||||||||||||||
| LOSS (# sample) | 1 |
| cf) Tissue ID; Tissue type (1; Breast, 2; Central_nervous_system, 3; Cervix, 4; Endometrium, 5; Haematopoietic_and_lymphoid_tissue, 6; Kidney, 7; Large_intestine, 8; Liver, 9; Lung, 10; NS, 11; Ovary, 12; Pancreas, 13; Prostate, 14; Skin, 15; Stomach, 16; Thyroid, 17; Urinary_tract) |
| Top |
|
 |
| Top |
| Stat. for Non-Synonymous SNVs (# total SNVs=33) | (# total SNVs=5) |
 |  |
(# total SNVs=0) | (# total SNVs=0) |
| Top |
| * When you move the cursor on each content, you can see more deailed mutation information on the Tooltip. Those are primary_site,primary_histology,mutation(aa),pubmedID. |
| GRCh37 position | Mutation(aa) | Unique sampleID count |
| chr3:127779411-127779411 | p.L175I | 2 |
| chr3:127783794-127783794 | p.R231W | 2 |
| chr3:127783795-127783795 | p.R231Q | 2 |
| chr3:127785825-127785825 | p.S269L | 2 |
| chr3:127788458-127788458 | p.V462I | 2 |
| chr3:127783746-127783746 | p.A215T | 2 |
| chr3:127786902-127786902 | p.R415L | 2 |
| chr3:127783771-127783771 | p.R223H | 2 |
| chr3:127788405-127788405 | p.G444V | 1 |
| chr3:127783784-127783784 | p.V227V | 1 |
| Top |
|
 |
| Point Mutation/ Tissue ID | 1 | 2 | 3 | 4 | 5 | 6 | 7 | 8 | 9 | 10 | 11 | 12 | 13 | 14 | 15 | 16 | 17 | 18 | 19 | 20 |
| # sample | 2 | 9 | 3 | 1 | 4 | 2 | 2 | 1 | 3 | 5 | 4 | |||||||||
| # mutation | 2 | 8 | 3 | 1 | 5 | 2 | 2 | 1 | 3 | 6 | 4 | |||||||||
| nonsynonymous SNV | 2 | 8 | 2 | 4 | 2 | 2 | 1 | 1 | 2 | 4 | ||||||||||
| synonymous SNV | 1 | 1 | 1 | 2 | 4 |
| cf) Tissue ID; Tissue type (1; BLCA[Bladder Urothelial Carcinoma], 2; BRCA[Breast invasive carcinoma], 3; CESC[Cervical squamous cell carcinoma and endocervical adenocarcinoma], 4; COAD[Colon adenocarcinoma], 5; GBM[Glioblastoma multiforme], 6; Glioma Low Grade, 7; HNSC[Head and Neck squamous cell carcinoma], 8; KICH[Kidney Chromophobe], 9; KIRC[Kidney renal clear cell carcinoma], 10; KIRP[Kidney renal papillary cell carcinoma], 11; LAML[Acute Myeloid Leukemia], 12; LUAD[Lung adenocarcinoma], 13; LUSC[Lung squamous cell carcinoma], 14; OV[Ovarian serous cystadenocarcinoma ], 15; PAAD[Pancreatic adenocarcinoma], 16; PRAD[Prostate adenocarcinoma], 17; SKCM[Skin Cutaneous Melanoma], 18:STAD[Stomach adenocarcinoma], 19:THCA[Thyroid carcinoma], 20:UCEC[Uterine Corpus Endometrial Carcinoma]) |
| Top |
| * We represented just top 10 SNVs. When you move the cursor on each content, you can see more deailed mutation information on the Tooltip. Those are primary_site, primary_histology, mutation(aa), pubmedID. |
| Genomic Position | Mutation(aa) | Unique sampleID count |
| chr3:127783746 | p.A215T | 3 |
| chr3:127788458 | p.S269L | 2 |
| chr3:127783795 | p.V462I | 2 |
| chr3:127785825 | p.R415Q | 2 |
| chr3:127786902 | p.R231L | 2 |
| chr3:127786324 | p.I246I | 1 |
| chr3:127774381 | p.G446W | 1 |
| chr3:127788428 | p.L33P | 1 |
| chr3:127783766 | p.T452A | 1 |
| chr3:127786337 | p.F51Y | 1 |
| * Copy number data were extracted from TCGA using R package TCGA-Assembler. The URLs of all public data files on TCGA DCC data server were gathered on Jan-05-2015. Function ProcessCNAData in TCGA-Assembler package was used to obtain gene-level copy number value which is calculated as the average copy number of the genomic region of a gene. |
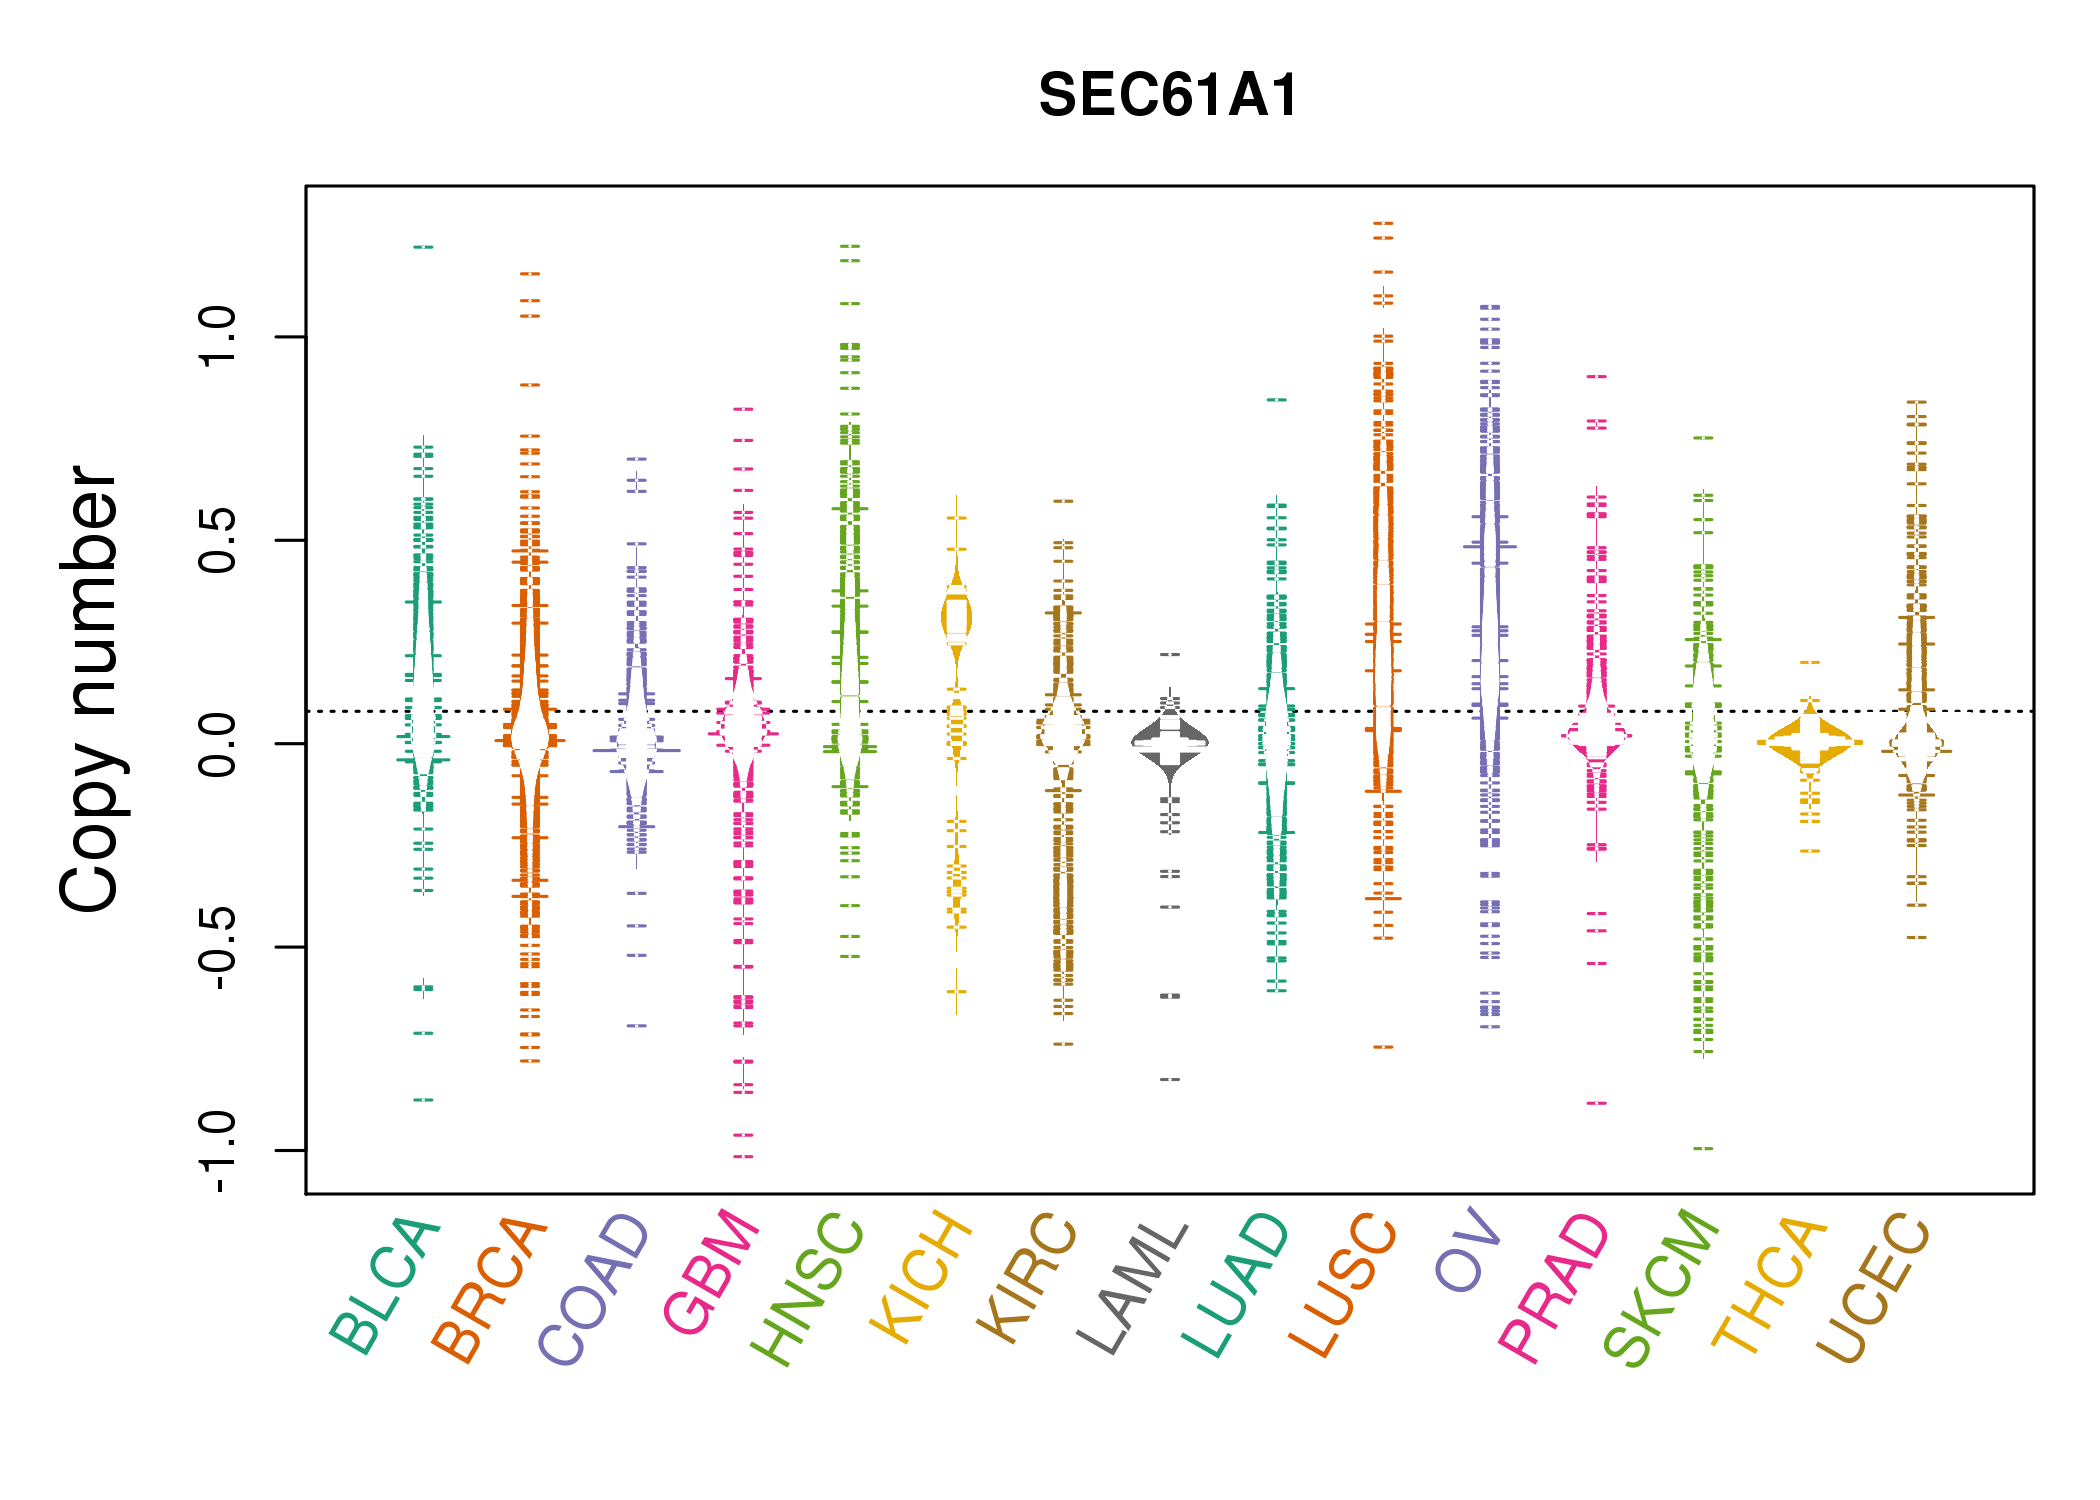 |
| cf) Tissue ID[Tissue type]: BLCA[Bladder Urothelial Carcinoma], BRCA[Breast invasive carcinoma], CESC[Cervical squamous cell carcinoma and endocervical adenocarcinoma], COAD[Colon adenocarcinoma], GBM[Glioblastoma multiforme], Glioma Low Grade, HNSC[Head and Neck squamous cell carcinoma], KICH[Kidney Chromophobe], KIRC[Kidney renal clear cell carcinoma], KIRP[Kidney renal papillary cell carcinoma], LAML[Acute Myeloid Leukemia], LUAD[Lung adenocarcinoma], LUSC[Lung squamous cell carcinoma], OV[Ovarian serous cystadenocarcinoma ], PAAD[Pancreatic adenocarcinoma], PRAD[Prostate adenocarcinoma], SKCM[Skin Cutaneous Melanoma], STAD[Stomach adenocarcinoma], THCA[Thyroid carcinoma], UCEC[Uterine Corpus Endometrial Carcinoma] |
| Top |
| Gene Expression for SEC61A1 |
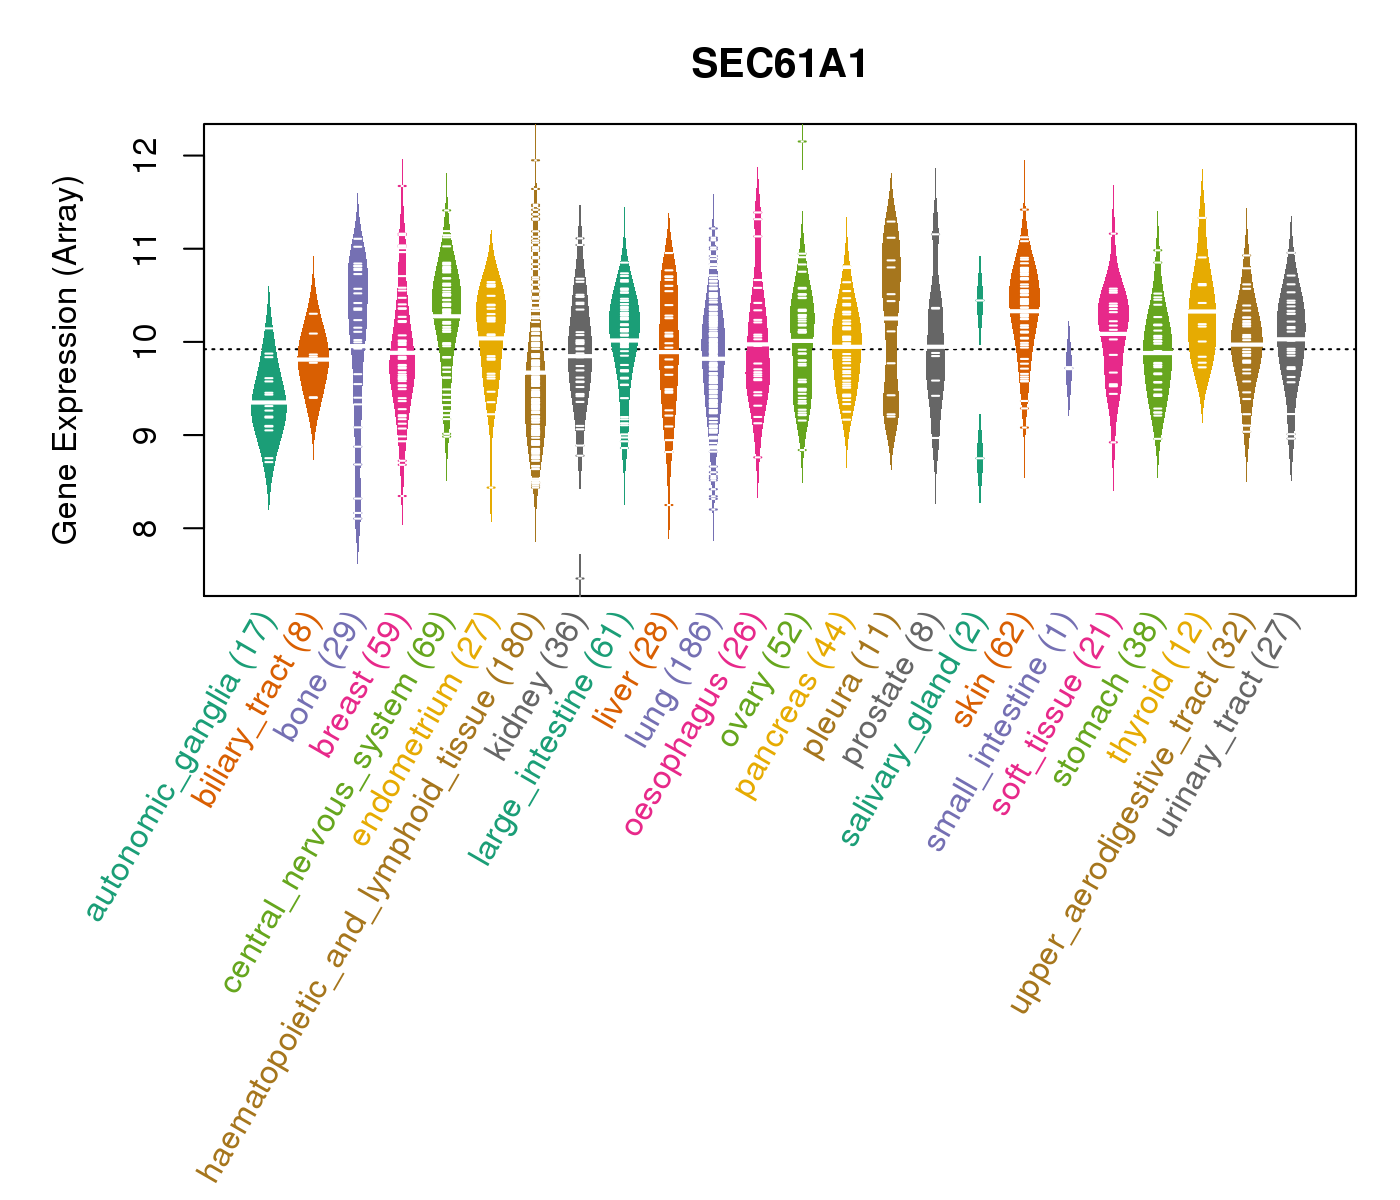
| * CCLE gene expression data were extracted from CCLE_Expression_Entrez_2012-10-18.res: Gene-centric RMA-normalized mRNA expression data. |
 |
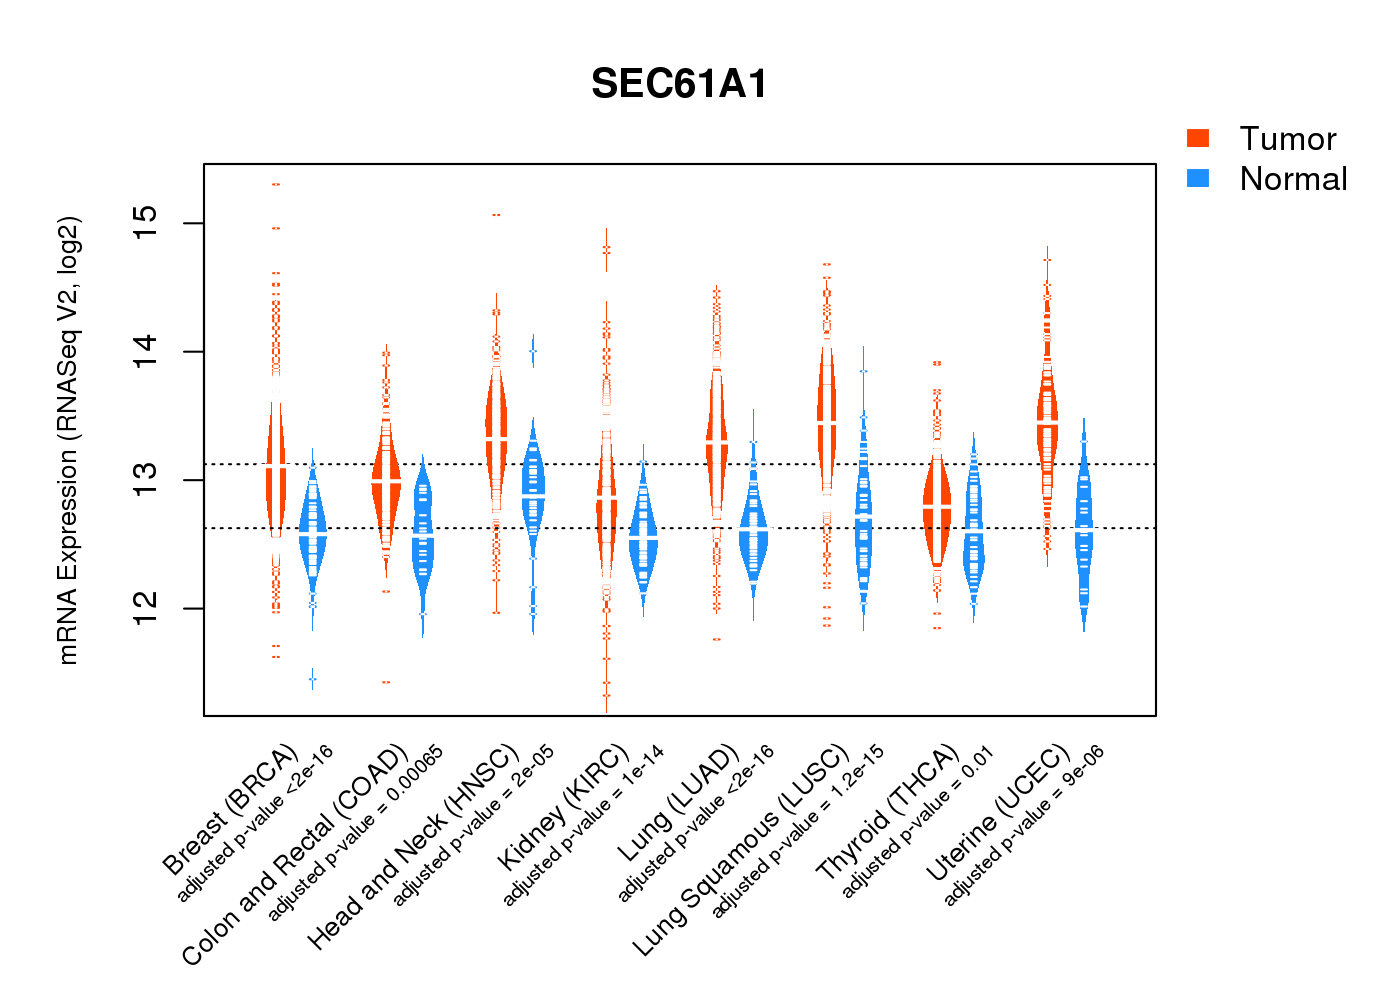
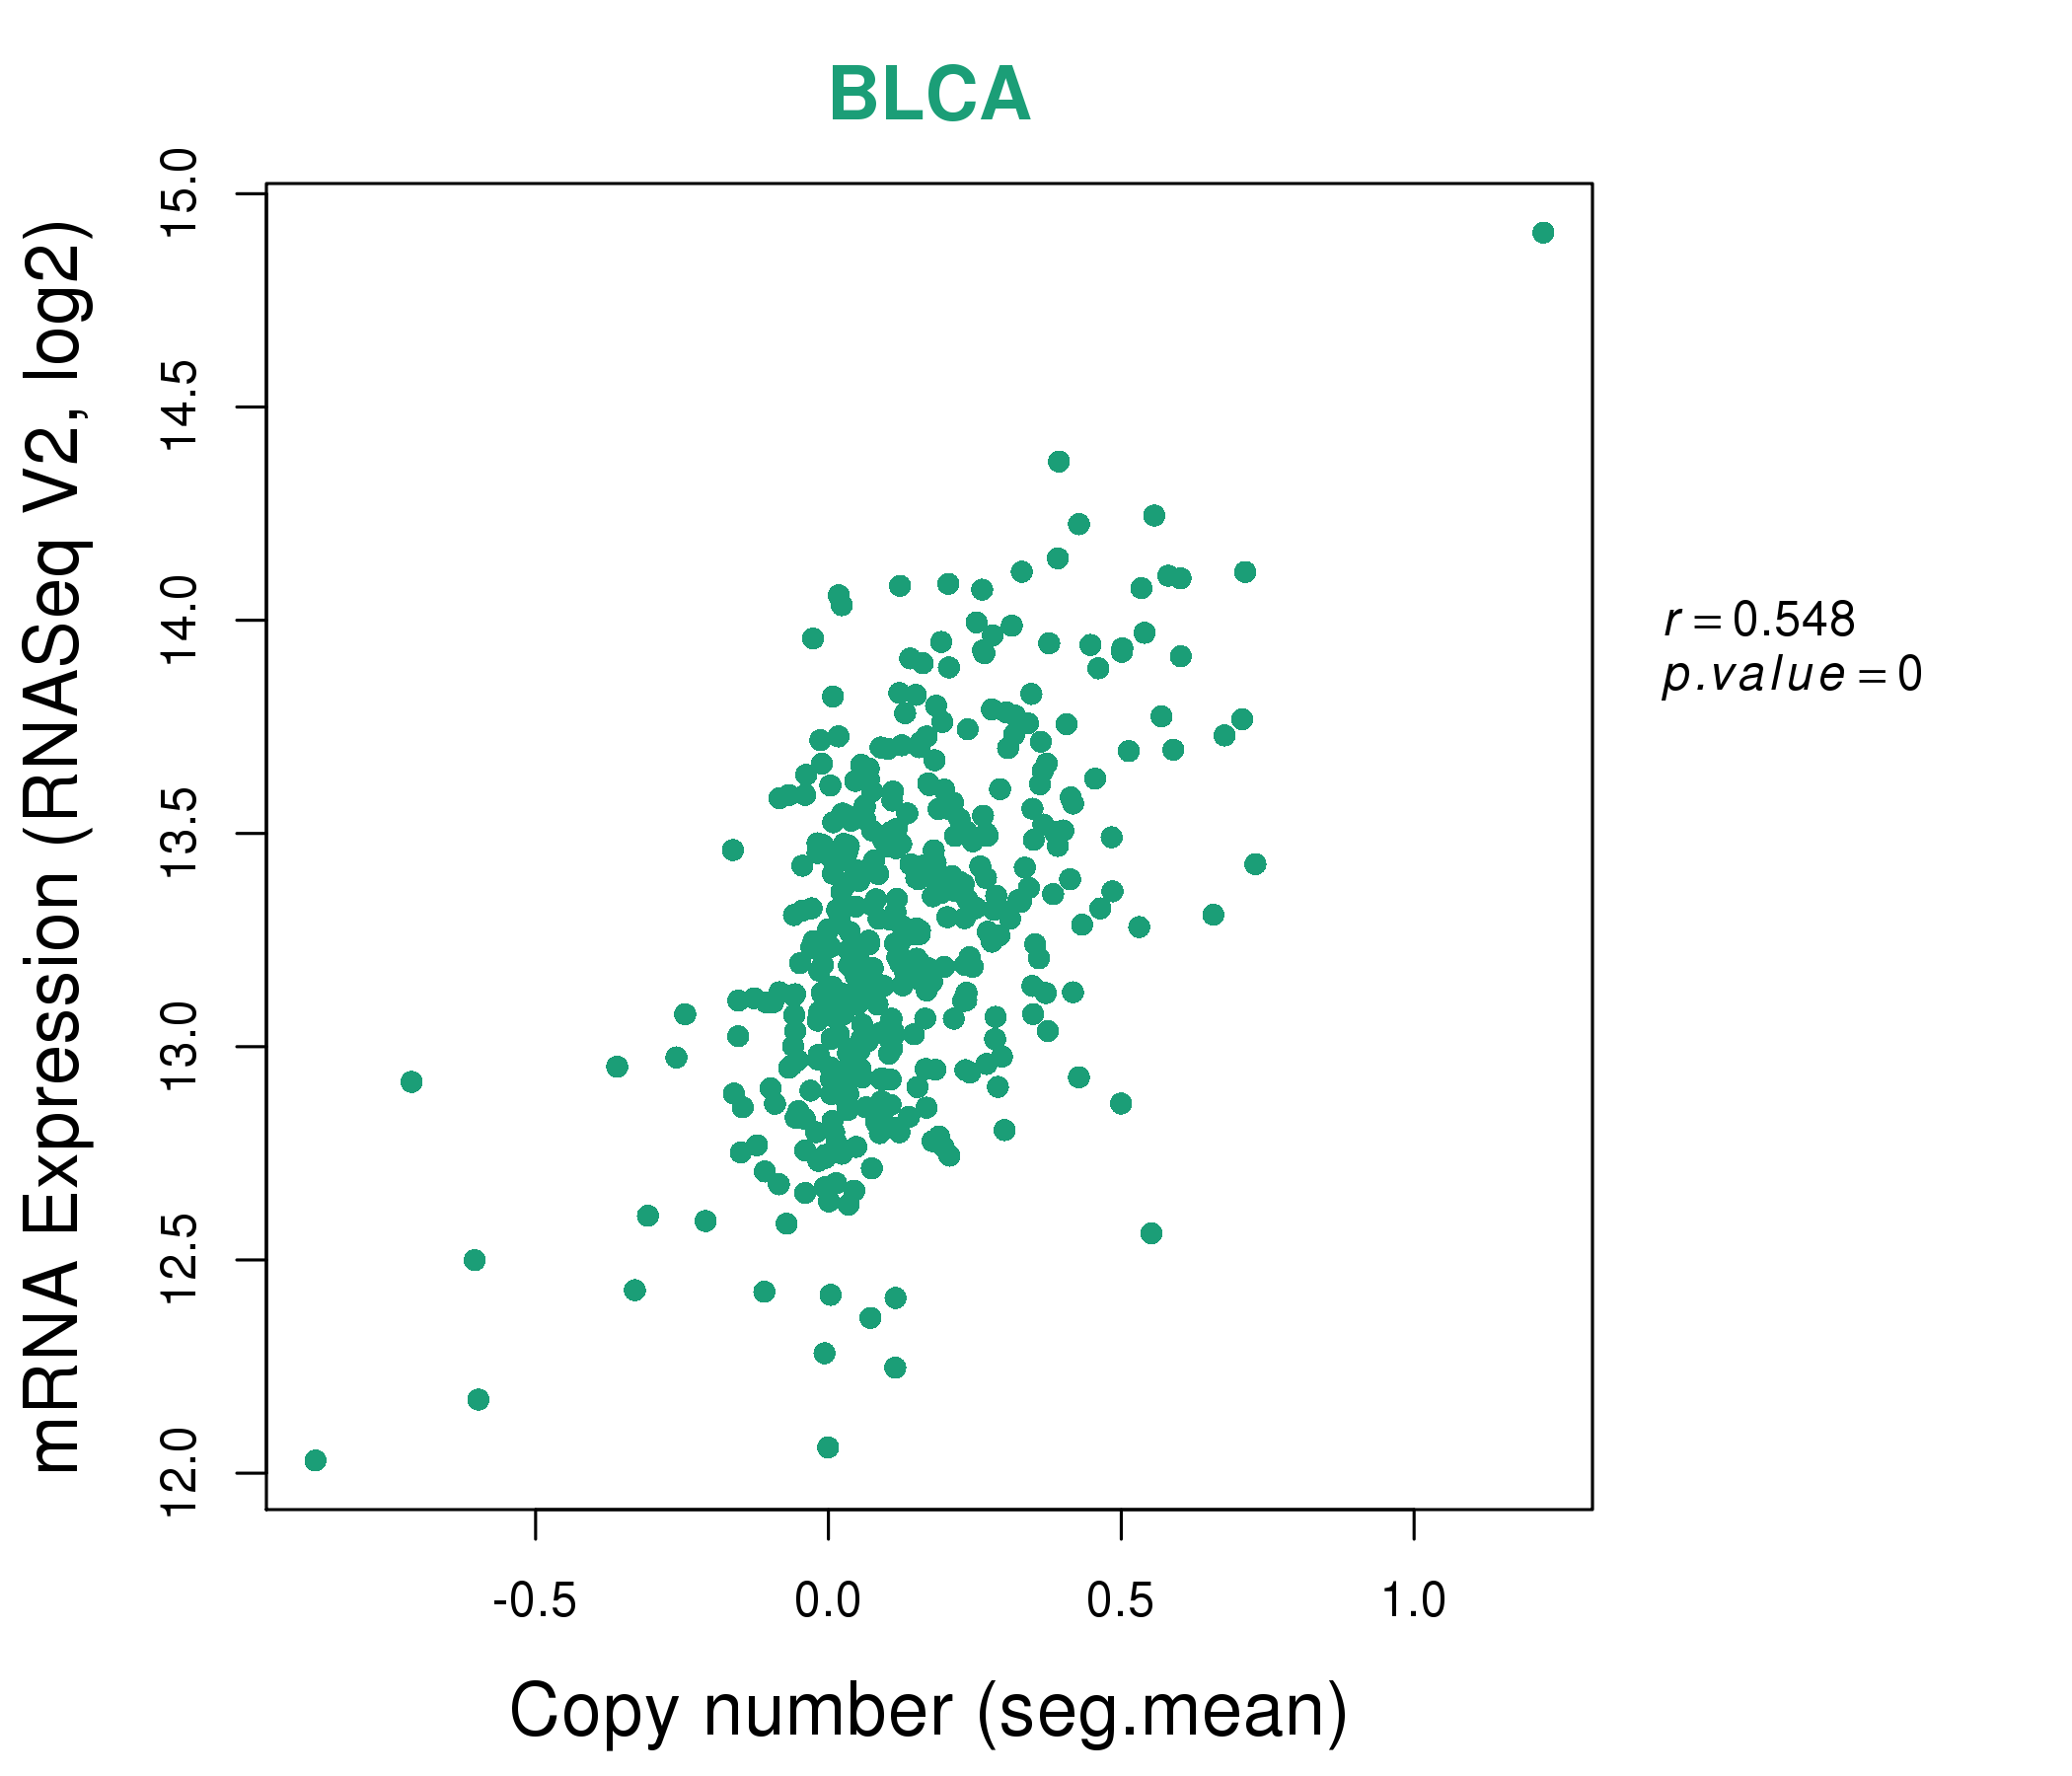
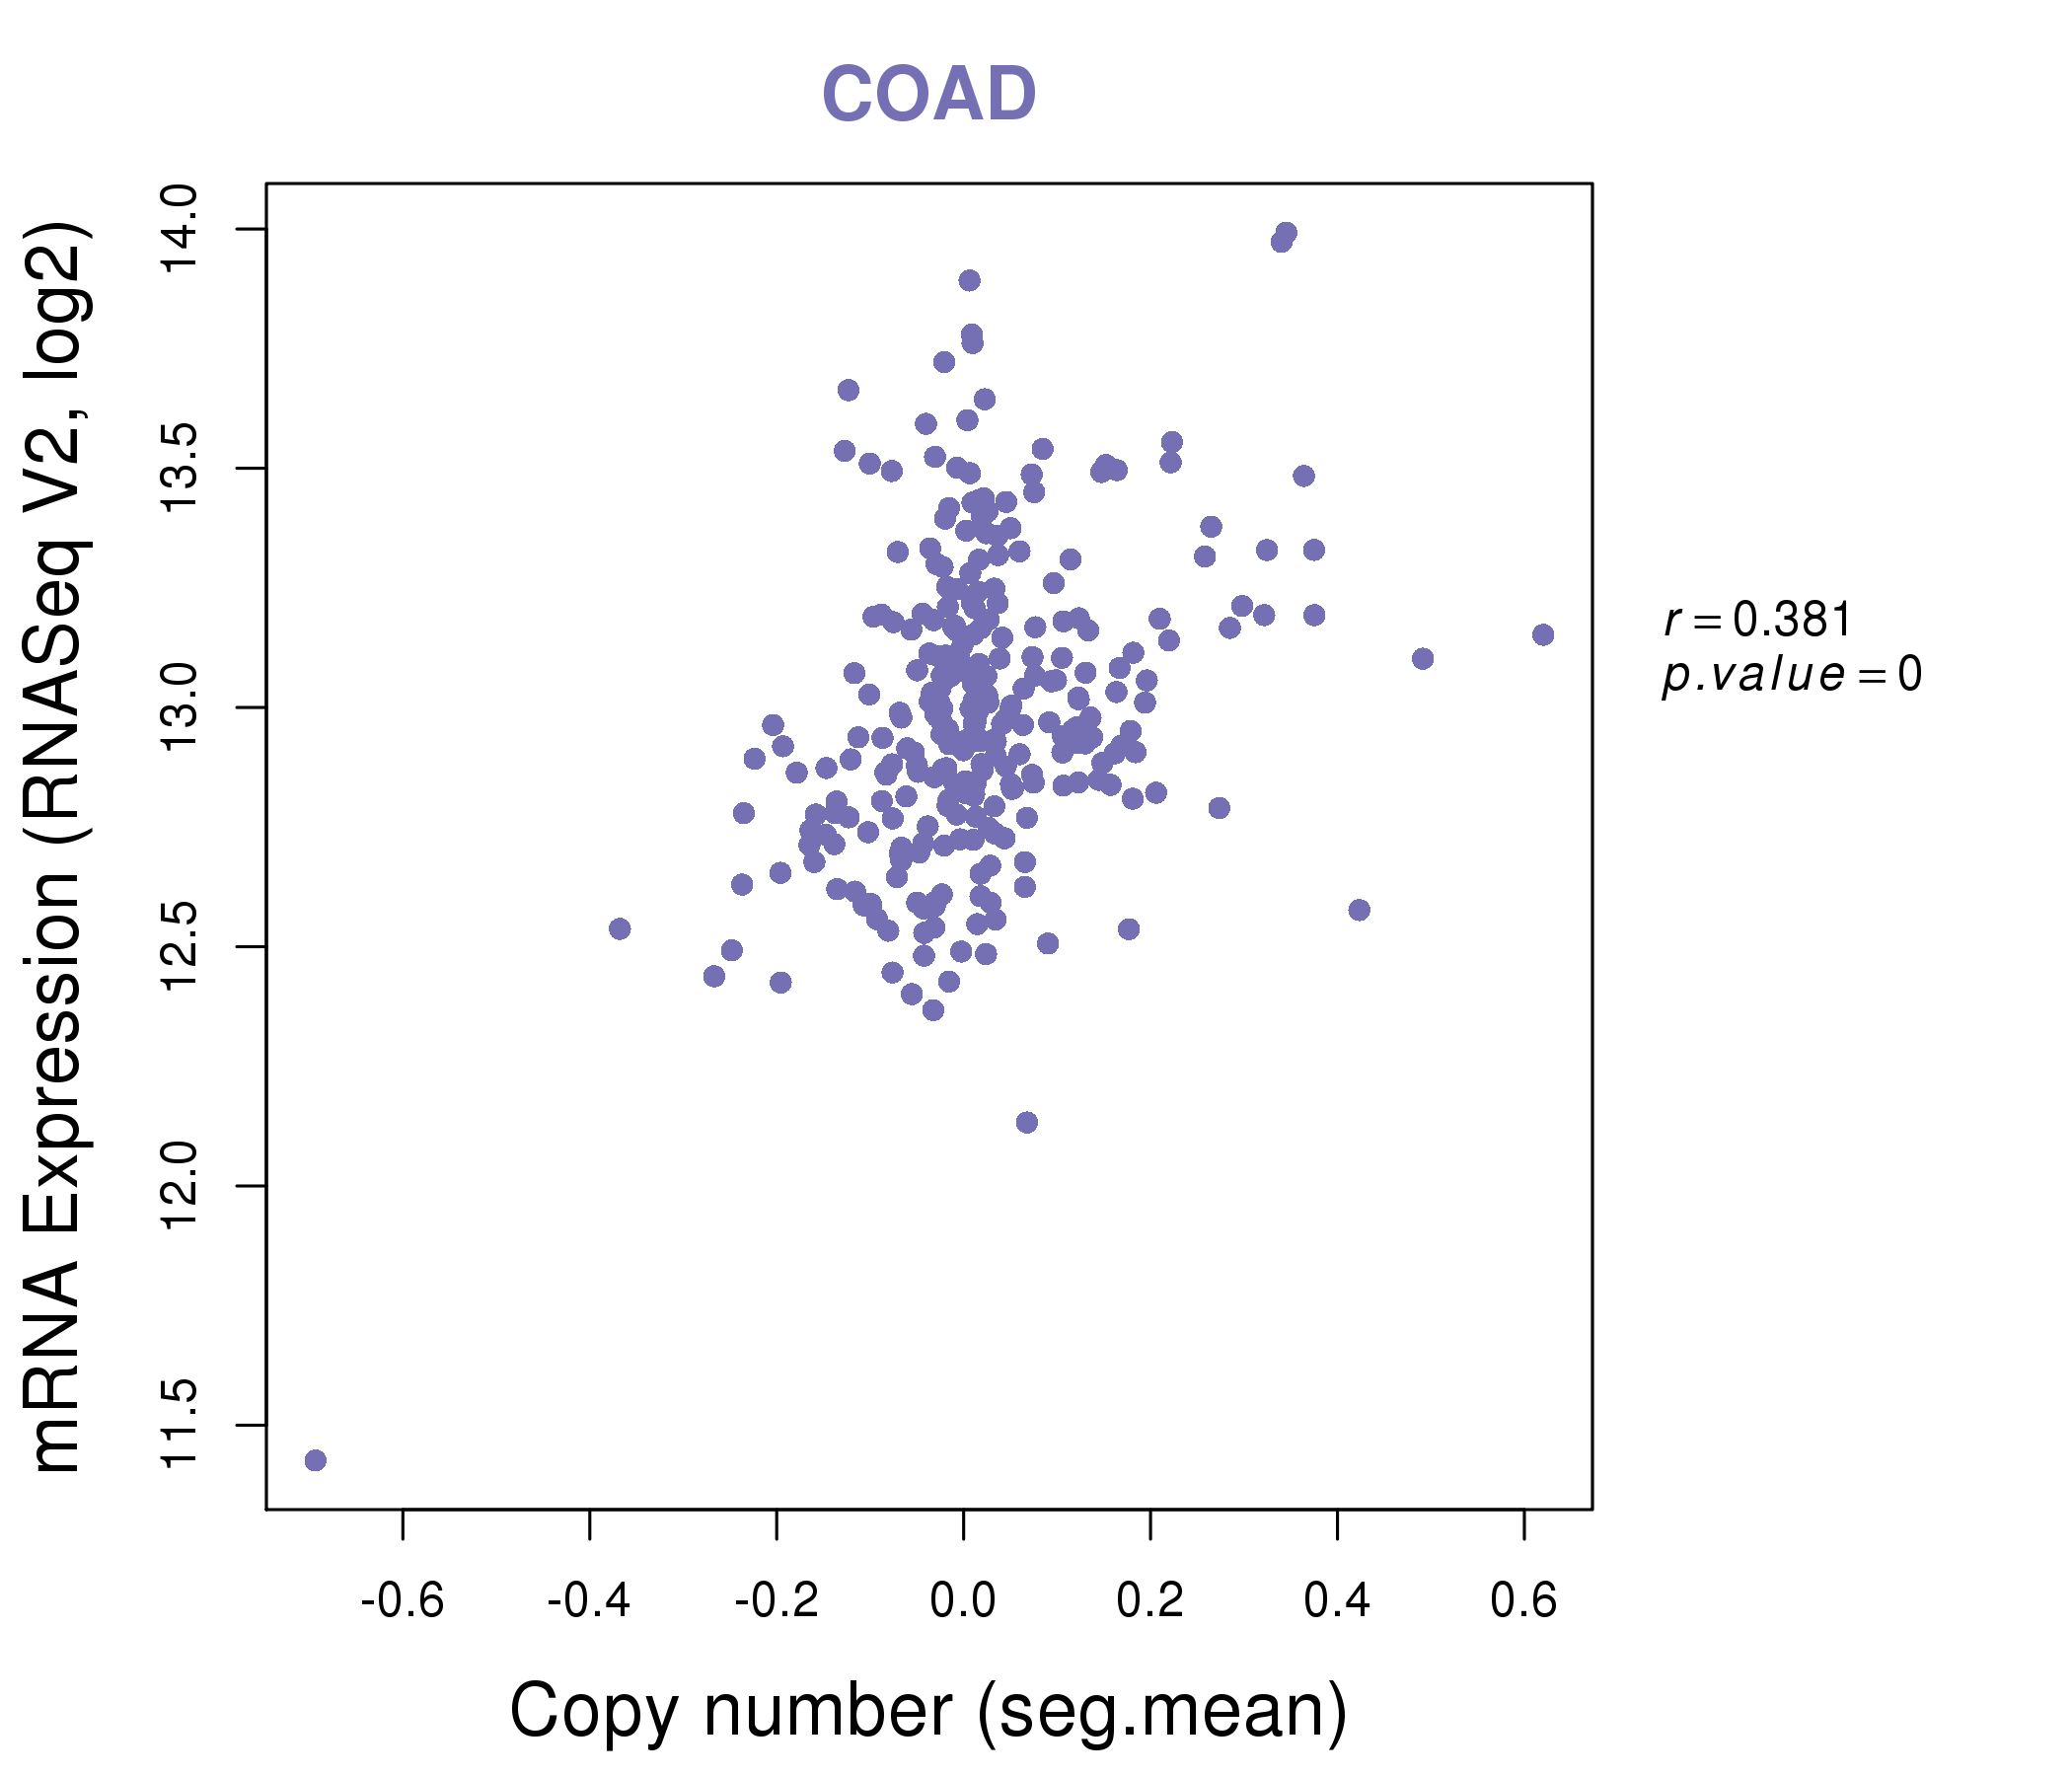
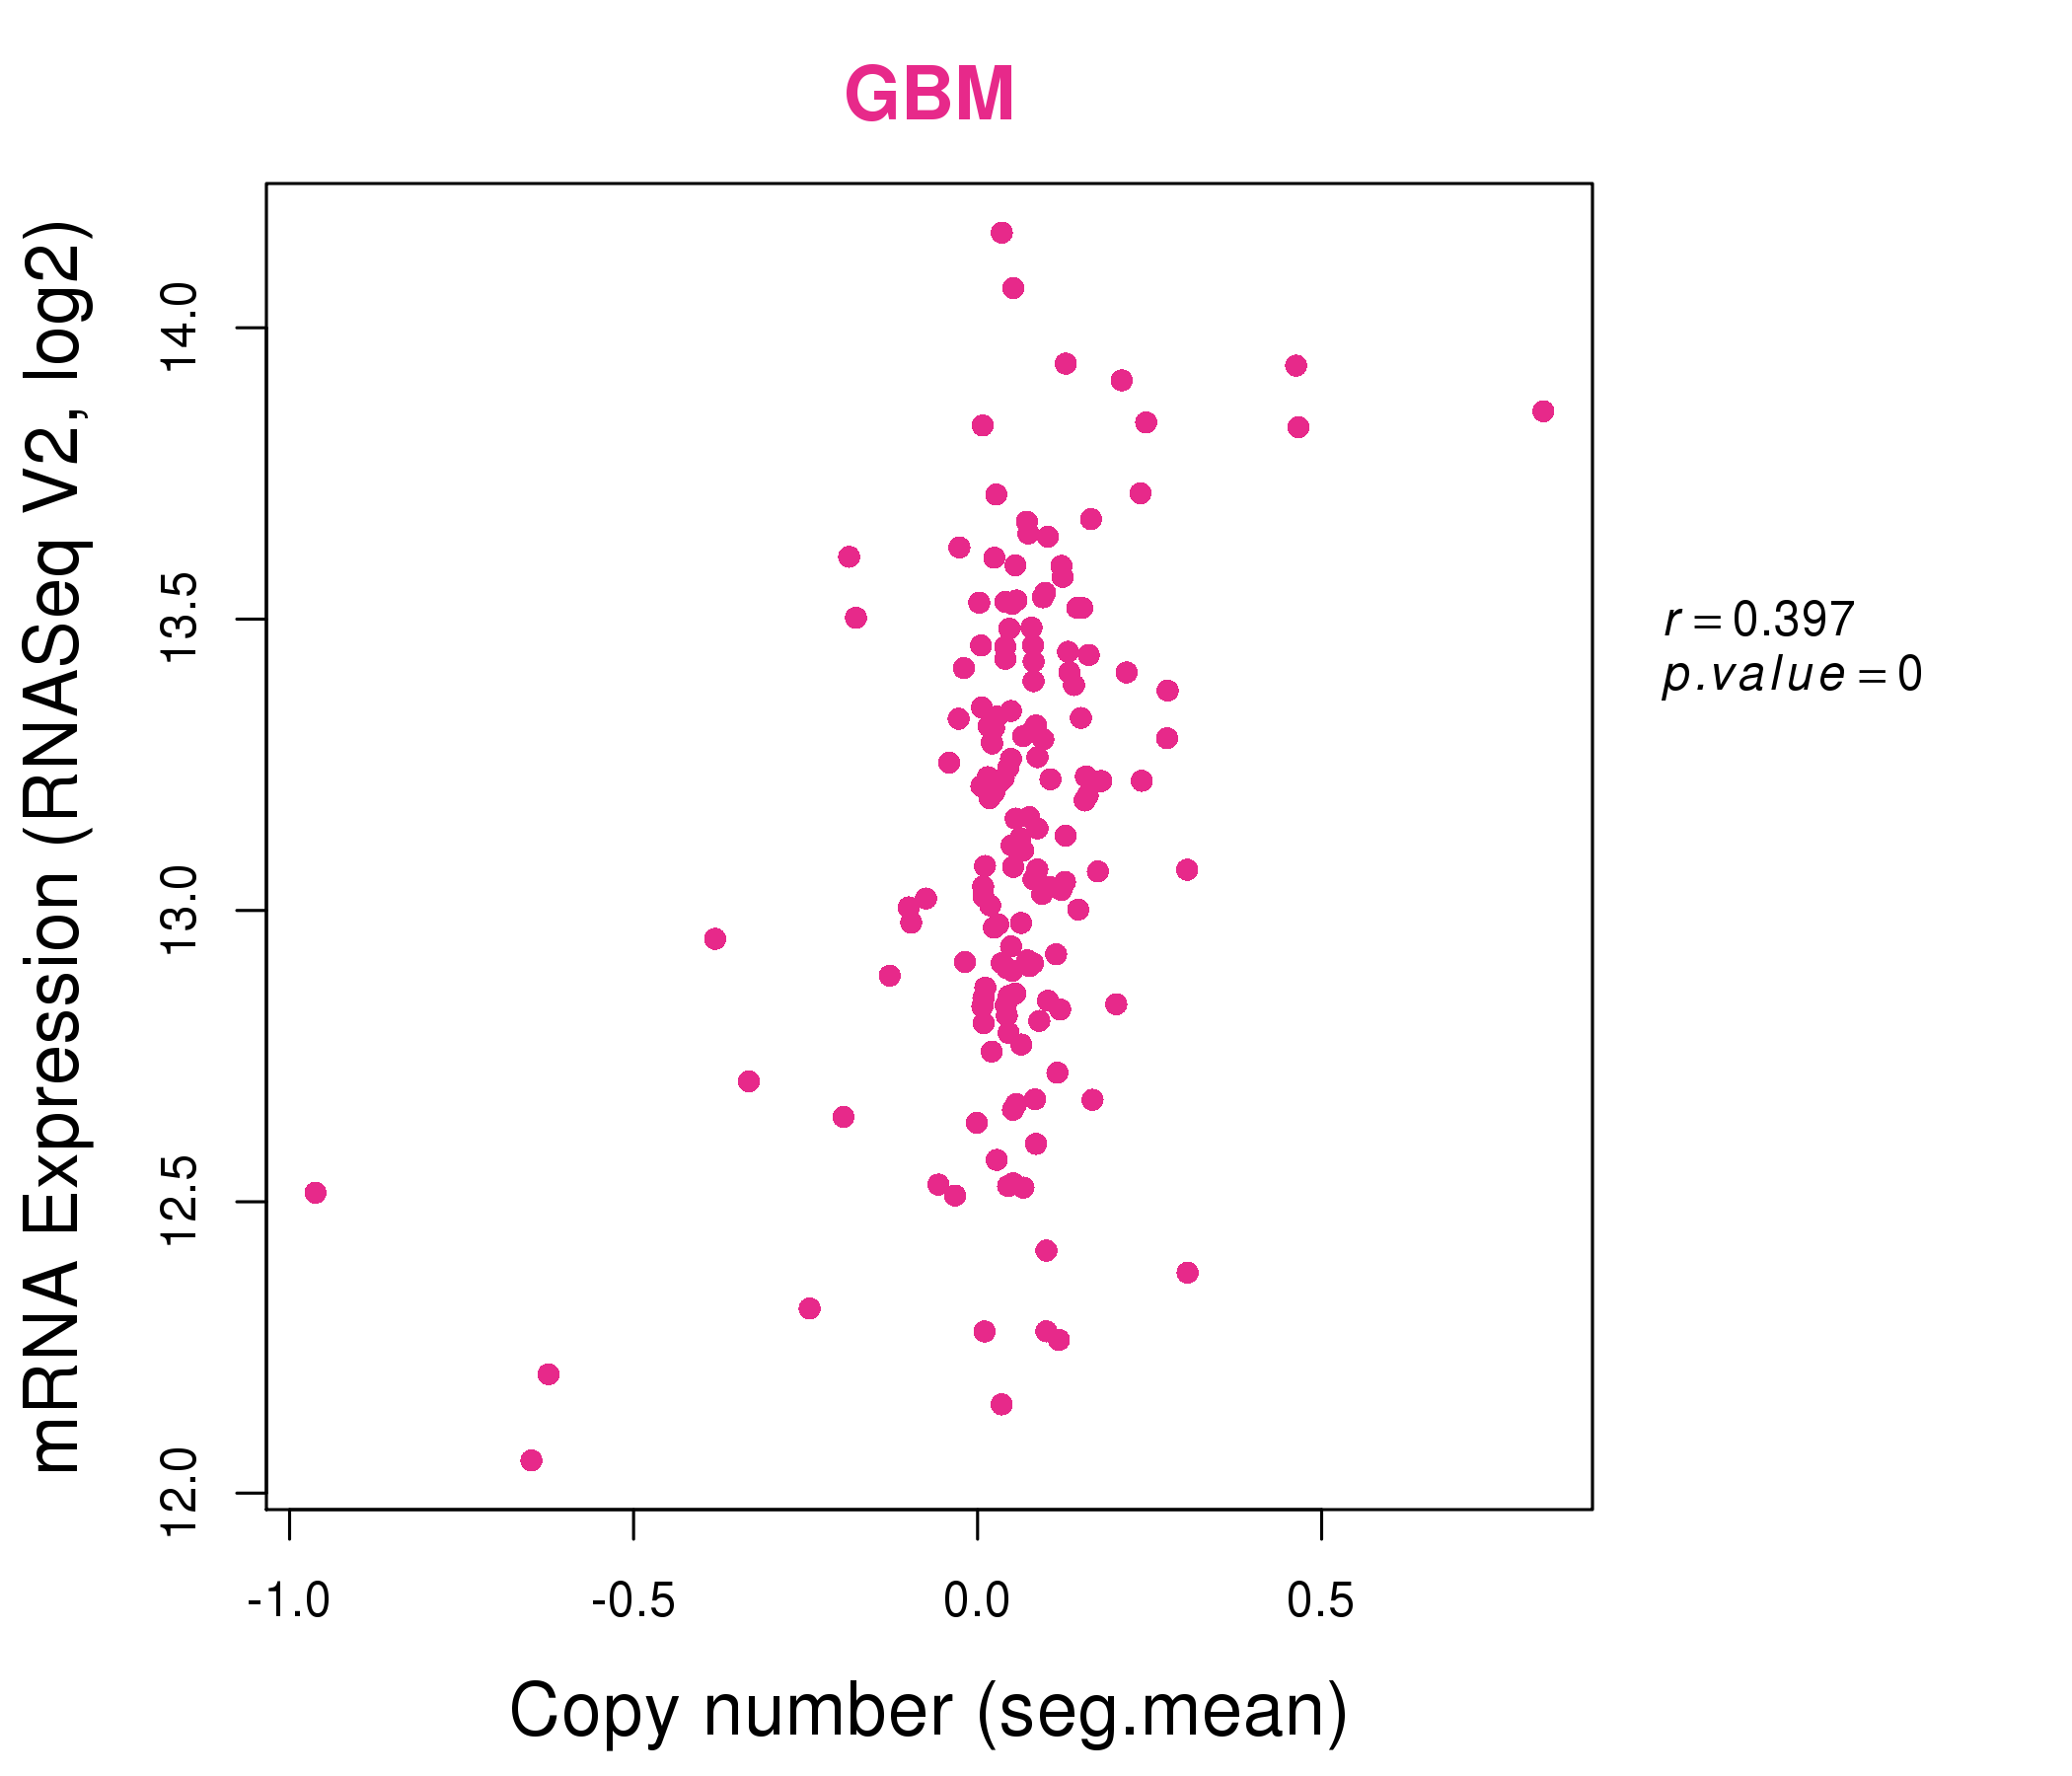
| * Normalized gene expression data of RNASeqV2 was extracted from TCGA using R package TCGA-Assembler. The URLs of all public data files on TCGA DCC data server were gathered at Jan-05-2015. Only eight cancer types have enough normal control samples for differential expression analysis. (t test, adjusted p<0.05 (using Benjamini-Hochberg FDR)) |
 |
| Top |
| * This plots show the correlation between CNV and gene expression. |
: Open all plots for all cancer types
 |
|
 |
|

| Top |
| Gene-Gene Network Information |
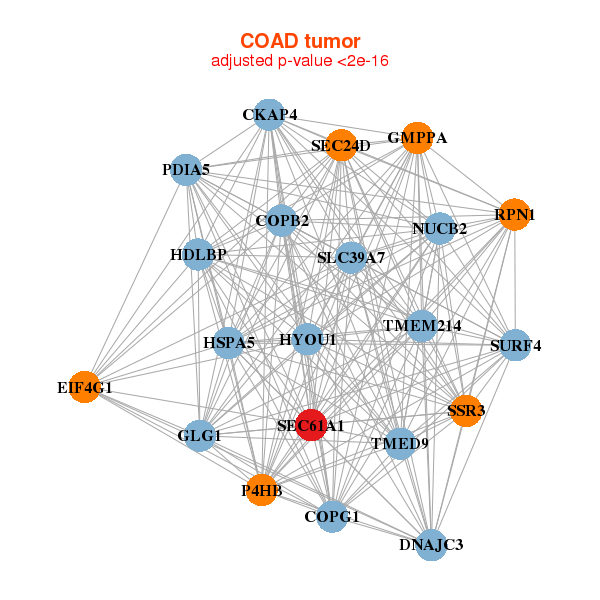
| * Co-Expression network figures were drawn using R package igraph. Only the top 20 genes with the highest correlations were shown. Red circle: input gene, orange circle: cell metabolism gene, sky circle: other gene |
: Open all plots for all cancer types
 |
|
| ACAD9,AP2M1,TIMMDC1,HMCES,CALR,COPB2,COPG1, DDOST,DNAJB11,HSP90B1,HYOU1,ISY1,P4HB,PDIA4, PDIA5,PDIA6,RPN1,SEC61A1,SRPRB,TMEM214,TMEM39A | AP1B1,CALR,CHPF2,CHPF,CKAP4,CNDP2,DDOST, GMPPB,HSPA5,HYOU1,P4HB,PDIA3P1,PDIA4,PDIA6, RPN1,RUVBL1,SEC61A1,SEPT9,SRPRB,ST14,YARS |
 |
|
| CKAP4,COPB2,COPG1,DNAJC3,EIF4G1,GLG1,GMPPA, HDLBP,HSPA5,HYOU1,NUCB2,P4HB,PDIA5,RPN1, SEC24D,SEC61A1,SLC39A7,SSR3,SURF4,TMED9,TMEM214 | COPG1,EFTUD2,HIRA,HNRNPM,HYOU1,LMNB2,LOC401010, MED24,MTA2,MYO1B,NCLN,PDIA4,PTBP1,RPN2, SEC61A1,SLC5A6,STT3A,TMEM104,TMEM214,UGGT1,VARS |
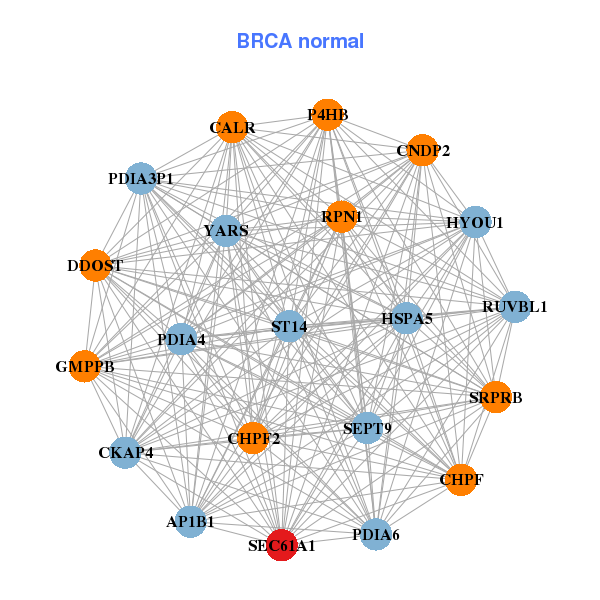
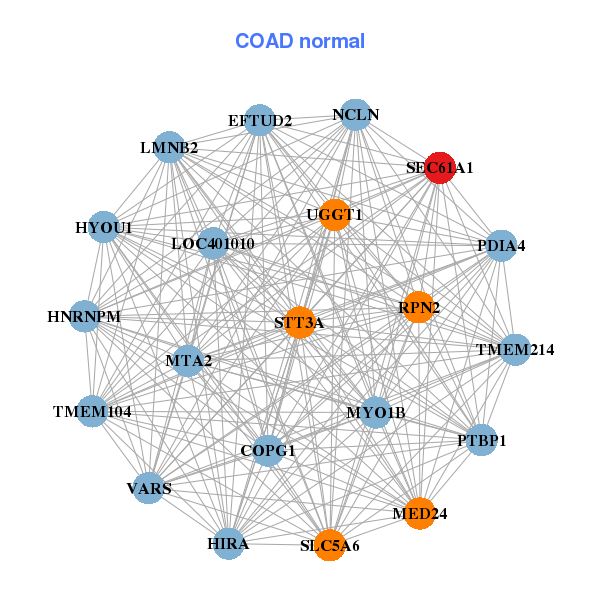
| * Co-Expression network figures were drawn using R package igraph. Only the top 20 genes with the highest correlations were shown. Red circle: input gene, orange circle: cell metabolism gene, sky circle: other gene |
: Open all plots for all cancer types
| Top |
: Open all interacting genes' information including KEGG pathway for all interacting genes from DAVID
| Top |
| Pharmacological Information for SEC61A1 |
| There's no related Drug. |
| Top |
| Cross referenced IDs for SEC61A1 |
| * We obtained these cross-references from Uniprot database. It covers 150 different DBs, 18 categories. http://www.uniprot.org/help/cross_references_section |
: Open all cross reference information
|
Copyright © 2016-Present - The Univsersity of Texas Health Science Center at Houston @ |