|
||||||||||||||||||||||||||||||||||||||||||||||||||||||||||||||||||||||||||||||||||||||||||||||||||||||||||||||||||||||||||||||||||||||||||||||||||||||||||||||||||||||||||||||||||||||||||||||||||||||||||||||||||||||||||||||||||||||||||||||||||||||||||||||||||||||||||||||||||||||||||||||||||||||||||||||||||||||||||
| |
| Phenotypic Information (metabolism pathway, cancer, disease, phenome) |
| |
| |
| Gene-Gene Network Information: Co-Expression Network, Interacting Genes & KEGG |
| |
|


| Gene Summary for DNMT3L |
| Top |
| Phenotypic Information for DNMT3L(metabolism pathway, cancer, disease, phenome) |
| Cancer | CGAP: DNMT3L |
| Familial Cancer Database: DNMT3L | |
| * This gene is included in those cancer gene databases. |
|
|
|
|
|
|
| ||||||||||||||||||||||||||||||||||||||||||||||||||||||||||||||||||||||||||||||||||||||||||||||||||||||||||||||||||||||||||||||||||||||||||||||||||||||||||||||||||||||||||||||||||||||||||||||||||||||||||||||||||||||||||||||||||||||||||||||||||||||||||||||||||||||||||||||||||||||||||||||||||||||||||||||||||||
Oncogene 1 | Significant driver gene in | |||||||||||||||||||||||||||||||||||||||||||||||||||||||||||||||||||||||||||||||||||||||||||||||||||||||||||||||||||||||||||||||||||||||||||||||||||||||||||||||||||||||||||||||||||||||||||||||||||||||||||||||||||||||||||||||||||||||||||||||||||||||||||||||||||||||||||||||||||||||||||||||||||||||||||||||||||||||||
| cf) number; DB name 1 Oncogene; http://nar.oxfordjournals.org/content/35/suppl_1/D721.long, 2 Tumor Suppressor gene; https://bioinfo.uth.edu/TSGene/, 3 Cancer Gene Census; http://www.nature.com/nrc/journal/v4/n3/abs/nrc1299.html, 4 CancerGenes; http://nar.oxfordjournals.org/content/35/suppl_1/D721.long, 5 Network of Cancer Gene; http://ncg.kcl.ac.uk/index.php, 1Therapeutic Vulnerabilities in Cancer; http://cbio.mskcc.org/cancergenomics/statius/ |
| KEGG_CYSTEINE_AND_METHIONINE_METABOLISM | |
| OMIM | |
| Orphanet | |
| Disease | KEGG Disease: DNMT3L |
| MedGen: DNMT3L (Human Medical Genetics with Condition) | |
| ClinVar: DNMT3L | |
| Phenotype | MGI: DNMT3L (International Mouse Phenotyping Consortium) |
| PhenomicDB: DNMT3L | |
| Mutations for DNMT3L |
| * Under tables are showing count per each tissue to give us broad intuition about tissue specific mutation patterns.You can go to the detailed page for each mutation database's web site. |
| There's no structural variation information in COSMIC data for this gene. |
| * From mRNA Sanger sequences, Chitars2.0 arranged chimeric transcripts. This table shows DNMT3L related fusion information. |
| ID | Head Gene | Tail Gene | Accession | Gene_a | qStart_a | qEnd_a | Chromosome_a | tStart_a | tEnd_a | Gene_a | qStart_a | qEnd_a | Chromosome_a | tStart_a | tEnd_a |
| BF222724 | IGFBP2 | 6 | 97 | 2 | 217529068 | 217529159 | DNMT3L | 93 | 461 | 21 | 45671006 | 45671374 | |
| Top |
| Mutation type/ Tissue ID | brca | cns | cerv | endome | haematopo | kidn | Lintest | liver | lung | ns | ovary | pancre | prost | skin | stoma | thyro | urina | |||
| Total # sample | 1 | |||||||||||||||||||
| GAIN (# sample) | ||||||||||||||||||||
| LOSS (# sample) | 1 |
| cf) Tissue ID; Tissue type (1; Breast, 2; Central_nervous_system, 3; Cervix, 4; Endometrium, 5; Haematopoietic_and_lymphoid_tissue, 6; Kidney, 7; Large_intestine, 8; Liver, 9; Lung, 10; NS, 11; Ovary, 12; Pancreas, 13; Prostate, 14; Skin, 15; Stomach, 16; Thyroid, 17; Urinary_tract) |
| Top |
|
 |
| Top |
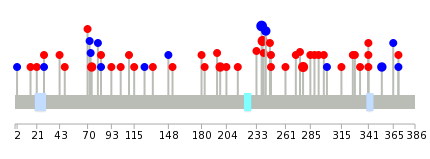
| Stat. for Non-Synonymous SNVs (# total SNVs=24) | (# total SNVs=8) |
 |  |
(# total SNVs=0) | (# total SNVs=0) |
| Top |
| * When you move the cursor on each content, you can see more deailed mutation information on the Tooltip. Those are primary_site,primary_histology,mutation(aa),pubmedID. |
| GRCh37 position | Mutation(aa) | Unique sampleID count |
| chr21:45671561-45671561 | p.F238F | 4 |
| chr21:45671560-45671560 | p.D239N | 3 |
| chr21:45670770-45670770 | p.R278G | 3 |
| chr21:45675961-45675961 | p.D198G | 2 |
| chr21:45671549-45671549 | p.Y242Y | 2 |
| chr21:45670725-45670725 | p.E293K | 2 |
| chr21:45666382-45666382 | p.S354S | 2 |
| chr21:45666423-45666423 | p.E341K | 2 |
| chr21:45679526-45679526 | p.A74T | 2 |
| chr21:45679318-45679318 | p.? | 1 |
| Top |
|
 |
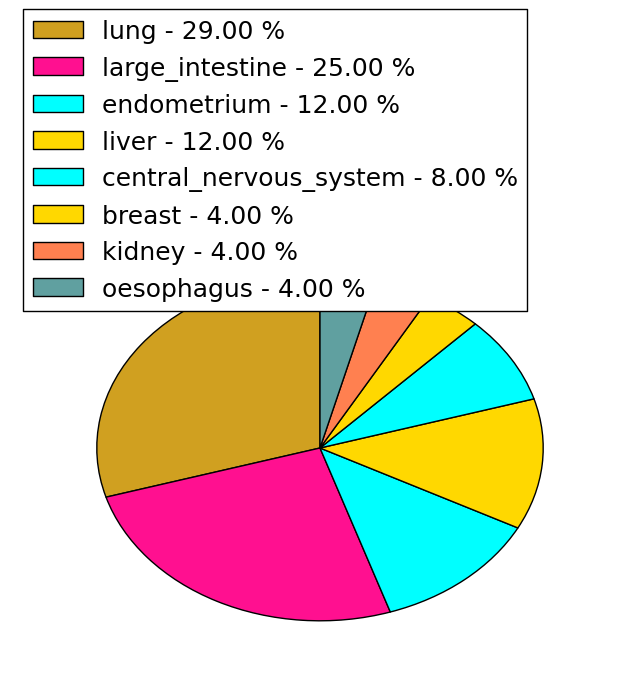
| Point Mutation/ Tissue ID | 1 | 2 | 3 | 4 | 5 | 6 | 7 | 8 | 9 | 10 | 11 | 12 | 13 | 14 | 15 | 16 | 17 | 18 | 19 | 20 |
| # sample | 1 | 1 | 3 | 1 | 1 | 1 | 2 | 2 | 1 | 14 | 4 | 4 | ||||||||
| # mutation | 1 | 1 | 3 | 1 | 1 | 1 | 2 | 2 | 1 | 16 | 4 | 5 | ||||||||
| nonsynonymous SNV | 1 | 3 | 1 | 1 | 1 | 2 | 2 | 1 | 10 | 4 | 3 | |||||||||
| synonymous SNV | 1 | 6 | 2 |
| cf) Tissue ID; Tissue type (1; BLCA[Bladder Urothelial Carcinoma], 2; BRCA[Breast invasive carcinoma], 3; CESC[Cervical squamous cell carcinoma and endocervical adenocarcinoma], 4; COAD[Colon adenocarcinoma], 5; GBM[Glioblastoma multiforme], 6; Glioma Low Grade, 7; HNSC[Head and Neck squamous cell carcinoma], 8; KICH[Kidney Chromophobe], 9; KIRC[Kidney renal clear cell carcinoma], 10; KIRP[Kidney renal papillary cell carcinoma], 11; LAML[Acute Myeloid Leukemia], 12; LUAD[Lung adenocarcinoma], 13; LUSC[Lung squamous cell carcinoma], 14; OV[Ovarian serous cystadenocarcinoma ], 15; PAAD[Pancreatic adenocarcinoma], 16; PRAD[Prostate adenocarcinoma], 17; SKCM[Skin Cutaneous Melanoma], 18:STAD[Stomach adenocarcinoma], 19:THCA[Thyroid carcinoma], 20:UCEC[Uterine Corpus Endometrial Carcinoma]) |
| Top |
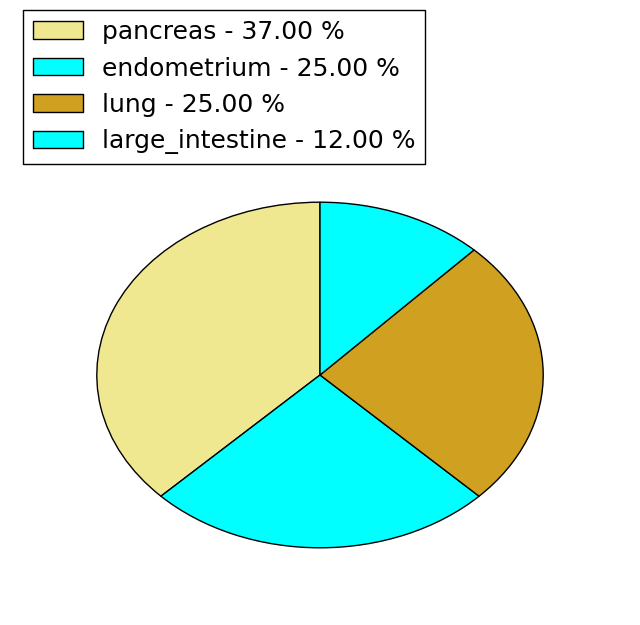
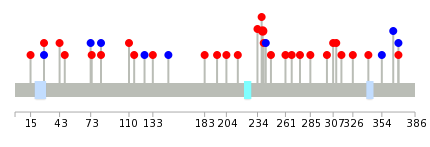
| * We represented just top 10 SNVs. When you move the cursor on each content, you can see more deailed mutation information on the Tooltip. Those are primary_site, primary_histology, mutation(aa), pubmedID. |
| Genomic Position | Mutation(aa) | Unique sampleID count |
| chr21:45671560 | p.D239N,DNMT3L | 2 |
| chr21:45668984 | p.A83A,DNMT3L | 1 |
| chr21:45671573 | p.F261L,DNMT3L | 1 |
| chr21:45679416 | p.A83V,DNMT3L | 1 |
| chr21:45670699 | p.P247L,DNMT3L | 1 |
| chr21:45674549 | p.A74T,DNMT3L | 1 |
| chr21:45679526 | p.Y242Y,DNMT3L | 1 |
| chr21:45670749 | p.C73C,DNMT3L | 1 |
| chr21:45674582 | p.L370L,DNMT3L | 1 |
| chr21:45679527 | p.L240I,DNMT3L | 1 |
| * Copy number data were extracted from TCGA using R package TCGA-Assembler. The URLs of all public data files on TCGA DCC data server were gathered on Jan-05-2015. Function ProcessCNAData in TCGA-Assembler package was used to obtain gene-level copy number value which is calculated as the average copy number of the genomic region of a gene. |
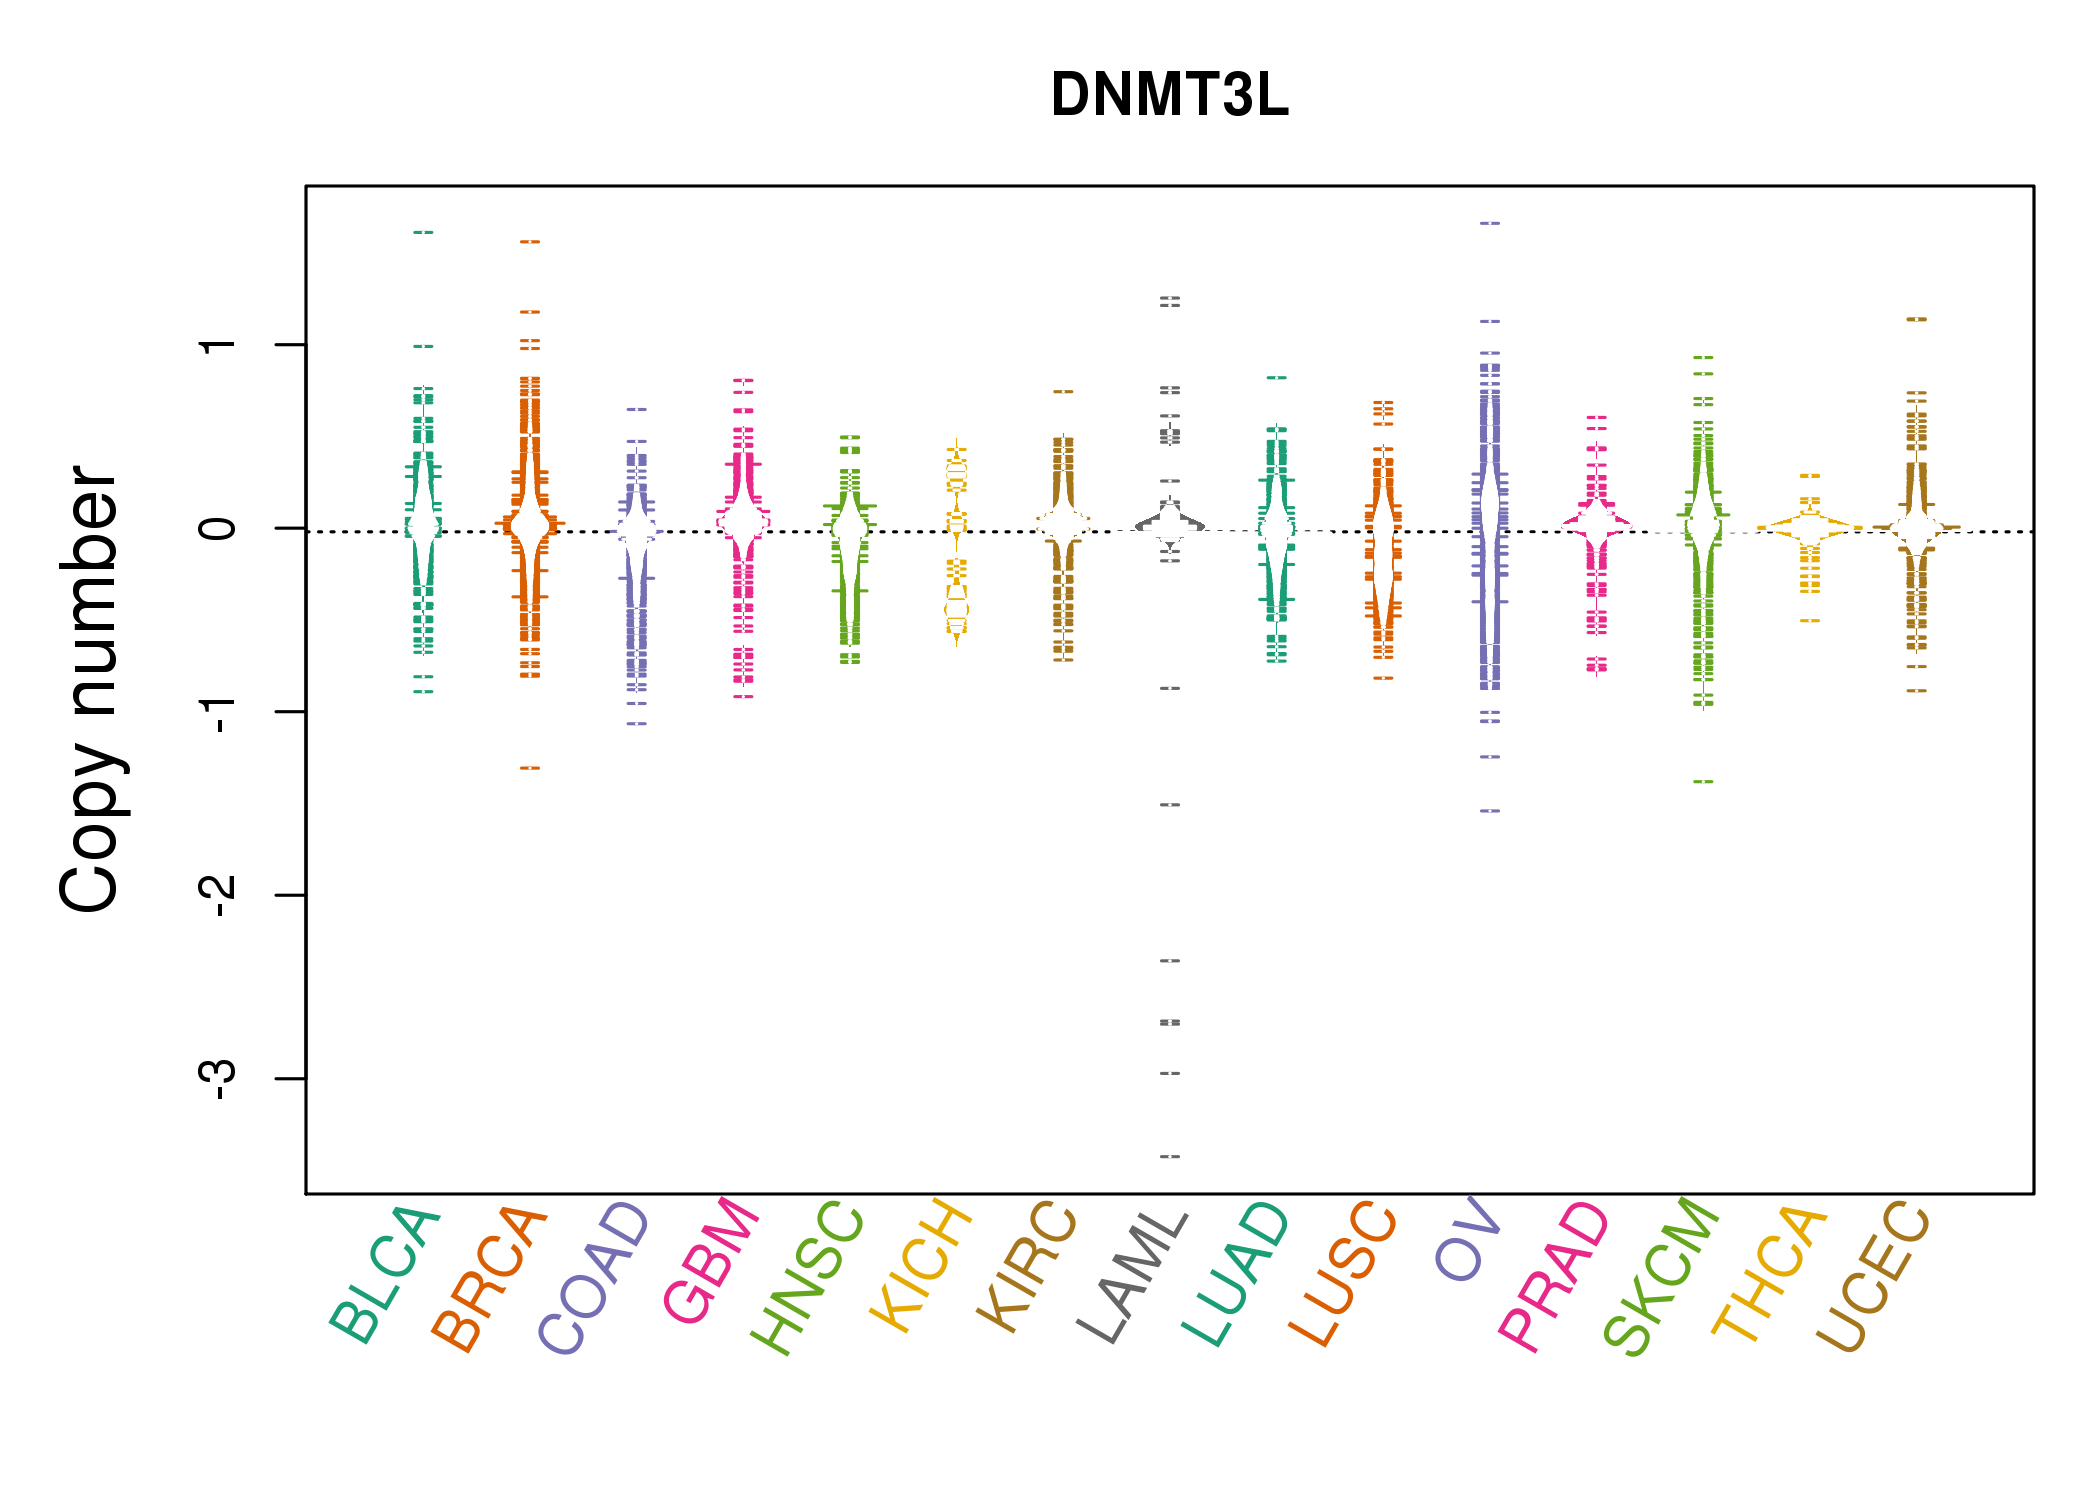 |
| cf) Tissue ID[Tissue type]: BLCA[Bladder Urothelial Carcinoma], BRCA[Breast invasive carcinoma], CESC[Cervical squamous cell carcinoma and endocervical adenocarcinoma], COAD[Colon adenocarcinoma], GBM[Glioblastoma multiforme], Glioma Low Grade, HNSC[Head and Neck squamous cell carcinoma], KICH[Kidney Chromophobe], KIRC[Kidney renal clear cell carcinoma], KIRP[Kidney renal papillary cell carcinoma], LAML[Acute Myeloid Leukemia], LUAD[Lung adenocarcinoma], LUSC[Lung squamous cell carcinoma], OV[Ovarian serous cystadenocarcinoma ], PAAD[Pancreatic adenocarcinoma], PRAD[Prostate adenocarcinoma], SKCM[Skin Cutaneous Melanoma], STAD[Stomach adenocarcinoma], THCA[Thyroid carcinoma], UCEC[Uterine Corpus Endometrial Carcinoma] |
| Top |
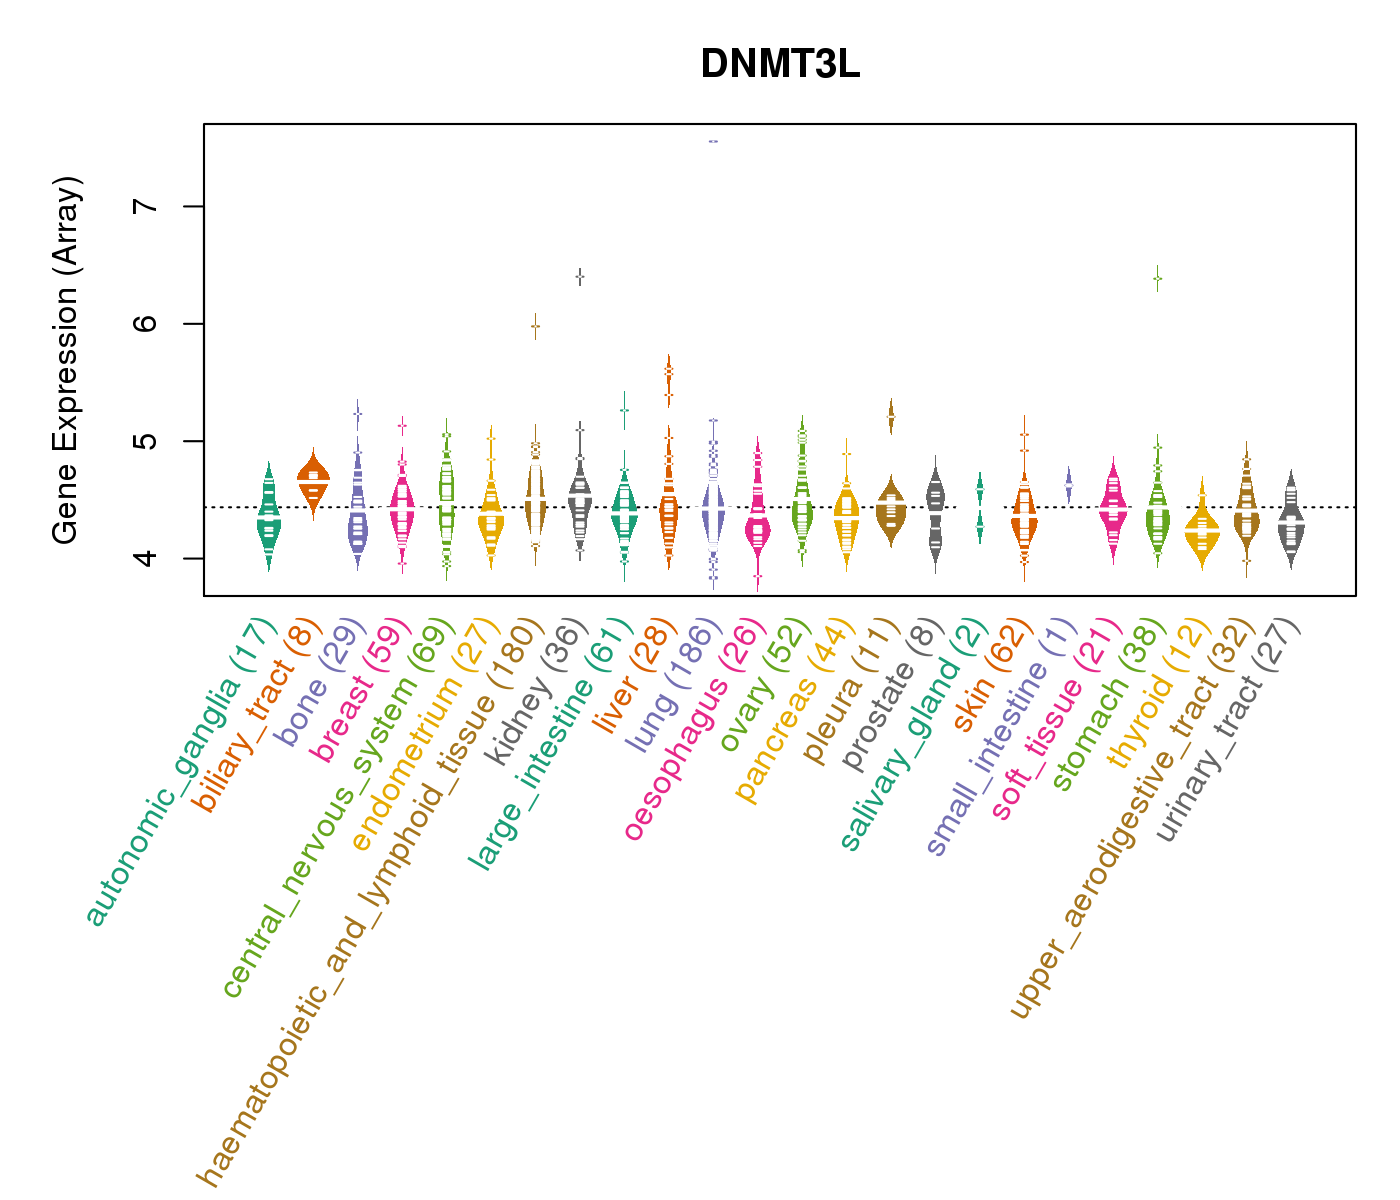
| Gene Expression for DNMT3L |
| * CCLE gene expression data were extracted from CCLE_Expression_Entrez_2012-10-18.res: Gene-centric RMA-normalized mRNA expression data. |
 |
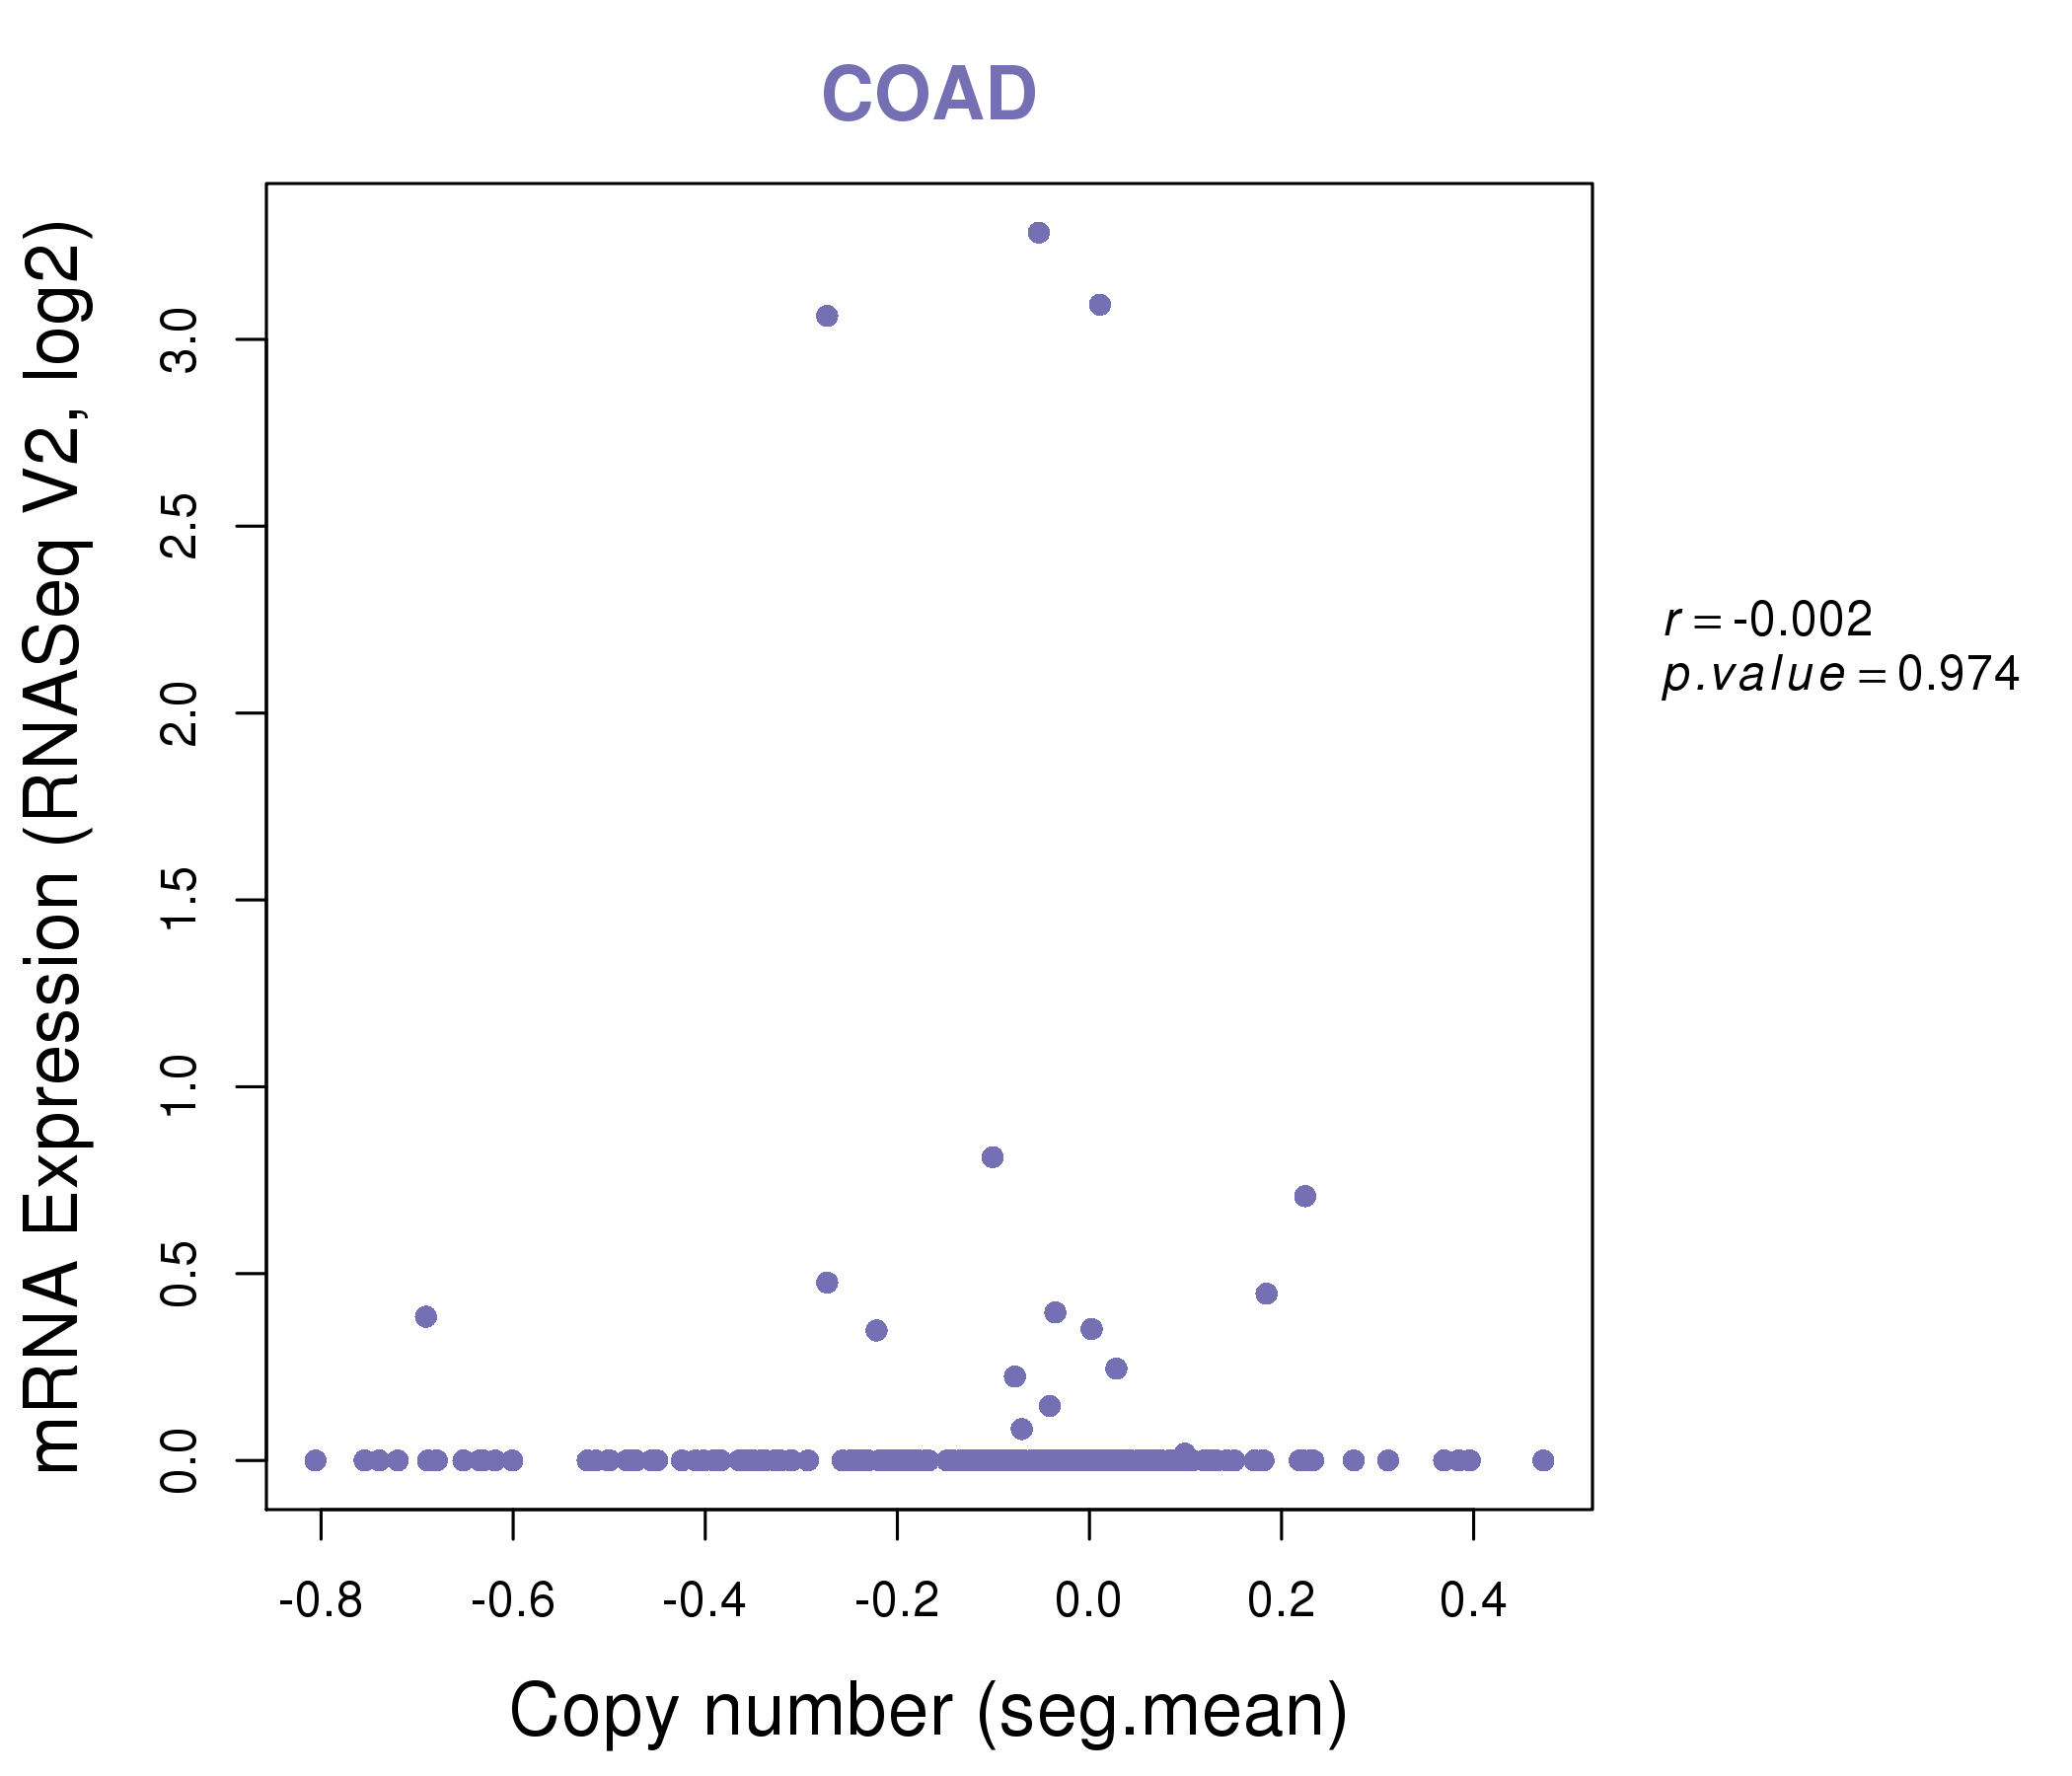
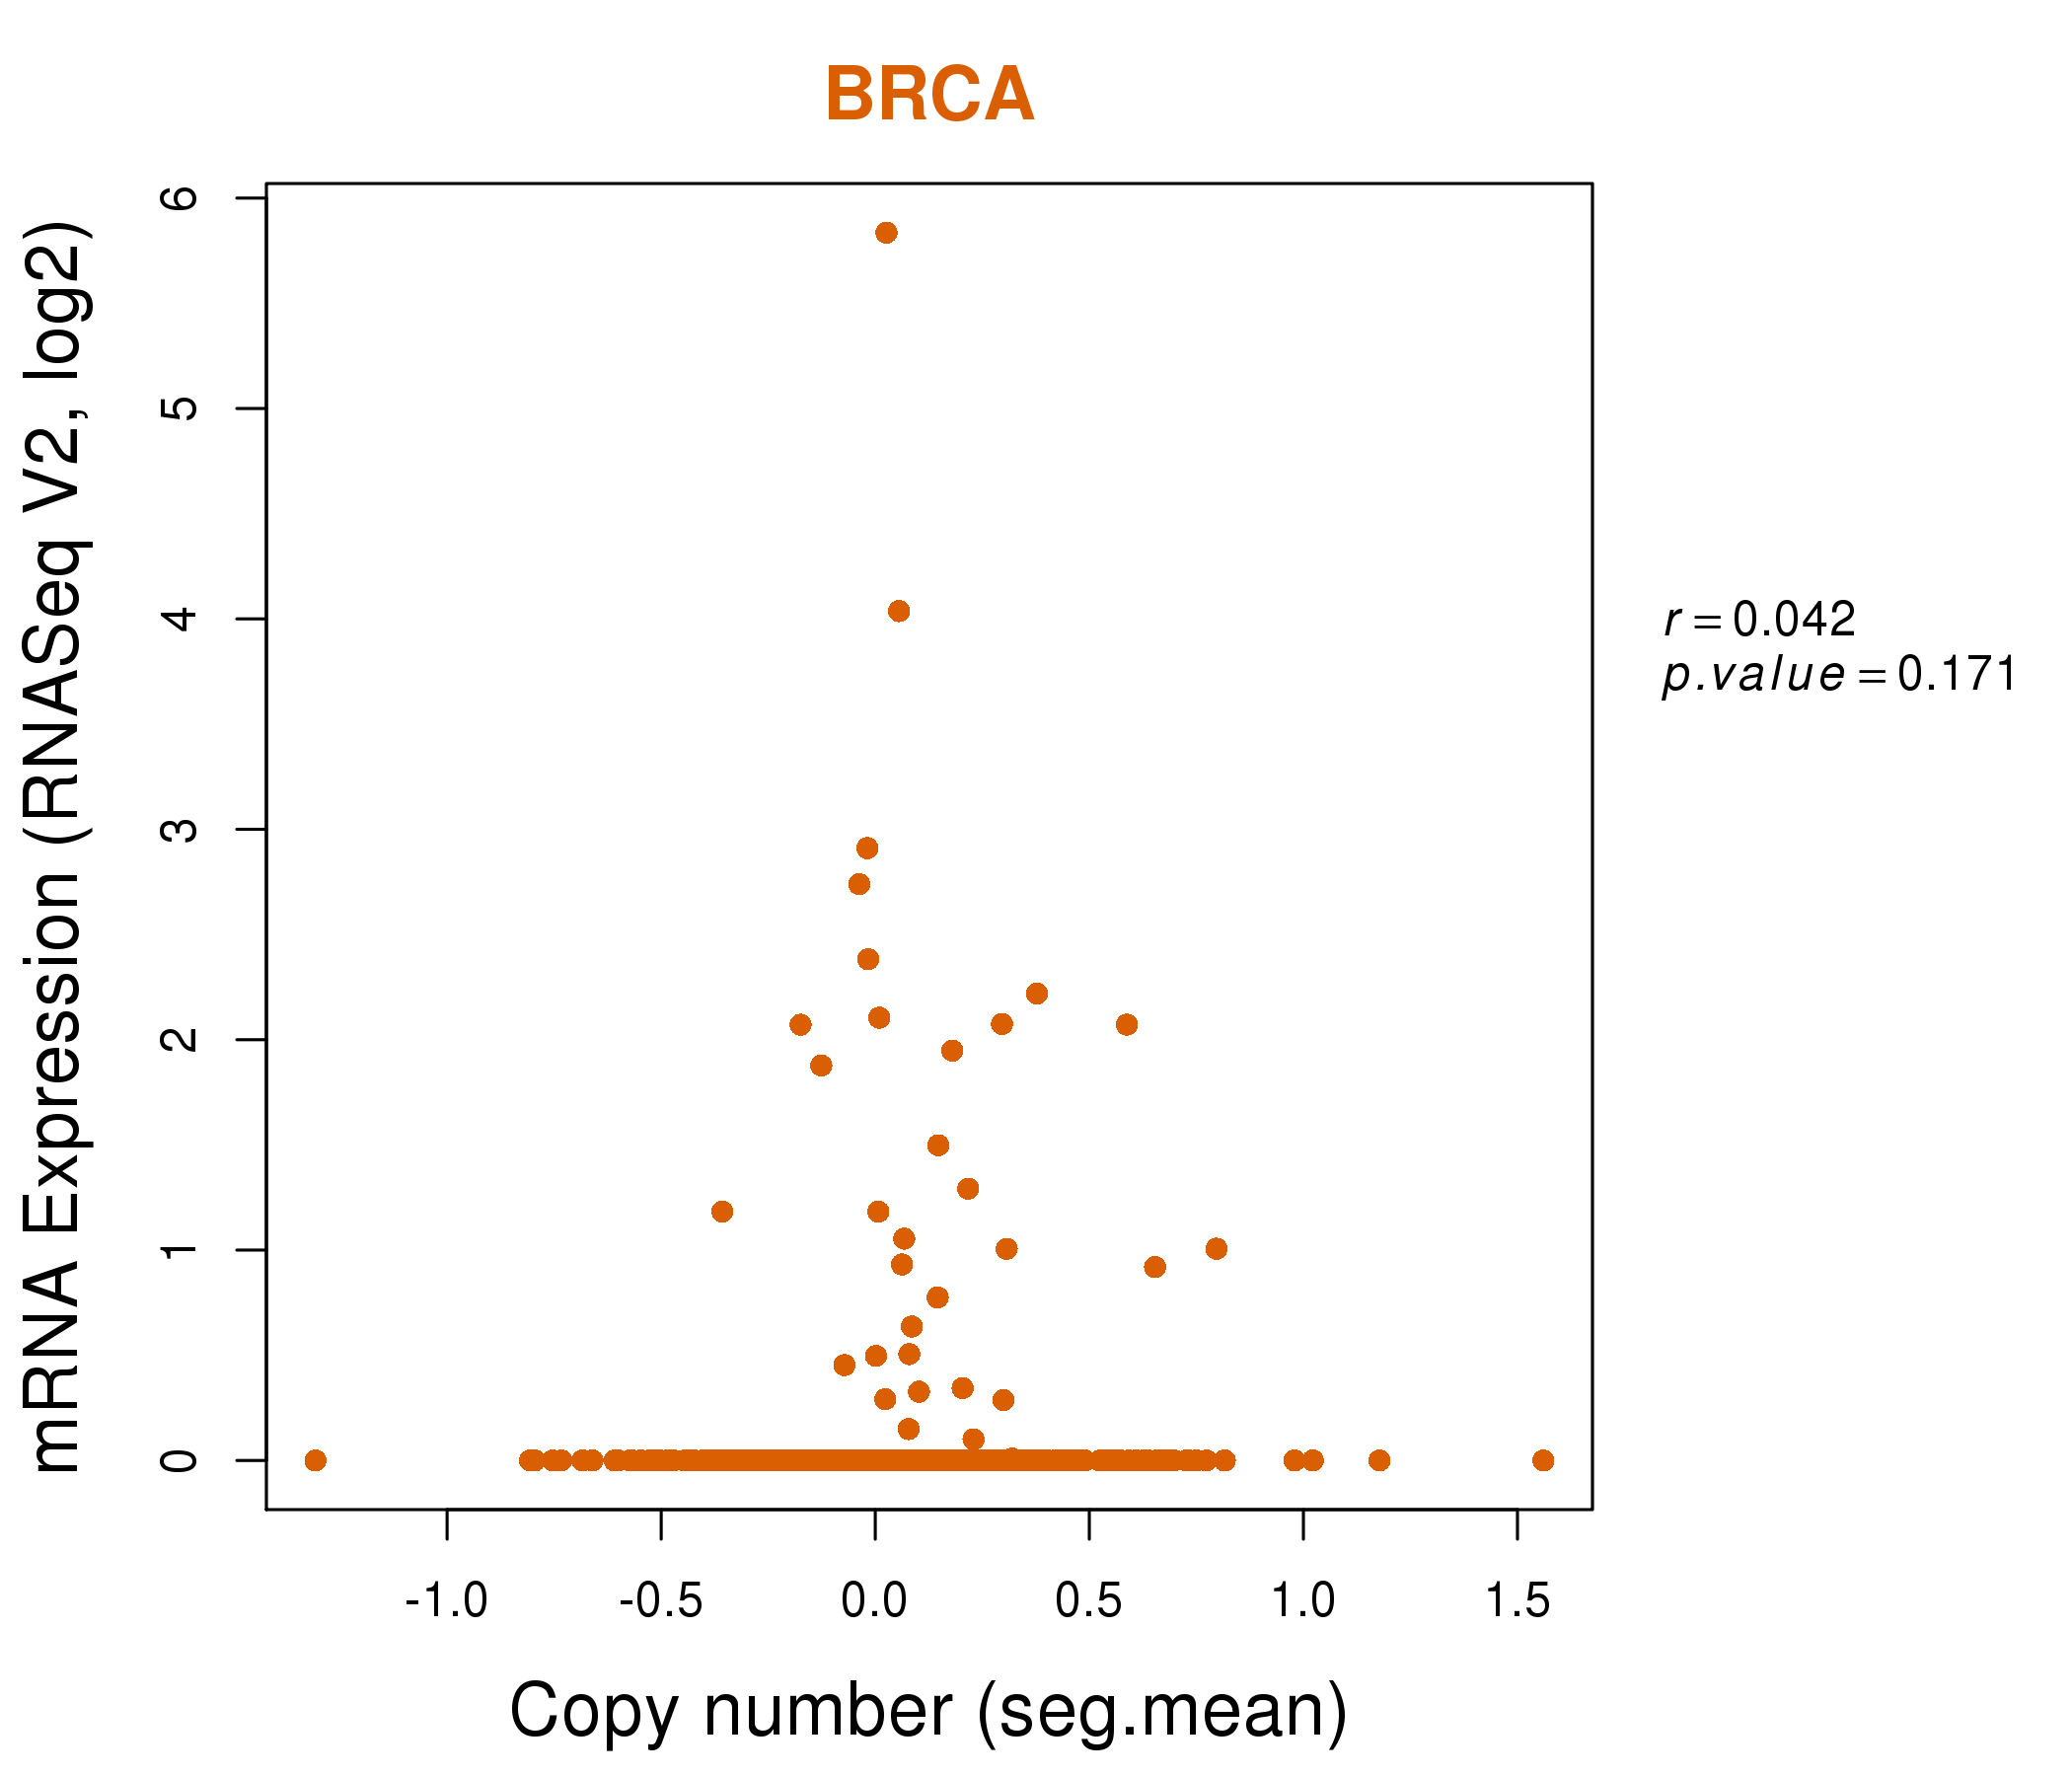
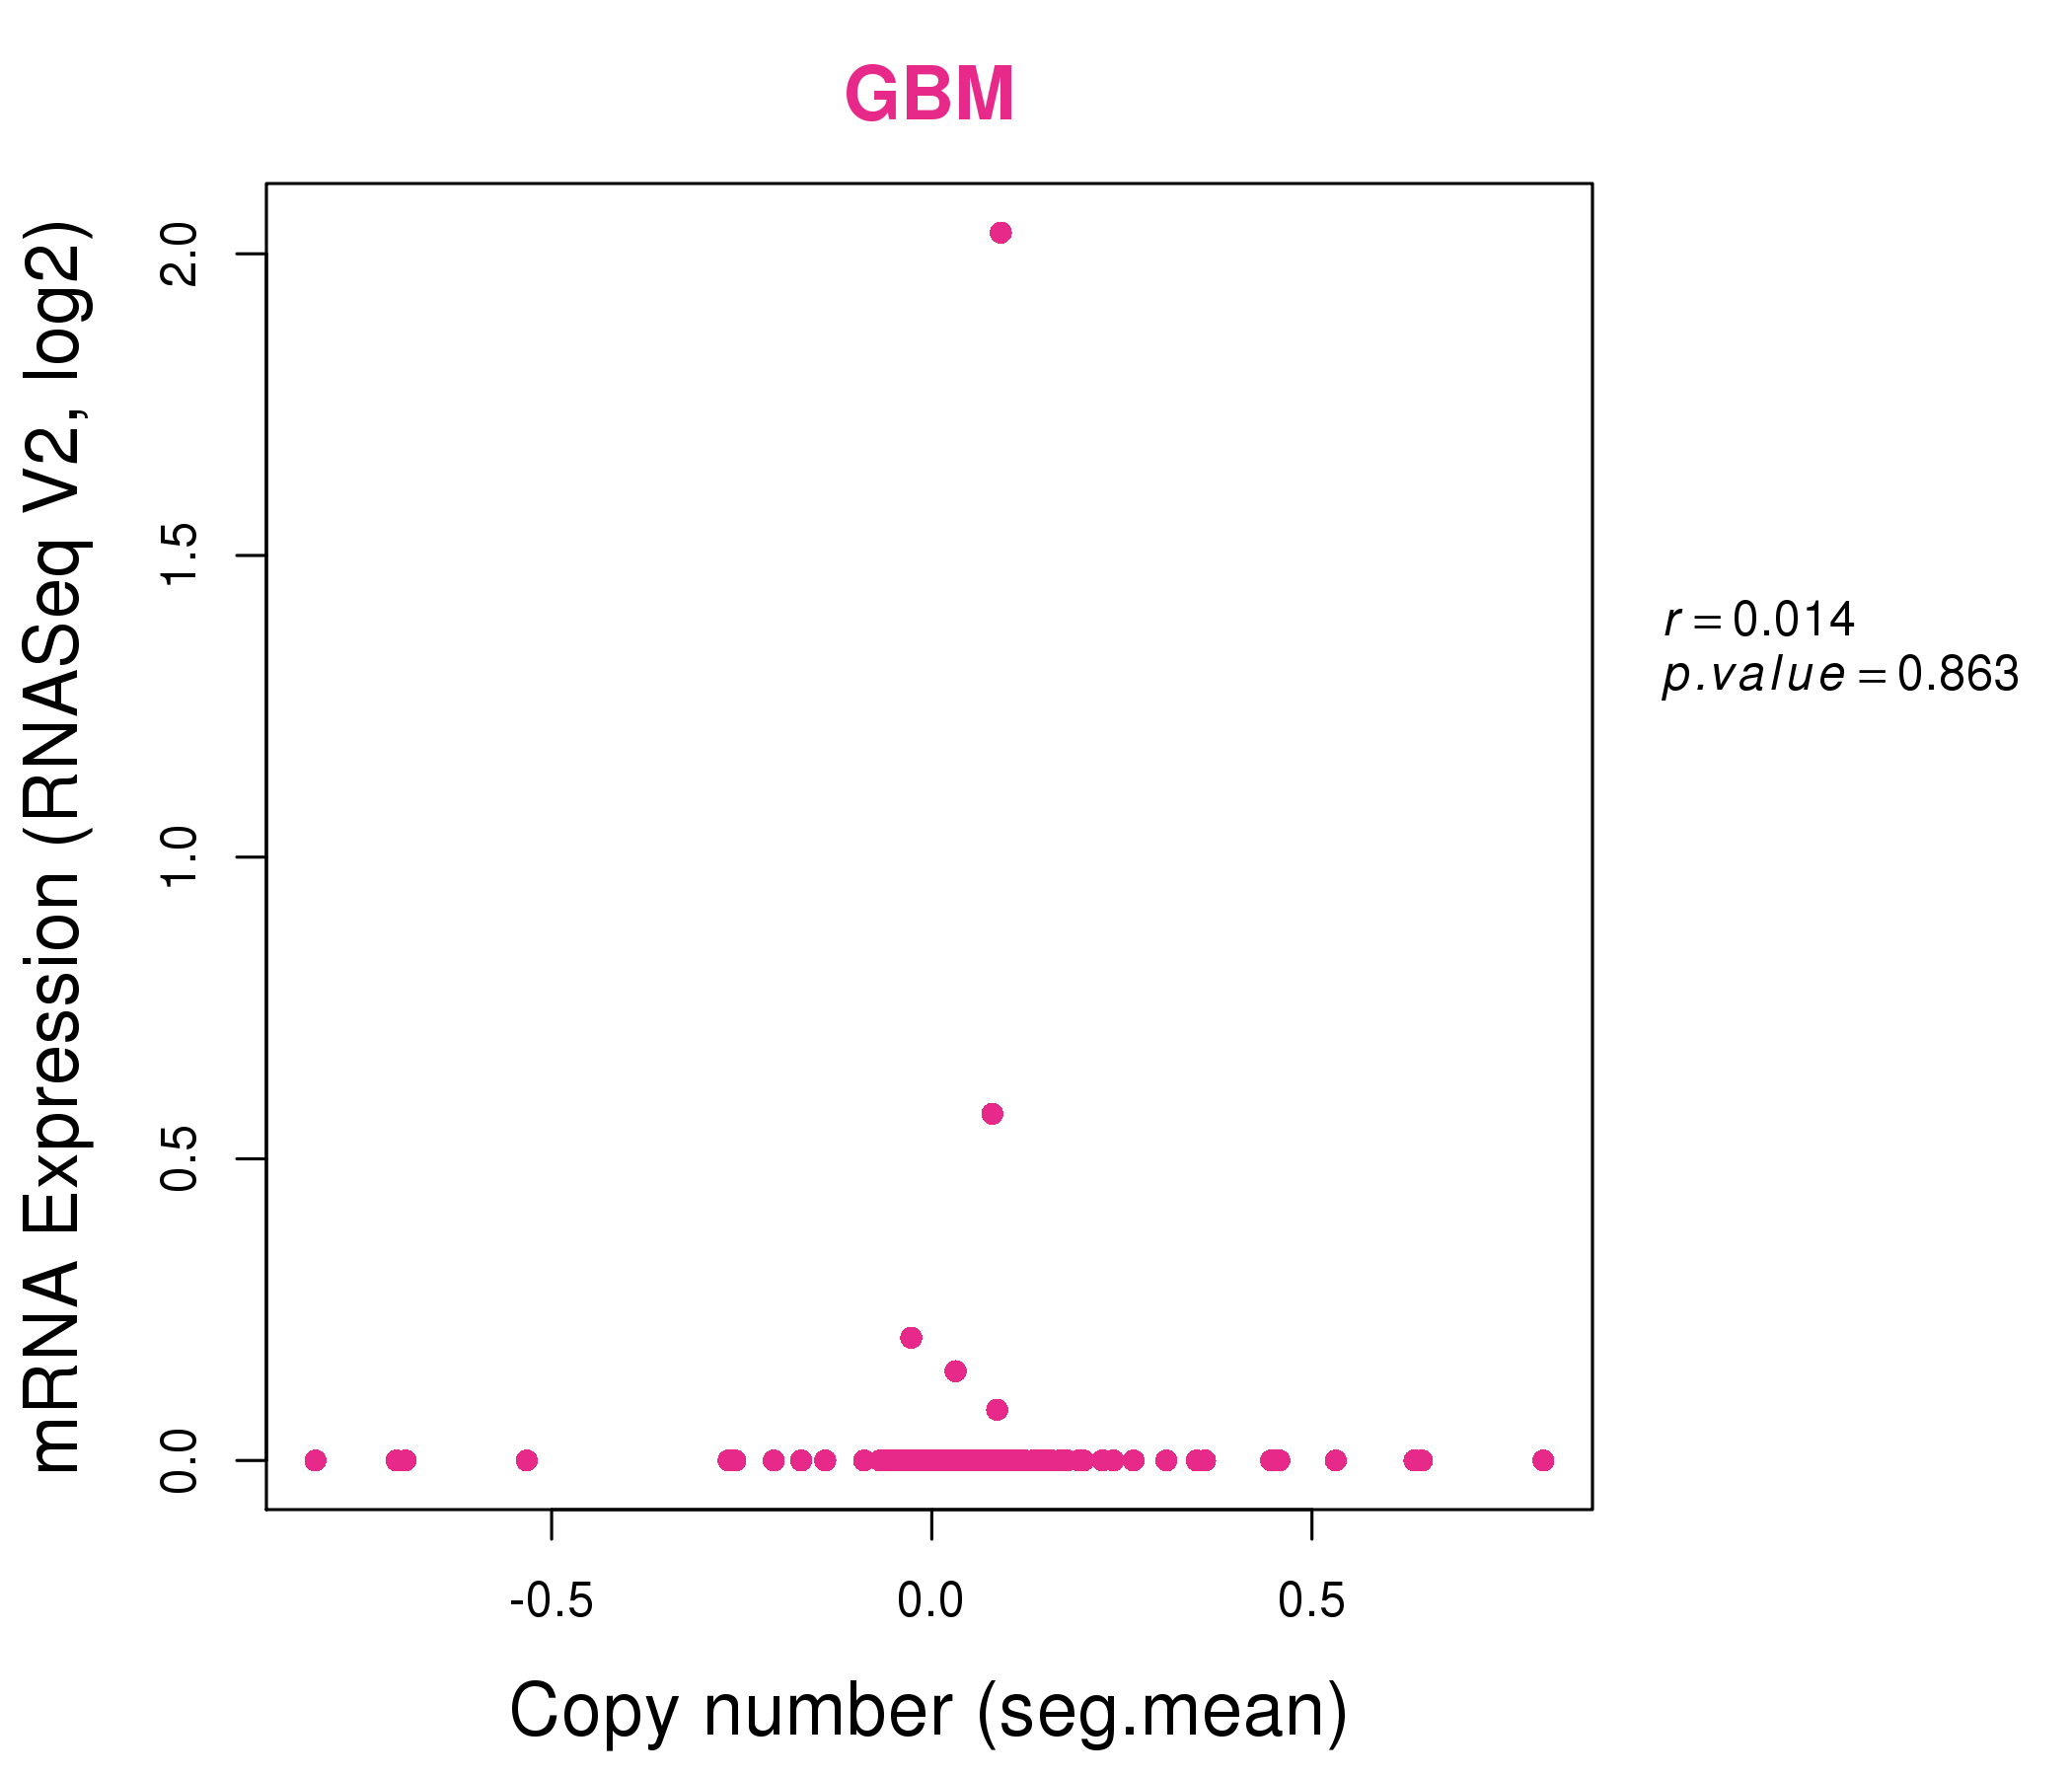
| * Normalized gene expression data of RNASeqV2 was extracted from TCGA using R package TCGA-Assembler. The URLs of all public data files on TCGA DCC data server were gathered at Jan-05-2015. Only eight cancer types have enough normal control samples for differential expression analysis. (t test, adjusted p<0.05 (using Benjamini-Hochberg FDR)) |
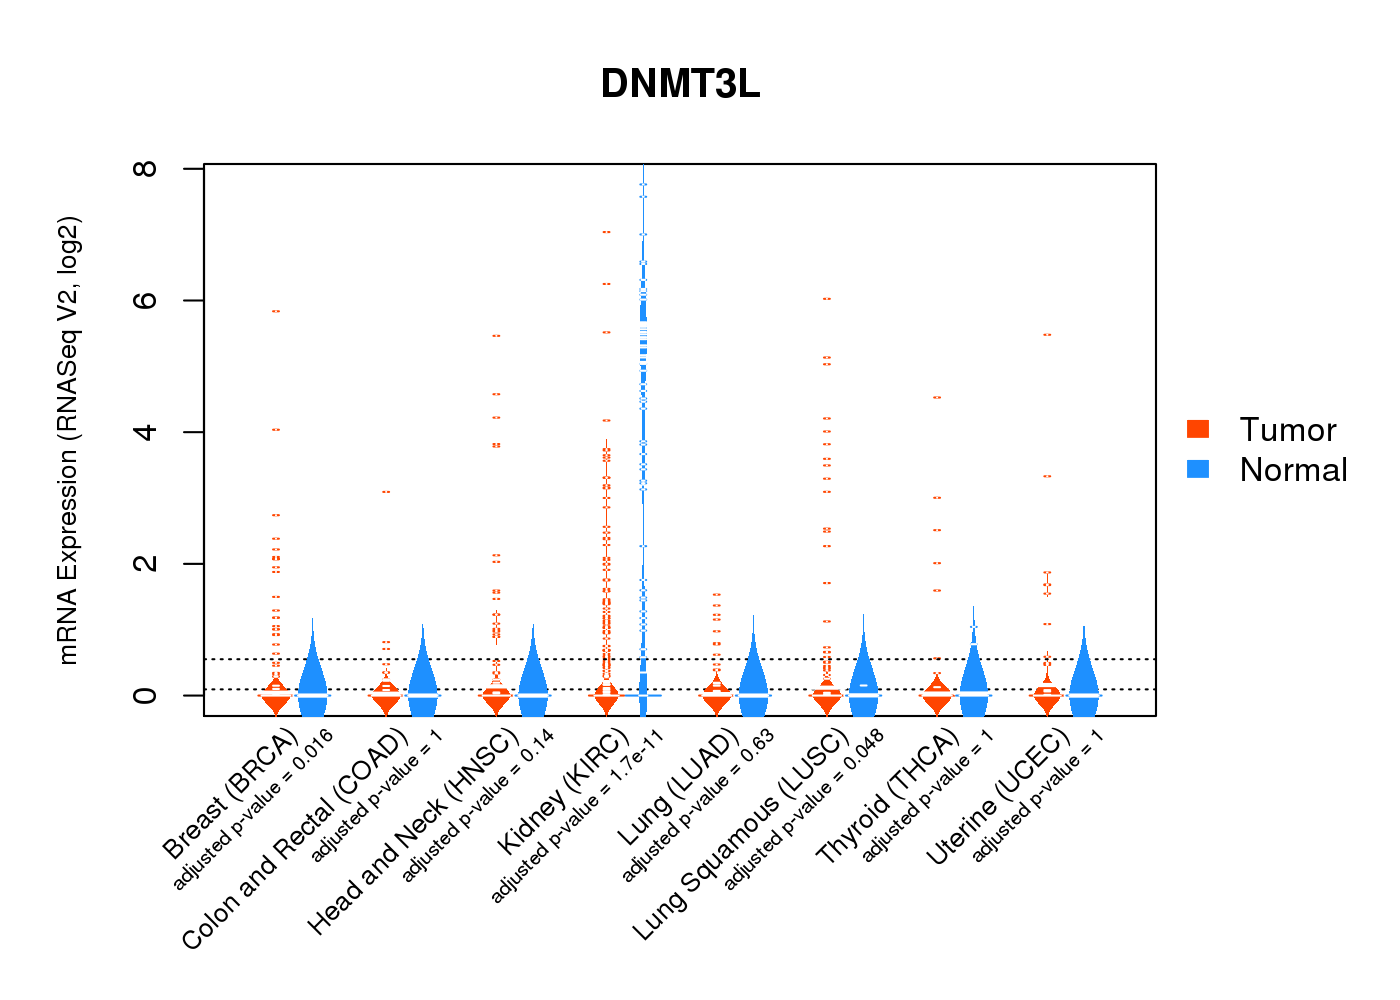 |
| Top |
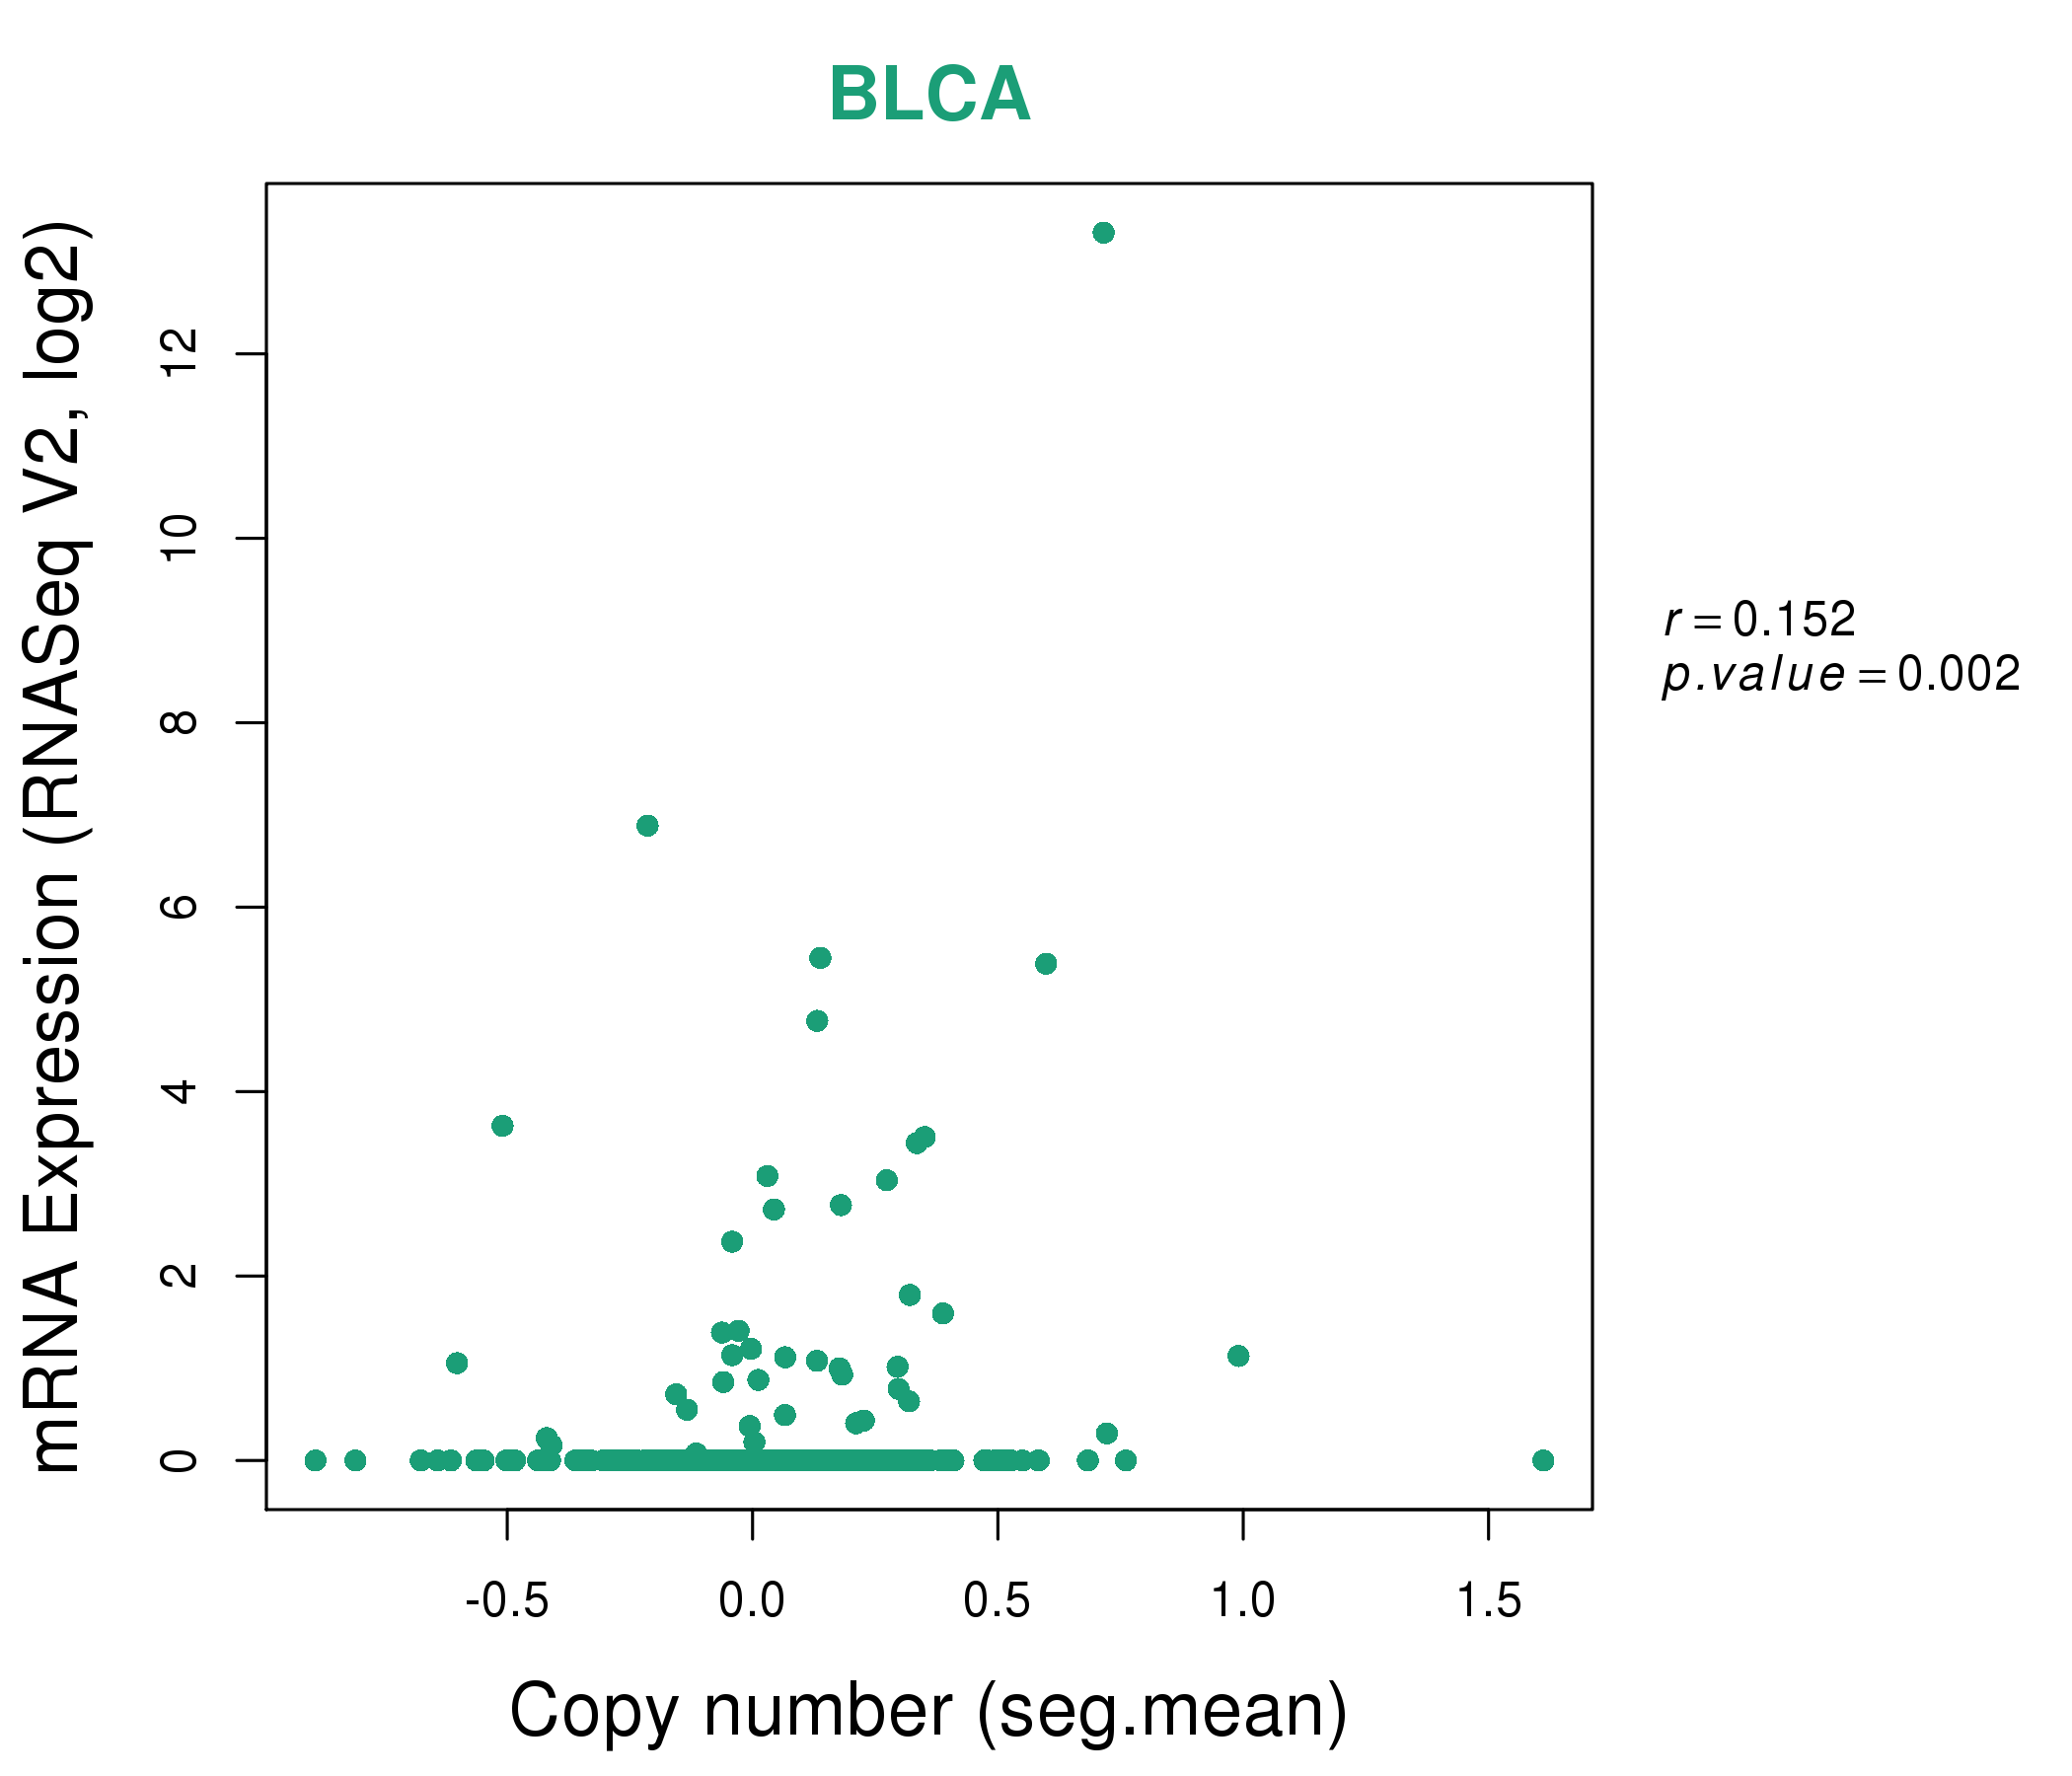
| * This plots show the correlation between CNV and gene expression. |
: Open all plots for all cancer types
 |
|
 |
|
| Top |
| Gene-Gene Network Information |
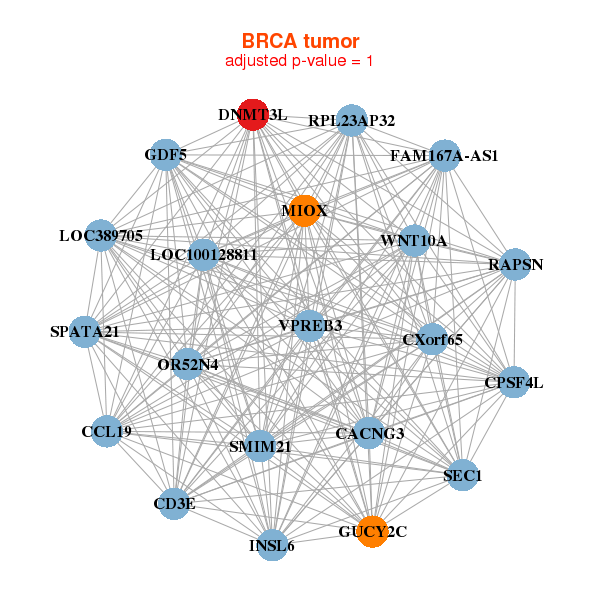
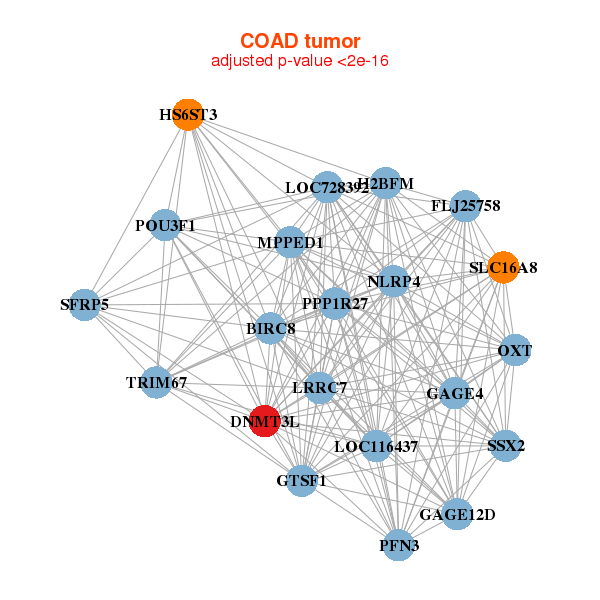
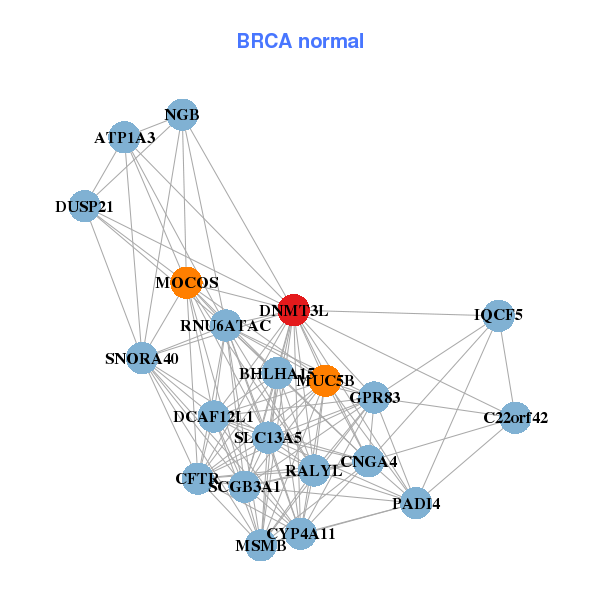
| * Co-Expression network figures were drawn using R package igraph. Only the top 20 genes with the highest correlations were shown. Red circle: input gene, orange circle: cell metabolism gene, sky circle: other gene |
: Open all plots for all cancer types
 |
|
| SMIM21,FAM167A-AS1,CACNG3,CCL19,CD3E,CPSF4L,CXorf65, DNMT3L,GDF5,GUCY2C,INSL6,LOC100128811,LOC389705,MIOX, OR52N4,RAPSN,RPL23AP32,SEC1,SPATA21,VPREB3,WNT10A | ATP1A3,BHLHA15,C22orf42,CFTR,CNGA4,CYP4A11,DCAF12L1, DNMT3L,DUSP21,GPR83,IQCF5,MOCOS,MSMB,MUC5B, NGB,PADI4,RALYL,RNU6ATAC,SCGB3A1,SLC13A5,SNORA40 |
 |
|
| BIRC8,DNMT3L,PPP1R27,FLJ25758,GAGE12D,GAGE4,GTSF1, H2BFM,HS6ST3,LOC116437,LOC728392,LRRC7,MPPED1,NLRP4, OXT,PFN3,POU3F1,SFRP5,SLC16A8,SSX2,TRIM67 | ANKRD34B,LINC00574,C6orf222,CDYL2,DNMT3L,FGF9,GABRA5, GALNT6,GHRH,GRAPL,KC6,LOC338651,LOC647859,LRRC16B, MFI2,MGAT3,SLC28A2,SYT8,TNR,ZFP91-CNTF,ZNF804A |
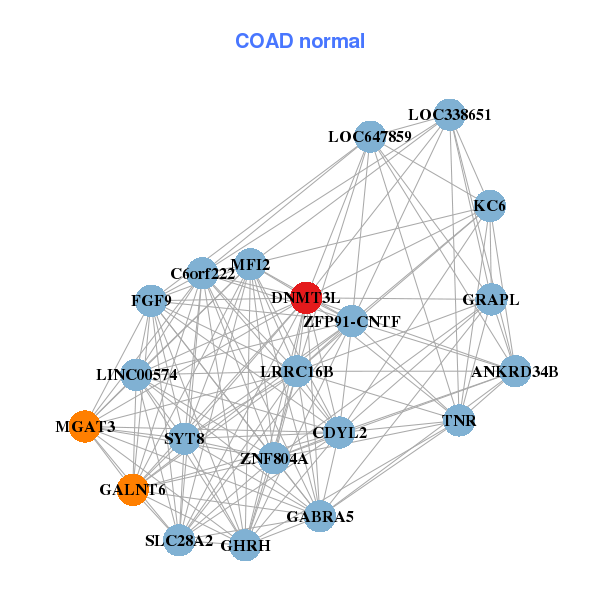
| * Co-Expression network figures were drawn using R package igraph. Only the top 20 genes with the highest correlations were shown. Red circle: input gene, orange circle: cell metabolism gene, sky circle: other gene |
: Open all plots for all cancer types
| Top |
: Open all interacting genes' information including KEGG pathway for all interacting genes from DAVID
| Top |
| Pharmacological Information for DNMT3L |
| There's no related Drug. |
| Top |
| Cross referenced IDs for DNMT3L |
| * We obtained these cross-references from Uniprot database. It covers 150 different DBs, 18 categories. http://www.uniprot.org/help/cross_references_section |
: Open all cross reference information
|
Copyright © 2016-Present - The Univsersity of Texas Health Science Center at Houston @ |