|
||||||||||||||||||||||||||||||||||||||||||||||||||||||||||||||||||||||||||||||||||||||||||||||||||||||||||||||||||||||||||||||||||||||||||||||||||||||||||||||||||||||||||||||||||||||||||||||||||||||||||||||||||||||||||||||||||||||||||||||||||||||||||||||||||||||||||||||||||||||||||||
| |
| Phenotypic Information (metabolism pathway, cancer, disease, phenome) |
| |
| |
| Gene-Gene Network Information: Co-Expression Network, Interacting Genes & KEGG |
| |
|


| Gene Summary for CERS2 |
| Basic gene info. | Gene symbol | CERS2 |
| Gene name | ceramide synthase 2 | |
| Synonyms | L3|LASS2|SP260|TMSG1 | |
| Cytomap | UCSC genome browser: 1q21.3 | |
| Genomic location | chr1 :150937648-150947479 | |
| Type of gene | protein-coding | |
| RefGenes | NM_022075.4, NM_181746.3,NM_013384.3, | |
| Ensembl id | ENSG00000143418 | |
| Description | LAG1 homolog, ceramide synthase 2LAG1 longevity assurance 2longevity assurance (LAG1, S. cerevisiae) homolog 2tumor metastasis-suppressor gene 1 protein | |
| Modification date | 20141207 | |
| dbXrefs | MIM : 606920 | |
| HGNC : HGNC | ||
| Ensembl : ENSG00000143418 | ||
| HPRD : 06080 | ||
| Vega : OTTHUMG00000035064 | ||
| Protein | UniProt: Q96G23 go to UniProt's Cross Reference DB Table | |
| Expression | CleanEX: HS_CERS2 | |
| BioGPS: 29956 | ||
| Gene Expression Atlas: ENSG00000143418 | ||
| The Human Protein Atlas: ENSG00000143418 | ||
| Pathway | NCI Pathway Interaction Database: CERS2 | |
| KEGG: CERS2 | ||
| REACTOME: CERS2 | ||
| ConsensusPathDB | ||
| Pathway Commons: CERS2 | ||
| Metabolism | MetaCyc: CERS2 | |
| HUMANCyc: CERS2 | ||
| Regulation | Ensembl's Regulation: ENSG00000143418 | |
| miRBase: chr1 :150,937,648-150,947,479 | ||
| TargetScan: NM_022075 | ||
| cisRED: ENSG00000143418 | ||
| Context | iHOP: CERS2 | |
| cancer metabolism search in PubMed: CERS2 | ||
| UCL Cancer Institute: CERS2 | ||
| Assigned class in ccmGDB | A - This gene has a literature evidence and it belongs to cancer gene. | |
| References showing role of CERS2 in cancer cell metabolism | 1. Tirodkar TS, Lu P, Bai A, Scheffel MJ, Gencer S, et al. (2015) Expression of Ceramide Synthase 6 Transcriptionally Activates Acid Ceramidase in a c-Jun N-terminal Kinase (JNK)-dependent Manner. J Biol Chem 290: 13157-13167. doi: 10.1074/jbc.M114.631325. go to article 2. Wegner MS, Wanger RA, Oertel S, Brachtendorf S, Hartmann D, et al. (2014) Ceramide synthases CerS4 and CerS5 are upregulated by 17beta-estradiol and GPER1 via AP-1 in human breast cancer cells. Biochem Pharmacol 92: 577-589. doi: 10.1016/j.bcp.2014.10.007. go to article | |
| Top |
| Phenotypic Information for CERS2(metabolism pathway, cancer, disease, phenome) |
| Cancer | CGAP: CERS2 |
| Familial Cancer Database: CERS2 | |
| * This gene is included in those cancer gene databases. |
|
|
|
|
|
| . | ||||||||||||||||||||||||||||||||||||||||||||||||||||||||||||||||||||||||||||||||||||||||||||||||||||||||||||||||||||||||||||||||||||||||||||||||||||||||||||||||||||||||||||||||||||||||||||||||||||||||||||||||||||||||||||||||||||||||||||||||||||||||||||||||||||||||||||||||||||||
Oncogene 1 | Significant driver gene in | |||||||||||||||||||||||||||||||||||||||||||||||||||||||||||||||||||||||||||||||||||||||||||||||||||||||||||||||||||||||||||||||||||||||||||||||||||||||||||||||||||||||||||||||||||||||||||||||||||||||||||||||||||||||||||||||||||||||||||||||||||||||||||||||||||||||||||||||||||||||||||
| cf) number; DB name 1 Oncogene; http://nar.oxfordjournals.org/content/35/suppl_1/D721.long, 2 Tumor Suppressor gene; https://bioinfo.uth.edu/TSGene/, 3 Cancer Gene Census; http://www.nature.com/nrc/journal/v4/n3/abs/nrc1299.html, 4 CancerGenes; http://nar.oxfordjournals.org/content/35/suppl_1/D721.long, 5 Network of Cancer Gene; http://ncg.kcl.ac.uk/index.php, 1Therapeutic Vulnerabilities in Cancer; http://cbio.mskcc.org/cancergenomics/statius/ |
| REACTOME_PHOSPHOLIPID_METABOLISM REACTOME_SPHINGOLIPID_METABOLISM REACTOME_METABOLISM_OF_LIPIDS_AND_LIPOPROTEINS | |
| OMIM | 606920; gene. |
| Orphanet | |
| Disease | KEGG Disease: CERS2 |
| MedGen: CERS2 (Human Medical Genetics with Condition) | |
| ClinVar: CERS2 | |
| Phenotype | MGI: CERS2 (International Mouse Phenotyping Consortium) |
| PhenomicDB: CERS2 | |
| Mutations for CERS2 |
| * Under tables are showing count per each tissue to give us broad intuition about tissue specific mutation patterns.You can go to the detailed page for each mutation database's web site. |
| There's no structural variation information in COSMIC data for this gene. |
| * From mRNA Sanger sequences, Chitars2.0 arranged chimeric transcripts. This table shows CERS2 related fusion information. |
| ID | Head Gene | Tail Gene | Accession | Gene_a | qStart_a | qEnd_a | Chromosome_a | tStart_a | tEnd_a | Gene_a | qStart_a | qEnd_a | Chromosome_a | tStart_a | tEnd_a |
| BE075844 | UBA1 | 8 | 208 | X | 47072532 | 47073985 | CERS2 | 194 | 311 | 1 | 150939052 | 150939294 | |
| AW502357 | CERS2 | 20 | 259 | 1 | 150937735 | 150937974 | CALM1 | 250 | 518 | 14 | 90872218 | 90872487 | |
| Top |
| Mutation type/ Tissue ID | brca | cns | cerv | endome | haematopo | kidn | Lintest | liver | lung | ns | ovary | pancre | prost | skin | stoma | thyro | urina | |||
| Total # sample | 1 | 1 | ||||||||||||||||||
| GAIN (# sample) | 1 | 1 | ||||||||||||||||||
| LOSS (# sample) |
| cf) Tissue ID; Tissue type (1; Breast, 2; Central_nervous_system, 3; Cervix, 4; Endometrium, 5; Haematopoietic_and_lymphoid_tissue, 6; Kidney, 7; Large_intestine, 8; Liver, 9; Lung, 10; NS, 11; Ovary, 12; Pancreas, 13; Prostate, 14; Skin, 15; Stomach, 16; Thyroid, 17; Urinary_tract) |
| Top |
|
 |
| Top |
| Stat. for Non-Synonymous SNVs (# total SNVs=0) | (# total SNVs=0) |
(# total SNVs=0) | (# total SNVs=0) |
| Top |
| * When you move the cursor on each content, you can see more deailed mutation information on the Tooltip. Those are primary_site,primary_histology,mutation(aa),pubmedID. |
| GRCh37 position | Mutation(aa) | Unique sampleID count |
| Top |
|
 |
| Point Mutation/ Tissue ID | 1 | 2 | 3 | 4 | 5 | 6 | 7 | 8 | 9 | 10 | 11 | 12 | 13 | 14 | 15 | 16 | 17 | 18 | 19 | 20 |
| # sample | 4 | 1 | 3 | 3 | 1 | 4 | 2 | 4 | 3 | 1 | 10 | |||||||||
| # mutation | 4 | 1 | 3 | 3 | 1 | 4 | 2 | 4 | 3 | 1 | 10 | |||||||||
| nonsynonymous SNV | 2 | 1 | 3 | 1 | 2 | 2 | 2 | 1 | 8 | |||||||||||
| synonymous SNV | 2 | 2 | 1 | 2 | 4 | 1 | 2 |
| cf) Tissue ID; Tissue type (1; BLCA[Bladder Urothelial Carcinoma], 2; BRCA[Breast invasive carcinoma], 3; CESC[Cervical squamous cell carcinoma and endocervical adenocarcinoma], 4; COAD[Colon adenocarcinoma], 5; GBM[Glioblastoma multiforme], 6; Glioma Low Grade, 7; HNSC[Head and Neck squamous cell carcinoma], 8; KICH[Kidney Chromophobe], 9; KIRC[Kidney renal clear cell carcinoma], 10; KIRP[Kidney renal papillary cell carcinoma], 11; LAML[Acute Myeloid Leukemia], 12; LUAD[Lung adenocarcinoma], 13; LUSC[Lung squamous cell carcinoma], 14; OV[Ovarian serous cystadenocarcinoma ], 15; PAAD[Pancreatic adenocarcinoma], 16; PRAD[Prostate adenocarcinoma], 17; SKCM[Skin Cutaneous Melanoma], 18:STAD[Stomach adenocarcinoma], 19:THCA[Thyroid carcinoma], 20:UCEC[Uterine Corpus Endometrial Carcinoma]) |
| Top |
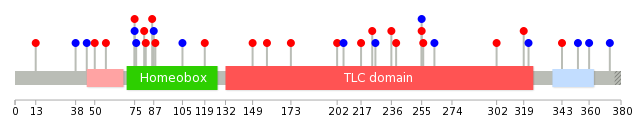
| * We represented just top 10 SNVs. When you move the cursor on each content, you can see more deailed mutation information on the Tooltip. Those are primary_site, primary_histology, mutation(aa), pubmedID. |
| Genomic Position | Mutation(aa) | Unique sampleID count |
| chr1:150940936 | p.H239Y,CERS2 | 1 |
| chr1:150939291 | p.N81K,CERS2 | 1 |
| chr1:150940140 | p.M236V,CERS2 | 1 |
| chr1:150940937 | p.L76L,CERS2 | 1 |
| chr1:150939314 | p.A226A,CERS2 | 1 |
| chr1:150940187 | p.R75R,CERS2 | 1 |
| chr1:150940939 | p.W224C,CERS2 | 1 |
| chr1:150939315 | p.R75W,CERS2 | 1 |
| chr1:150940318 | p.I217V,CERS2 | 1 |
| chr1:150941396 | p.E57D,CERS2 | 1 |
| * Copy number data were extracted from TCGA using R package TCGA-Assembler. The URLs of all public data files on TCGA DCC data server were gathered on Jan-05-2015. Function ProcessCNAData in TCGA-Assembler package was used to obtain gene-level copy number value which is calculated as the average copy number of the genomic region of a gene. |
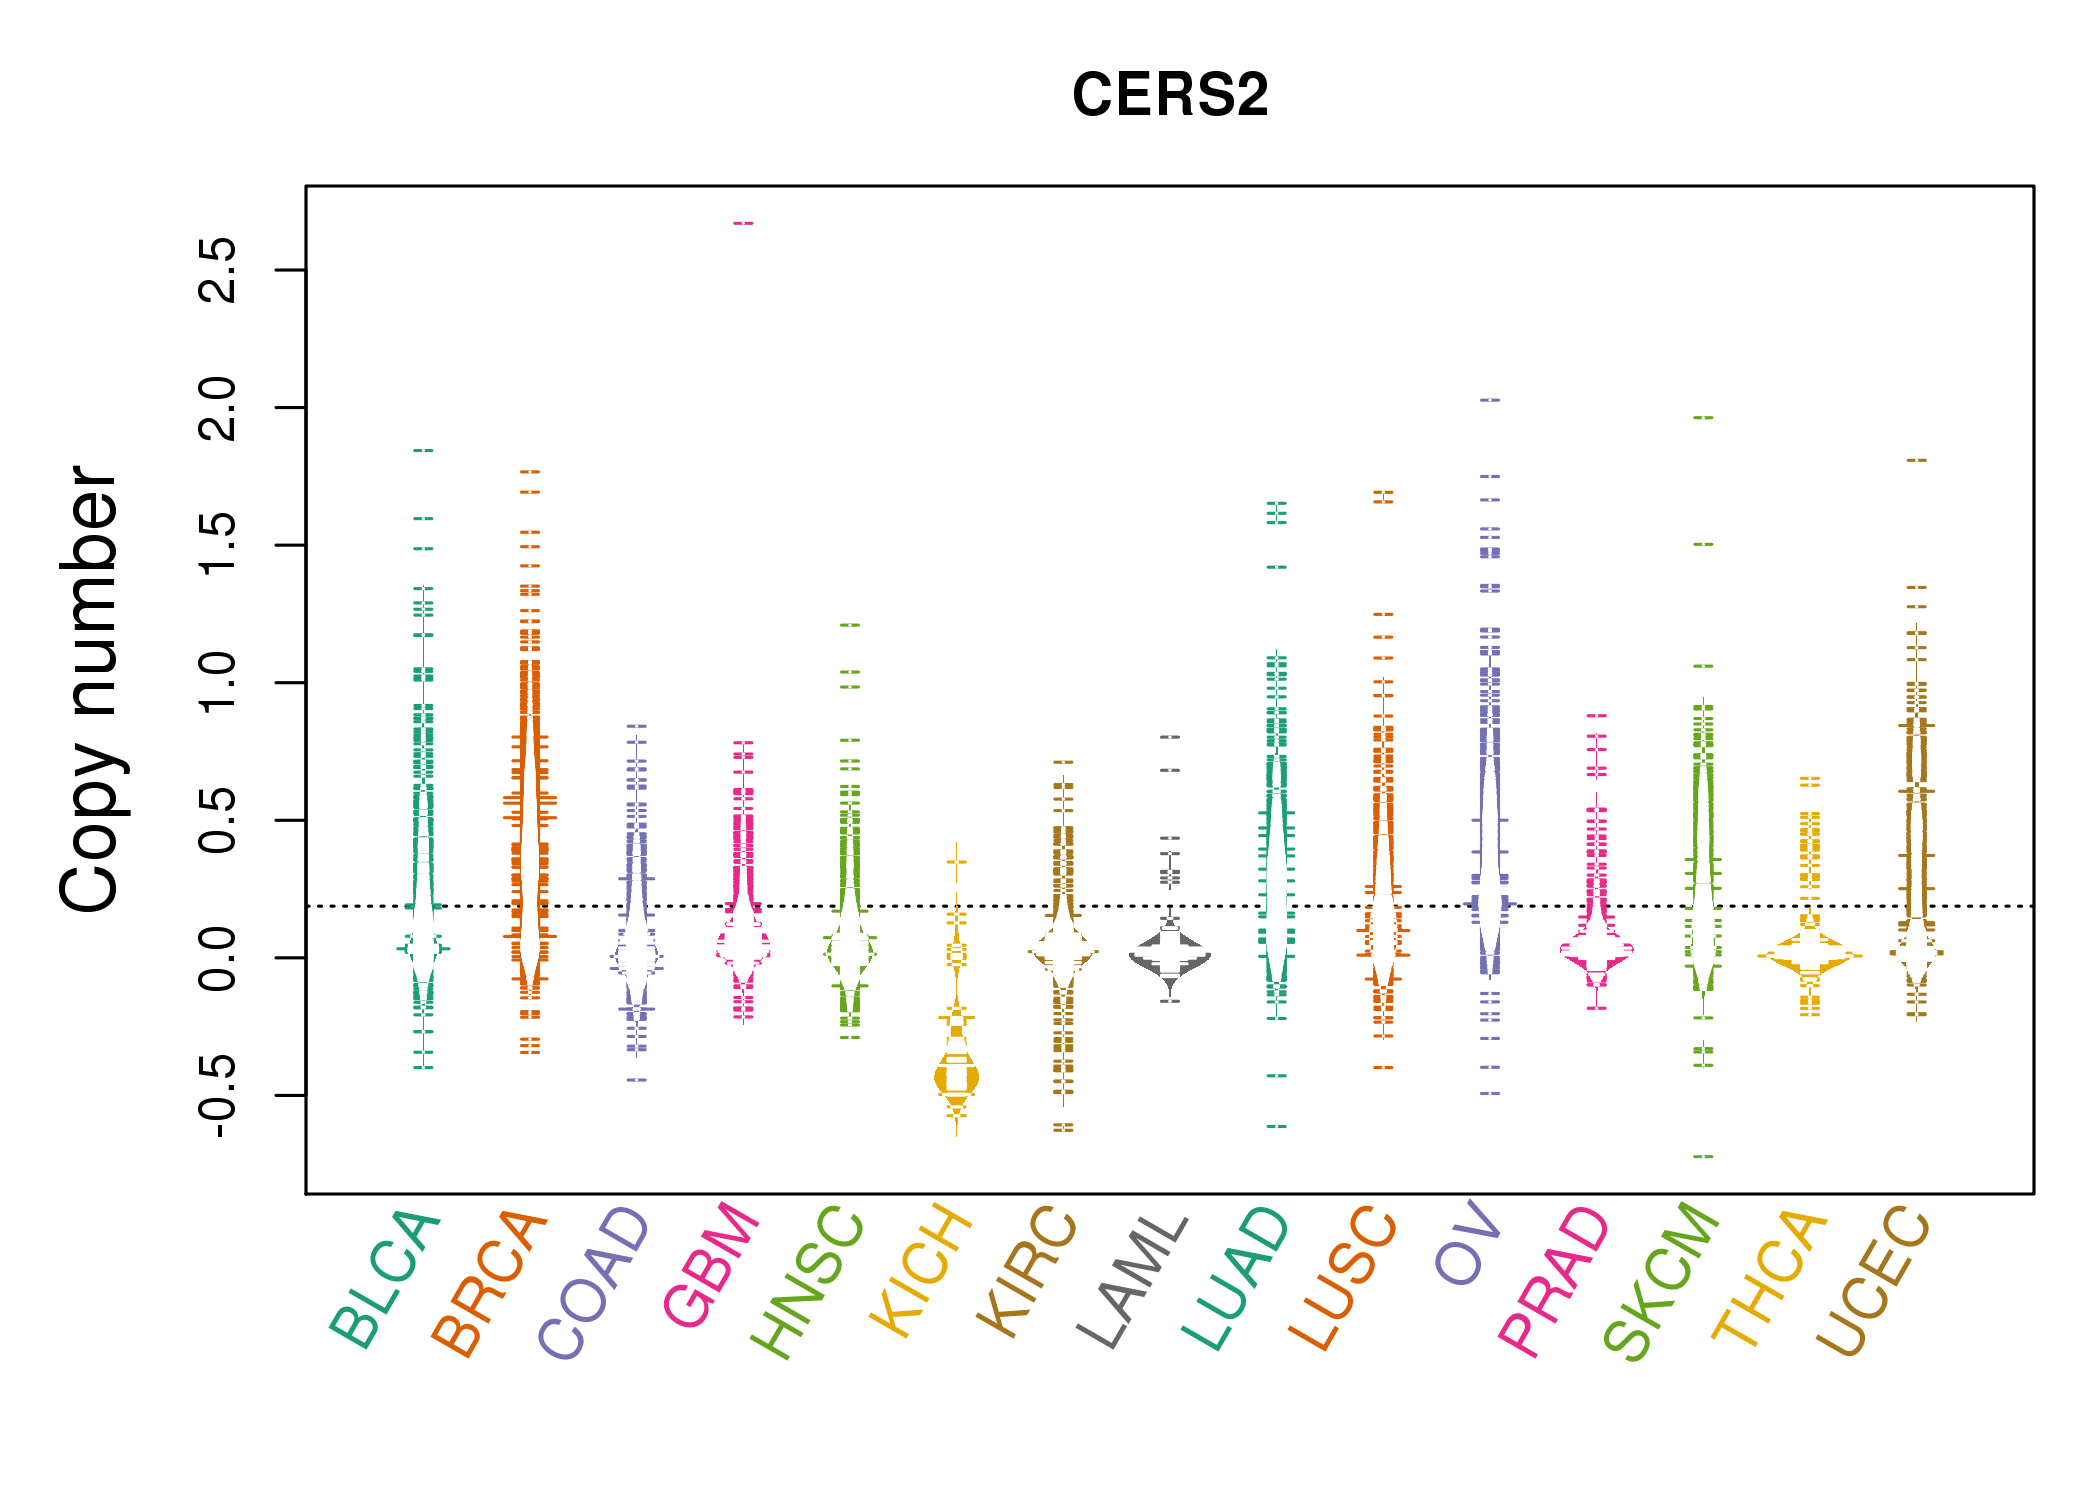 |
| cf) Tissue ID[Tissue type]: BLCA[Bladder Urothelial Carcinoma], BRCA[Breast invasive carcinoma], CESC[Cervical squamous cell carcinoma and endocervical adenocarcinoma], COAD[Colon adenocarcinoma], GBM[Glioblastoma multiforme], Glioma Low Grade, HNSC[Head and Neck squamous cell carcinoma], KICH[Kidney Chromophobe], KIRC[Kidney renal clear cell carcinoma], KIRP[Kidney renal papillary cell carcinoma], LAML[Acute Myeloid Leukemia], LUAD[Lung adenocarcinoma], LUSC[Lung squamous cell carcinoma], OV[Ovarian serous cystadenocarcinoma ], PAAD[Pancreatic adenocarcinoma], PRAD[Prostate adenocarcinoma], SKCM[Skin Cutaneous Melanoma], STAD[Stomach adenocarcinoma], THCA[Thyroid carcinoma], UCEC[Uterine Corpus Endometrial Carcinoma] |
| Top |
| Gene Expression for CERS2 |
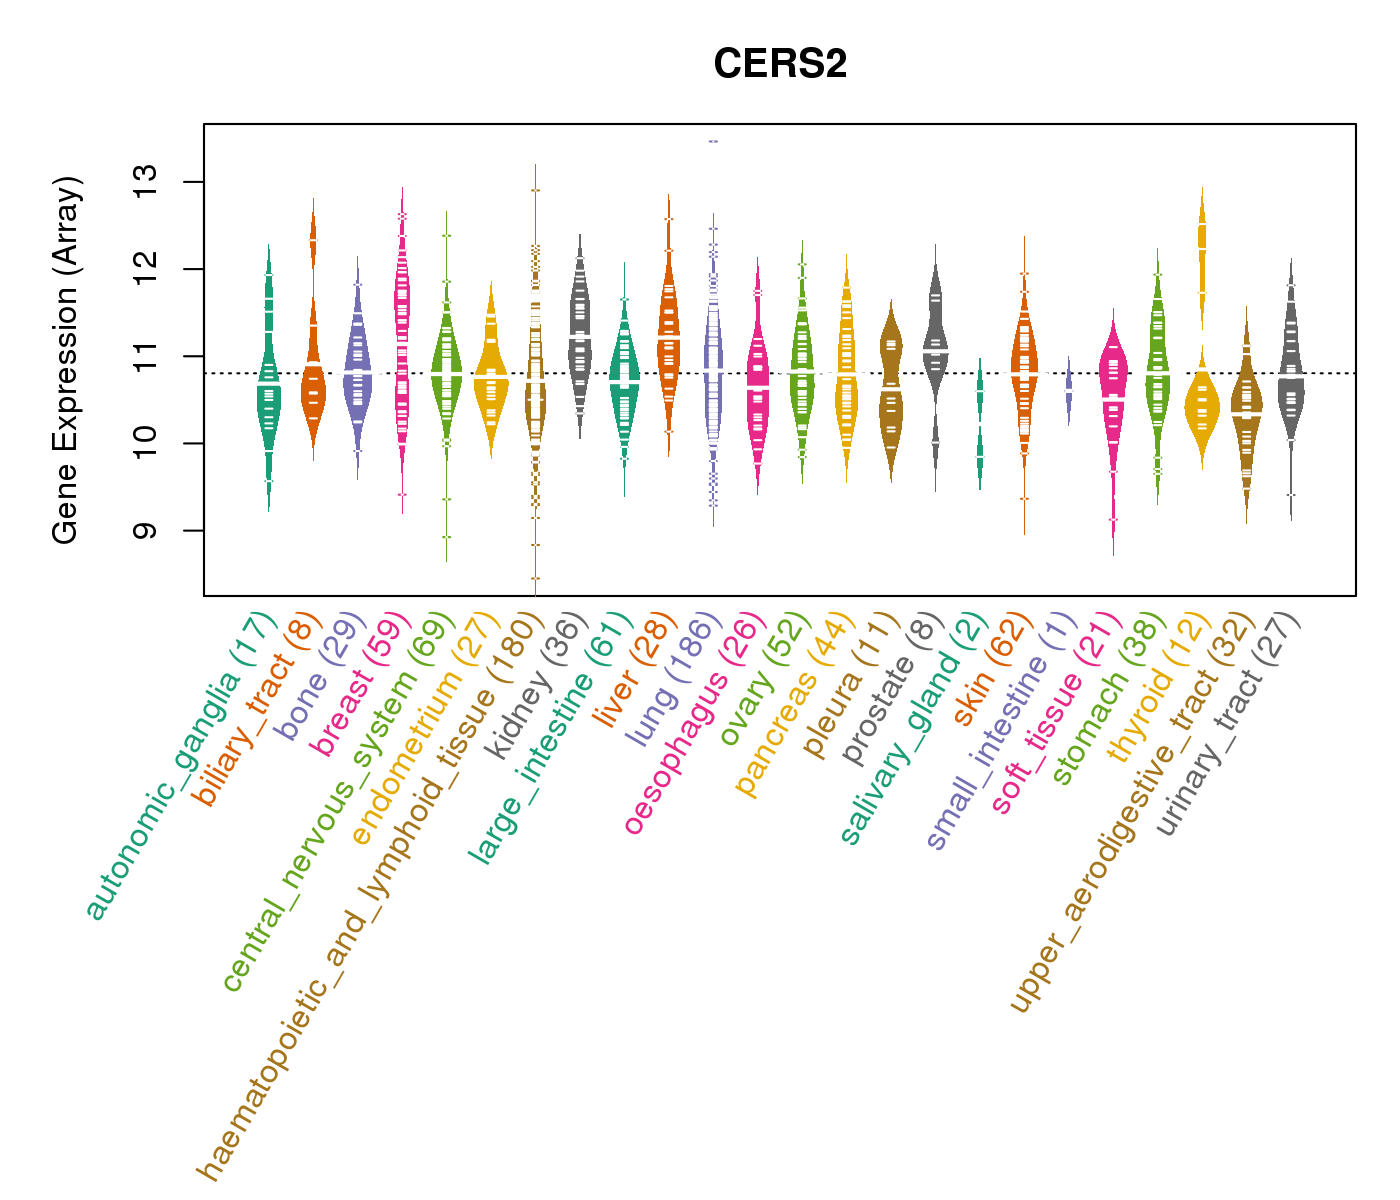
| * CCLE gene expression data were extracted from CCLE_Expression_Entrez_2012-10-18.res: Gene-centric RMA-normalized mRNA expression data. |
 |
| * Normalized gene expression data of RNASeqV2 was extracted from TCGA using R package TCGA-Assembler. The URLs of all public data files on TCGA DCC data server were gathered at Jan-05-2015. Only eight cancer types have enough normal control samples for differential expression analysis. (t test, adjusted p<0.05 (using Benjamini-Hochberg FDR)) |
 |
| Top |
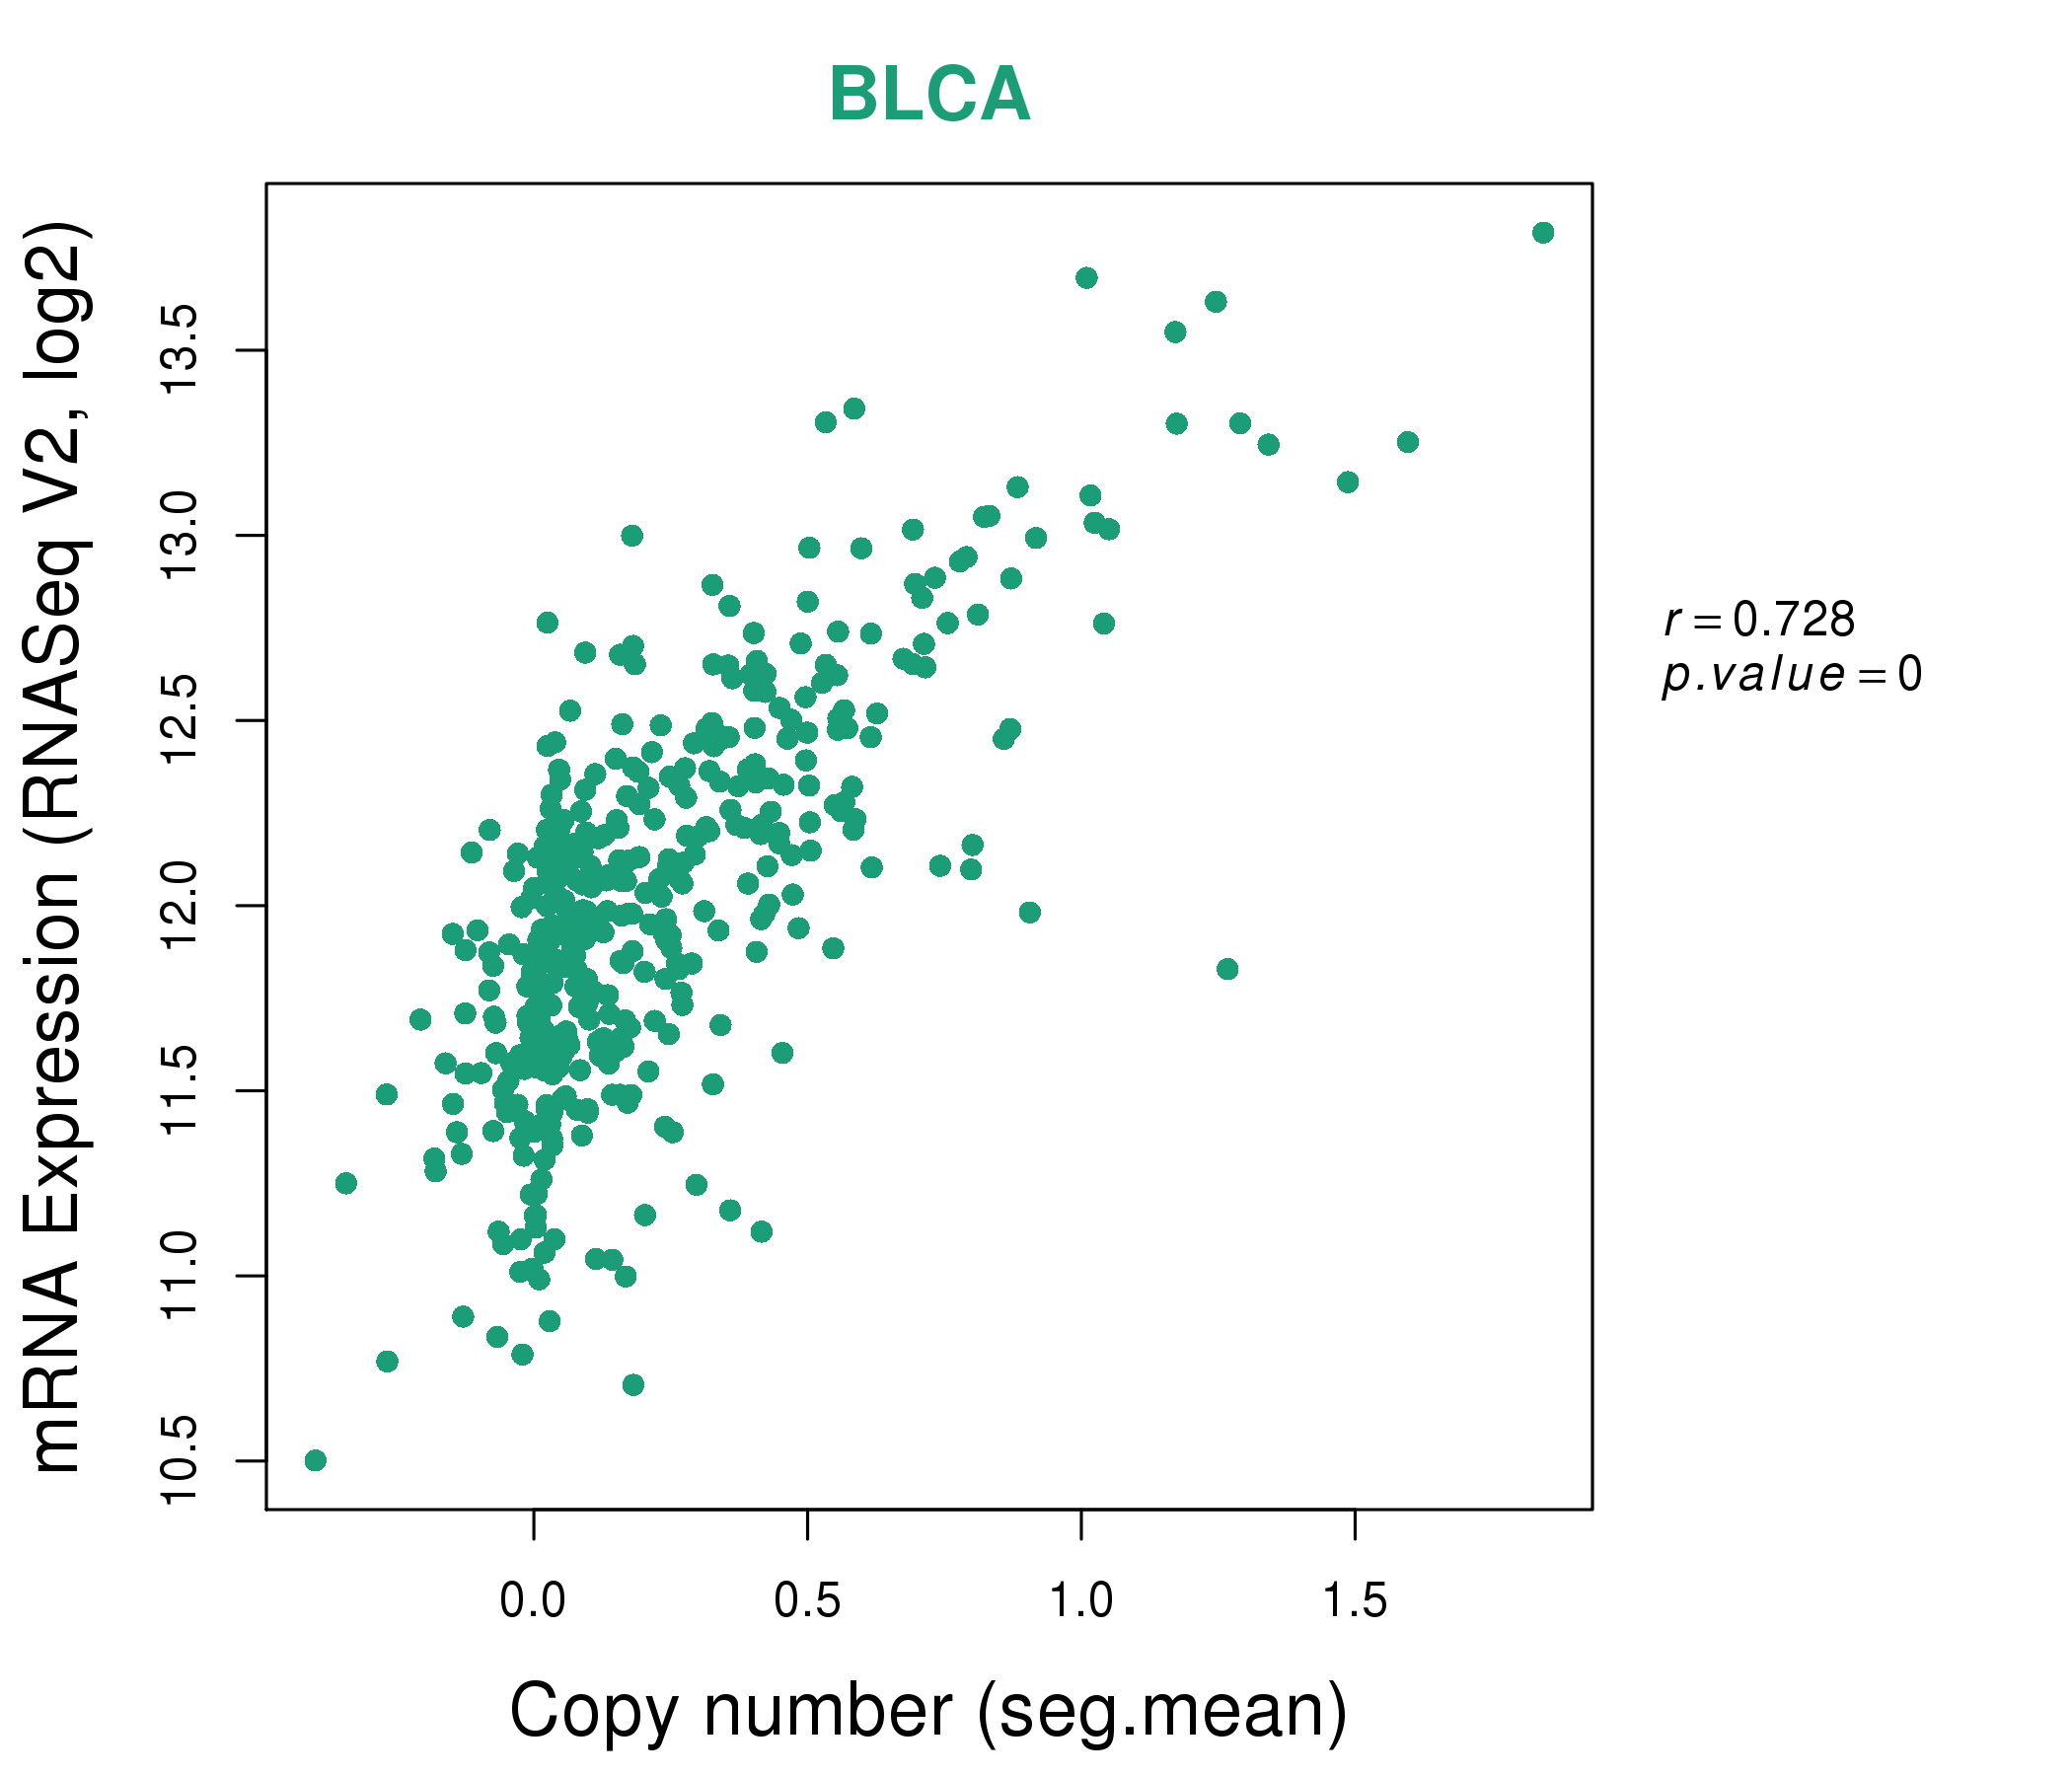
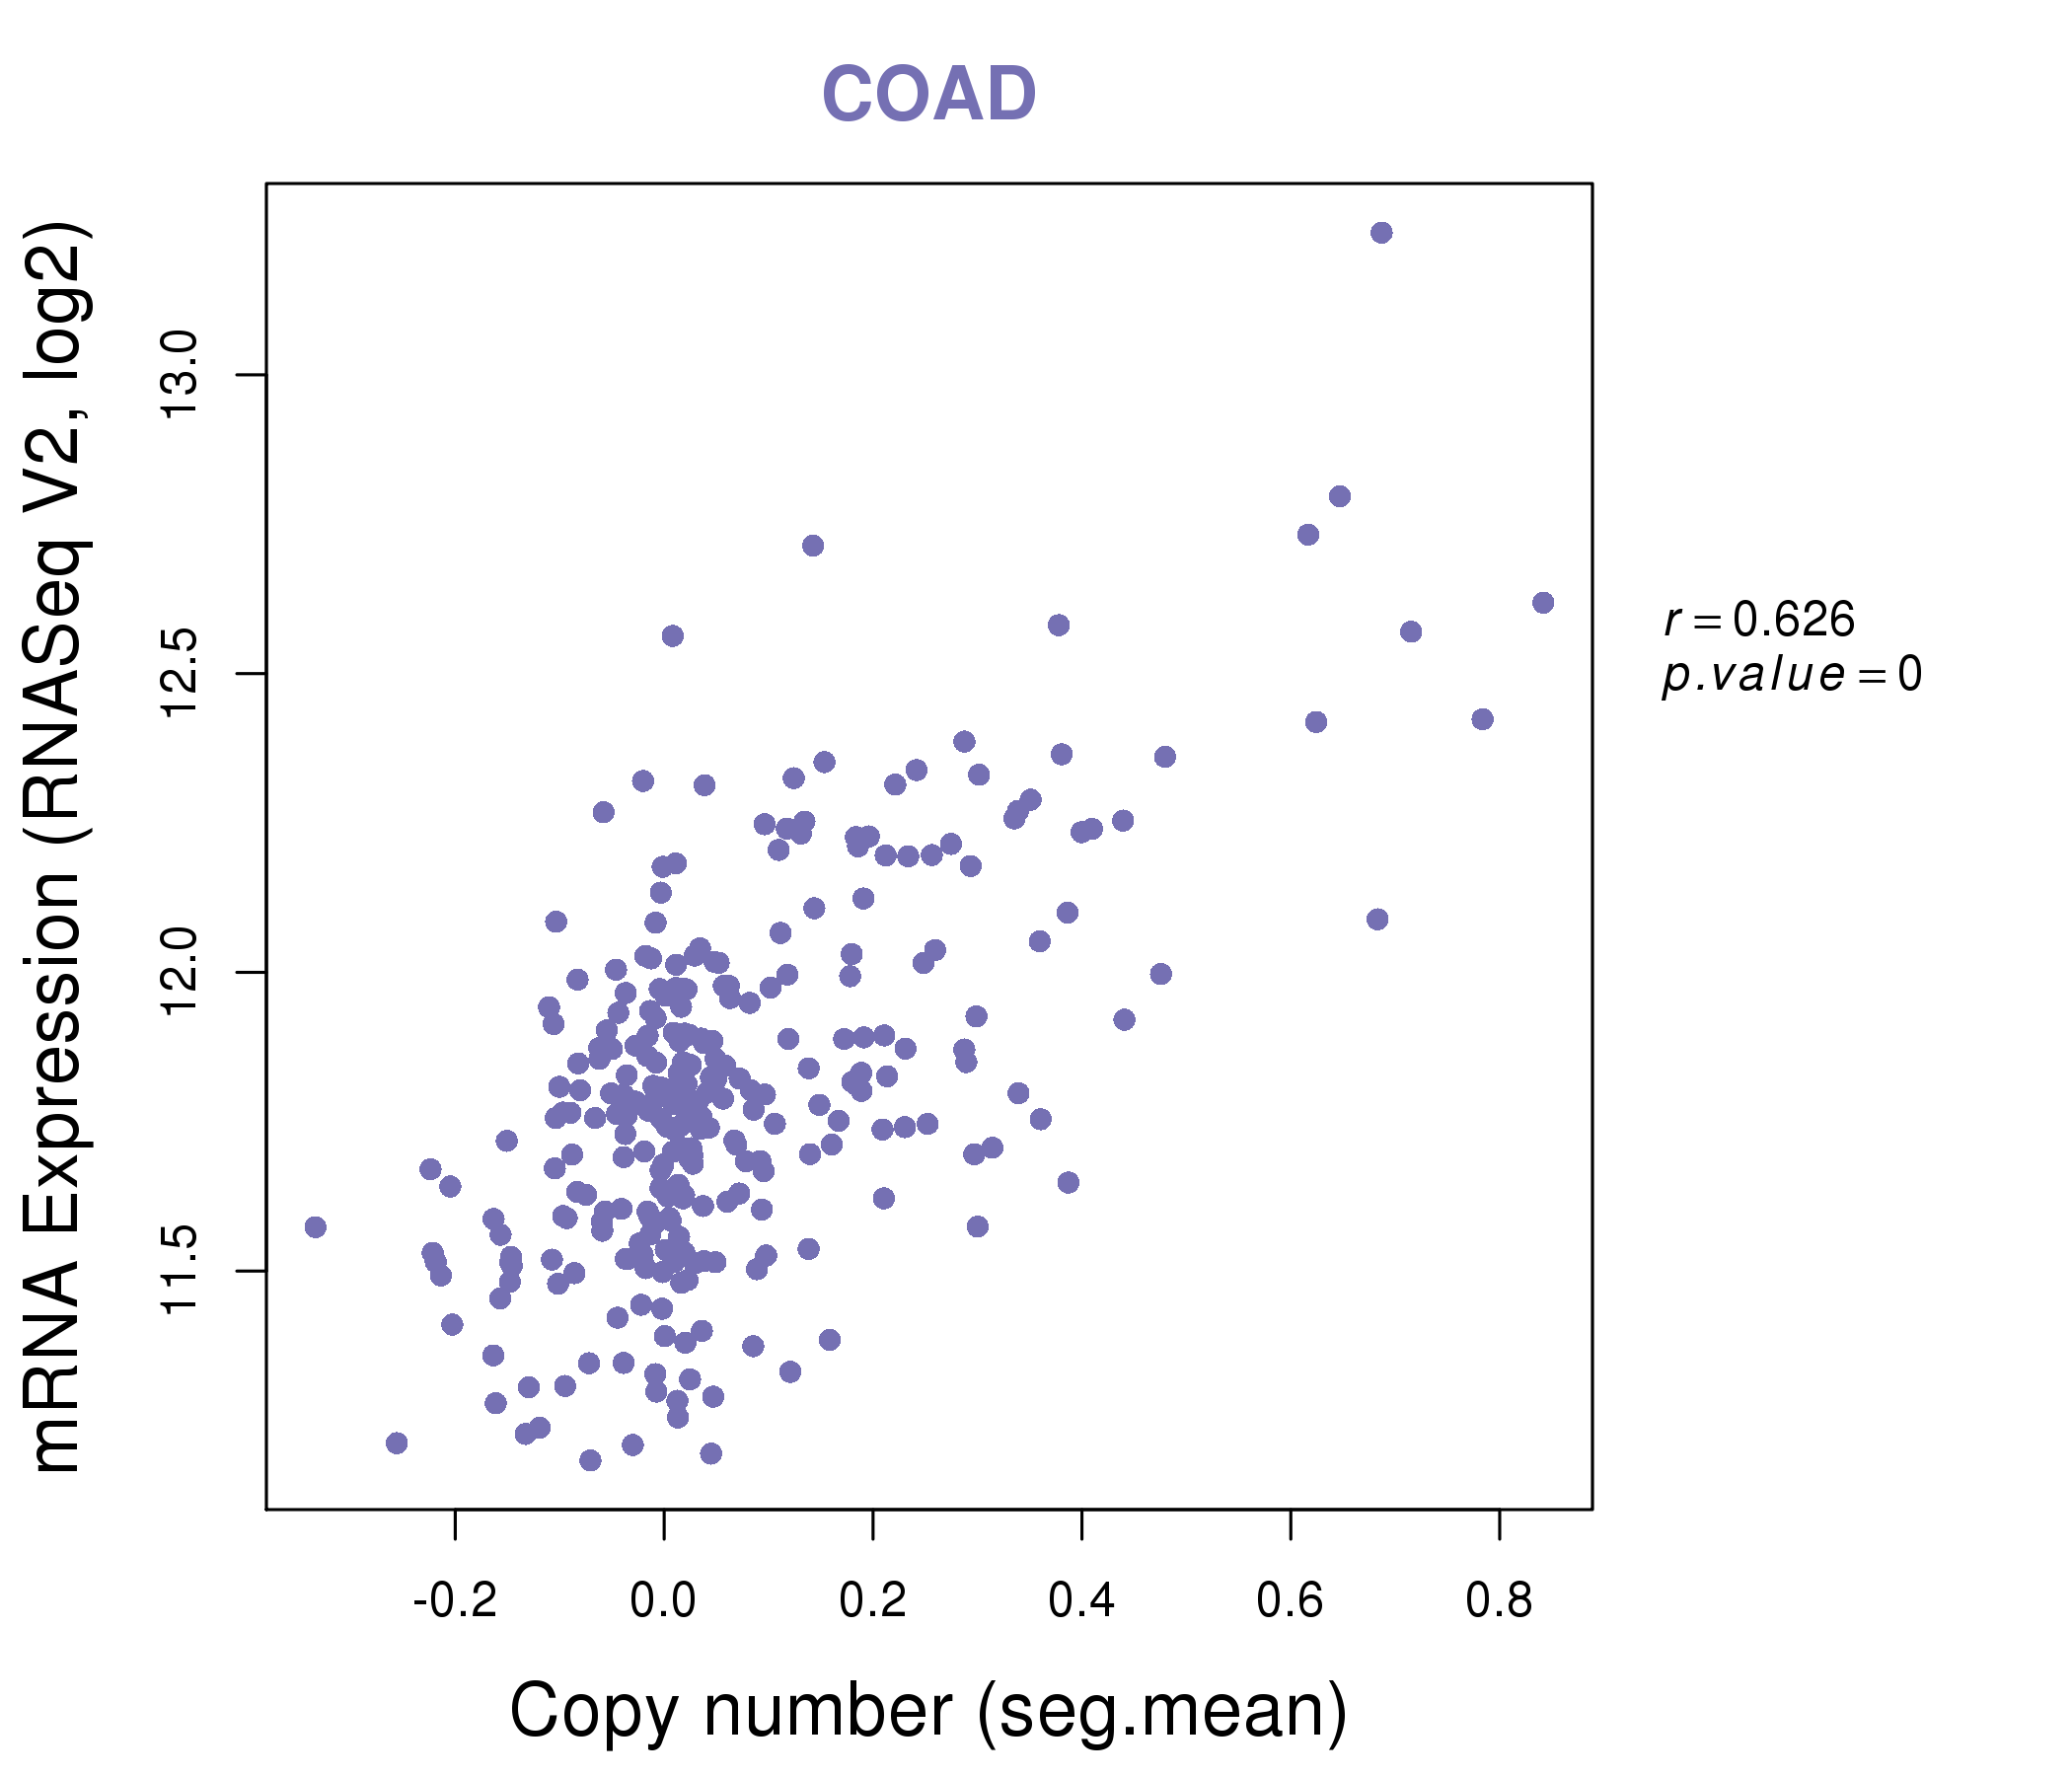
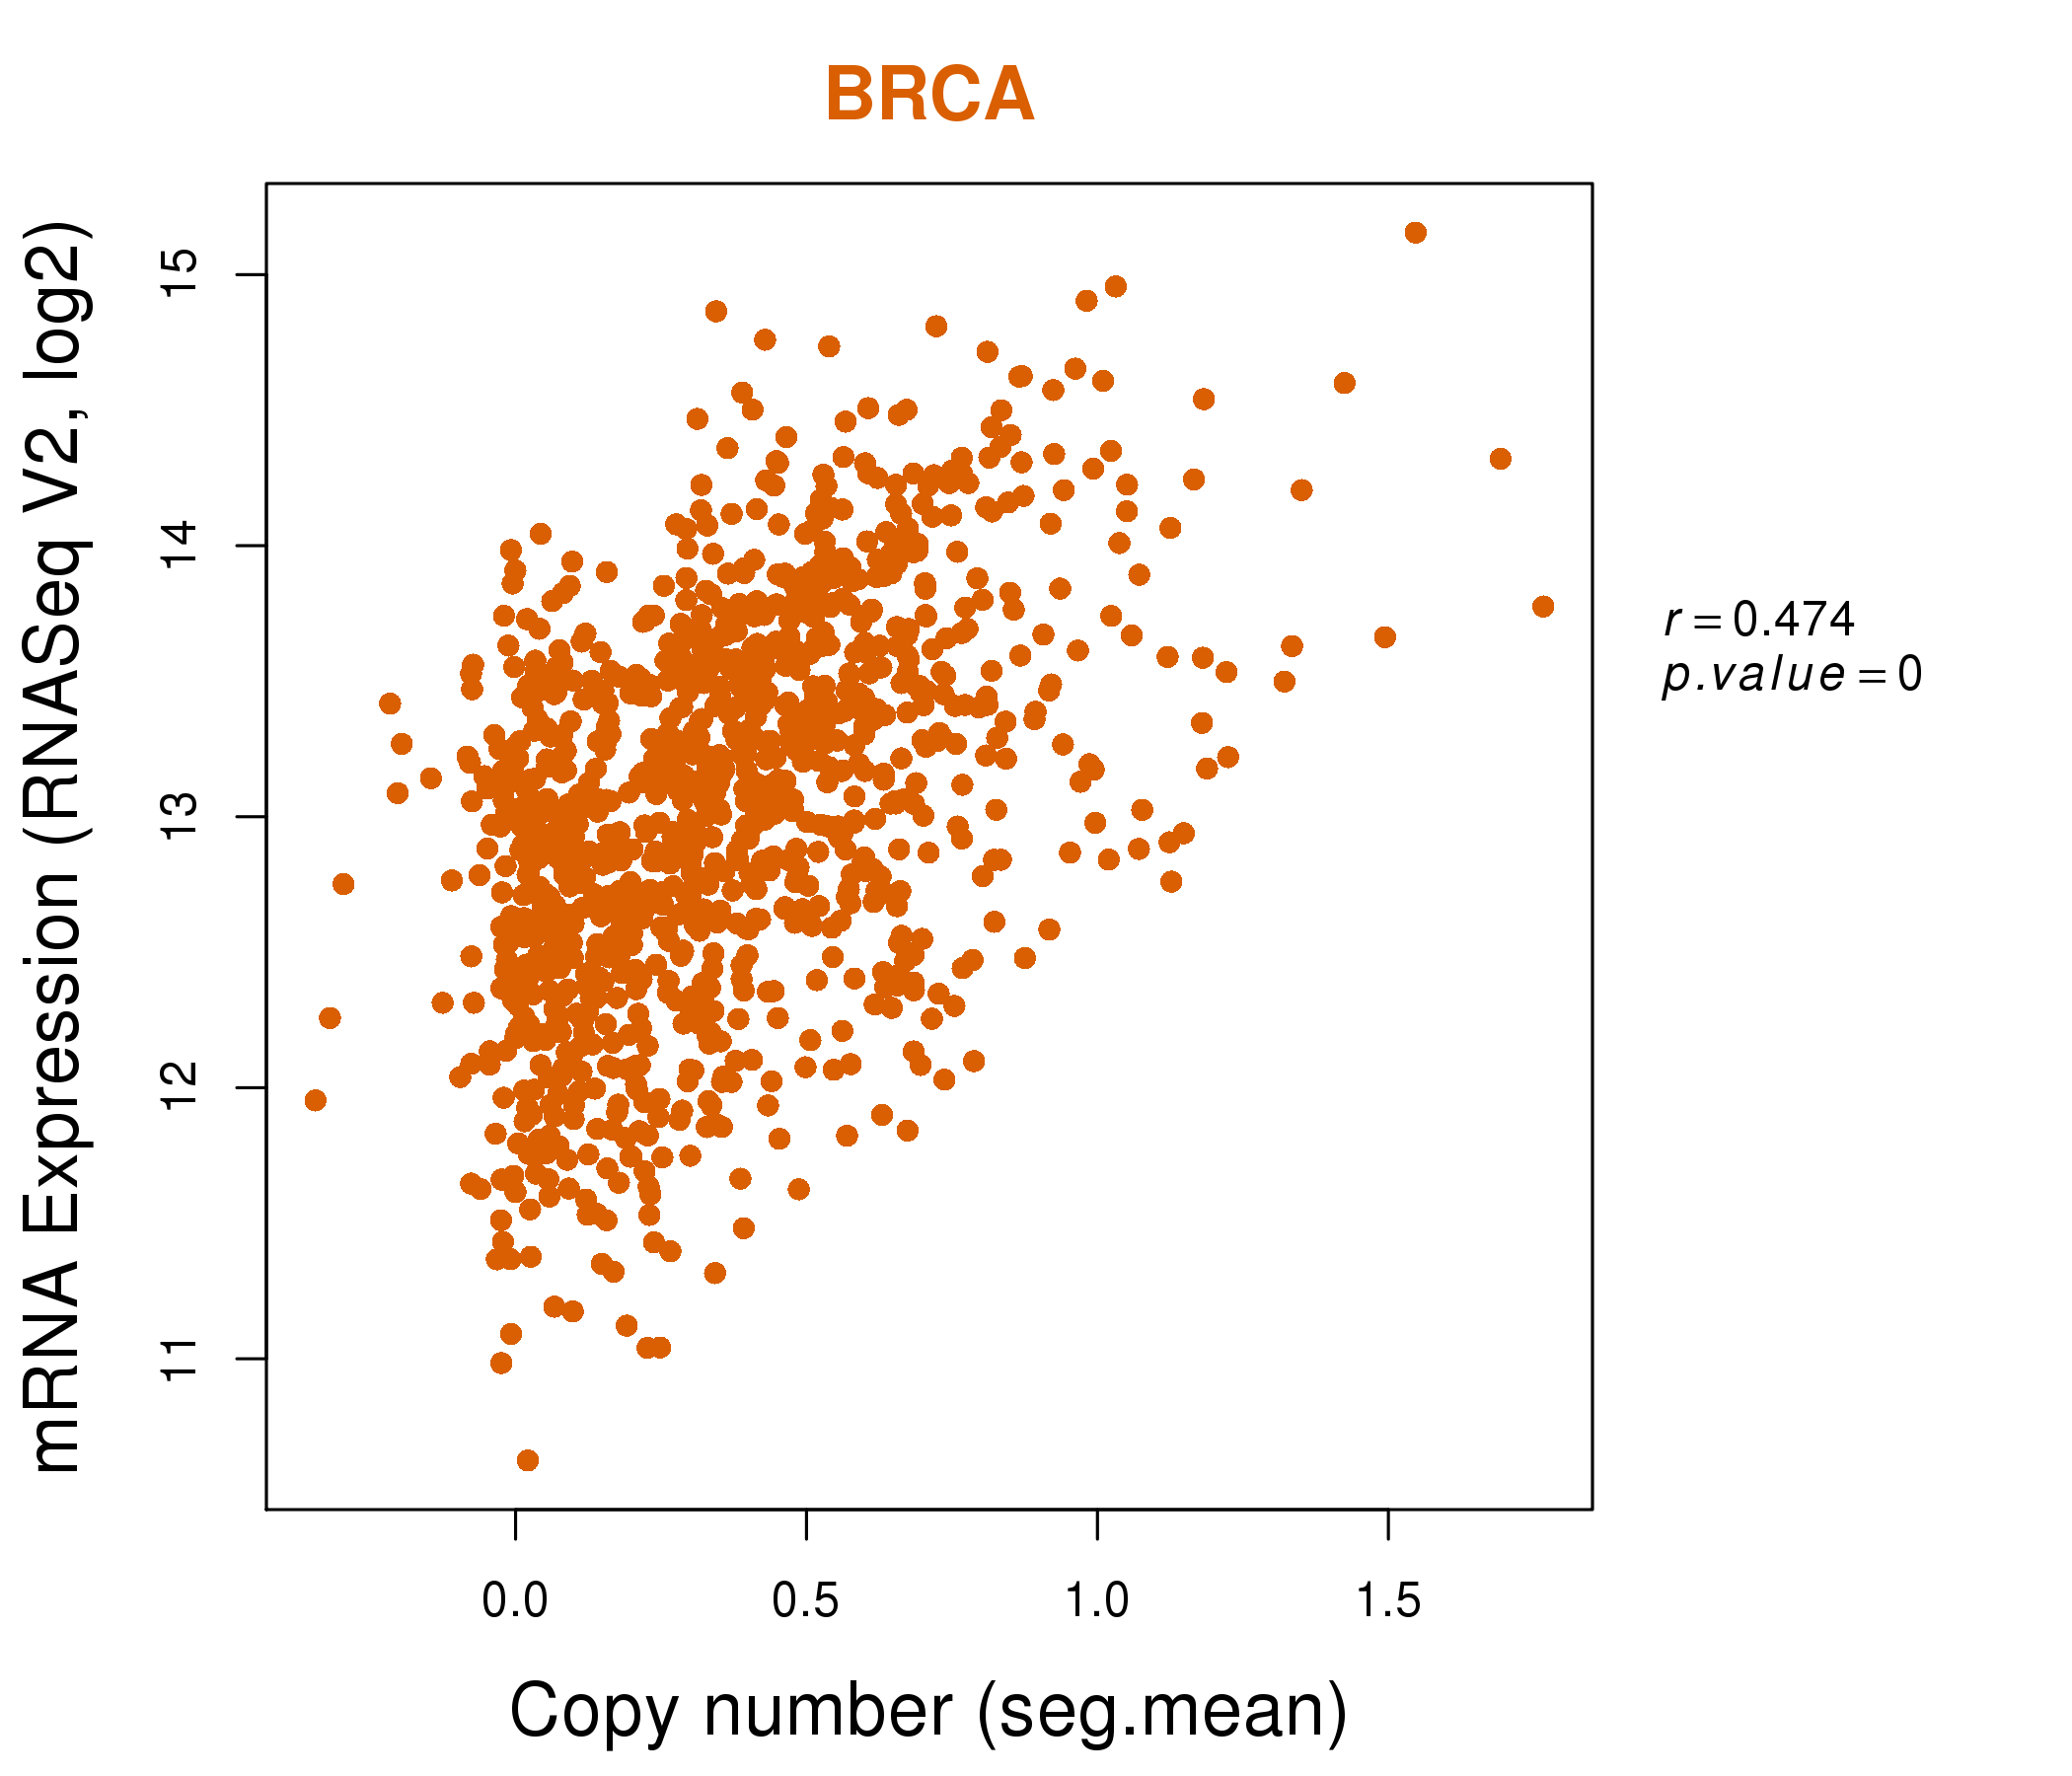
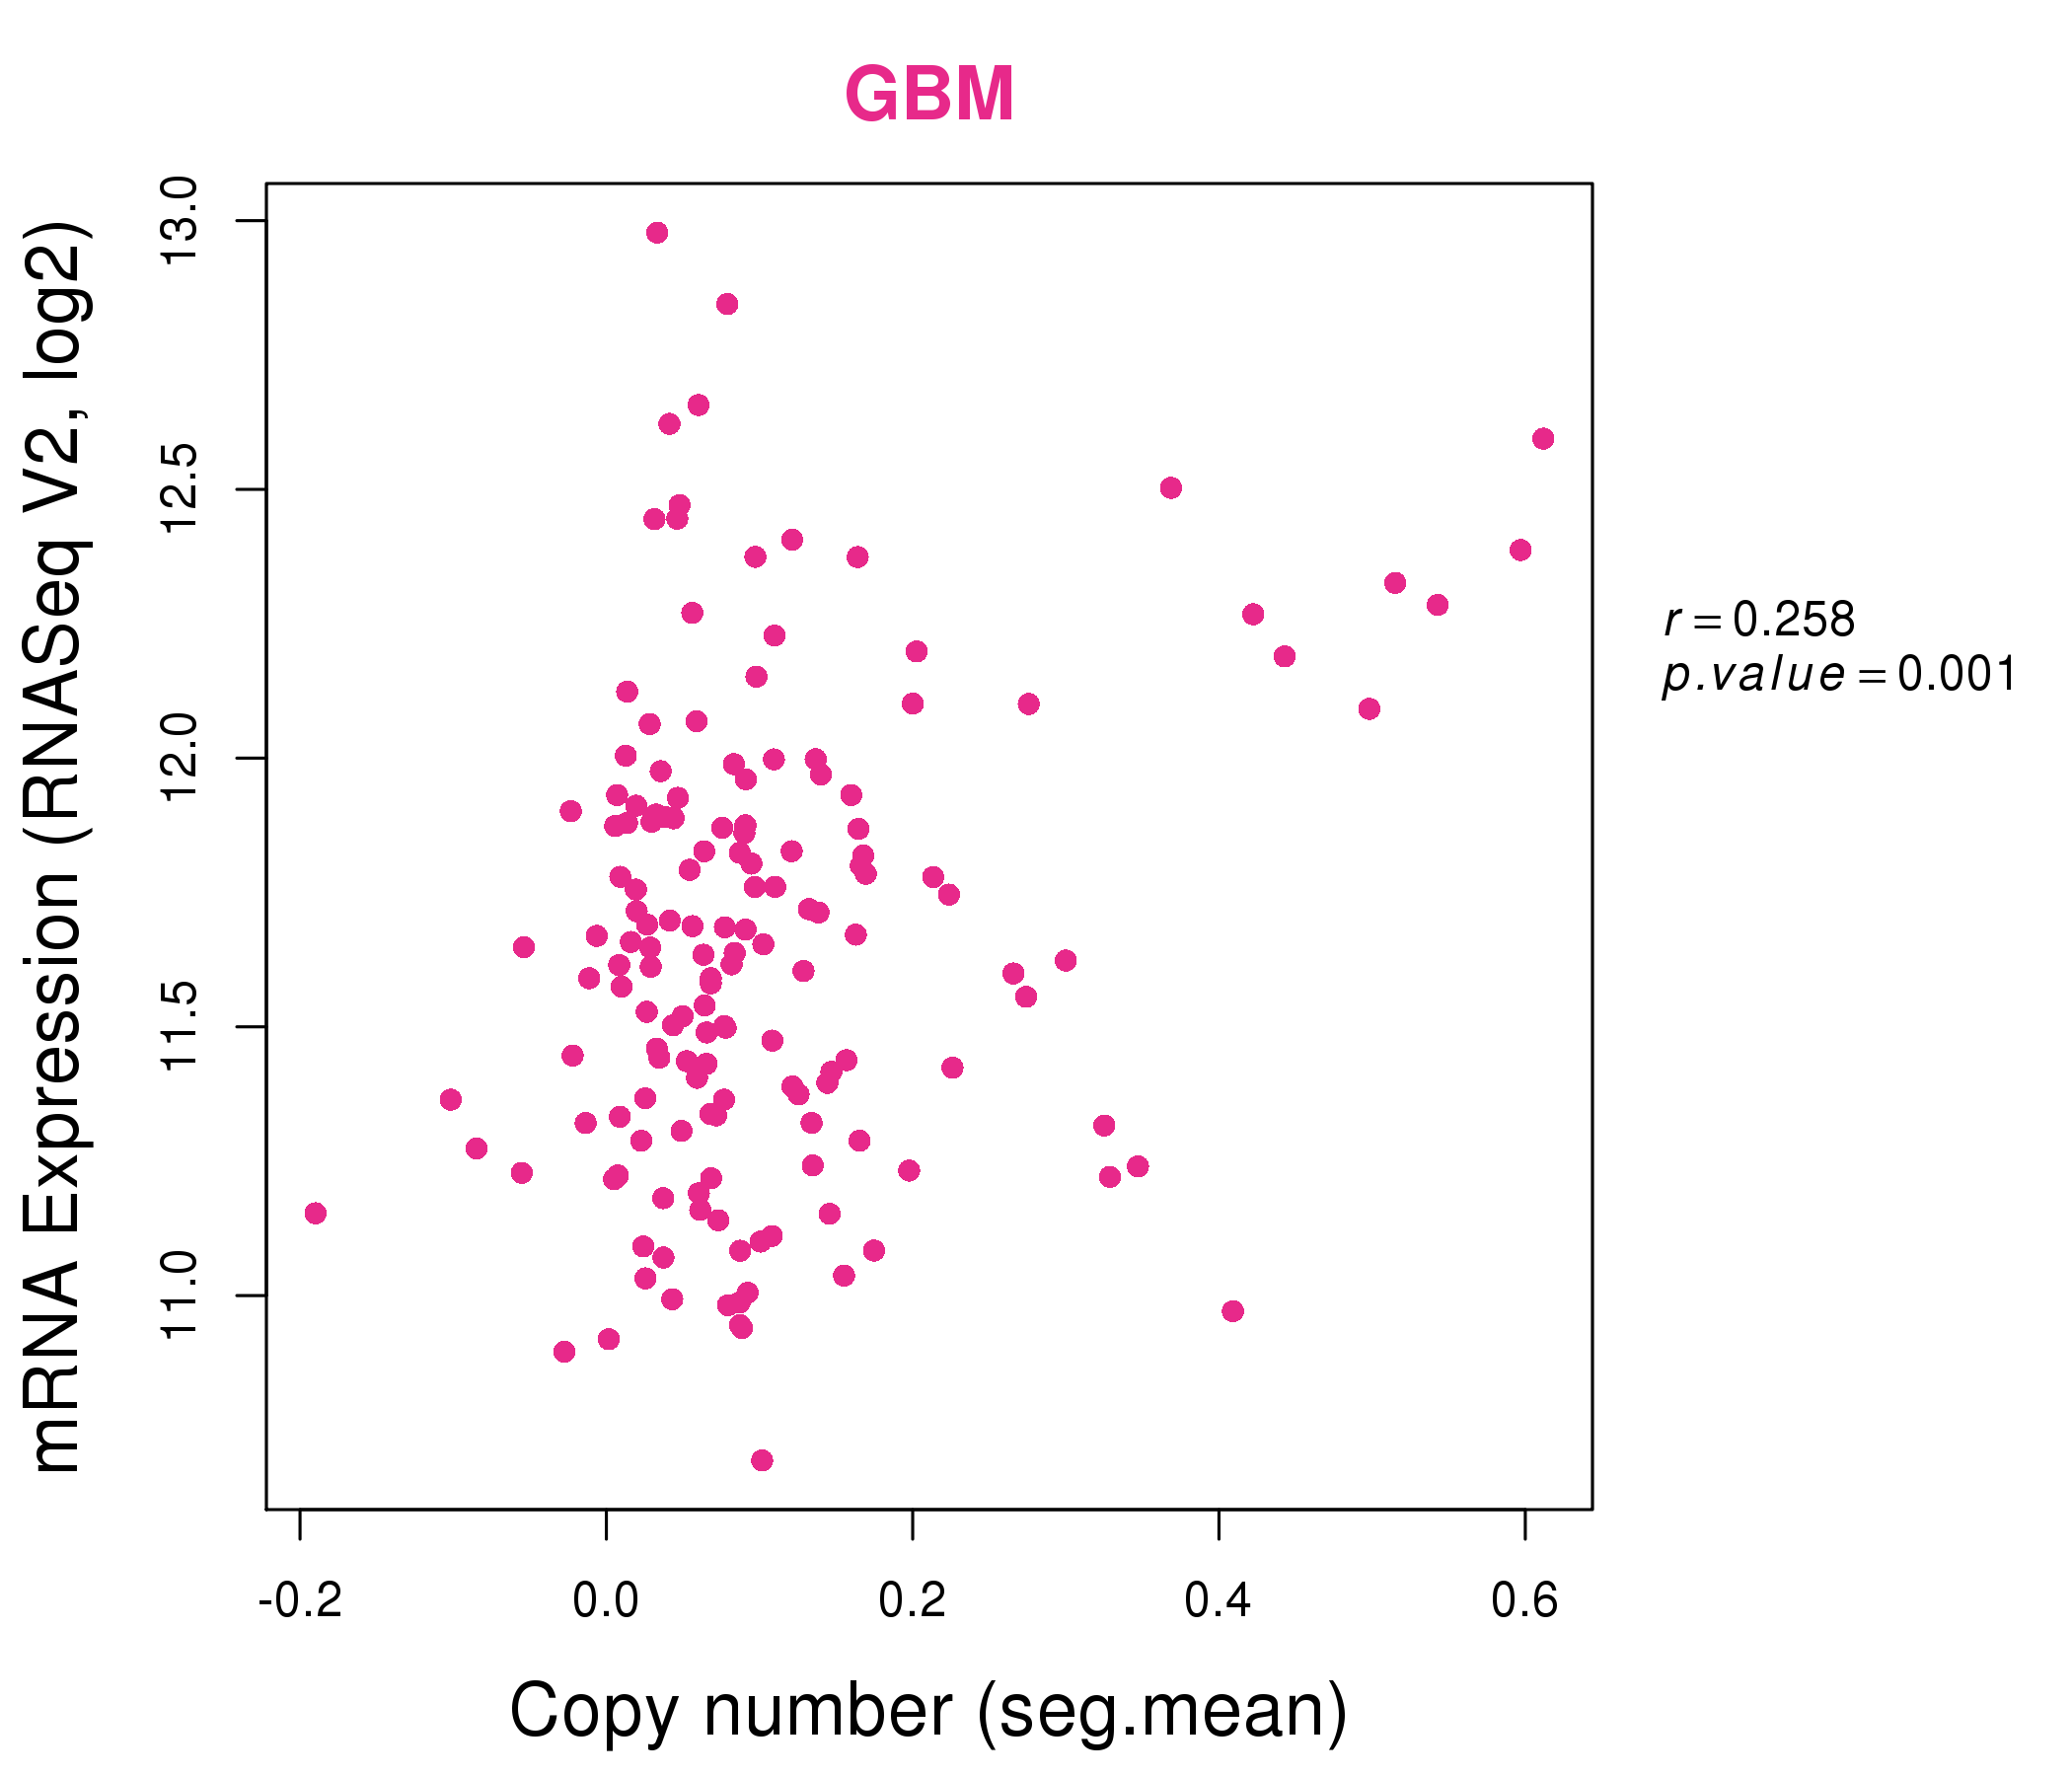
| * This plots show the correlation between CNV and gene expression. |
: Open all plots for all cancer types
 |
|
 |
|
| Top |
| Gene-Gene Network Information |
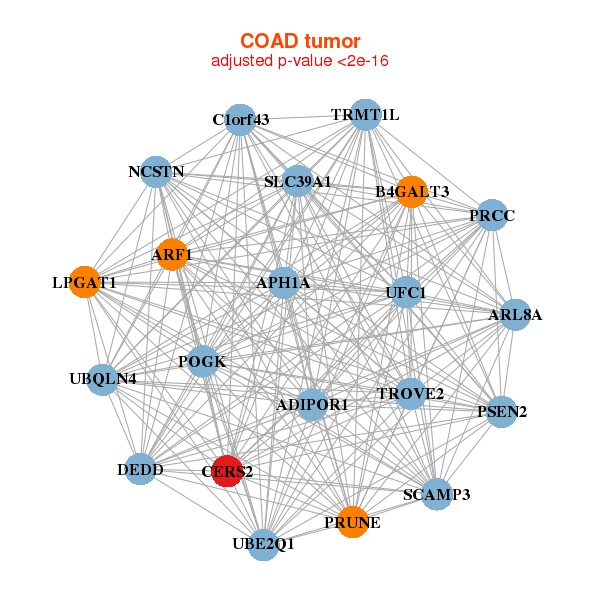
| * Co-Expression network figures were drawn using R package igraph. Only the top 20 genes with the highest correlations were shown. Red circle: input gene, orange circle: cell metabolism gene, sky circle: other gene |
: Open all plots for all cancer types
 |
|
| ADIPOR1,ANXA9,TRMT1L,C1orf27,C1orf43,C1orf56,COG2, CYB5R1,DCAF8,FAM63A,GOLPH3L,HHAT,CERS2,OTUD7B, PEX11B,PEX19,PIGM,PRUNE,SNX27,TMCO1,ZNF687 | AAGAB,ARF3,ATP6AP1,CCDC87,CLGN,EIF2AK1,HN1L, CERS2,MAGED2,PPP1R11,PRR15,PYY,SEPHS2,SMS, TM9SF1,TMBIM6,TMCO1,TSPAN13,TTC39A,XBP1,YIPF1 |
 |
|
| ADIPOR1,APH1A,ARF1,ARL8A,B4GALT3,TRMT1L,C1orf43, DEDD,CERS2,LPGAT1,NCSTN,POGK,PRCC,PRUNE, PSEN2,SCAMP3,SLC39A1,TROVE2,UBE2Q1,UBQLN4,UFC1 | ALPI,SOWAHA,AQP11,SSUH2,CCDC152,CYP27A1,FADS6, FAM102A,GNB1,CERS2,MEP1A,MSRA,MYO1A,MYOM3, NAGS,OIT3,PLA2G12B,SEPP1,SLC15A1,SLC6A19,TMEM150B |
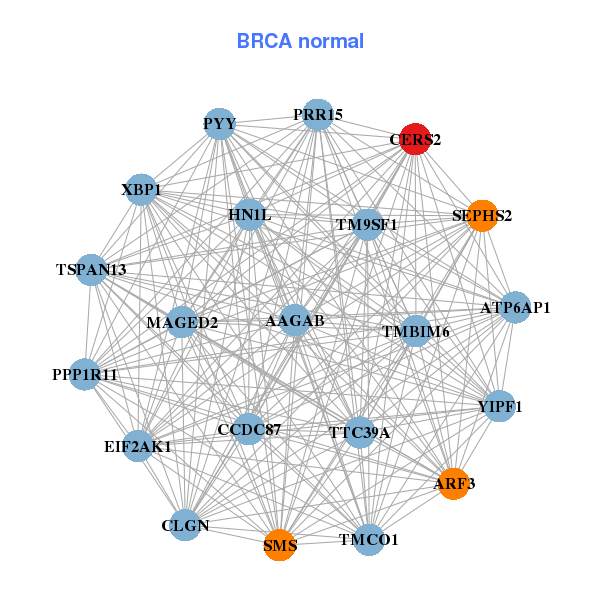
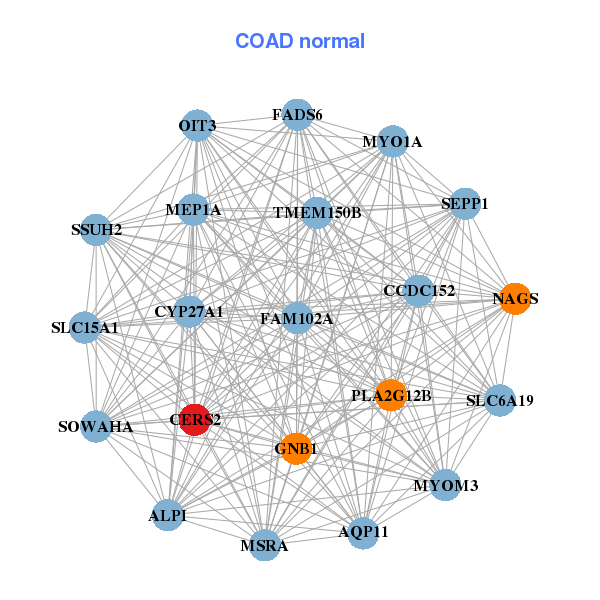
| * Co-Expression network figures were drawn using R package igraph. Only the top 20 genes with the highest correlations were shown. Red circle: input gene, orange circle: cell metabolism gene, sky circle: other gene |
: Open all plots for all cancer types
| Top |
: Open all interacting genes' information including KEGG pathway for all interacting genes from DAVID
| Top |
| Pharmacological Information for CERS2 |
| There's no related Drug. |
| Top |
| Cross referenced IDs for CERS2 |
| * We obtained these cross-references from Uniprot database. It covers 150 different DBs, 18 categories. http://www.uniprot.org/help/cross_references_section |
: Open all cross reference information
|
Copyright © 2016-Present - The Univsersity of Texas Health Science Center at Houston @ |