|
||||||||||||||||||||||||||||||||||||||||||||||||||||||||||||||||||||||||||||||||||||||||||||||||||||||||||||||||||||||||||||||||||||||||||||||||||||||||||||||||||||||||||||||||||||||||||||||||||||||||||||||||||||||||||||||||||||||||||||||||||||||||||||||||||||||||||||||||||||||||||||||||||||||||||||||||||||||||||
| |
| Phenotypic Information (metabolism pathway, cancer, disease, phenome) |
| |
| |
| Gene-Gene Network Information: Co-Expression Network, Interacting Genes & KEGG |
| |
|


| Gene Summary for DMGDH |
| Top |
| Phenotypic Information for DMGDH(metabolism pathway, cancer, disease, phenome) |
| Cancer | CGAP: DMGDH |
| Familial Cancer Database: DMGDH | |
| * This gene is included in those cancer gene databases. |
|
|
|
|
|
| . | ||||||||||||||||||||||||||||||||||||||||||||||||||||||||||||||||||||||||||||||||||||||||||||||||||||||||||||||||||||||||||||||||||||||||||||||||||||||||||||||||||||||||||||||||||||||||||||||||||||||||||||||||||||||||||||||||||||||||||||||||||||||||||||||||||||||||||||||||||||||||||||||||||||||||||||||||||||
Oncogene 1 | Significant driver gene in | |||||||||||||||||||||||||||||||||||||||||||||||||||||||||||||||||||||||||||||||||||||||||||||||||||||||||||||||||||||||||||||||||||||||||||||||||||||||||||||||||||||||||||||||||||||||||||||||||||||||||||||||||||||||||||||||||||||||||||||||||||||||||||||||||||||||||||||||||||||||||||||||||||||||||||||||||||||||||
| cf) number; DB name 1 Oncogene; http://nar.oxfordjournals.org/content/35/suppl_1/D721.long, 2 Tumor Suppressor gene; https://bioinfo.uth.edu/TSGene/, 3 Cancer Gene Census; http://www.nature.com/nrc/journal/v4/n3/abs/nrc1299.html, 4 CancerGenes; http://nar.oxfordjournals.org/content/35/suppl_1/D721.long, 5 Network of Cancer Gene; http://ncg.kcl.ac.uk/index.php, 1Therapeutic Vulnerabilities in Cancer; http://cbio.mskcc.org/cancergenomics/statius/ |
| KEGG_GLYCINE_SERINE_AND_THREONINE_METABOLISM | |
| OMIM | 605849; gene. 605850; phenotype. |
| Orphanet | 243343; Dimethylglycine dehydrogenase deficiency. |
| Disease | KEGG Disease: DMGDH |
| MedGen: DMGDH (Human Medical Genetics with Condition) | |
| ClinVar: DMGDH | |
| Phenotype | MGI: DMGDH (International Mouse Phenotyping Consortium) |
| PhenomicDB: DMGDH | |
| Mutations for DMGDH |
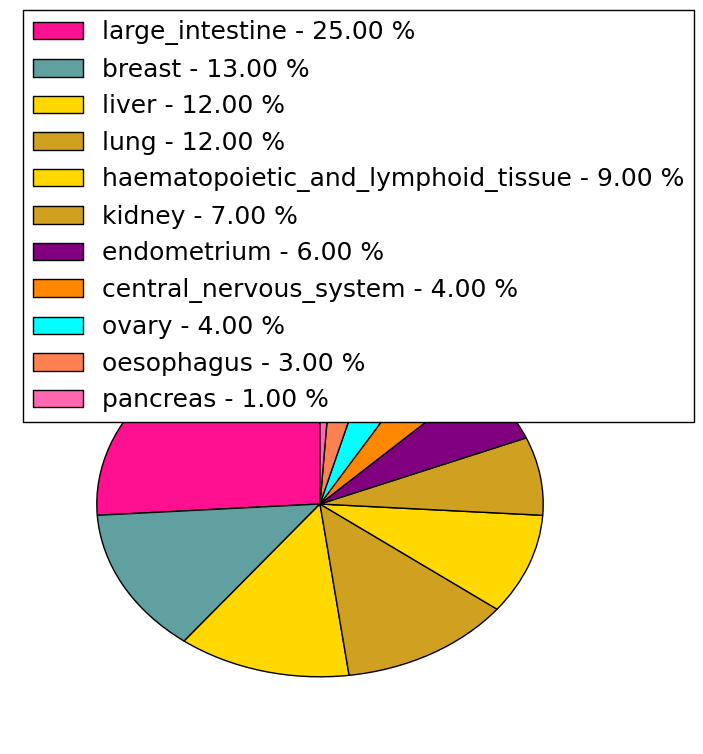
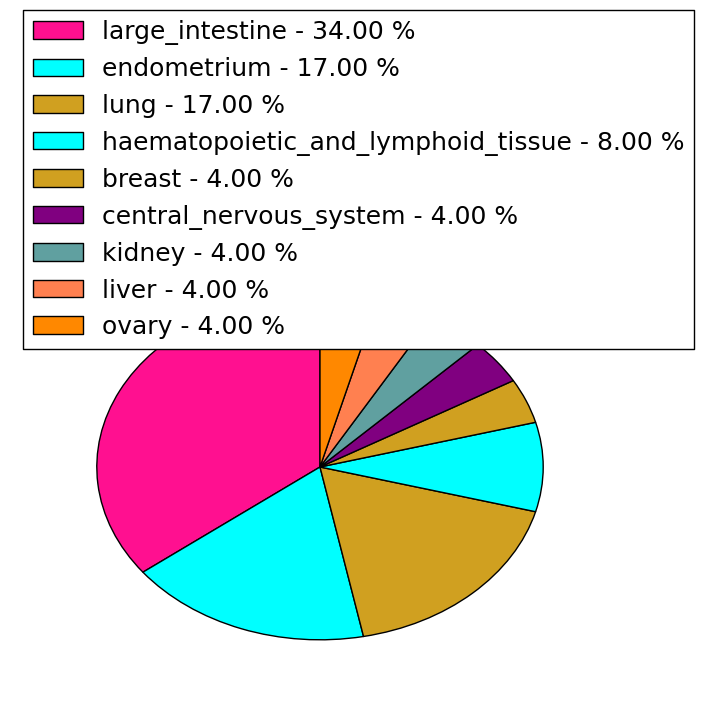
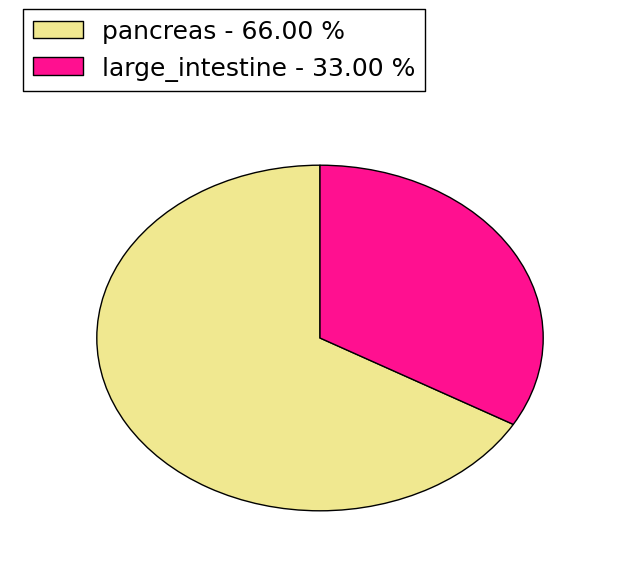
| * Under tables are showing count per each tissue to give us broad intuition about tissue specific mutation patterns.You can go to the detailed page for each mutation database's web site. |
| There's no structural variation information in COSMIC data for this gene. |
| * From mRNA Sanger sequences, Chitars2.0 arranged chimeric transcripts. This table shows DMGDH related fusion information. |
| ID | Head Gene | Tail Gene | Accession | Gene_a | qStart_a | qEnd_a | Chromosome_a | tStart_a | tEnd_a | Gene_a | qStart_a | qEnd_a | Chromosome_a | tStart_a | tEnd_a |
| Top |
| Mutation type/ Tissue ID | brca | cns | cerv | endome | haematopo | kidn | Lintest | liver | lung | ns | ovary | pancre | prost | skin | stoma | thyro | urina | |||
| Total # sample | 2 | |||||||||||||||||||
| GAIN (# sample) | ||||||||||||||||||||
| LOSS (# sample) | 2 |
| cf) Tissue ID; Tissue type (1; Breast, 2; Central_nervous_system, 3; Cervix, 4; Endometrium, 5; Haematopoietic_and_lymphoid_tissue, 6; Kidney, 7; Large_intestine, 8; Liver, 9; Lung, 10; NS, 11; Ovary, 12; Pancreas, 13; Prostate, 14; Skin, 15; Stomach, 16; Thyroid, 17; Urinary_tract) |
| Top |
|
 |
| Top |
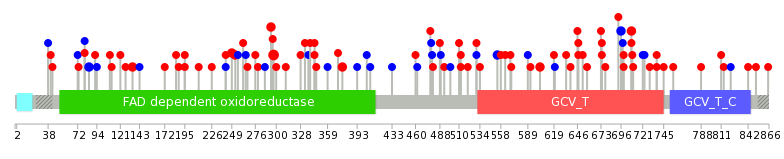
| Stat. for Non-Synonymous SNVs (# total SNVs=66) | (# total SNVs=23) |
 |  |
(# total SNVs=3) | (# total SNVs=0) |
 |
| Top |
| * When you move the cursor on each content, you can see more deailed mutation information on the Tooltip. Those are primary_site,primary_histology,mutation(aa),pubmedID. |
| GRCh37 position | Mutation(aa) | Unique sampleID count |
| chr5:78340231-78340231 | p.S297L | 4 |
| chr5:78338173-78338173 | p.P376S | 2 |
| chr5:78325734-78325734 | p.D603N | 2 |
| chr5:78340364-78340364 | p.R253C | 2 |
| chr5:78340375-78340375 | p.G249E | 2 |
| chr5:78359429-78359429 | p.? | 2 |
| chr5:78340240-78340240 | p.L294Q | 2 |
| chr5:78338268-78338268 | p.R344Q | 2 |
| chr5:78320134-78320134 | p.P737H | 2 |
| chr5:78359457-78359457 | p.T85T | 2 |
| Top |
|
 |
| Point Mutation/ Tissue ID | 1 | 2 | 3 | 4 | 5 | 6 | 7 | 8 | 9 | 10 | 11 | 12 | 13 | 14 | 15 | 16 | 17 | 18 | 19 | 20 |
| # sample | 1 | 3 | 15 | 2 | 1 | 4 | 5 | 3 | 2 | 14 | 10 | 1 | 7 | |||||||
| # mutation | 1 | 3 | 17 | 2 | 2 | 4 | 7 | 3 | 2 | 16 | 10 | 1 | 7 | |||||||
| nonsynonymous SNV | 3 | 11 | 2 | 1 | 3 | 5 | 3 | 2 | 10 | 7 | 1 | 4 | ||||||||
| synonymous SNV | 1 | 6 | 1 | 1 | 2 | 6 | 3 | 3 |
| cf) Tissue ID; Tissue type (1; BLCA[Bladder Urothelial Carcinoma], 2; BRCA[Breast invasive carcinoma], 3; CESC[Cervical squamous cell carcinoma and endocervical adenocarcinoma], 4; COAD[Colon adenocarcinoma], 5; GBM[Glioblastoma multiforme], 6; Glioma Low Grade, 7; HNSC[Head and Neck squamous cell carcinoma], 8; KICH[Kidney Chromophobe], 9; KIRC[Kidney renal clear cell carcinoma], 10; KIRP[Kidney renal papillary cell carcinoma], 11; LAML[Acute Myeloid Leukemia], 12; LUAD[Lung adenocarcinoma], 13; LUSC[Lung squamous cell carcinoma], 14; OV[Ovarian serous cystadenocarcinoma ], 15; PAAD[Pancreatic adenocarcinoma], 16; PRAD[Prostate adenocarcinoma], 17; SKCM[Skin Cutaneous Melanoma], 18:STAD[Stomach adenocarcinoma], 19:THCA[Thyroid carcinoma], 20:UCEC[Uterine Corpus Endometrial Carcinoma]) |
| Top |
| * We represented just top 10 SNVs. When you move the cursor on each content, you can see more deailed mutation information on the Tooltip. Those are primary_site, primary_histology, mutation(aa), pubmedID. |
| Genomic Position | Mutation(aa) | Unique sampleID count |
| chr5:78338173 | p.R344Q | 2 |
| chr5:78340364 | p.D708G | 2 |
| chr5:78322314 | p.L554L | 2 |
| chr5:78338268 | p.D696D | 2 |
| chr5:78322349 | p.S276L | 2 |
| chr5:78326677 | p.R253C | 2 |
| chr5:78340294 | p.P376S | 2 |
| chr5:78350088 | p.P195L | 1 |
| chr5:78326781 | p.G563C | 1 |
| chr5:78359598 | p.E339D | 1 |
| * Copy number data were extracted from TCGA using R package TCGA-Assembler. The URLs of all public data files on TCGA DCC data server were gathered on Jan-05-2015. Function ProcessCNAData in TCGA-Assembler package was used to obtain gene-level copy number value which is calculated as the average copy number of the genomic region of a gene. |
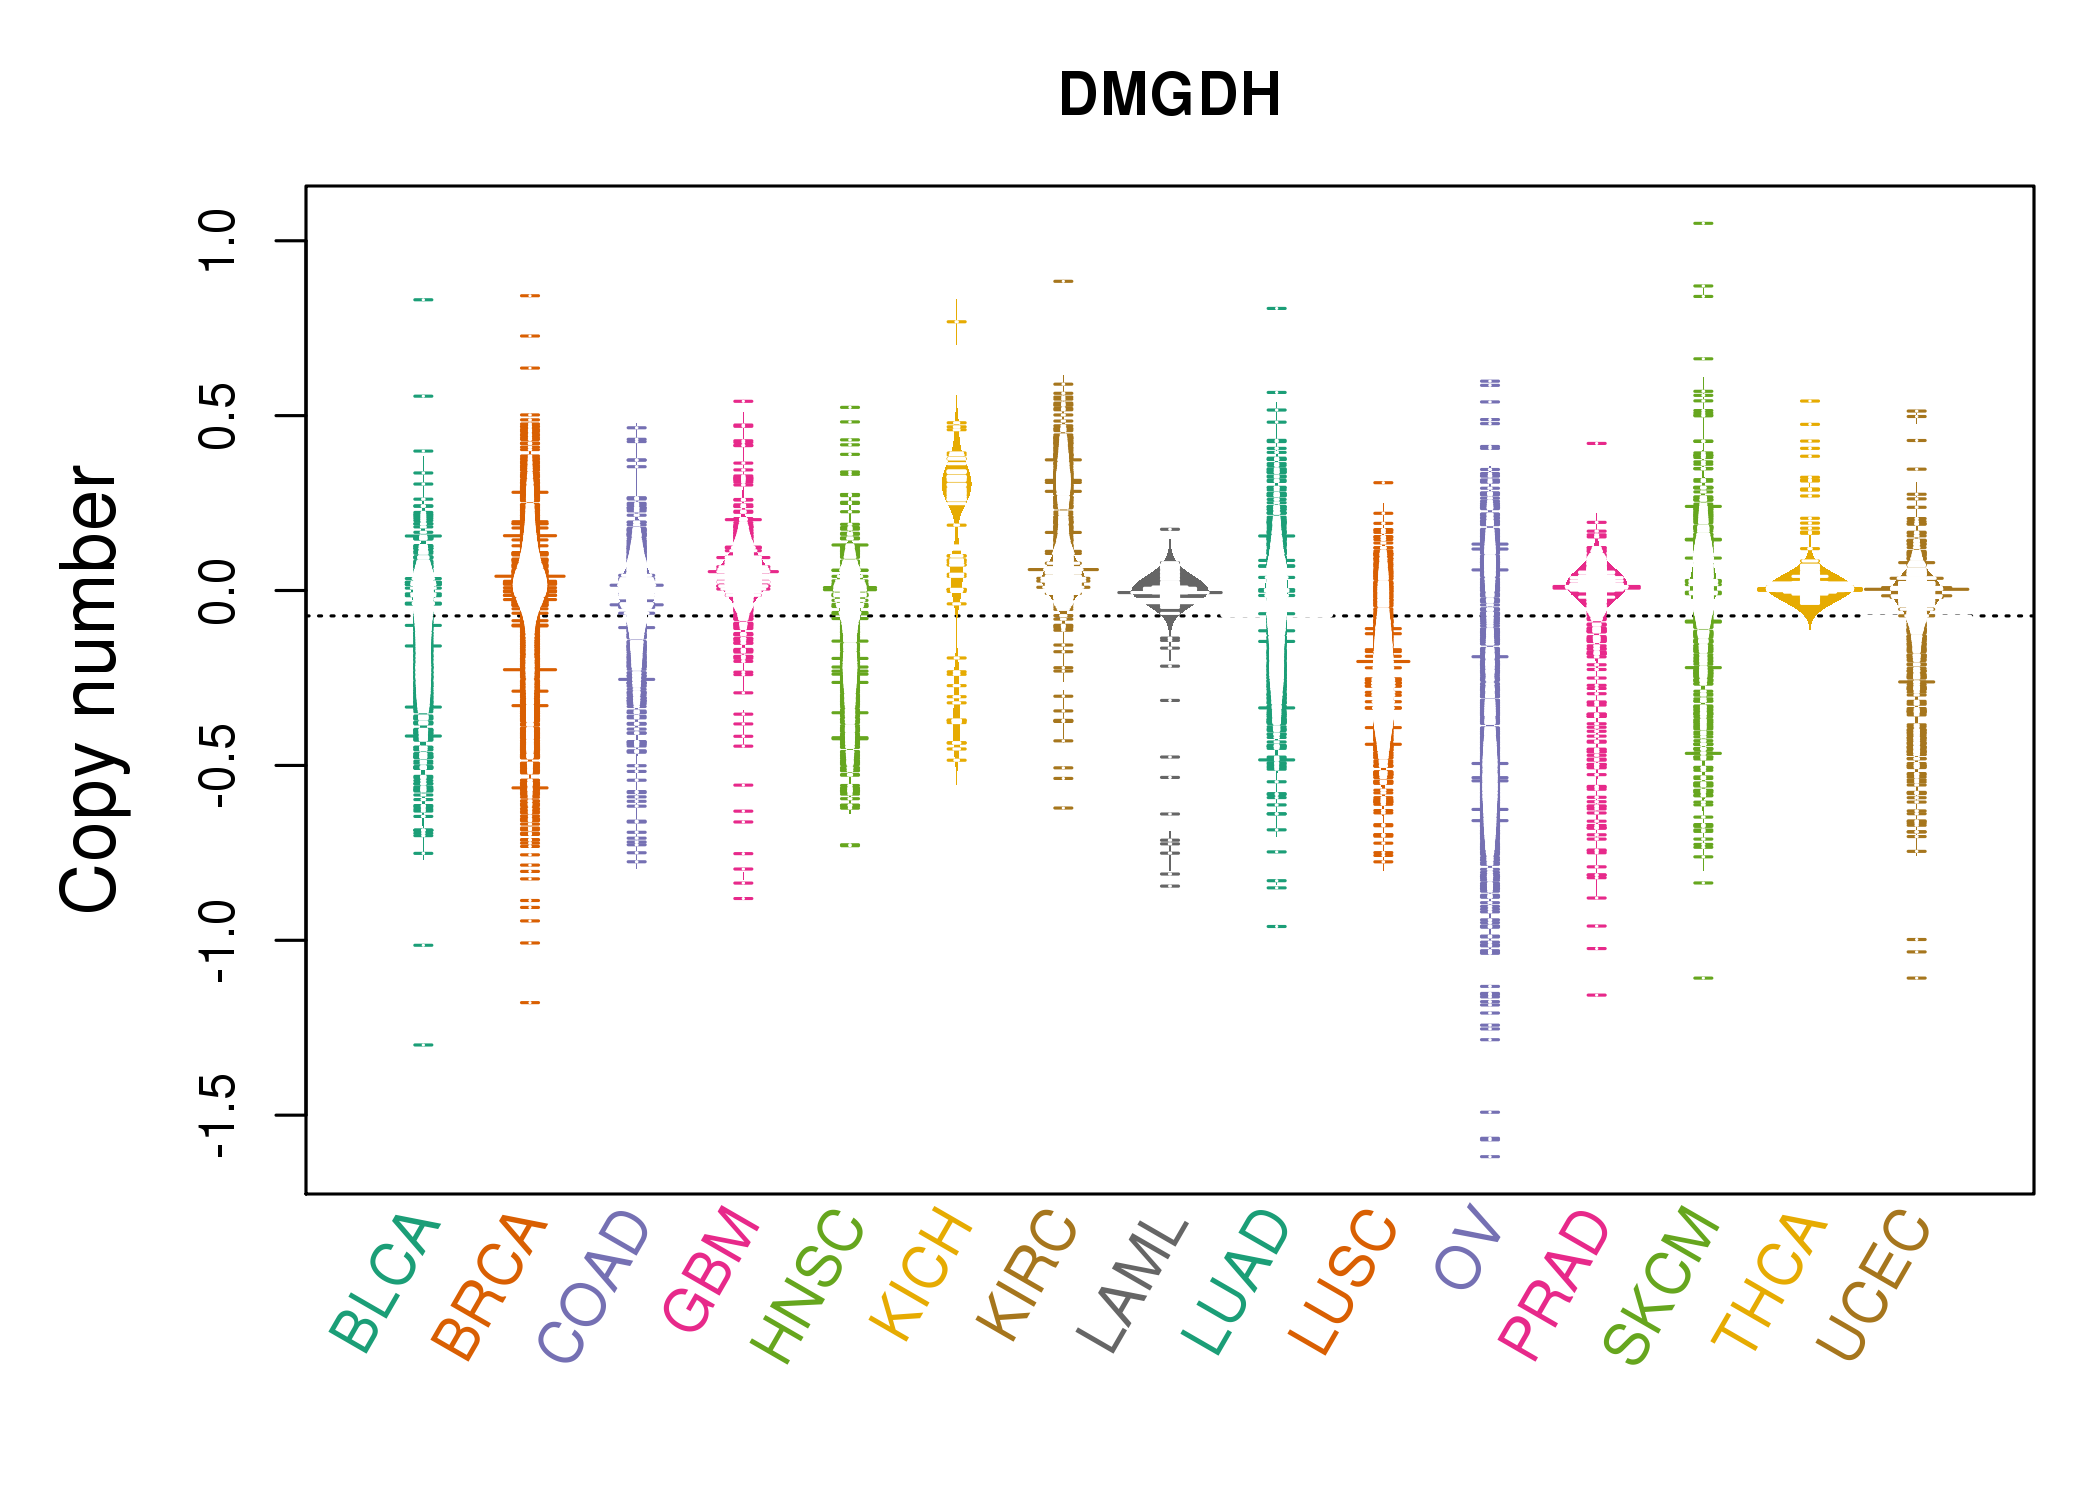 |
| cf) Tissue ID[Tissue type]: BLCA[Bladder Urothelial Carcinoma], BRCA[Breast invasive carcinoma], CESC[Cervical squamous cell carcinoma and endocervical adenocarcinoma], COAD[Colon adenocarcinoma], GBM[Glioblastoma multiforme], Glioma Low Grade, HNSC[Head and Neck squamous cell carcinoma], KICH[Kidney Chromophobe], KIRC[Kidney renal clear cell carcinoma], KIRP[Kidney renal papillary cell carcinoma], LAML[Acute Myeloid Leukemia], LUAD[Lung adenocarcinoma], LUSC[Lung squamous cell carcinoma], OV[Ovarian serous cystadenocarcinoma ], PAAD[Pancreatic adenocarcinoma], PRAD[Prostate adenocarcinoma], SKCM[Skin Cutaneous Melanoma], STAD[Stomach adenocarcinoma], THCA[Thyroid carcinoma], UCEC[Uterine Corpus Endometrial Carcinoma] |
| Top |
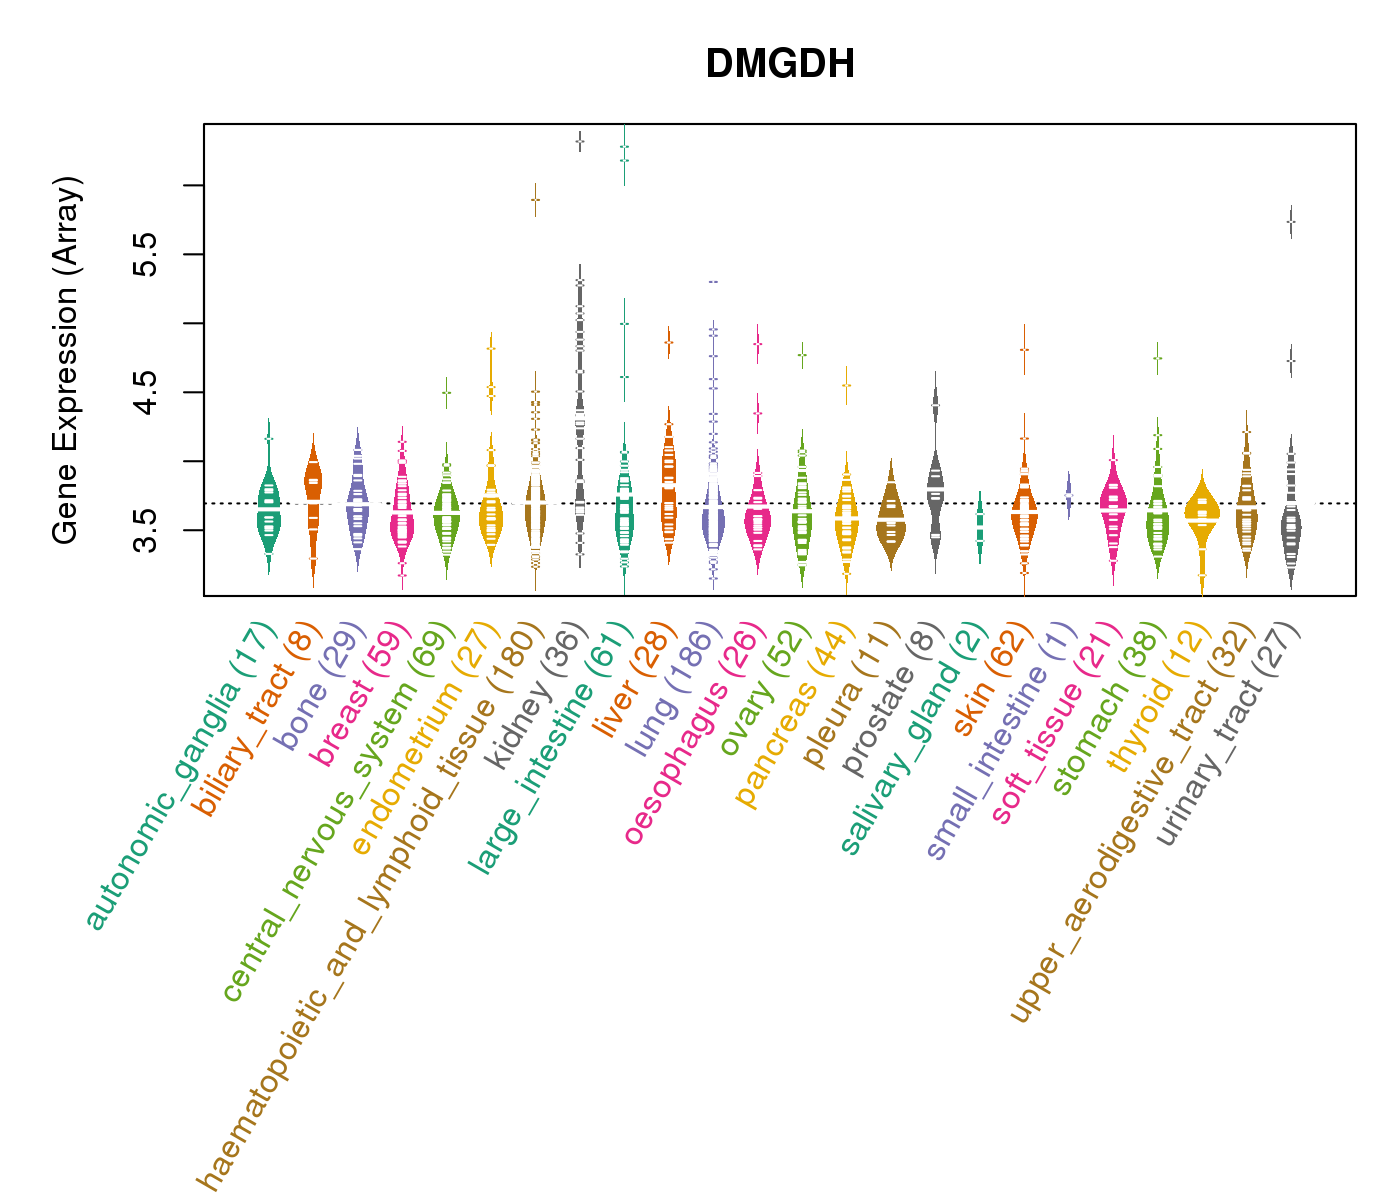
| Gene Expression for DMGDH |
| * CCLE gene expression data were extracted from CCLE_Expression_Entrez_2012-10-18.res: Gene-centric RMA-normalized mRNA expression data. |
 |
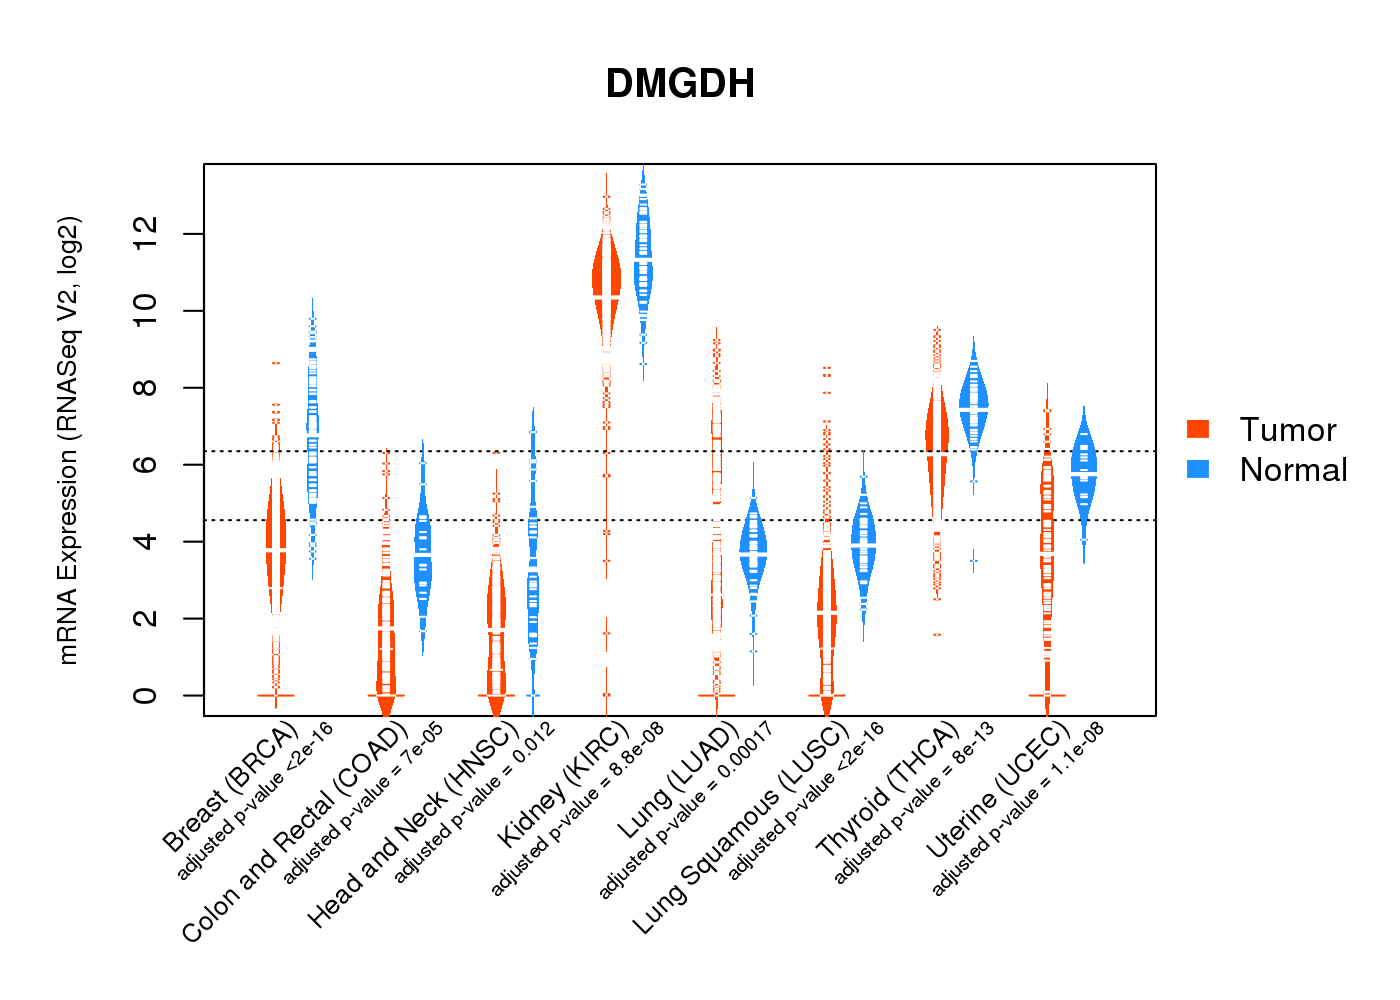
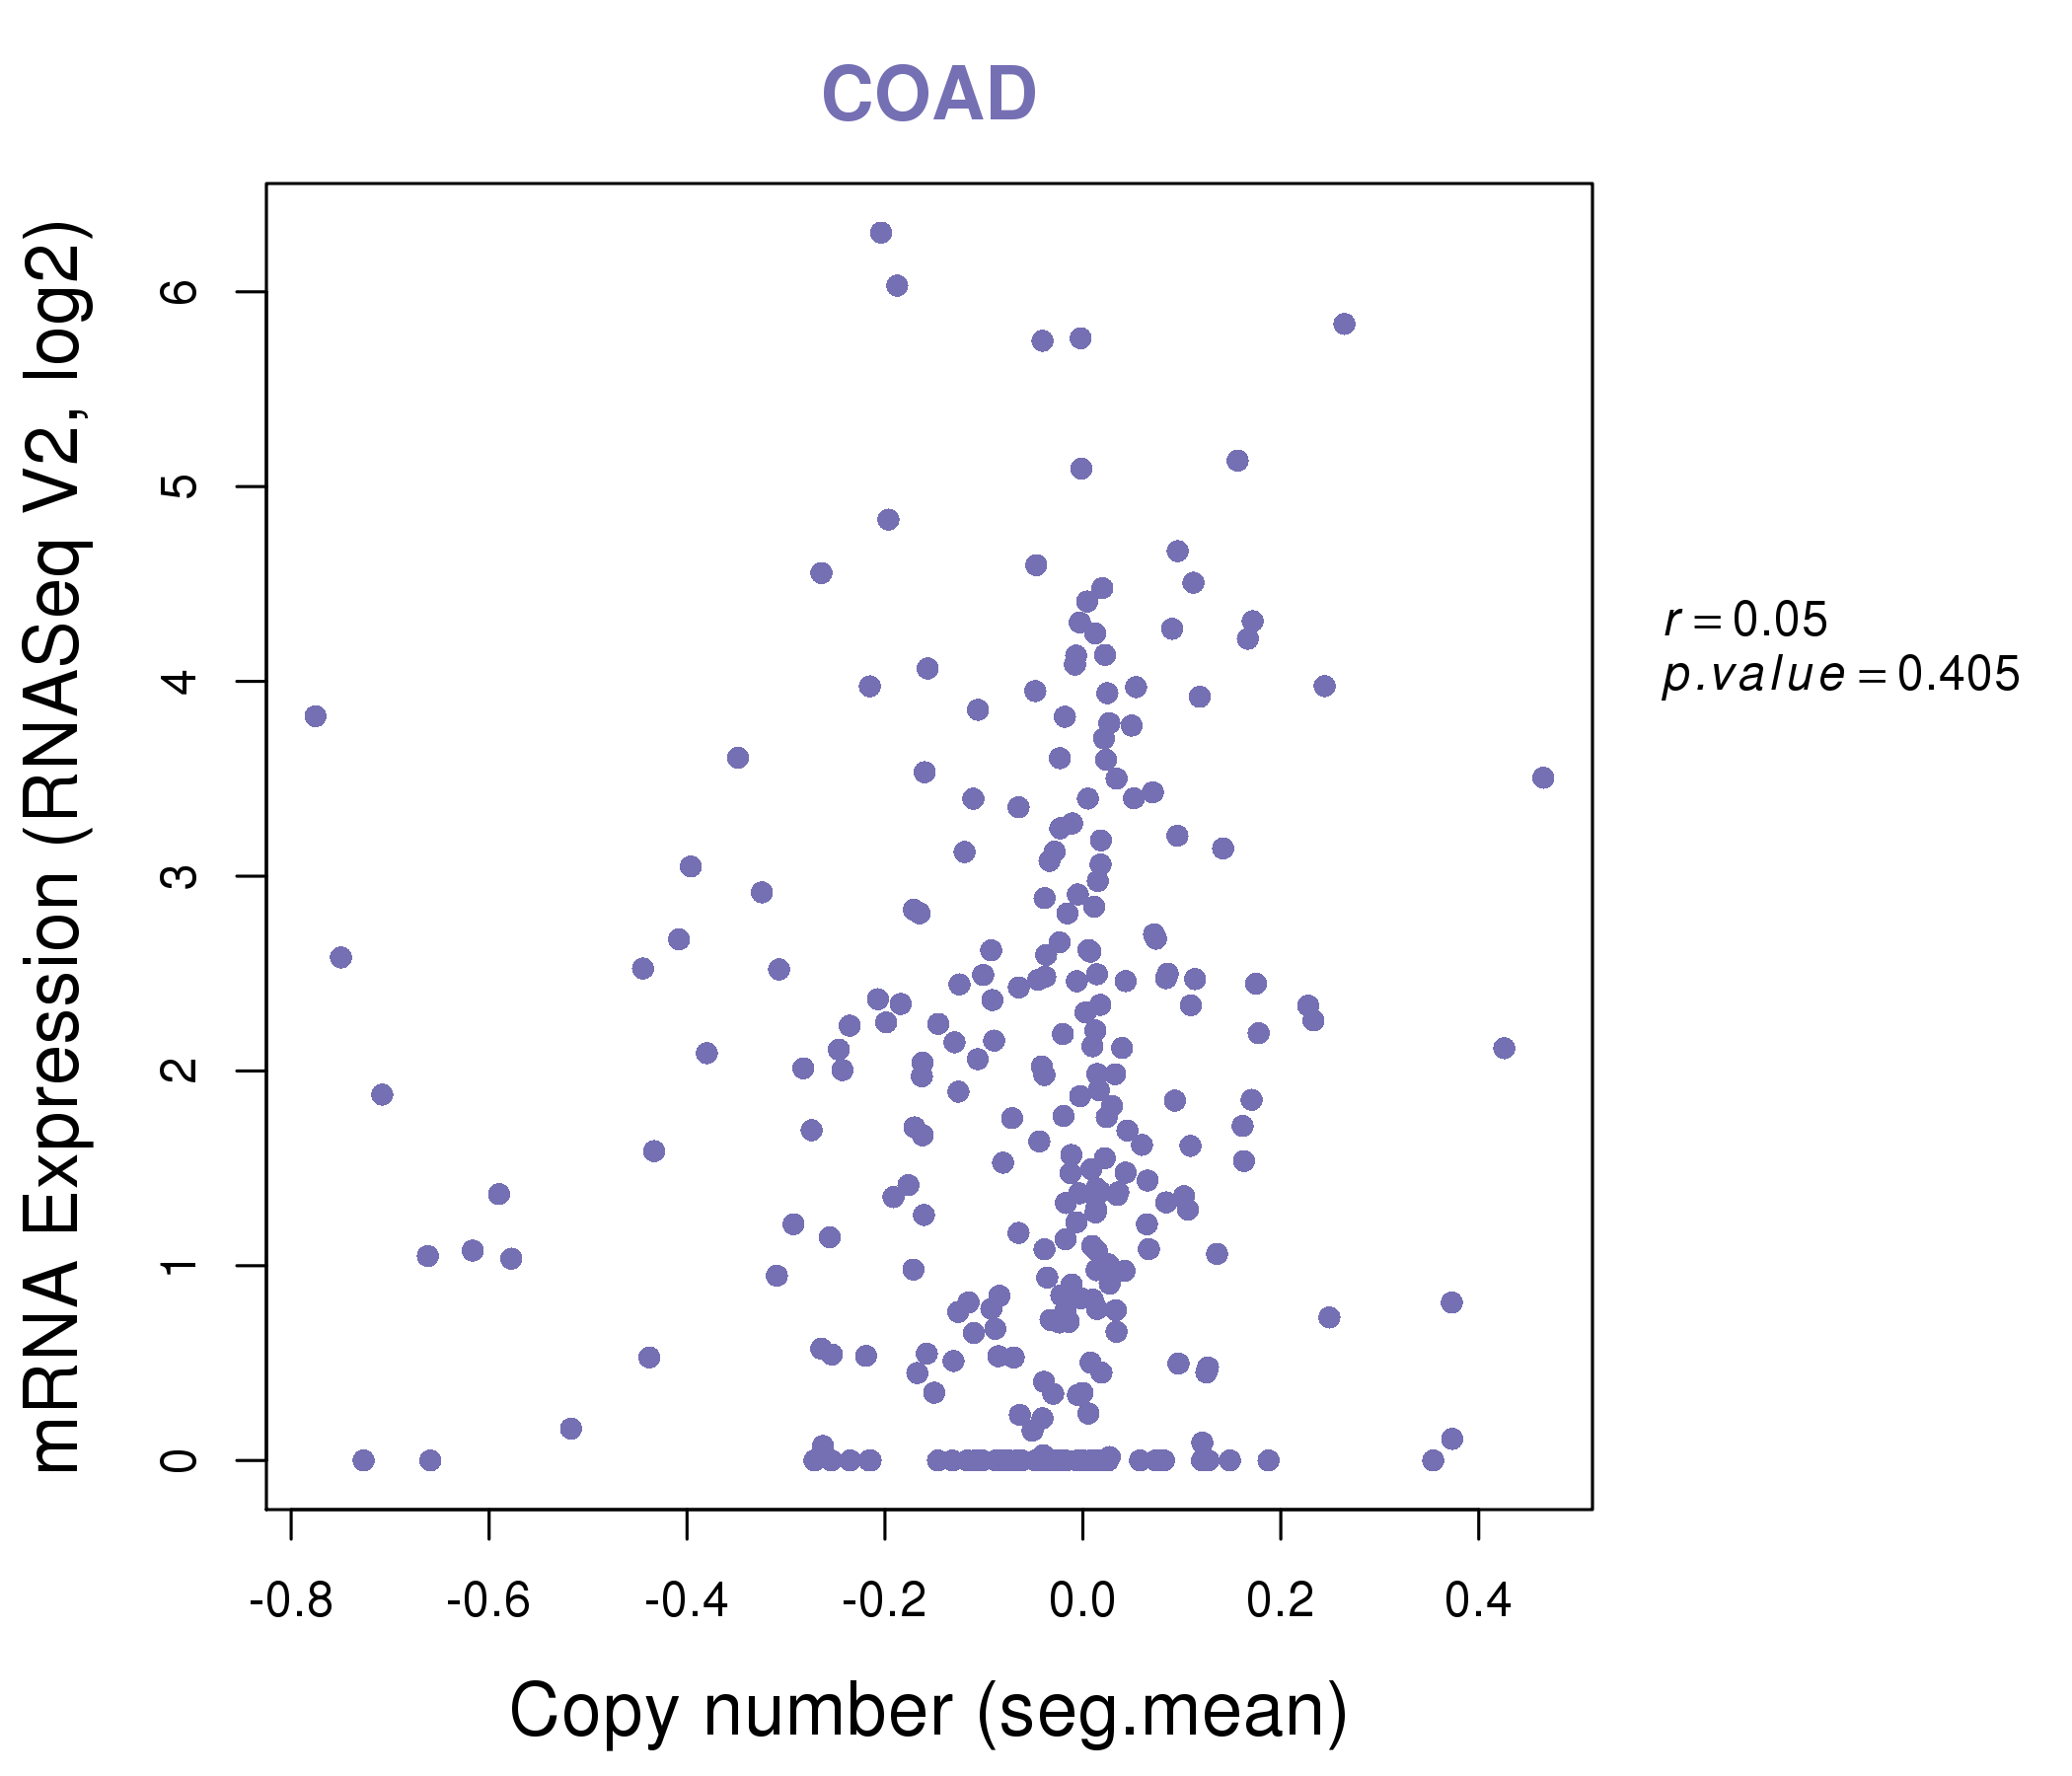
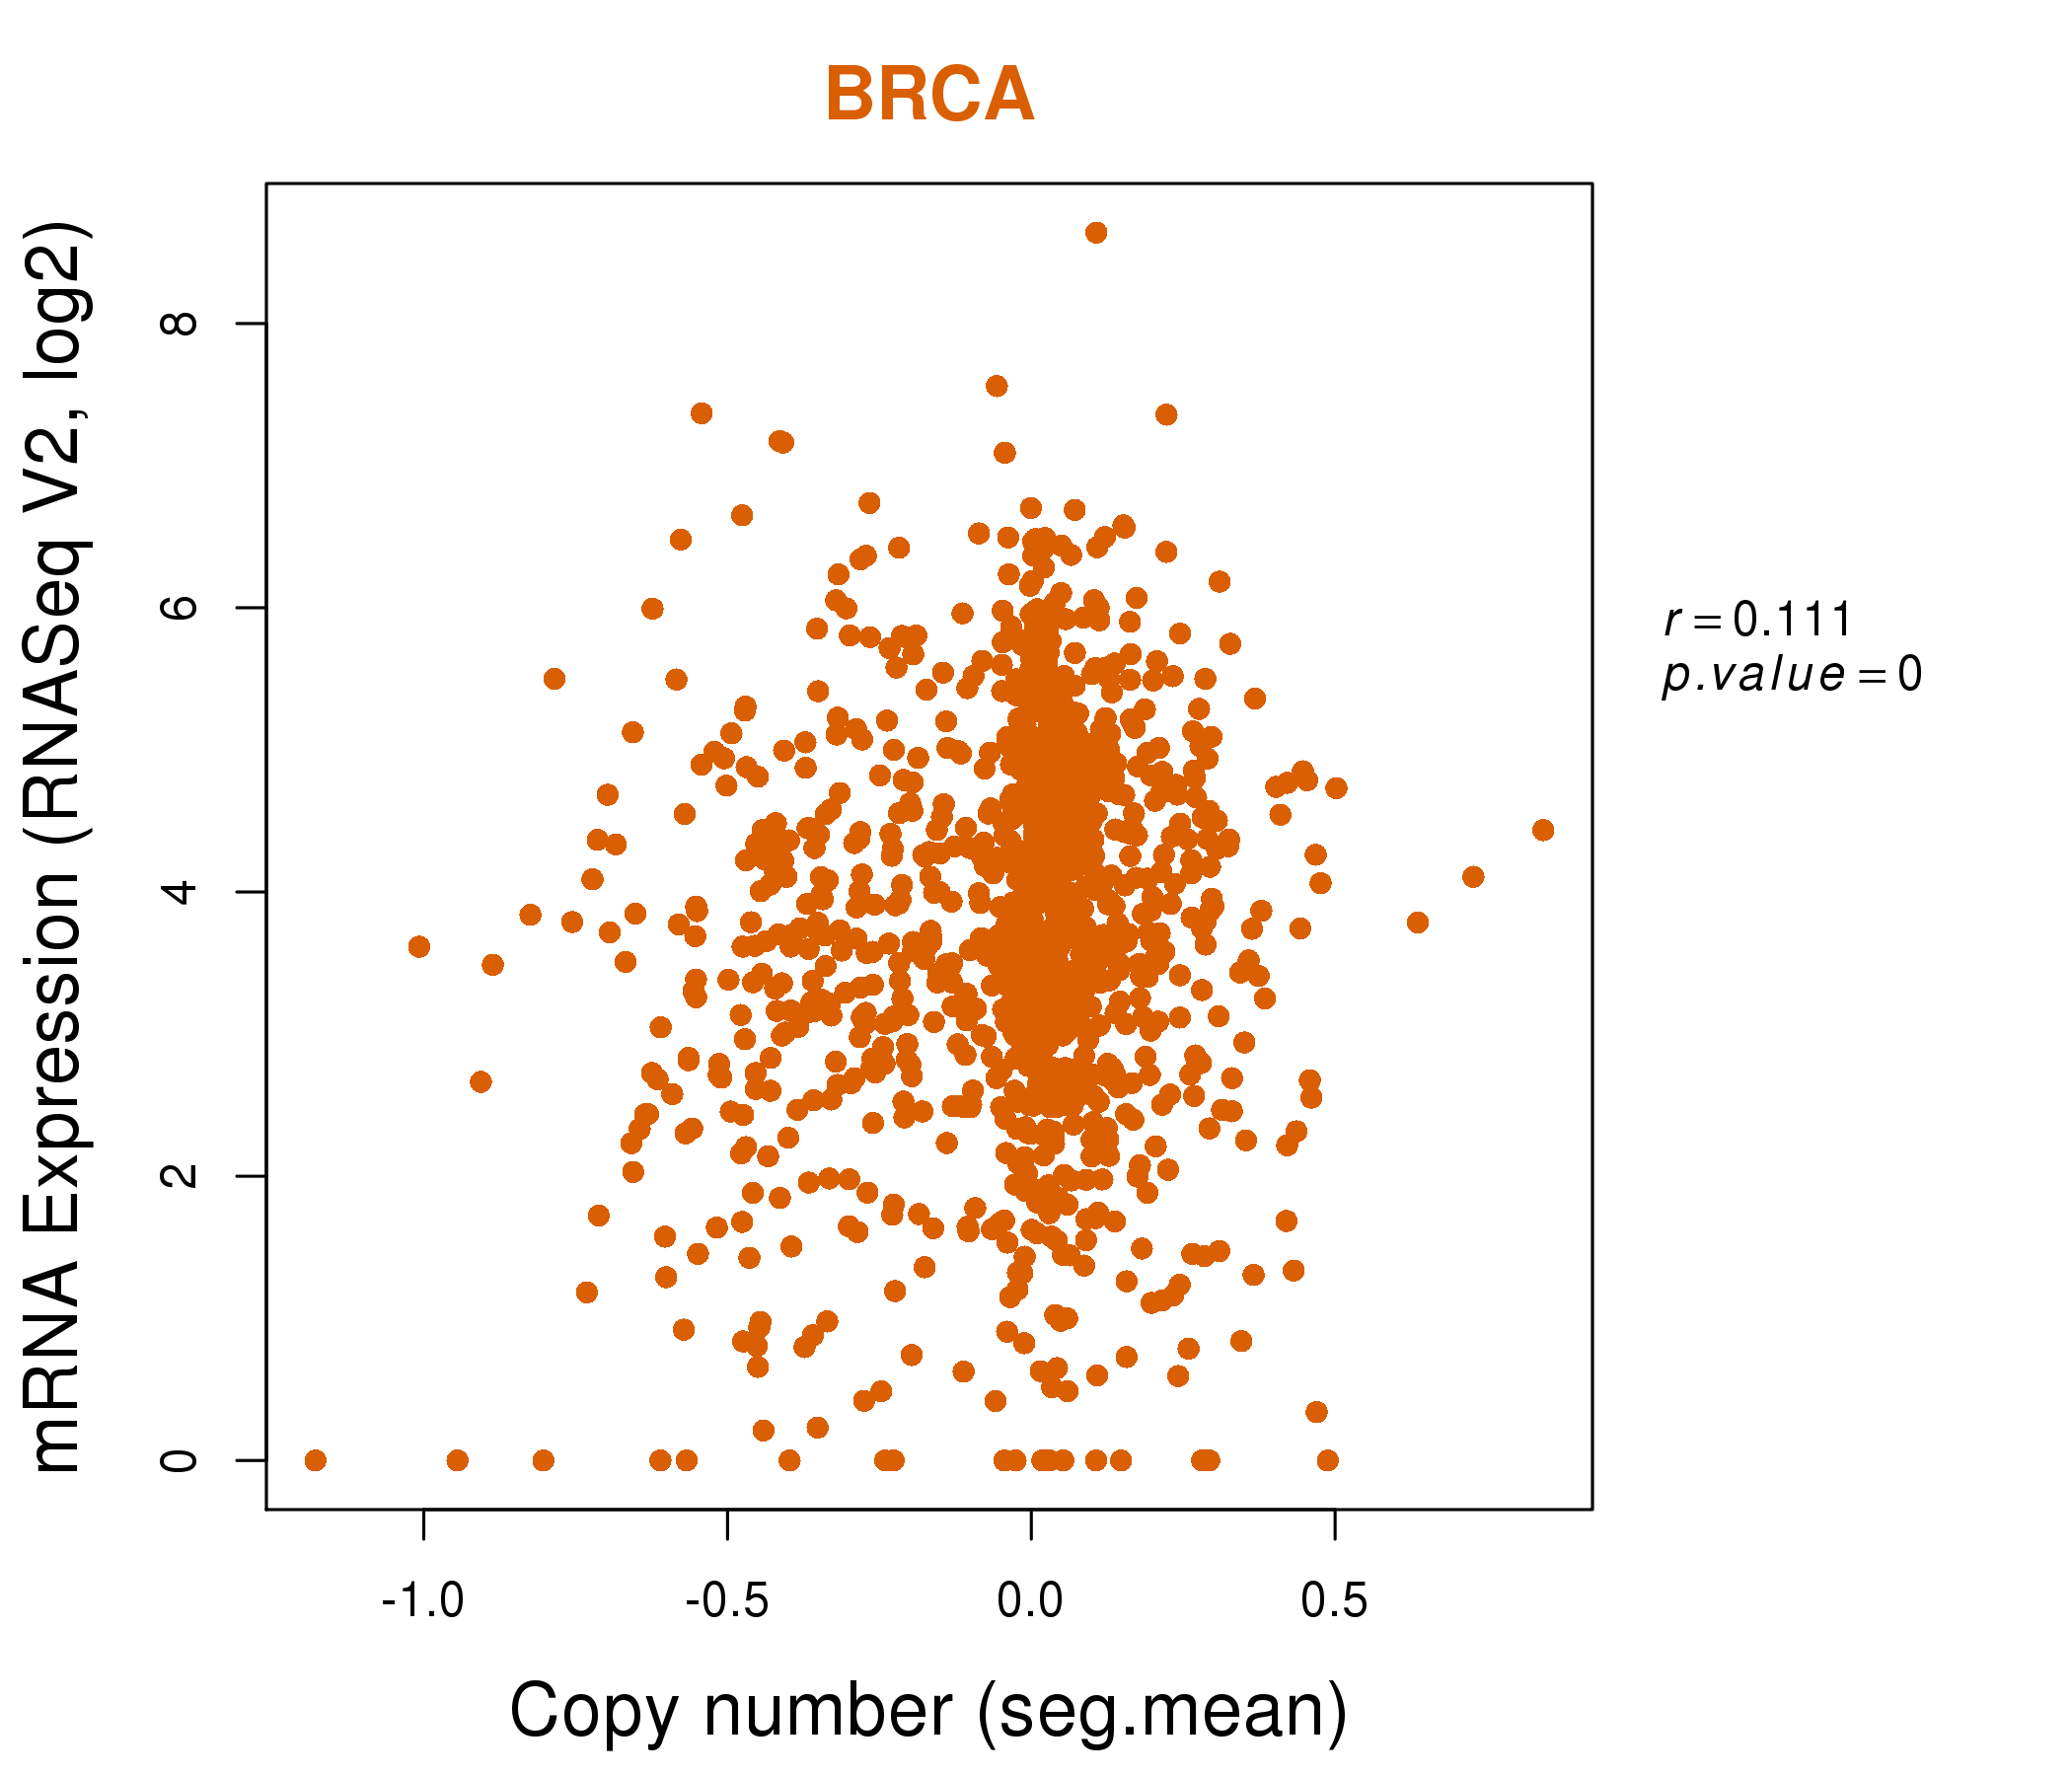
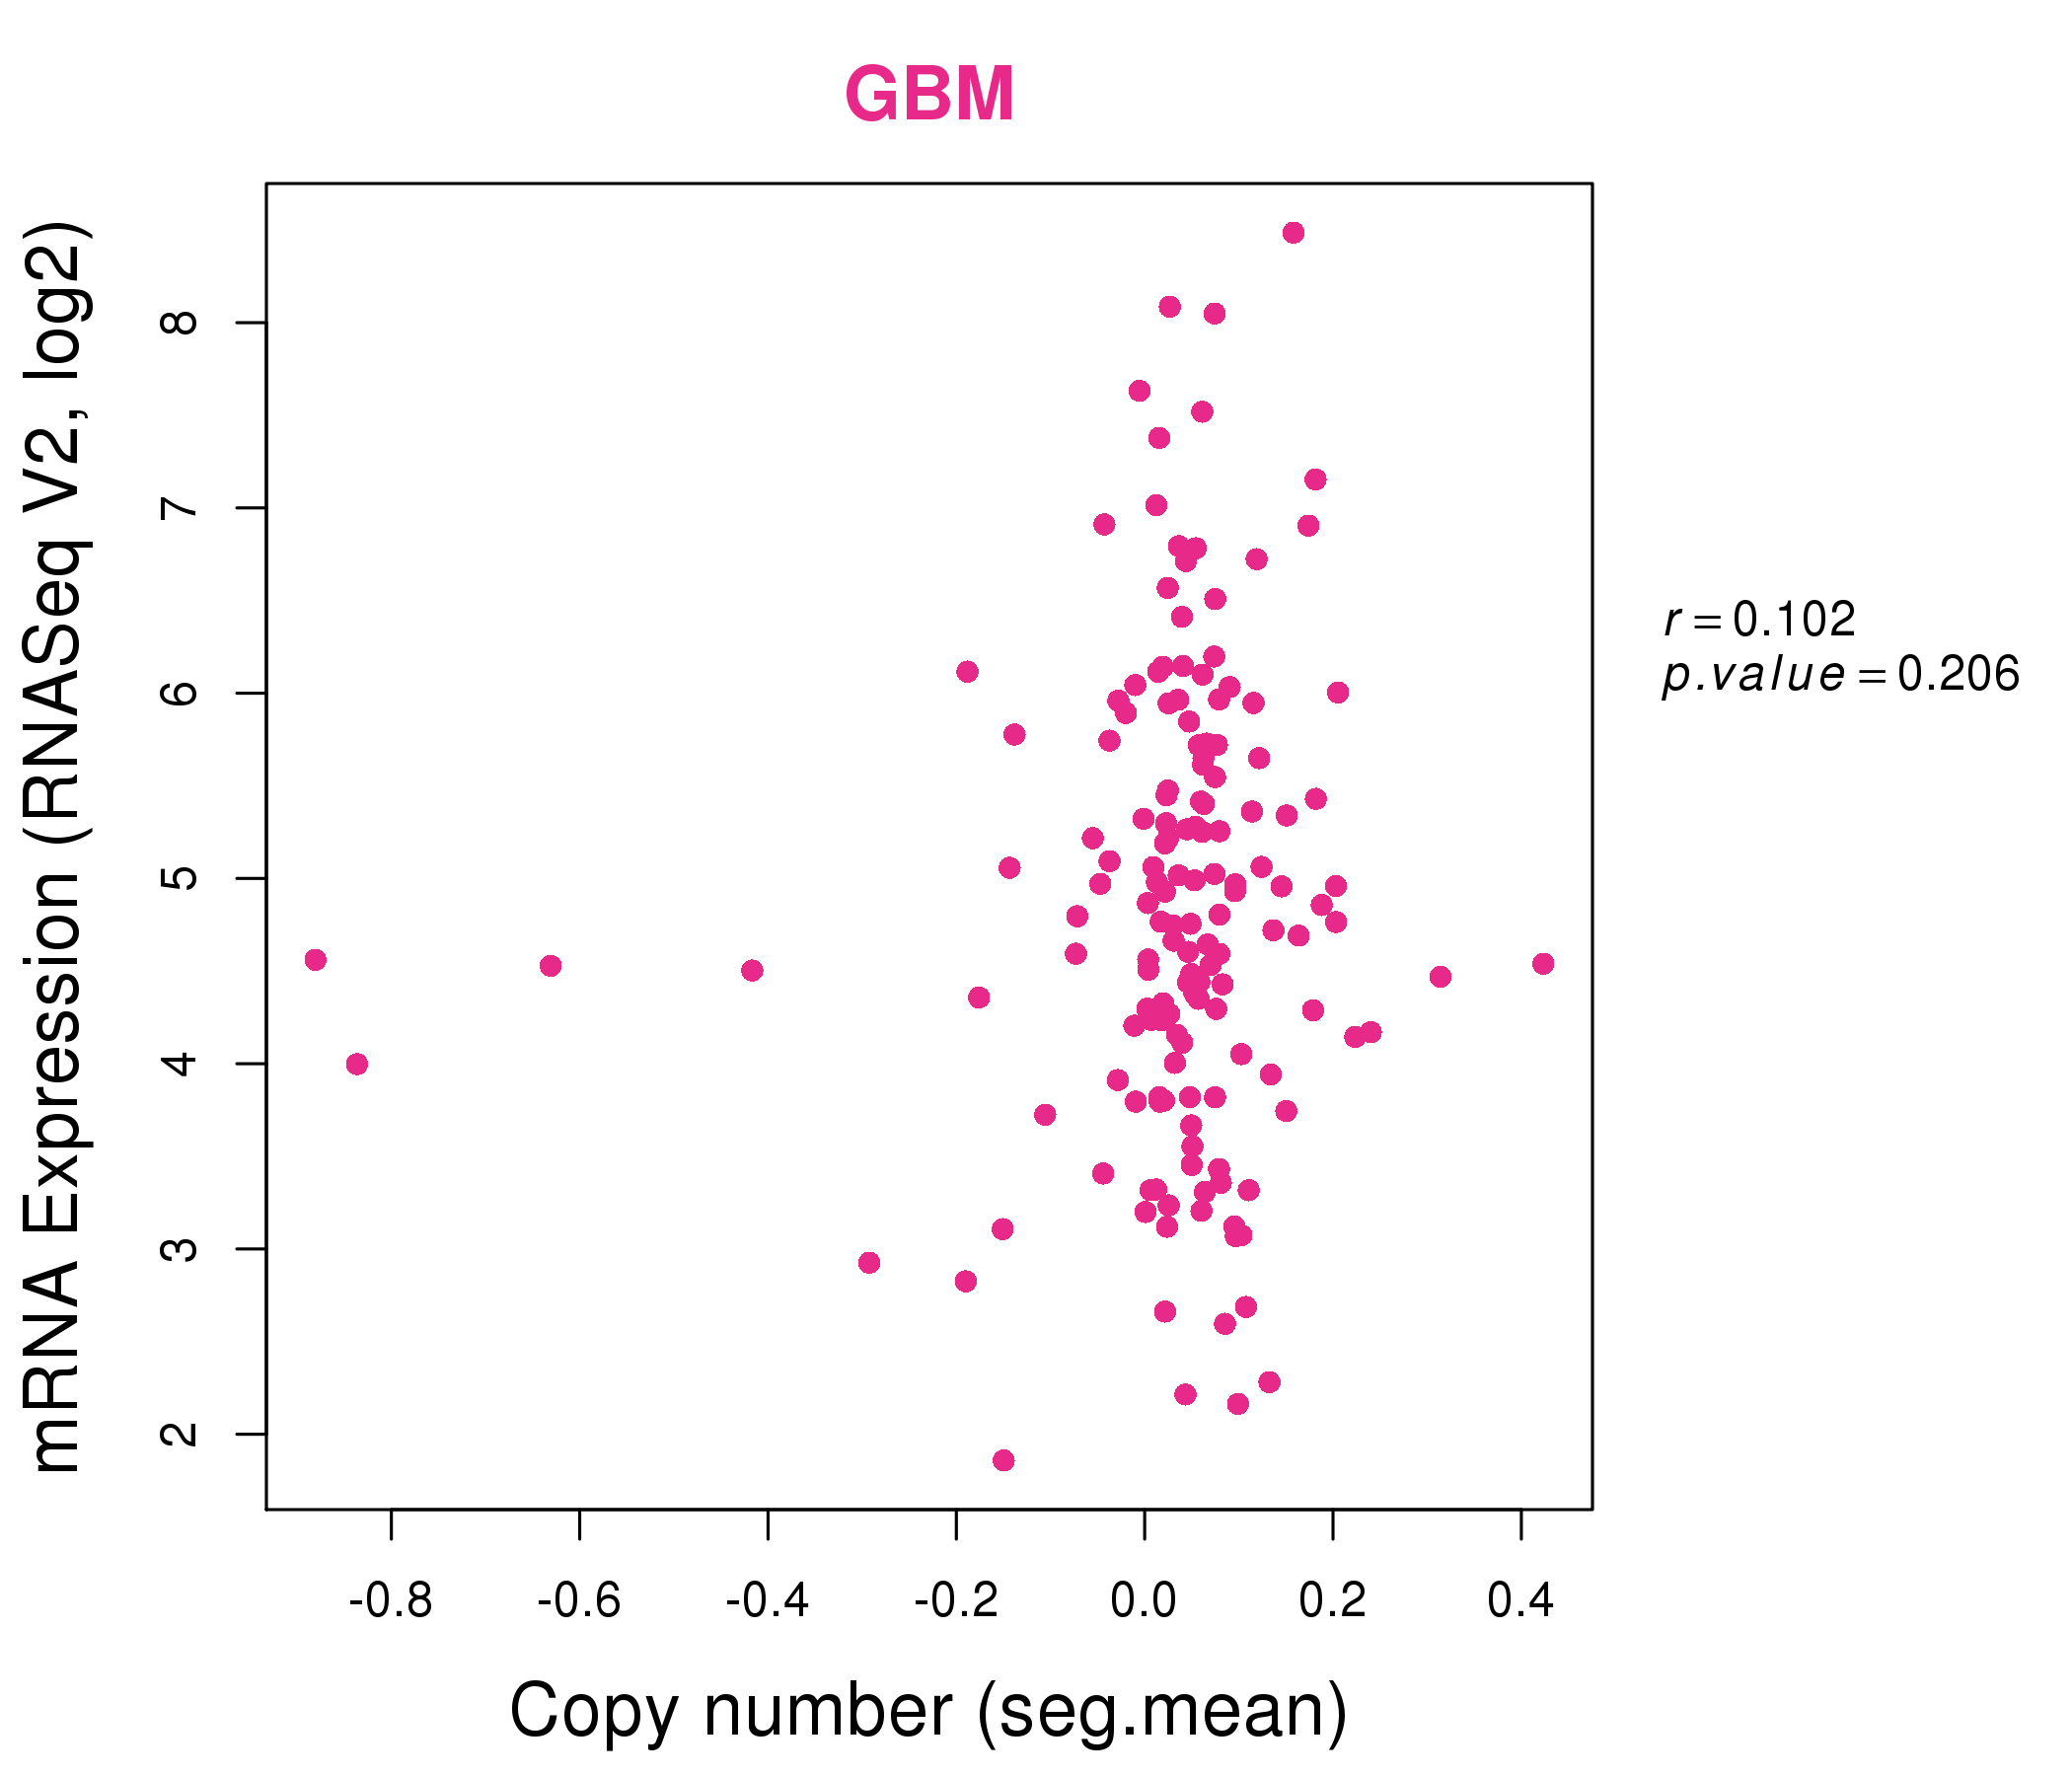
| * Normalized gene expression data of RNASeqV2 was extracted from TCGA using R package TCGA-Assembler. The URLs of all public data files on TCGA DCC data server were gathered at Jan-05-2015. Only eight cancer types have enough normal control samples for differential expression analysis. (t test, adjusted p<0.05 (using Benjamini-Hochberg FDR)) |
 |
| Top |
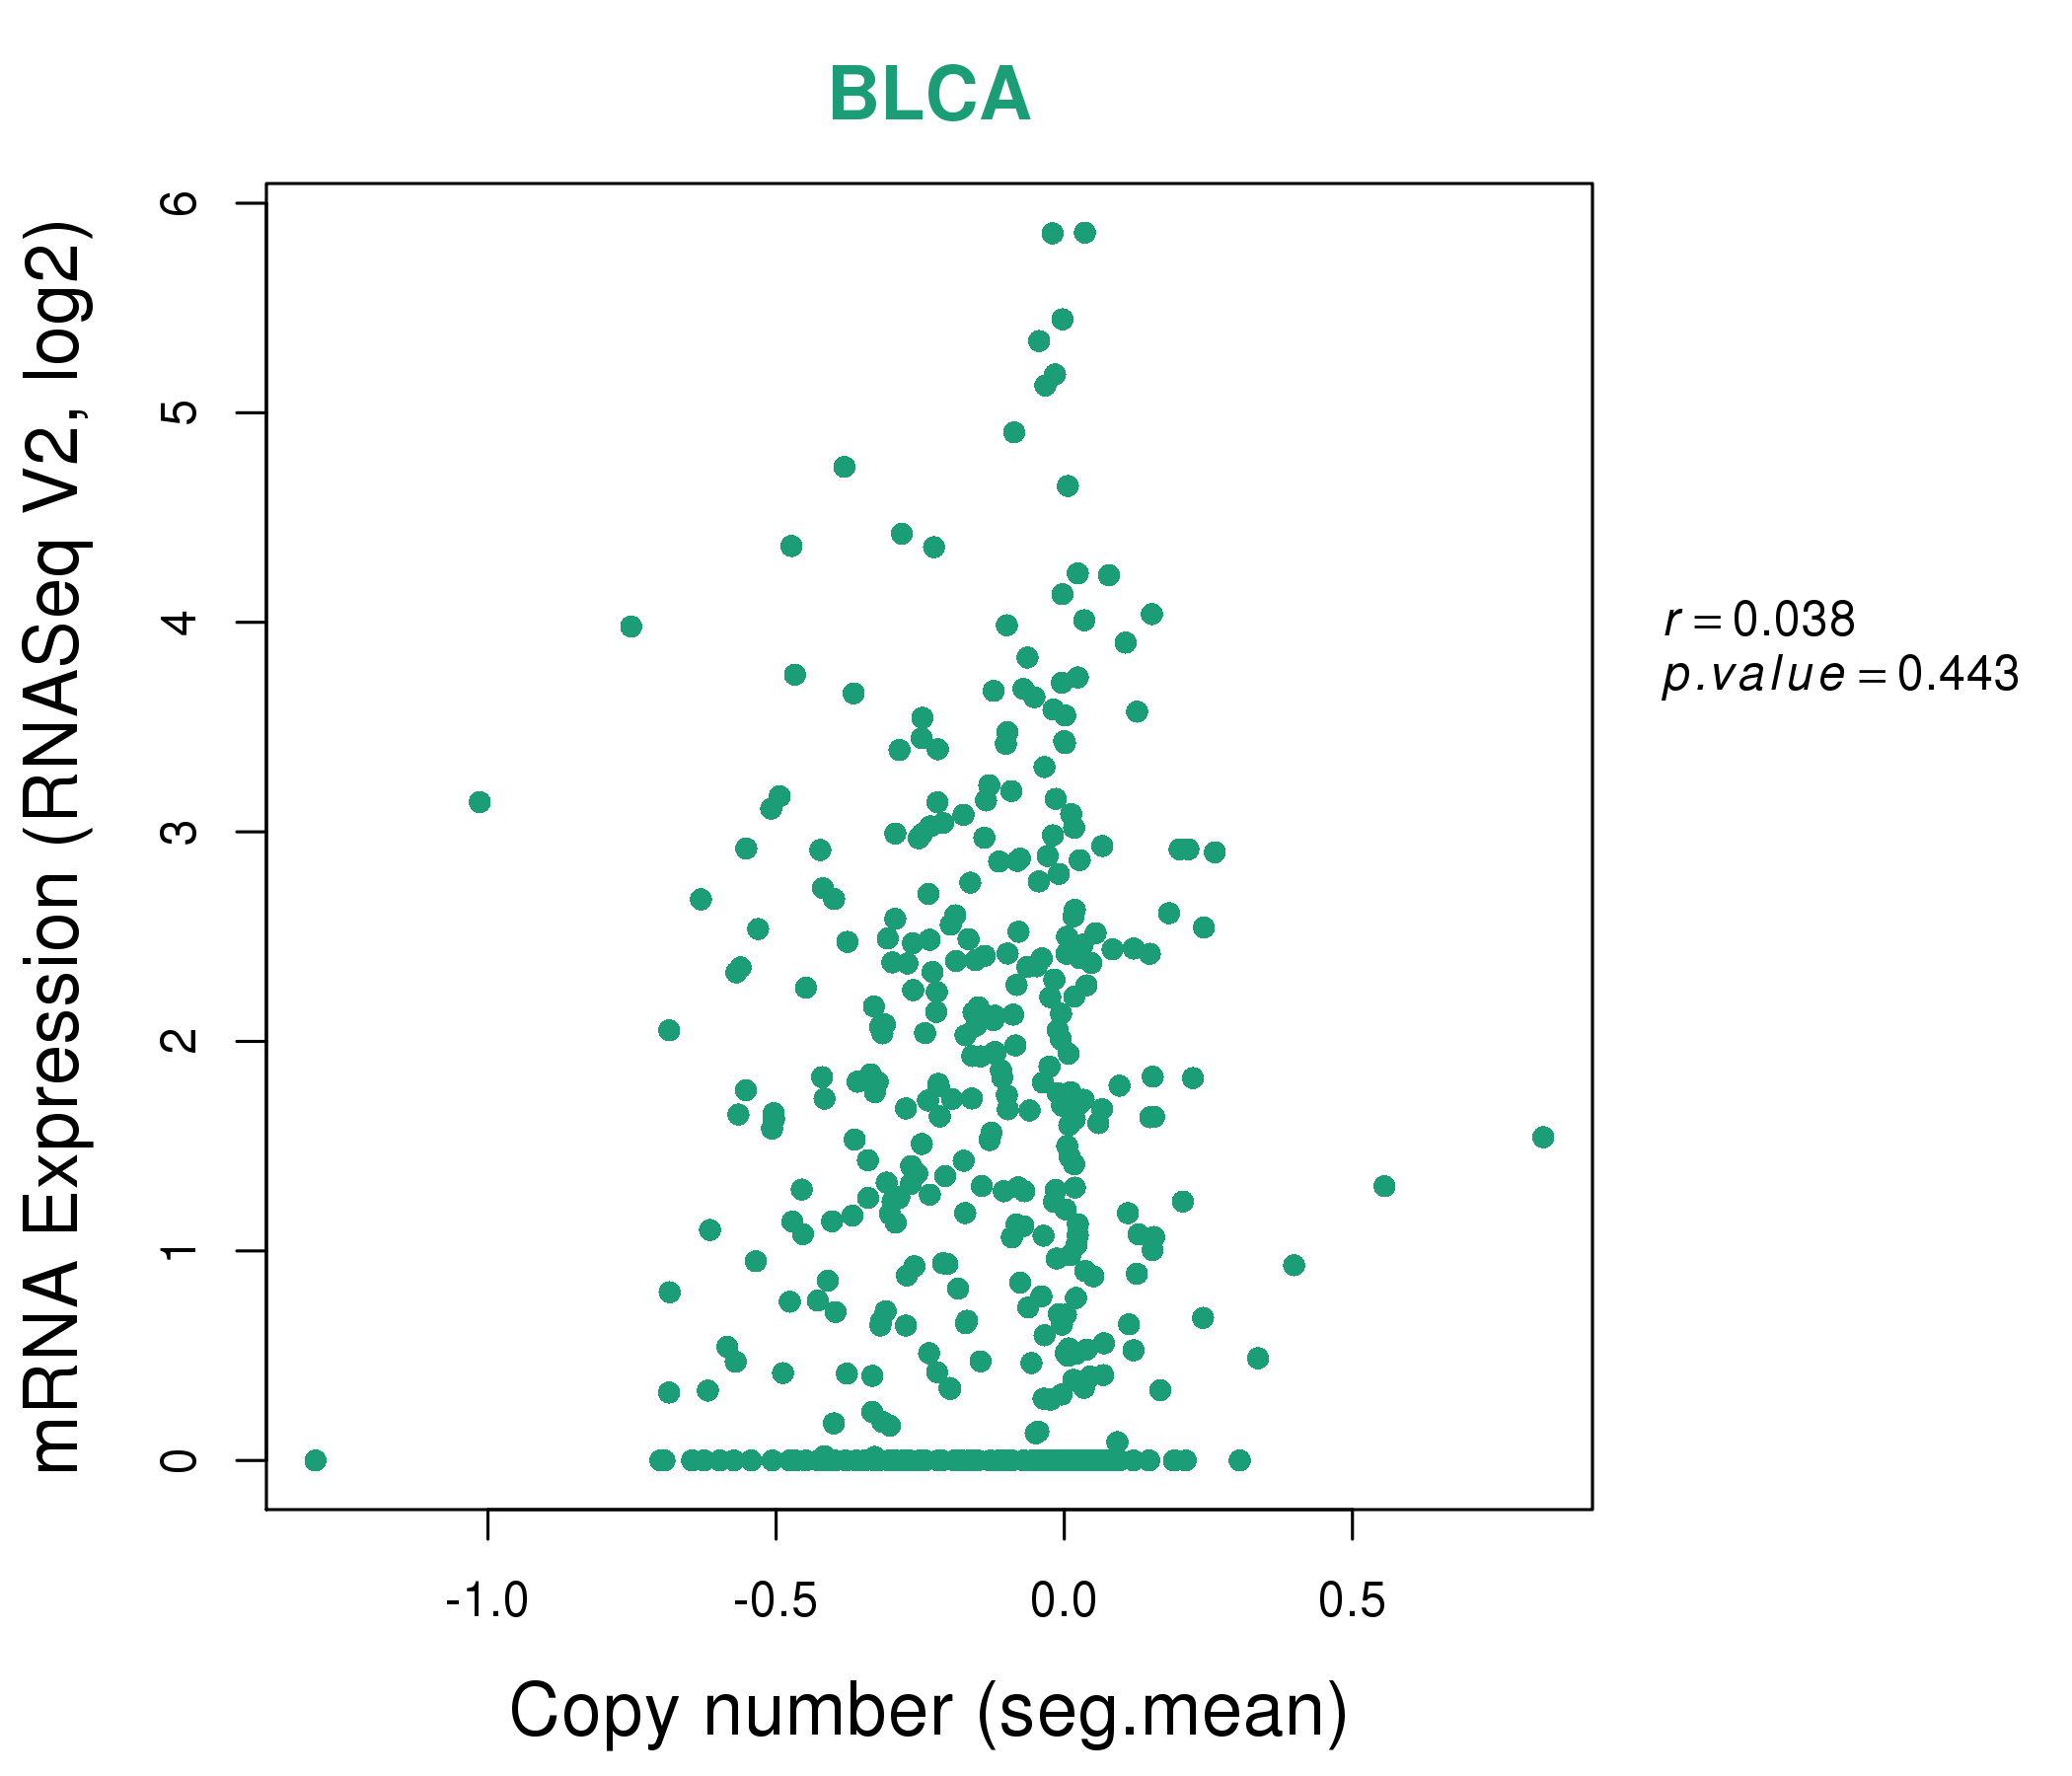
| * This plots show the correlation between CNV and gene expression. |
: Open all plots for all cancer types
 |
|
 |
|
| Top |
| Gene-Gene Network Information |
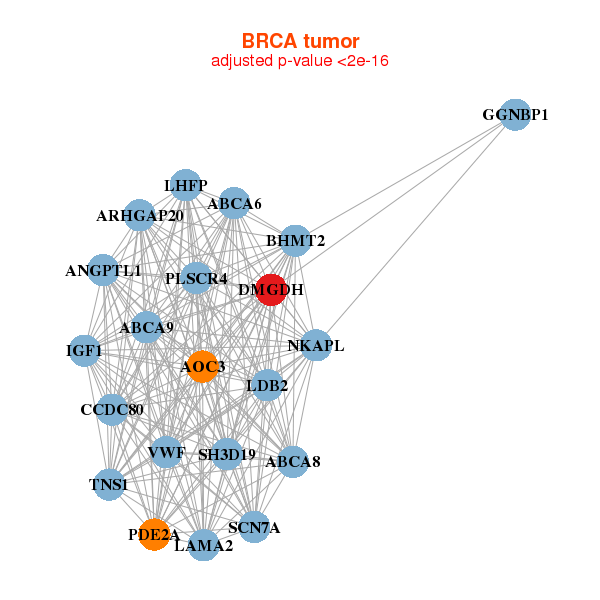
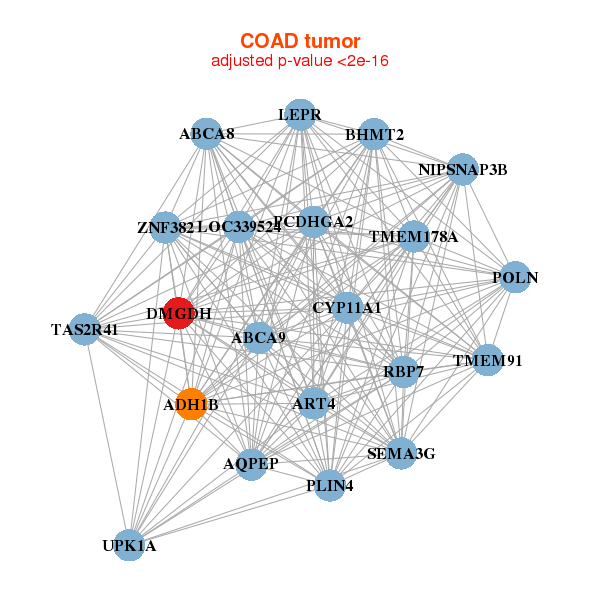
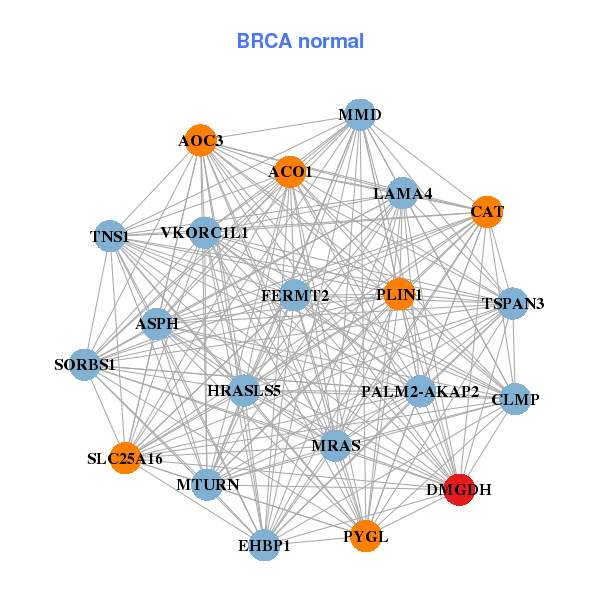
| * Co-Expression network figures were drawn using R package igraph. Only the top 20 genes with the highest correlations were shown. Red circle: input gene, orange circle: cell metabolism gene, sky circle: other gene |
: Open all plots for all cancer types
 |
|
| ABCA6,ABCA8,ABCA9,ANGPTL1,AOC3,ARHGAP20,BHMT2, CCDC80,DMGDH,GGNBP1,IGF1,LAMA2,LDB2,LHFP, NKAPL,PDE2A,PLSCR4,SCN7A,SH3D19,TNS1,VWF | ACO1,AOC3,CLMP,ASPH,MTURN,CAT,DMGDH, EHBP1,FERMT2,HRASLS5,LAMA4,MMD,MRAS,PALM2-AKAP2, PLIN1,PYGL,SLC25A16,SORBS1,TNS1,TSPAN3,VKORC1L1 |
 |
|
| ABCA8,ABCA9,ADH1B,AQPEP,ART4,BHMT2,CYP11A1, DMGDH,LEPR,LOC339524,NIPSNAP3B,PCDHGA2,PLIN4,POLN, RBP7,SEMA3G,TAS2R41,TMEM178A,TMEM91,UPK1A,ZNF382 | AGTR1,ANGPTL1,ARMCX1,DDIT4L,DIXDC1,DMGDH,DZIP1, GLRB,HLF,HRASLS5,LOC285548,NKX3-2,NNAT,NOX4, PGM5,RGS4,RHOJ,SCD5,SOX15,SSBP2,TMEM35 |
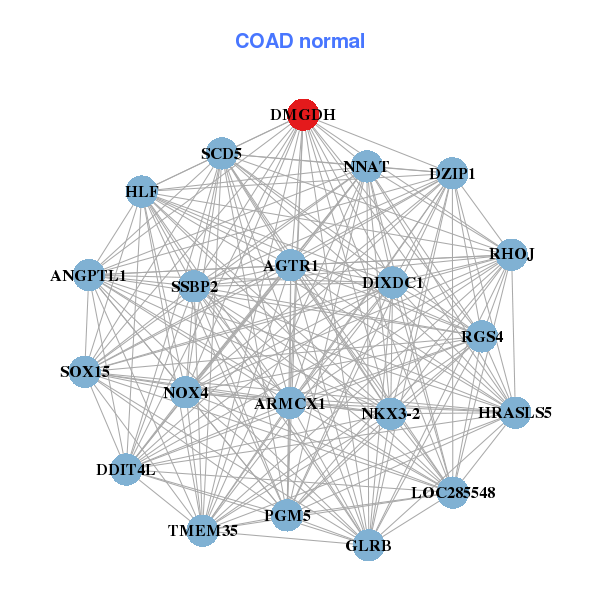
| * Co-Expression network figures were drawn using R package igraph. Only the top 20 genes with the highest correlations were shown. Red circle: input gene, orange circle: cell metabolism gene, sky circle: other gene |
: Open all plots for all cancer types
| Top |
: Open all interacting genes' information including KEGG pathway for all interacting genes from DAVID
| Top |
| Pharmacological Information for DMGDH |
| There's no related Drug. |
| Top |
| Cross referenced IDs for DMGDH |
| * We obtained these cross-references from Uniprot database. It covers 150 different DBs, 18 categories. http://www.uniprot.org/help/cross_references_section |
: Open all cross reference information
|
Copyright © 2016-Present - The Univsersity of Texas Health Science Center at Houston @ |