|
||||||||||||||||||||
| |
| Phenotypic Information (metabolism pathway, cancer, disease, phenome) |
| |
| |
| Gene-Gene Network Information: Co-Expression Network, Interacting Genes & KEGG |
| |
|


| Gene Summary for PSAT1 |
| Top |
| Phenotypic Information for PSAT1(metabolism pathway, cancer, disease, phenome) |
| Cancer | CGAP: PSAT1 |
| Familial Cancer Database: PSAT1 | |
| * This gene is included in those cancer gene databases. |
|
|
|
|
|
| . | ||||||||||||||
Oncogene 1 | Significant driver gene in | |||||||||||||||||||
| cf) number; DB name 1 Oncogene; http://nar.oxfordjournals.org/content/35/suppl_1/D721.long, 2 Tumor Suppressor gene; https://bioinfo.uth.edu/TSGene/, 3 Cancer Gene Census; http://www.nature.com/nrc/journal/v4/n3/abs/nrc1299.html, 4 CancerGenes; http://nar.oxfordjournals.org/content/35/suppl_1/D721.long, 5 Network of Cancer Gene; http://ncg.kcl.ac.uk/index.php, 1Therapeutic Vulnerabilities in Cancer; http://cbio.mskcc.org/cancergenomics/statius/ |
| KEGG_GLYCINE_SERINE_AND_THREONINE_METABOLISM REACTOME_METABOLISM_OF_AMINO_ACIDS_AND_DERIVATIVES | |
| OMIM | |
| Orphanet | |
| Disease | KEGG Disease: PSAT1 |
| MedGen: PSAT1 (Human Medical Genetics with Condition) | |
| ClinVar: PSAT1 | |
| Phenotype | MGI: PSAT1 (International Mouse Phenotyping Consortium) |
| PhenomicDB: PSAT1 | |
| Mutations for PSAT1 |
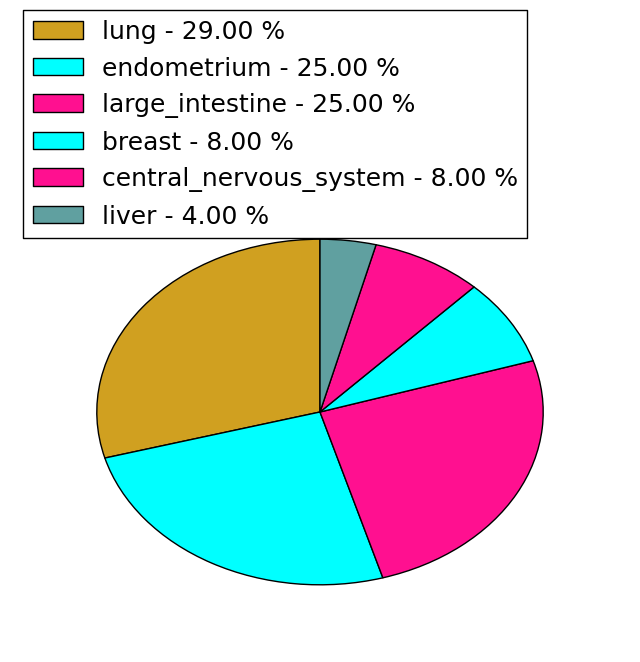
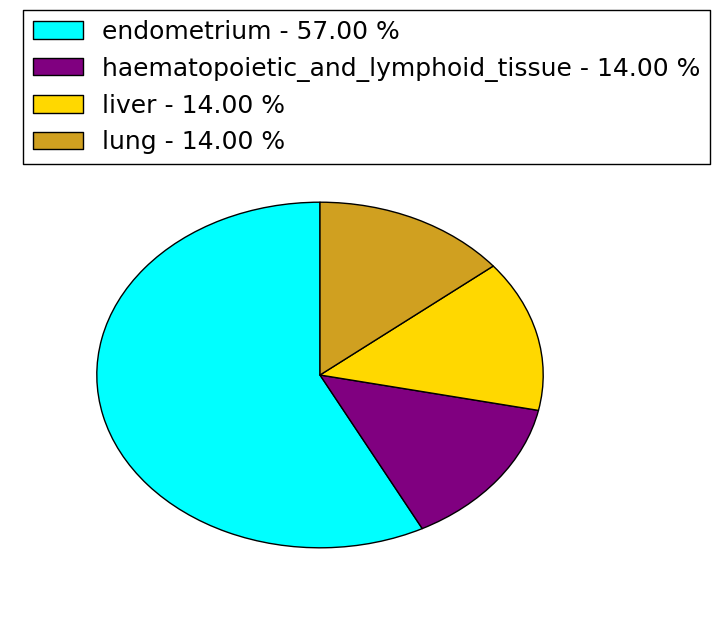
| * Under tables are showing count per each tissue to give us broad intuition about tissue specific mutation patterns.You can go to the detailed page for each mutation database's web site. |
| - Statistics for Tissue and Mutation type | Top |
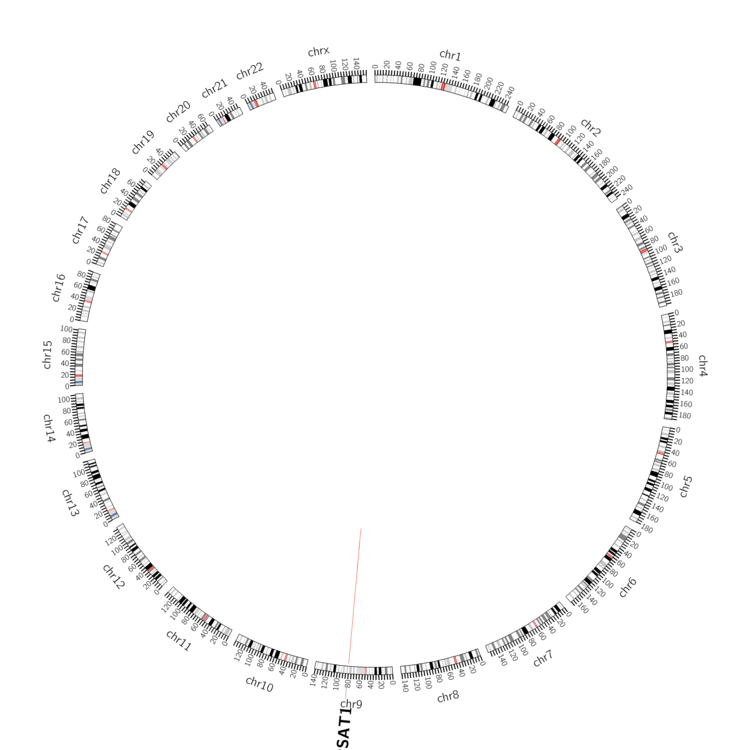 |
| - For Inter-chromosomal Variations |
| There's no inter-chromosomal structural variation. |
| - For Intra-chromosomal Variations |
| * Intra-chromosomal variantions includes 'intrachromosomal amplicon to amplicon', 'intrachromosomal amplicon to non-amplified dna', 'intrachromosomal deletion', 'intrachromosomal fold-back inversion', 'intrachromosomal inversion', 'intrachromosomal tandem duplication', 'Intrachromosomal unknown type', 'intrachromosomal with inverted orientation', 'intrachromosomal with non-inverted orientation'. |
 |
| Sample | Symbol_a | Chr_a | Start_a | End_a | Symbol_b | Chr_b | Start_b | End_b |
| ovary | PSAT1 | chr9 | 80934543 | 80934563 | chr9 | 80883448 | 80883468 | |
| ovary | PSAT1 | chr9 | 80937309 | 80937329 | chr9 | 80841409 | 80841429 |
| cf) Tissue number; Tissue name (1;Breast, 2;Central_nervous_system, 3;Haematopoietic_and_lymphoid_tissue, 4;Large_intestine, 5;Liver, 6;Lung, 7;Ovary, 8;Pancreas, 9;Prostate, 10;Skin, 11;Soft_tissue, 12;Upper_aerodigestive_tract) |
| * From mRNA Sanger sequences, Chitars2.0 arranged chimeric transcripts. This table shows PSAT1 related fusion information. |
| ID | Head Gene | Tail Gene | Accession | Gene_a | qStart_a | qEnd_a | Chromosome_a | tStart_a | tEnd_a | Gene_a | qStart_a | qEnd_a | Chromosome_a | tStart_a | tEnd_a |
| BF989450 | CPNE4 | 3 | 310 | 3 | 131966378 | 131966685 | PSAT1 | 305 | 400 | 9 | 80944226 | 80944321 | |
| AA328351 | ANKIB1 | 110 | 149 | 7 | 91887097 | 91887137 | PSAT1 | 142 | 317 | 9 | 80938475 | 80938650 | |
| BC001618 | PSAT1 | 1 | 2178 | 9 | 80912074 | 80945011 | SLC1A4 | 2165 | 3716 | 2 | 65249448 | 65250999 | |
| Top |
| There's no copy number variation information in COSMIC data for this gene. |
| Top |
|
 |
| Top |
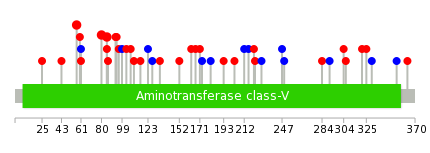
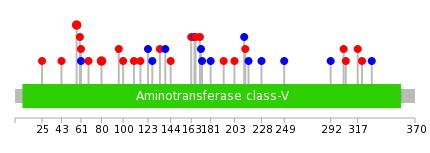
| Stat. for Non-Synonymous SNVs (# total SNVs=24) | (# total SNVs=7) |
 |  |
(# total SNVs=1) | (# total SNVs=1) |
 |  |
| Top |
| * When you move the cursor on each content, you can see more deailed mutation information on the Tooltip. Those are primary_site,primary_histology,mutation(aa),pubmedID. |
| GRCh37 position | Mutation(aa) | Unique sampleID count |
| chr9:80919698-80919698 | p.C80Y | 2 |
| chr9:80919712-80919712 | p.A85P | 2 |
| chr9:80916919-80916919 | p.E57D | 2 |
| chr9:80921343-80921343 | p.A171T | 1 |
| chr9:80919676-80919677 | p.L75fs*26 | 1 |
| chr9:80932598-80932598 | p.Y249Y | 1 |
| chr9:80919787-80919787 | p.K110Q | 1 |
| chr9:80943978-80943978 | p.K363N | 1 |
| chr9:80921351-80921351 | p.L173L | 1 |
| chr9:80932701-80932701 | p.N284Y | 1 |
| Top |
|
 |
| Point Mutation/ Tissue ID | 1 | 2 | 3 | 4 | 5 | 6 | 7 | 8 | 9 | 10 | 11 | 12 | 13 | 14 | 15 | 16 | 17 | 18 | 19 | 20 |
| # sample | 5 | 1 | 1 | 5 | 2 | 7 | 3 | 1 | 8 | |||||||||||
| # mutation | 5 | 2 | 1 | 7 | 2 | 7 | 4 | 1 | 9 | |||||||||||
| nonsynonymous SNV | 5 | 2 | 1 | 4 | 2 | 2 | 3 | 1 | 5 | |||||||||||
| synonymous SNV | 3 | 5 | 1 | 4 |
| cf) Tissue ID; Tissue type (1; BLCA[Bladder Urothelial Carcinoma], 2; BRCA[Breast invasive carcinoma], 3; CESC[Cervical squamous cell carcinoma and endocervical adenocarcinoma], 4; COAD[Colon adenocarcinoma], 5; GBM[Glioblastoma multiforme], 6; Glioma Low Grade, 7; HNSC[Head and Neck squamous cell carcinoma], 8; KICH[Kidney Chromophobe], 9; KIRC[Kidney renal clear cell carcinoma], 10; KIRP[Kidney renal papillary cell carcinoma], 11; LAML[Acute Myeloid Leukemia], 12; LUAD[Lung adenocarcinoma], 13; LUSC[Lung squamous cell carcinoma], 14; OV[Ovarian serous cystadenocarcinoma ], 15; PAAD[Pancreatic adenocarcinoma], 16; PRAD[Prostate adenocarcinoma], 17; SKCM[Skin Cutaneous Melanoma], 18:STAD[Stomach adenocarcinoma], 19:THCA[Thyroid carcinoma], 20:UCEC[Uterine Corpus Endometrial Carcinoma]) |
| Top |
| * We represented just top 10 SNVs. When you move the cursor on each content, you can see more deailed mutation information on the Tooltip. Those are primary_site, primary_histology, mutation(aa), pubmedID. |
| Genomic Position | Mutation(aa) | Unique sampleID count |
| chr9:80919698 | p.E57D,PSAT1 | 2 |
| chr9:80916919 | p.C80Y,PSAT1 | 2 |
| chr9:80923405 | p.D100Y,PSAT1 | 1 |
| chr9:80921330 | p.G203S,PSAT1 | 1 |
| chr9:80923441 | p.K110Q,PSAT1 | 1 |
| chr9:80919745 | p.V212V,PSAT1 | 1 |
| chr9:80921331 | p.K116E,PSAT1 | 1 |
| chr9:80932598 | p.R213H,PSAT1 | 1 |
| chr9:80919757 | p.I123I,PSAT1 | 1 |
| chr9:80921343 | p.L216L,PSAT1 | 1 |
| * Copy number data were extracted from TCGA using R package TCGA-Assembler. The URLs of all public data files on TCGA DCC data server were gathered on Jan-05-2015. Function ProcessCNAData in TCGA-Assembler package was used to obtain gene-level copy number value which is calculated as the average copy number of the genomic region of a gene. |
 |
| cf) Tissue ID[Tissue type]: BLCA[Bladder Urothelial Carcinoma], BRCA[Breast invasive carcinoma], CESC[Cervical squamous cell carcinoma and endocervical adenocarcinoma], COAD[Colon adenocarcinoma], GBM[Glioblastoma multiforme], Glioma Low Grade, HNSC[Head and Neck squamous cell carcinoma], KICH[Kidney Chromophobe], KIRC[Kidney renal clear cell carcinoma], KIRP[Kidney renal papillary cell carcinoma], LAML[Acute Myeloid Leukemia], LUAD[Lung adenocarcinoma], LUSC[Lung squamous cell carcinoma], OV[Ovarian serous cystadenocarcinoma ], PAAD[Pancreatic adenocarcinoma], PRAD[Prostate adenocarcinoma], SKCM[Skin Cutaneous Melanoma], STAD[Stomach adenocarcinoma], THCA[Thyroid carcinoma], UCEC[Uterine Corpus Endometrial Carcinoma] |
| Top |
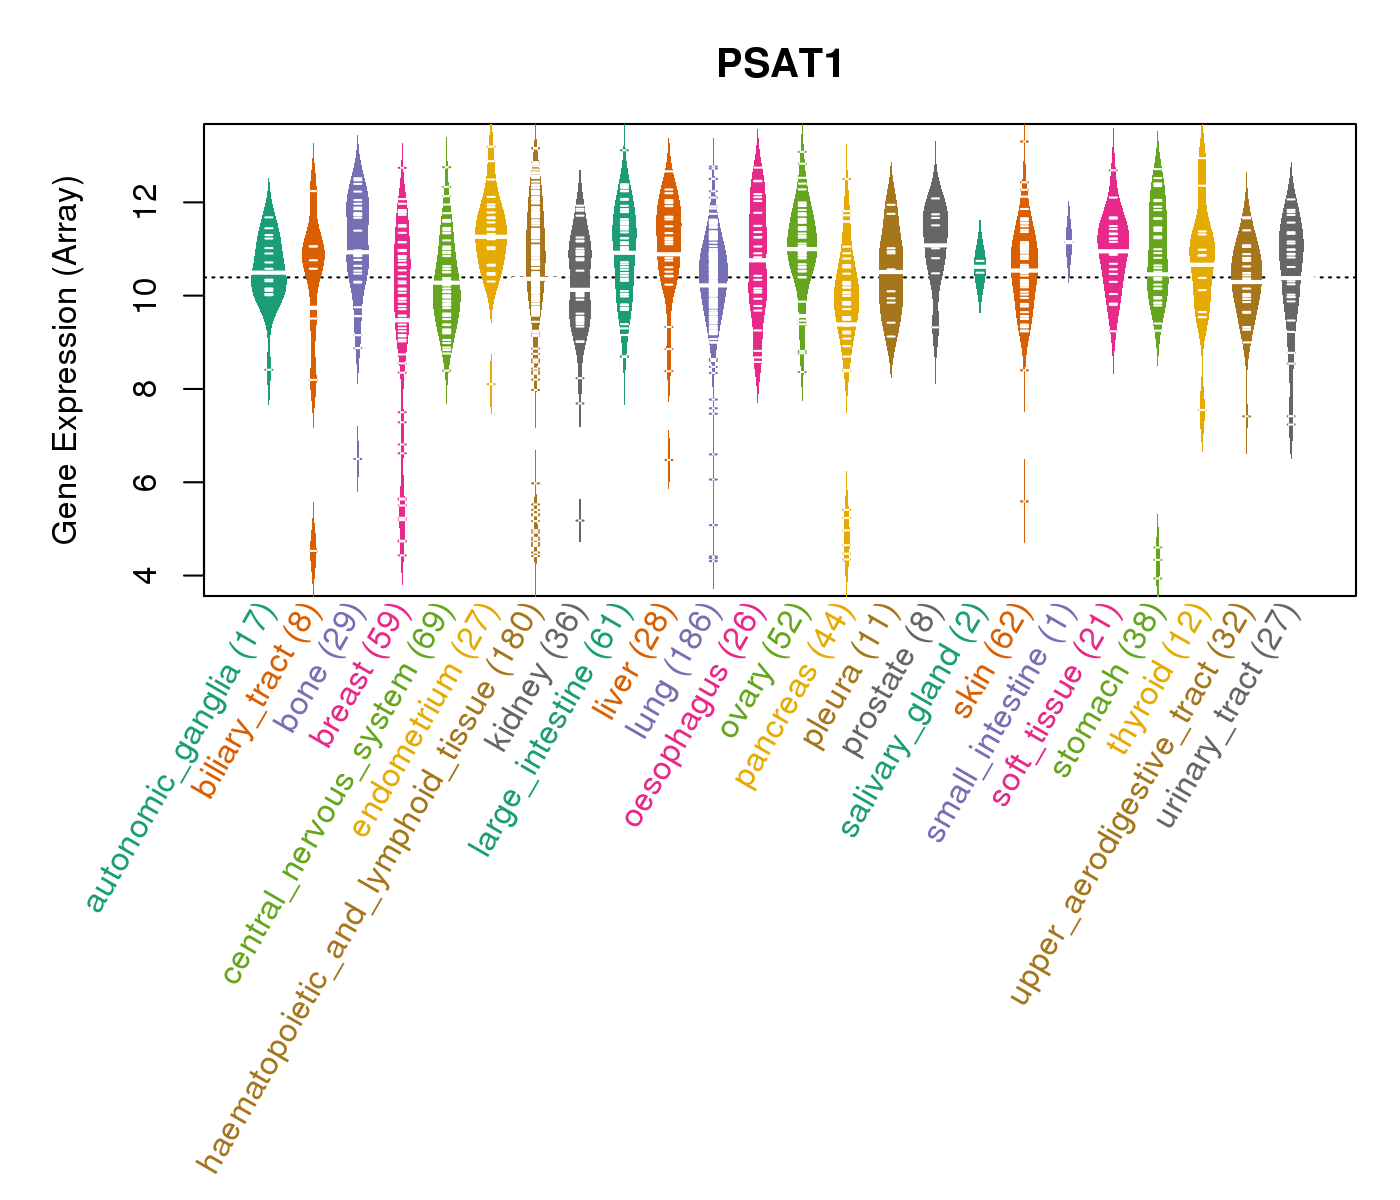
| Gene Expression for PSAT1 |
| * CCLE gene expression data were extracted from CCLE_Expression_Entrez_2012-10-18.res: Gene-centric RMA-normalized mRNA expression data. |
 |
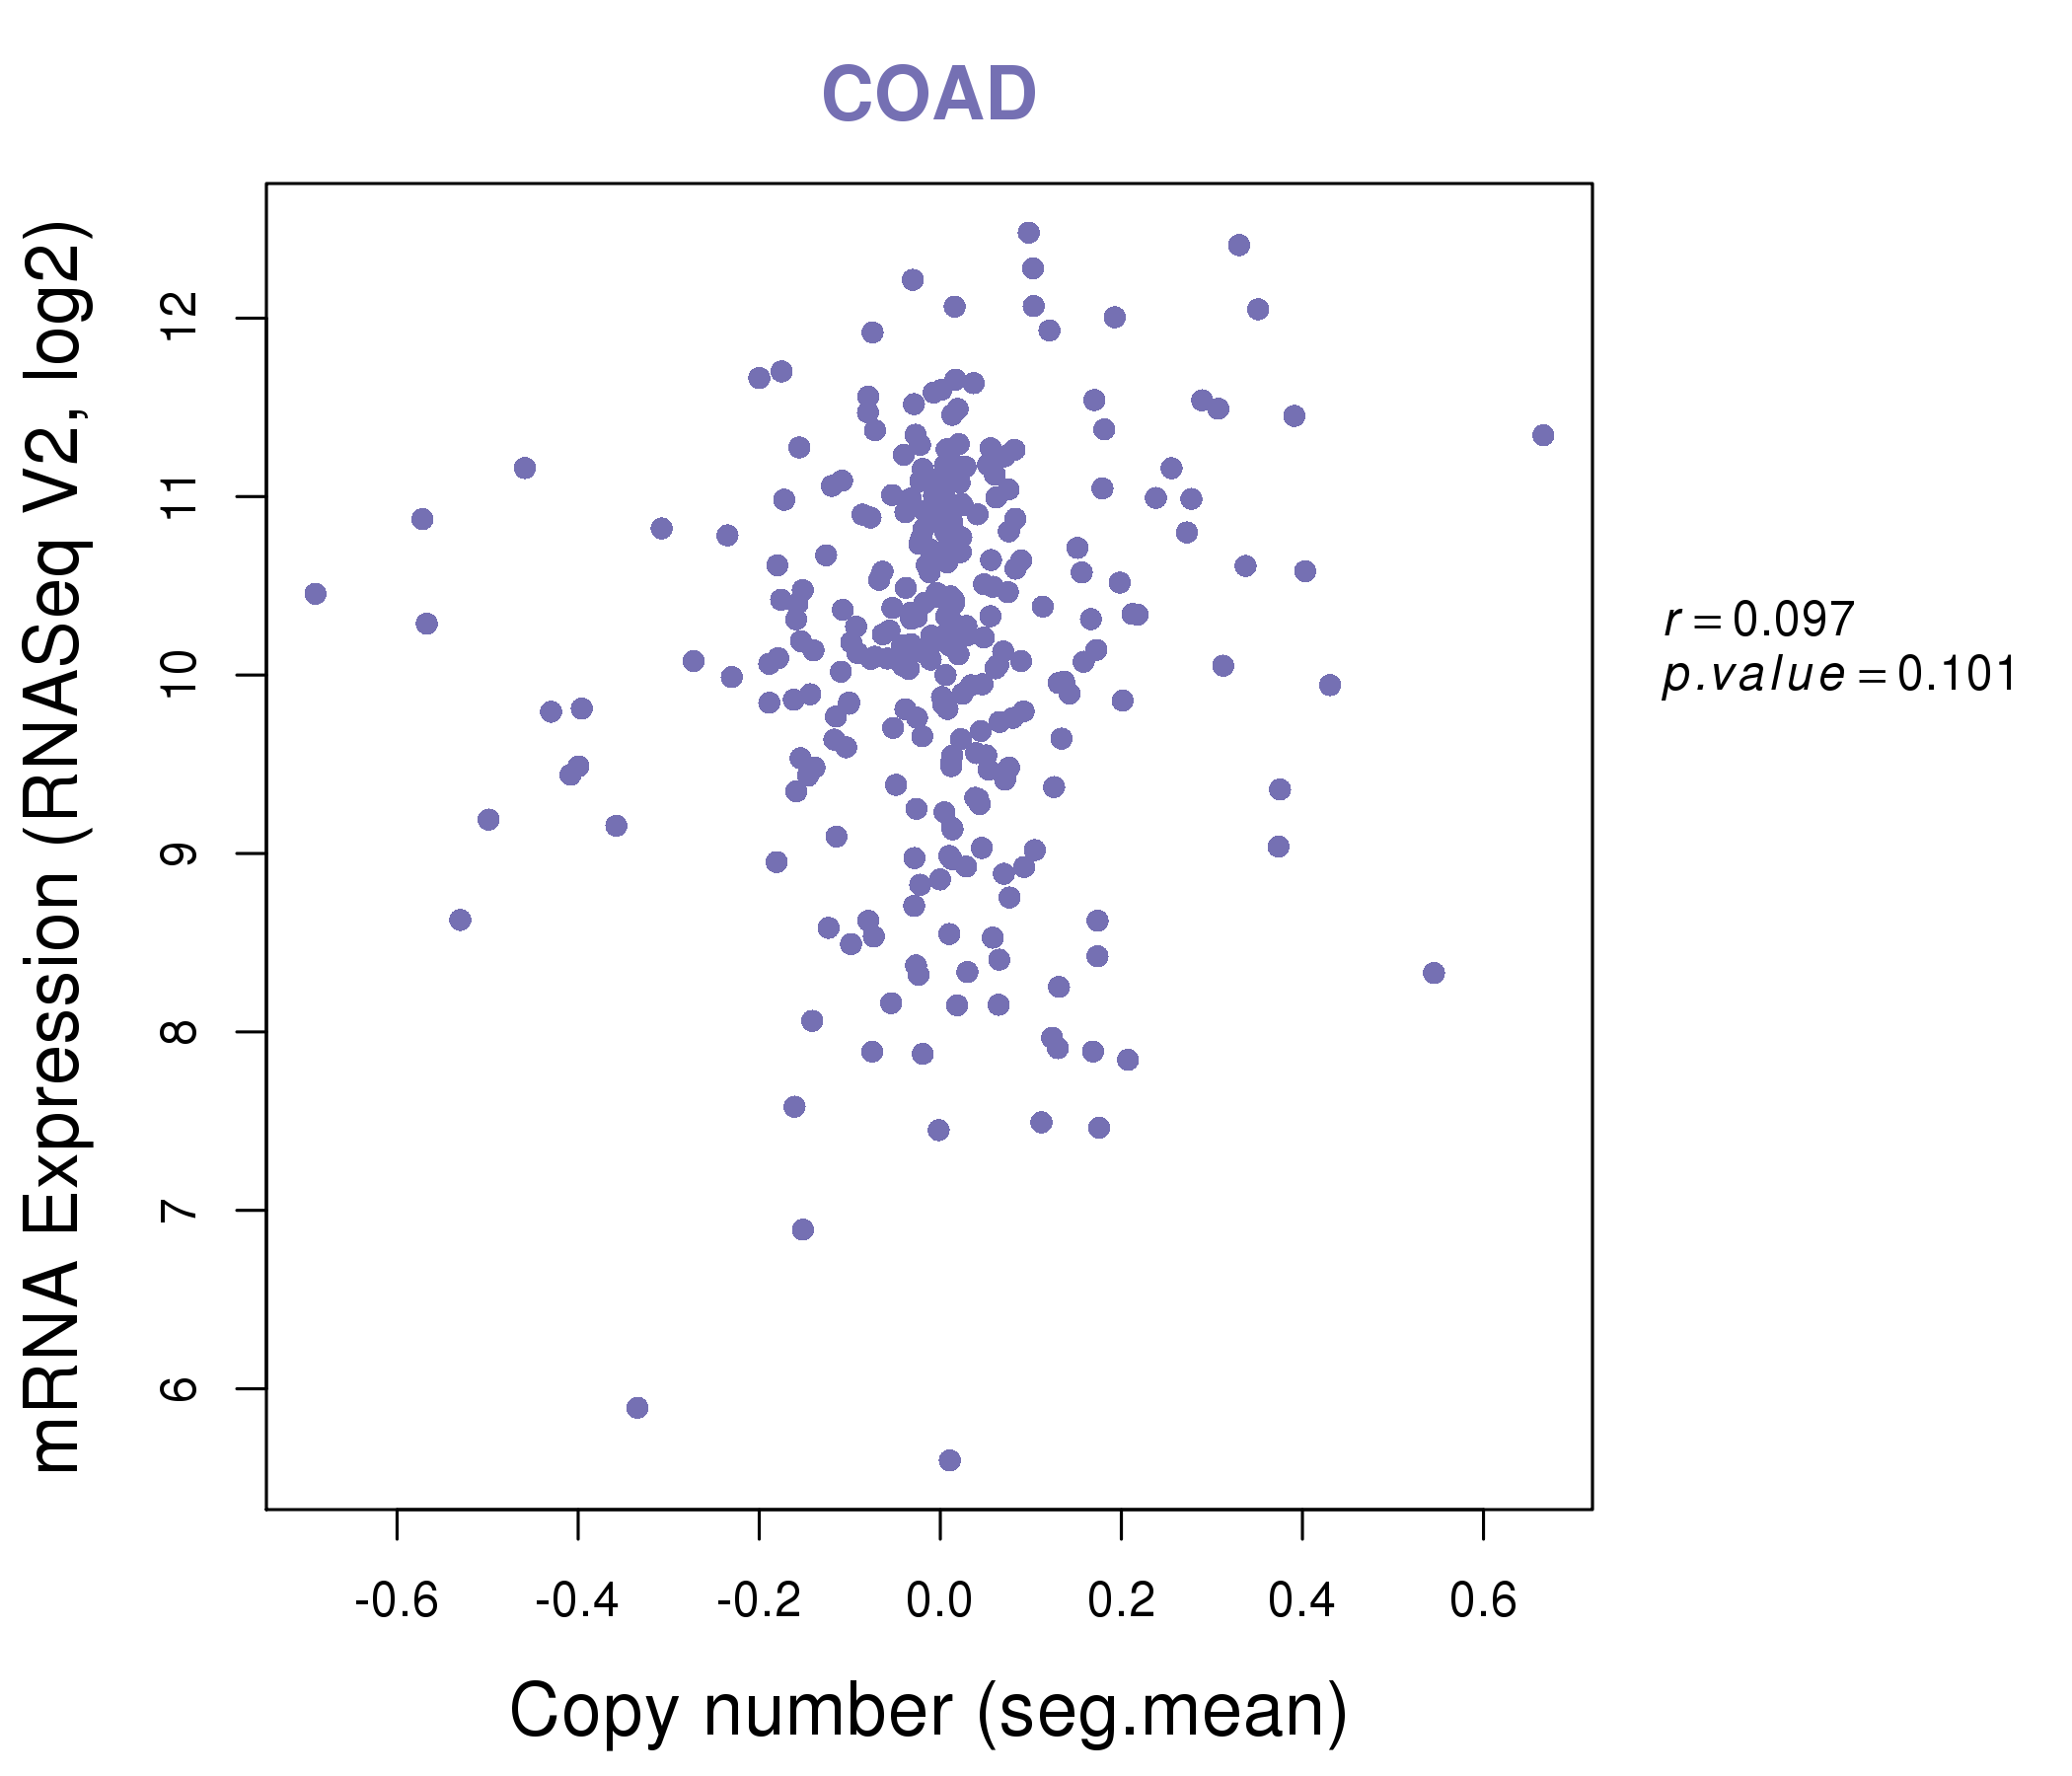
| * Normalized gene expression data of RNASeqV2 was extracted from TCGA using R package TCGA-Assembler. The URLs of all public data files on TCGA DCC data server were gathered at Jan-05-2015. Only eight cancer types have enough normal control samples for differential expression analysis. (t test, adjusted p<0.05 (using Benjamini-Hochberg FDR)) |
 |
| Top |
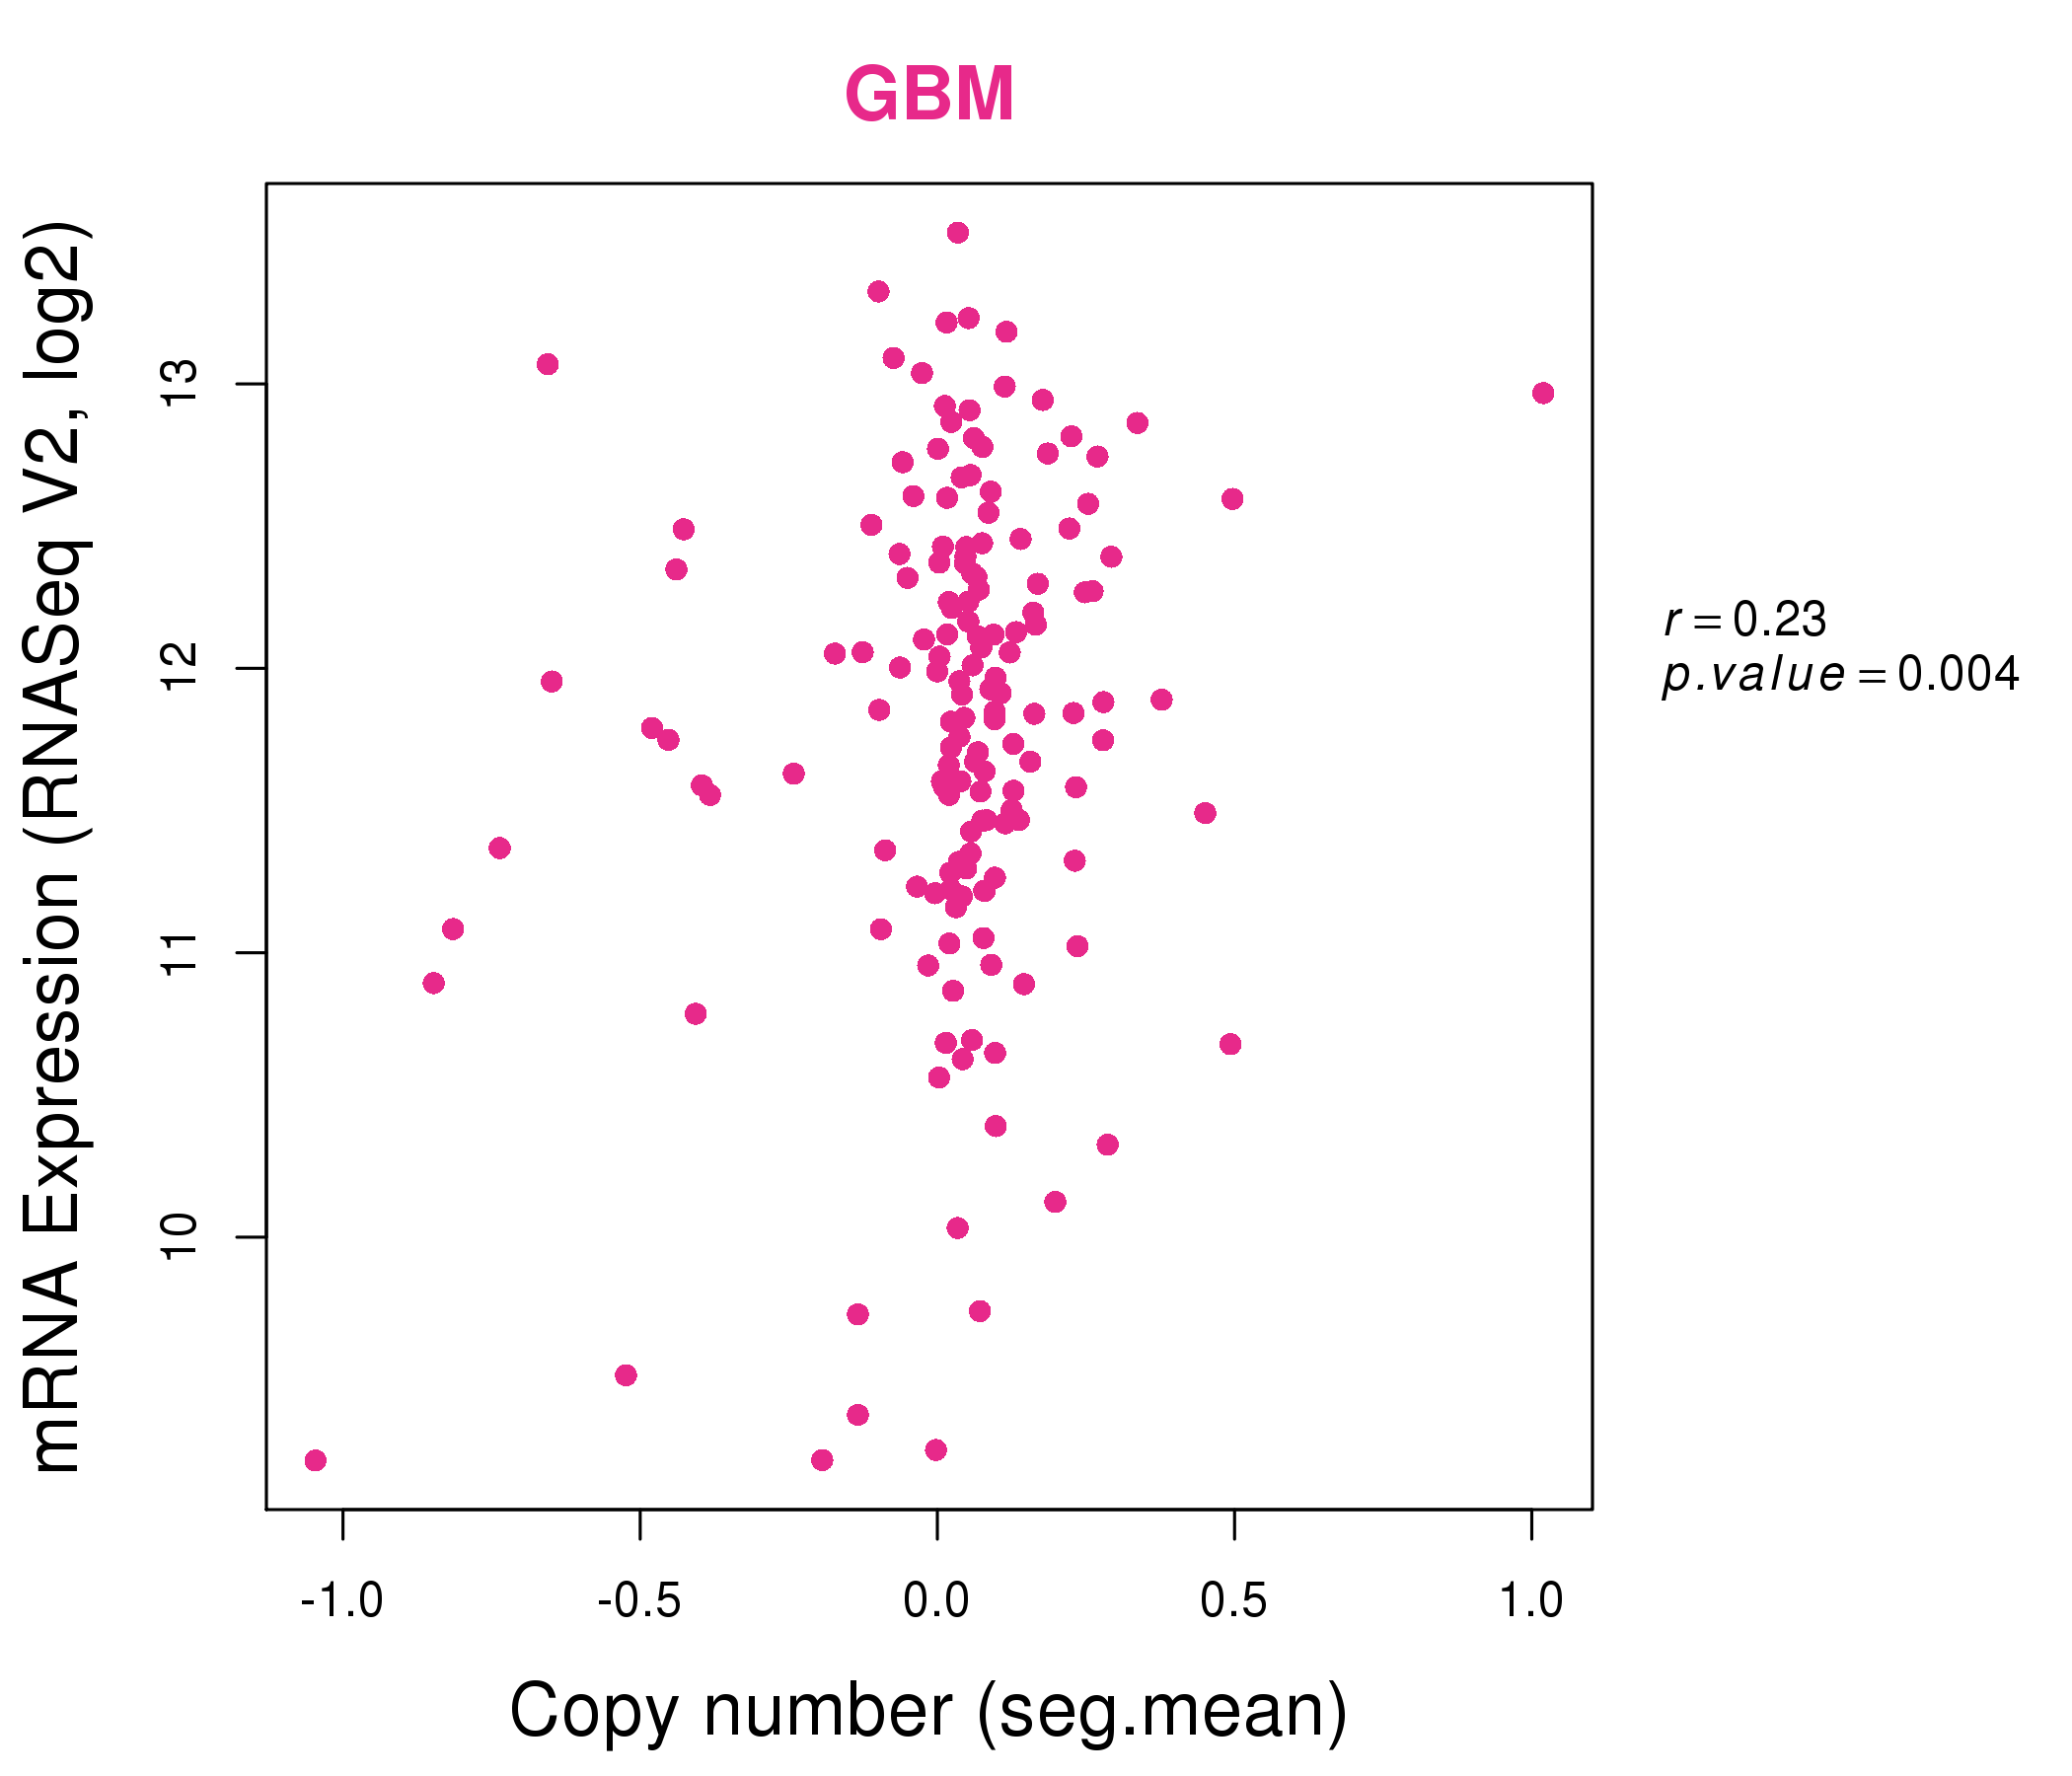
| * This plots show the correlation between CNV and gene expression. |
: Open all plots for all cancer types
 |
|
 |
|

| Top |
| Gene-Gene Network Information |
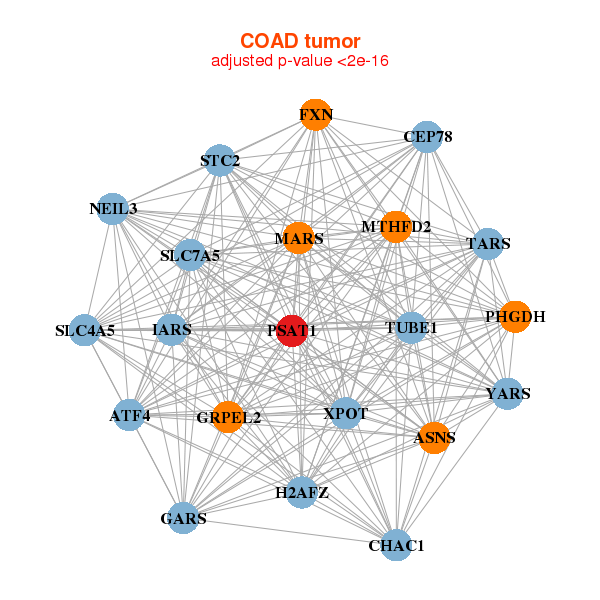
| * Co-Expression network figures were drawn using R package igraph. Only the top 20 genes with the highest correlations were shown. Red circle: input gene, orange circle: cell metabolism gene, sky circle: other gene |
: Open all plots for all cancer types
 |
| ||||
| ASNS,B3GNT5,BCL11A,AUNIP,MSANTD3,C9orf40,CDC20, CDCA7,CDCA8,CEBPG,CENPA,FAM136A,FOXM1,IFRD1, KCMF1,KIF2C,L3MBTL4,NDC80,ORC1,PSAT1,TEX10 | ABCC6,ADIPOR2,AK3___AK4,ALDH9A1,ALG9,CYP2C18,DGAT2, FMOD,GPAM,FFAR4,LAIR1,TENM4,PLA2G4A,PPP2R1B, PRRT4,PSAT1,PTPLB,SEMA4F,SPRY4,SSC4D,VPS45 | ||||
 |
| ||||
| ASNS,ATF4,CEP78,CHAC1,FXN,GARS,GRPEL2, H2AFZ,IARS,MARS,MTHFD2,NEIL3,PHGDH,PSAT1, SLC4A5,SLC7A5,STC2,TARS,TUBE1,XPOT,YARS | C2,C2CD4A,CDC25B,CHI3L1,CLDN14,EMILIN2,FCGR3A, FCN1,FCN3,HK3,LILRA3,LILRA6,LILRB2,MTHFD1L, PSAT1,RNASE2,SPINK4,TCN1,TLR2,TNIP3,ZAR1L |
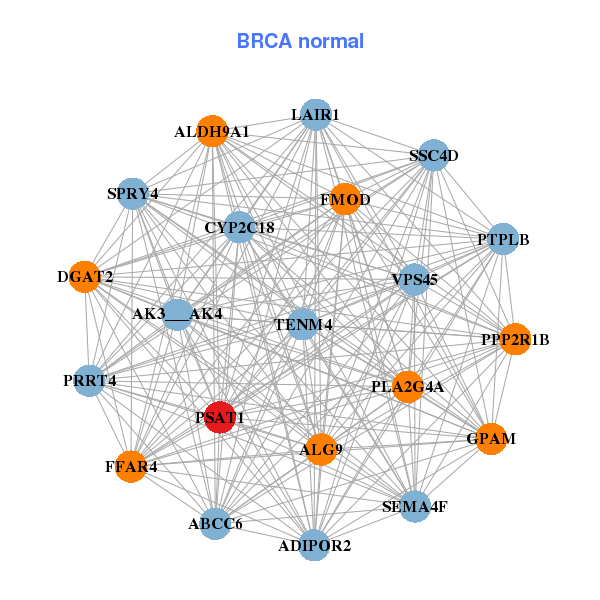
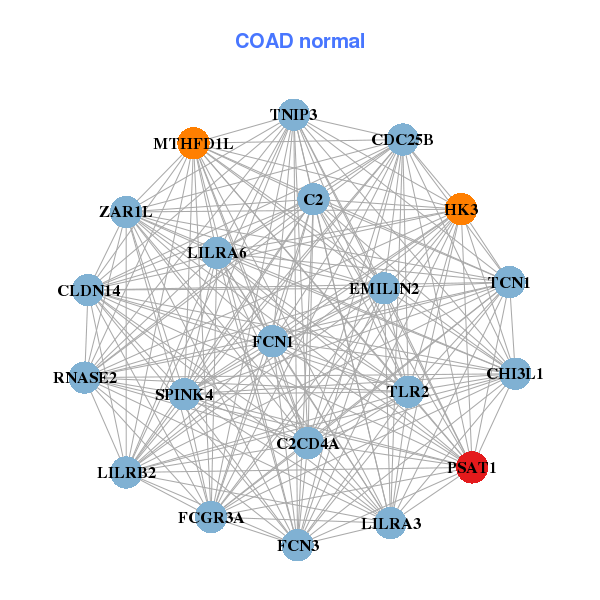
| * Co-Expression network figures were drawn using R package igraph. Only the top 20 genes with the highest correlations were shown. Red circle: input gene, orange circle: cell metabolism gene, sky circle: other gene |
: Open all plots for all cancer types
| Top |
: Open all interacting genes' information including KEGG pathway for all interacting genes from DAVID
| Top |
| Pharmacological Information for PSAT1 |
| DB Category | DB Name | DB's ID and Url link |
| * Gene Centered Interaction Network. |
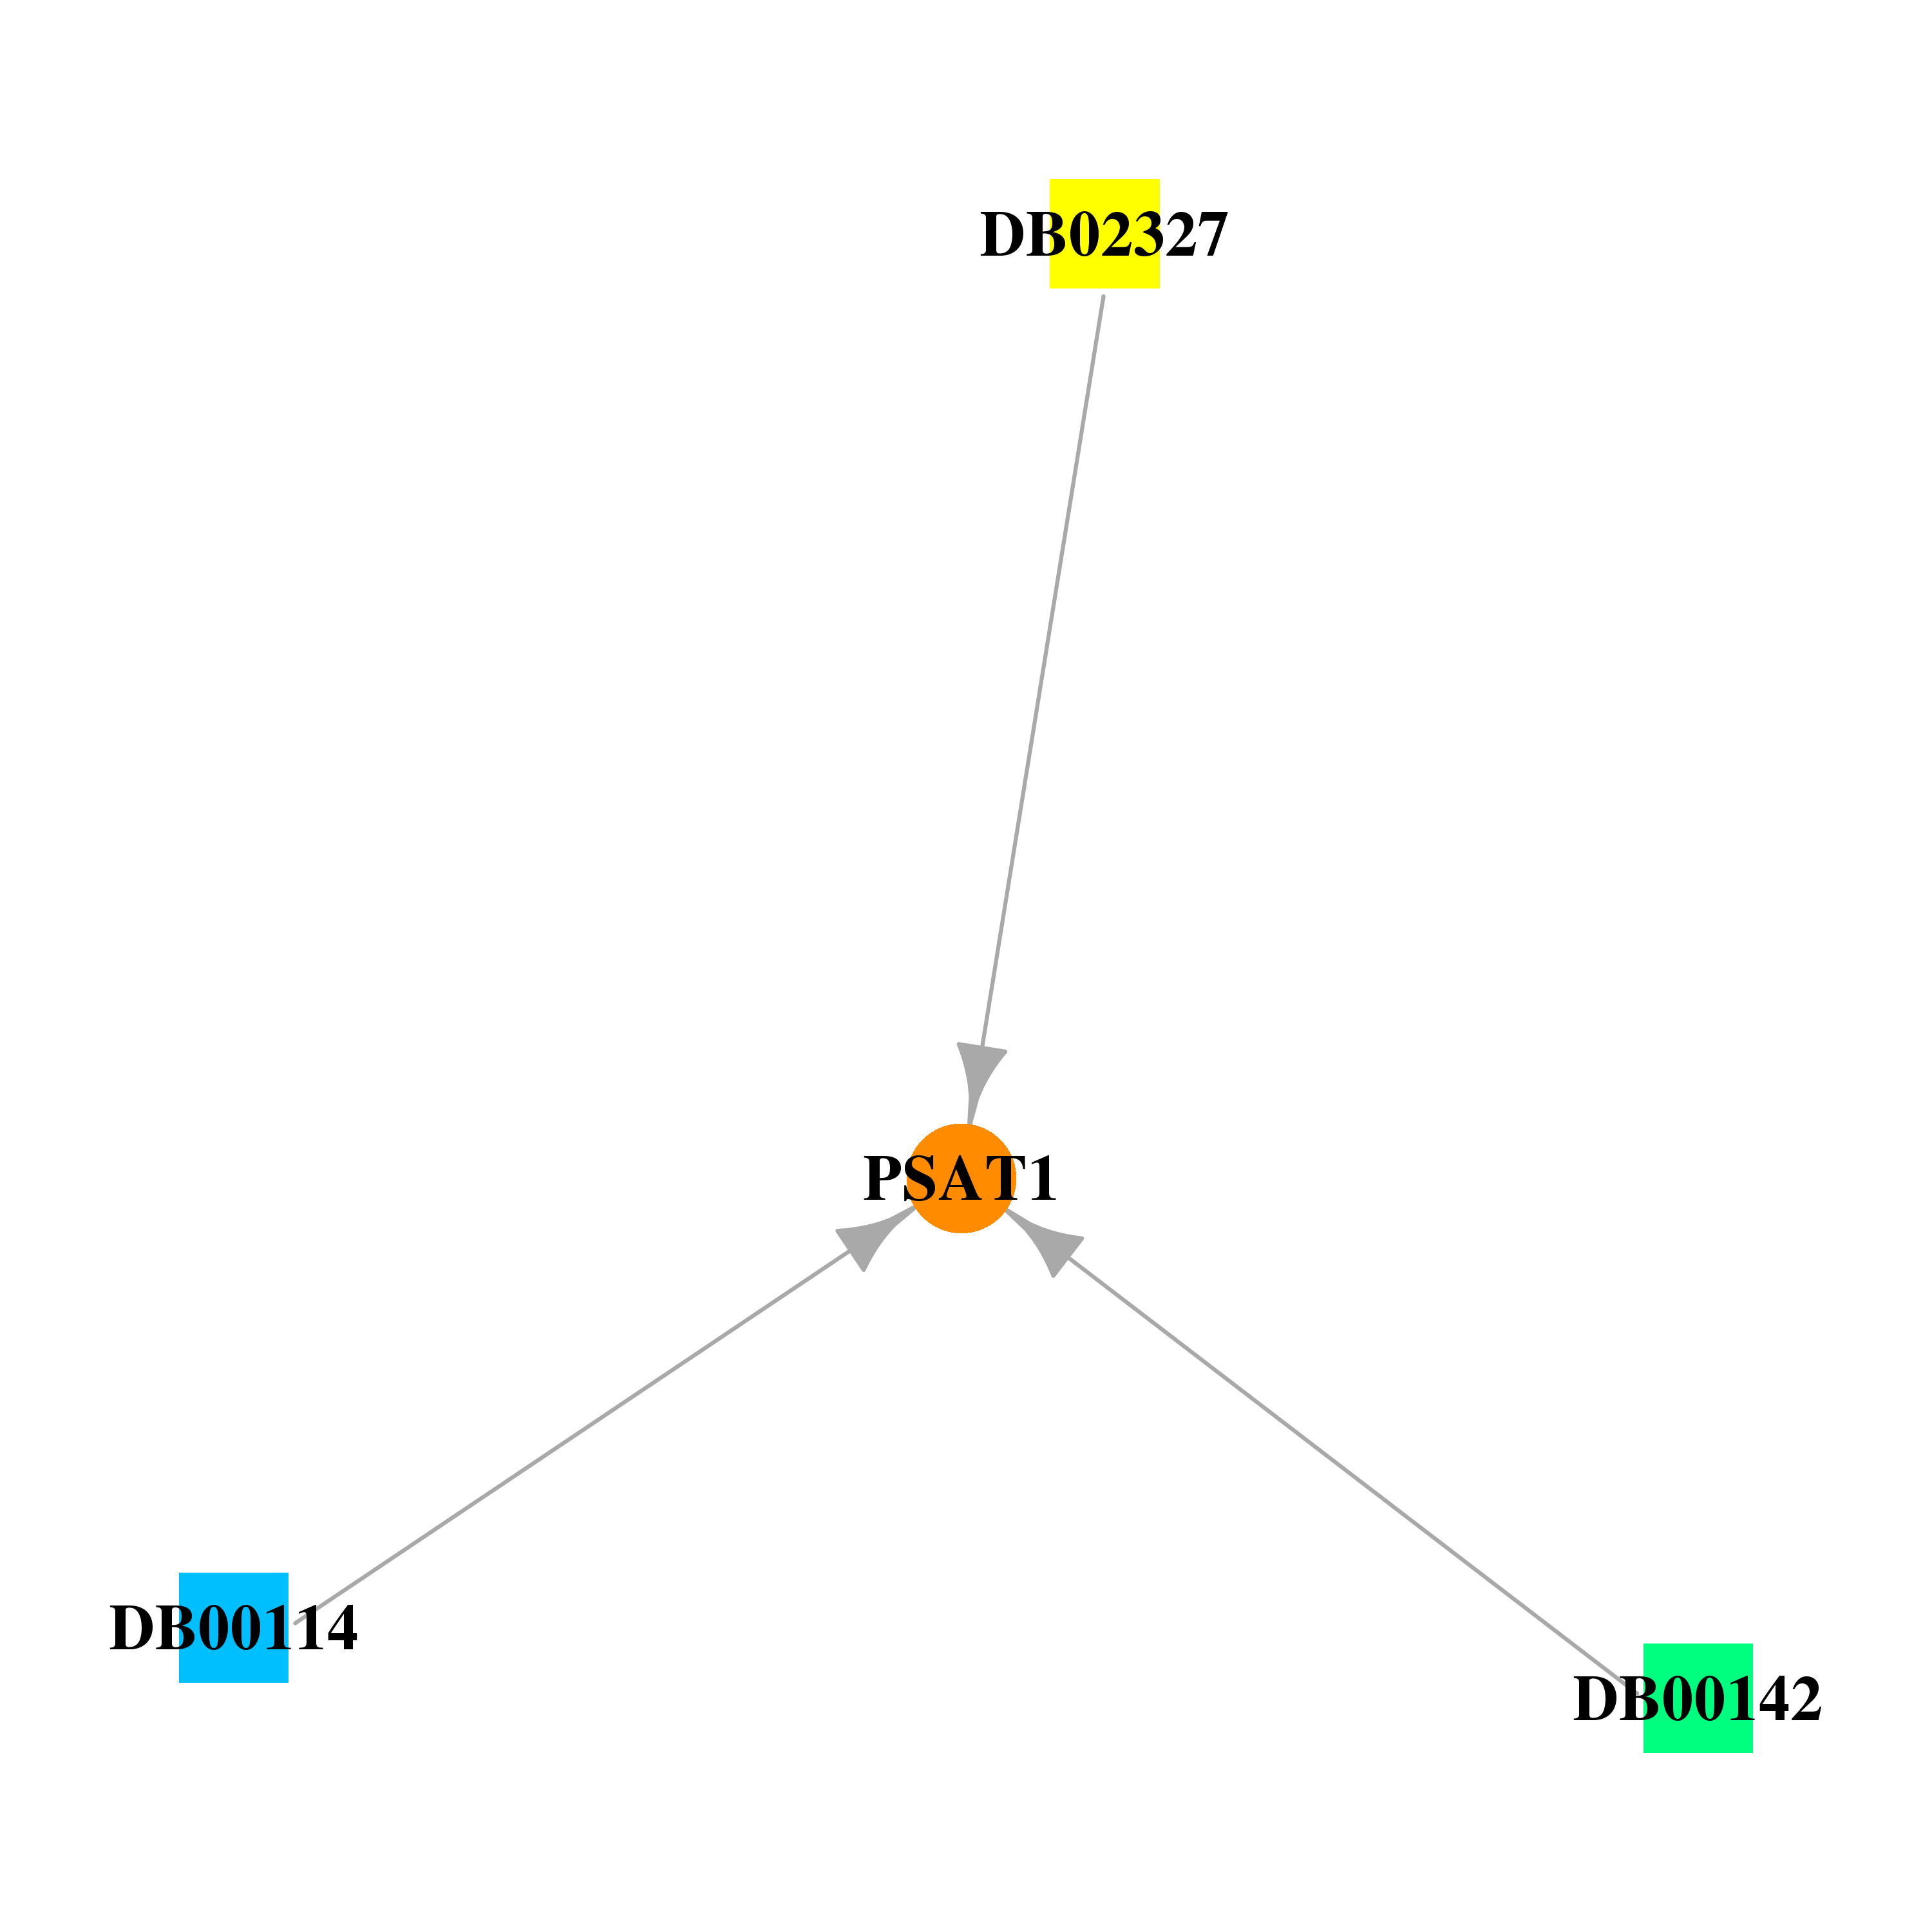 |
| * Drug Centered Interaction Network. |
| DrugBank ID | Target Name | Drug Groups | Generic Name | Drug Centered Network | Drug Structure |
| DB00114 | phosphoserine aminotransferase 1 | nutraceutical | Pyridoxal Phosphate |  |  |
| DB00142 | phosphoserine aminotransferase 1 | approved; nutraceutical | L-Glutamic Acid | 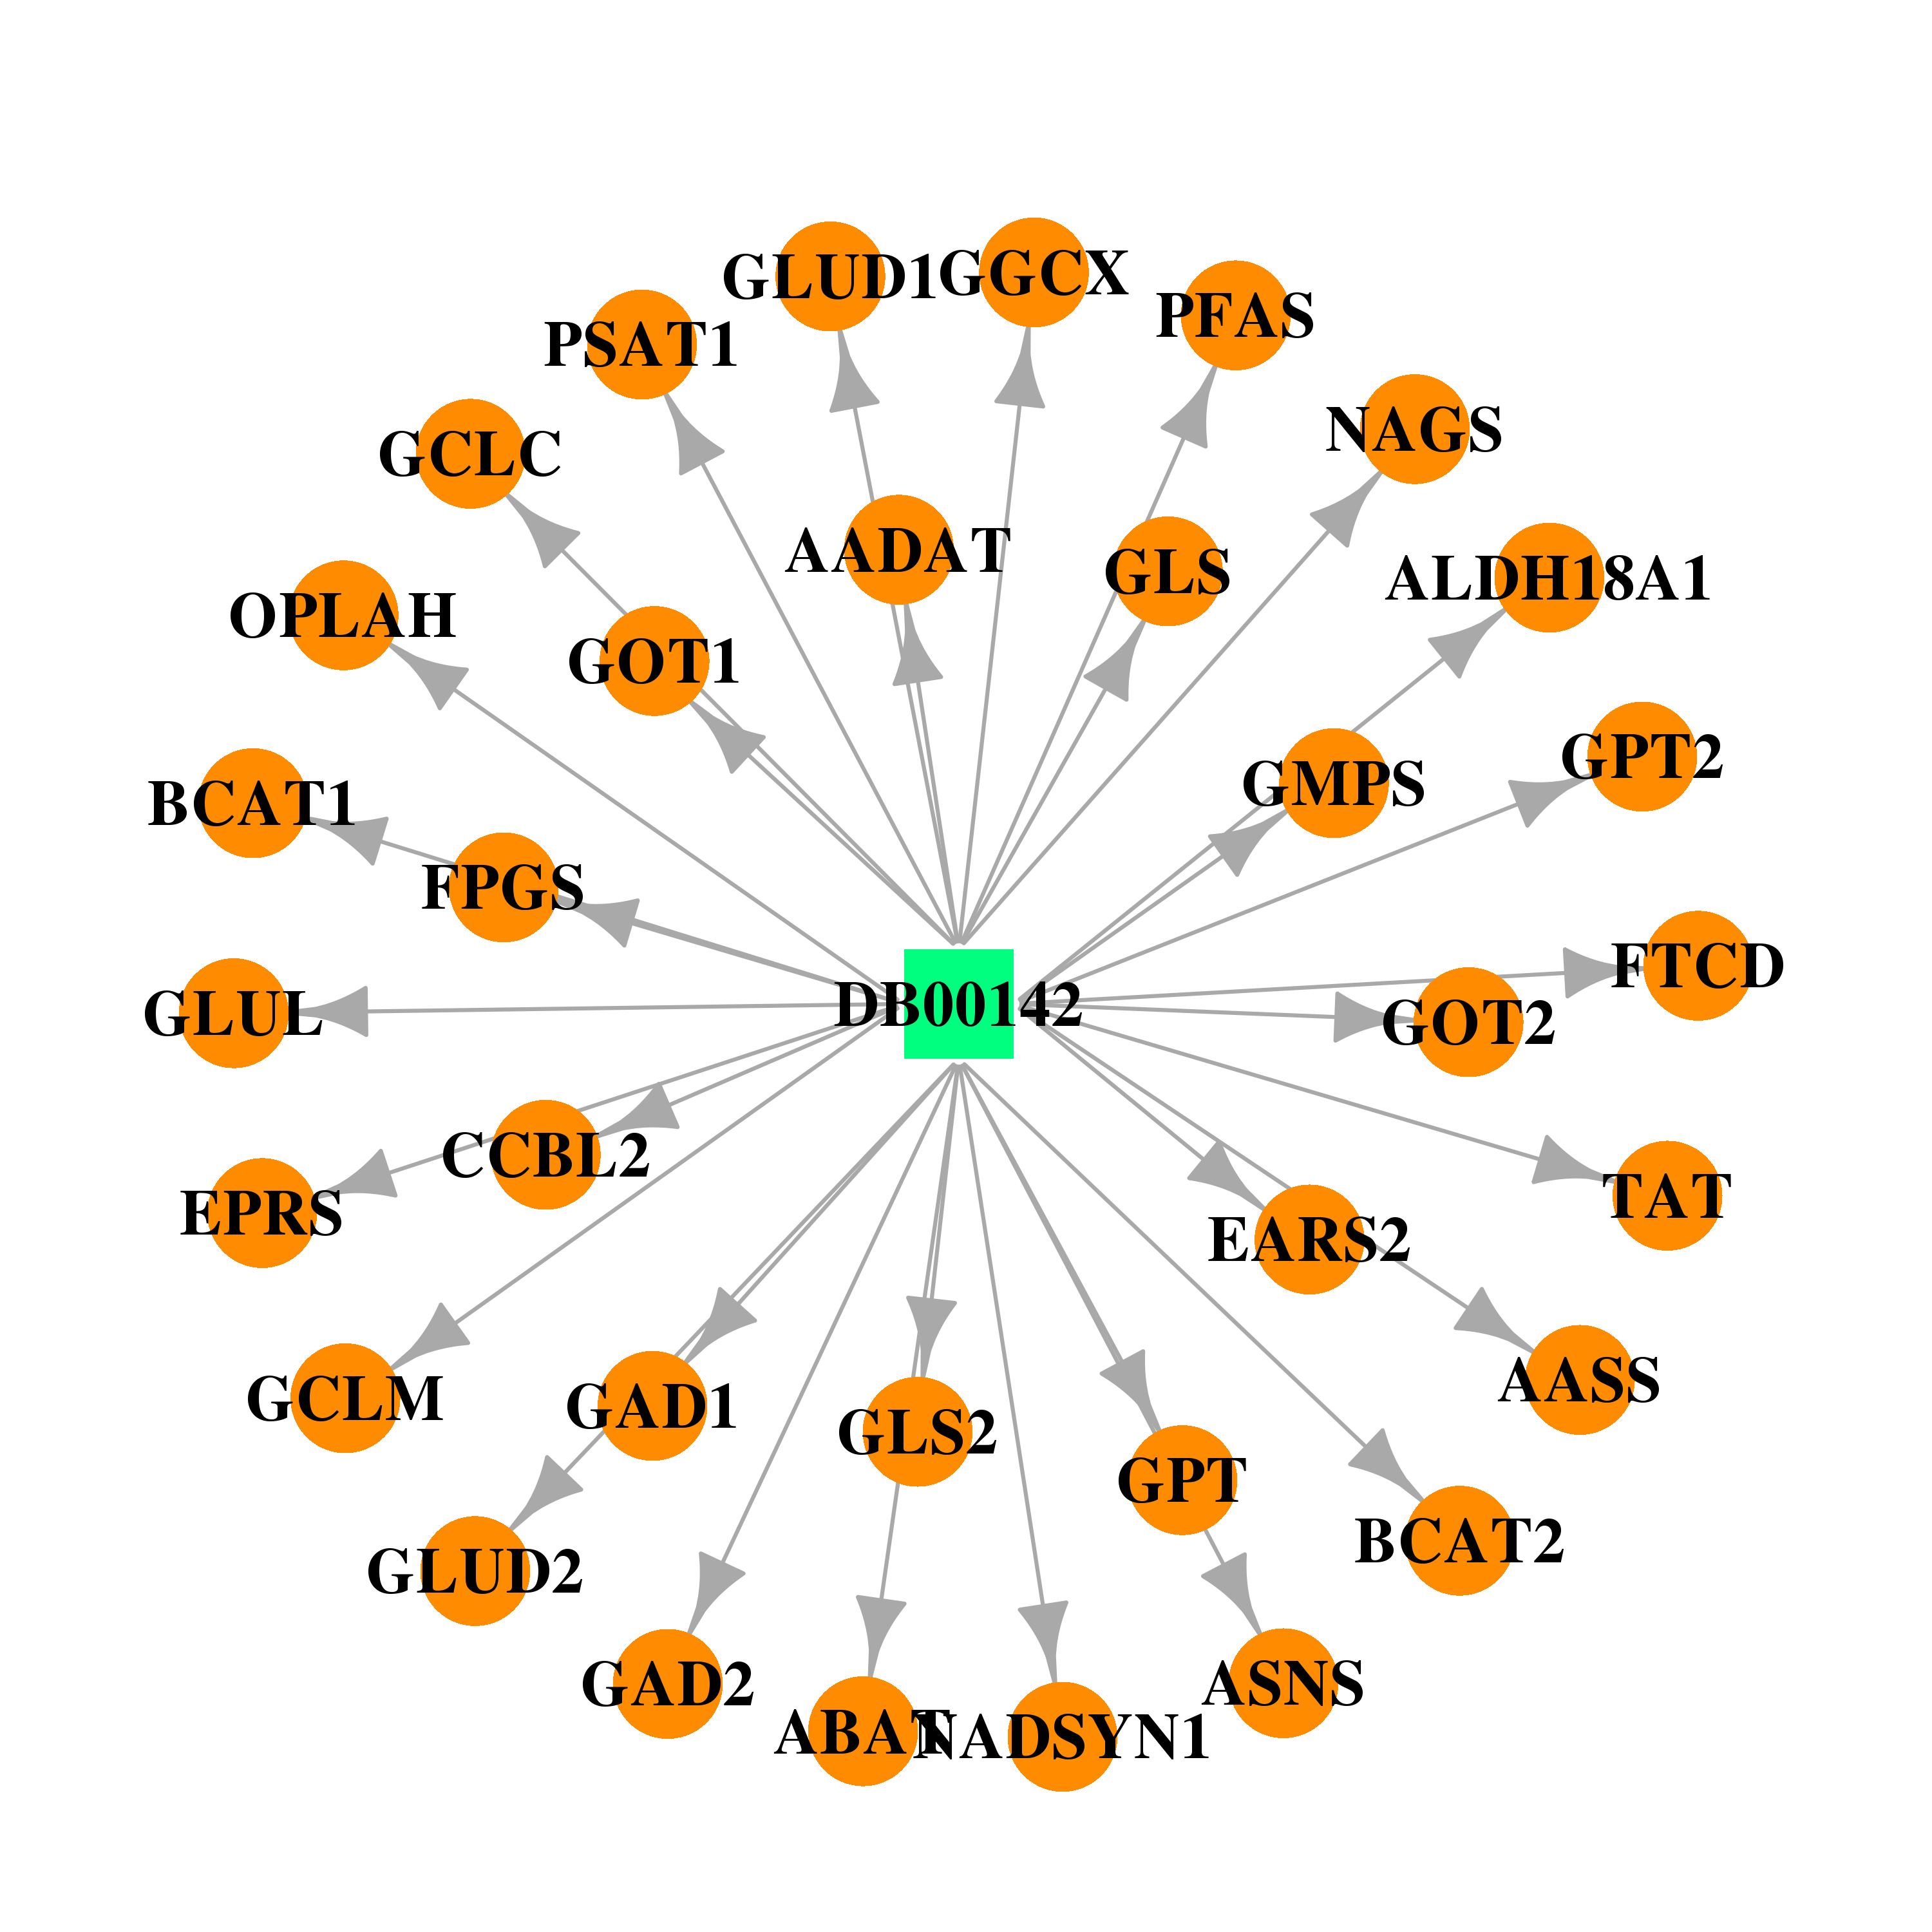 | 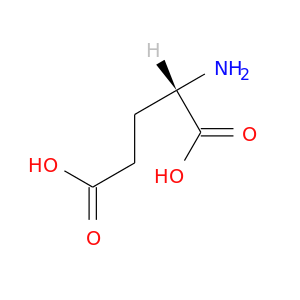 |
| DB02327 | phosphoserine aminotransferase 1 | experimental | 2-[2-(2-Hydroxy-Ethoxy)-Ethoxy]-Ethanol |  |  |
| Top |
| Cross referenced IDs for PSAT1 |
| * We obtained these cross-references from Uniprot database. It covers 150 different DBs, 18 categories. http://www.uniprot.org/help/cross_references_section |
: Open all cross reference information
|
Copyright © 2016-Present - The Univsersity of Texas Health Science Center at Houston @ |