|
||||||||||||||||||||
| |
| Phenotypic Information (metabolism pathway, cancer, disease, phenome) |
| |
| |
| Gene-Gene Network Information: Co-Expression Network, Interacting Genes & KEGG |
| |
|


| Gene Summary for GYS1 |
| Basic gene info. | Gene symbol | GYS1 |
| Gene name | glycogen synthase 1 (muscle) | |
| Synonyms | GSY|GYS | |
| Cytomap | UCSC genome browser: 19q13.3 | |
| Genomic location | chr19 :49471381-49496610 | |
| Type of gene | protein-coding | |
| RefGenes | NM_001161587.1, NM_002103.4,NR_027763.1, | |
| Ensembl id | ENSG00000104812 | |
| Description | glycogen [starch] synthase, muscle | |
| Modification date | 20141207 | |
| dbXrefs | MIM : 138570 | |
| HGNC : HGNC | ||
| Ensembl : ENSG00000104812 | ||
| HPRD : 00721 | ||
| Vega : OTTHUMG00000150723 | ||
| Protein | UniProt: go to UniProt's Cross Reference DB Table | |
| Expression | CleanEX: HS_GYS1 | |
| BioGPS: 2997 | ||
| Gene Expression Atlas: ENSG00000104812 | ||
| The Human Protein Atlas: ENSG00000104812 | ||
| Pathway | NCI Pathway Interaction Database: GYS1 | |
| KEGG: GYS1 | ||
| REACTOME: GYS1 | ||
| ConsensusPathDB | ||
| Pathway Commons: GYS1 | ||
| Metabolism | MetaCyc: GYS1 | |
| HUMANCyc: GYS1 | ||
| Regulation | Ensembl's Regulation: ENSG00000104812 | |
| miRBase: chr19 :49,471,381-49,496,610 | ||
| TargetScan: NM_001161587 | ||
| cisRED: ENSG00000104812 | ||
| Context | iHOP: GYS1 | |
| cancer metabolism search in PubMed: GYS1 | ||
| UCL Cancer Institute: GYS1 | ||
| Assigned class in ccmGDB | C | |
| Top |
| Phenotypic Information for GYS1(metabolism pathway, cancer, disease, phenome) |
| Cancer | CGAP: GYS1 |
| Familial Cancer Database: GYS1 | |
| * This gene is included in those cancer gene databases. |
|
|
|
|
|
|
| ||||||||||||||
Oncogene 1 | Significant driver gene in | |||||||||||||||||||
| cf) number; DB name 1 Oncogene; http://nar.oxfordjournals.org/content/35/suppl_1/D721.long, 2 Tumor Suppressor gene; https://bioinfo.uth.edu/TSGene/, 3 Cancer Gene Census; http://www.nature.com/nrc/journal/v4/n3/abs/nrc1299.html, 4 CancerGenes; http://nar.oxfordjournals.org/content/35/suppl_1/D721.long, 5 Network of Cancer Gene; http://ncg.kcl.ac.uk/index.php, 1Therapeutic Vulnerabilities in Cancer; http://cbio.mskcc.org/cancergenomics/statius/ |
| KEGG_STARCH_AND_SUCROSE_METABOLISM REACTOME_METABOLISM_OF_CARBOHYDRATES REACTOME_GLUCOSE_METABOLISM | |
| OMIM | |
| Orphanet | |
| Disease | KEGG Disease: GYS1 |
| MedGen: GYS1 (Human Medical Genetics with Condition) | |
| ClinVar: GYS1 | |
| Phenotype | MGI: GYS1 (International Mouse Phenotyping Consortium) |
| PhenomicDB: GYS1 | |
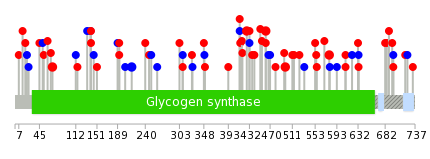
| Mutations for GYS1 |
| * Under tables are showing count per each tissue to give us broad intuition about tissue specific mutation patterns.You can go to the detailed page for each mutation database's web site. |
| There's no structural variation information in COSMIC data for this gene. |
| * From mRNA Sanger sequences, Chitars2.0 arranged chimeric transcripts. This table shows GYS1 related fusion information. |
| ID | Head Gene | Tail Gene | Accession | Gene_a | qStart_a | qEnd_a | Chromosome_a | tStart_a | tEnd_a | Gene_a | qStart_a | qEnd_a | Chromosome_a | tStart_a | tEnd_a |
| AI091299 | GYS1 | 6 | 211 | 19 | 49471387 | 49471592 | HSPA14 | 207 | 559 | 10 | 14884639 | 14885515 | |
| DA766946 | VPS26A | 1 | 214 | 10 | 70883940 | 70892770 | GYS1 | 209 | 510 | 19 | 49474254 | 49481214 | |
| AI096400 | GYS1 | 1 | 104 | 19 | 49471389 | 49471492 | CPXM1 | 97 | 454 | 20 | 2776380 | 2776737 | |
| AI312670 | MYH7 | 1 | 204 | 14 | 23881951 | 23883041 | GYS1 | 200 | 478 | 19 | 49472158 | 49472435 | |
| BU601594 | BRF1 | 3 | 142 | 14 | 105716756 | 105716895 | GYS1 | 131 | 197 | 19 | 49471387 | 49471453 | |
| AI332313 | MYH7 | 1 | 204 | 14 | 23881951 | 23883041 | GYS1 | 200 | 477 | 19 | 49472158 | 49472435 | |
| Top |
| There's no copy number variation information in COSMIC data for this gene. |
| Top |
|
 |
| Top |
| Stat. for Non-Synonymous SNVs (# total SNVs=45) | (# total SNVs=15) |
 |  |
(# total SNVs=0) | (# total SNVs=0) |
| Top |
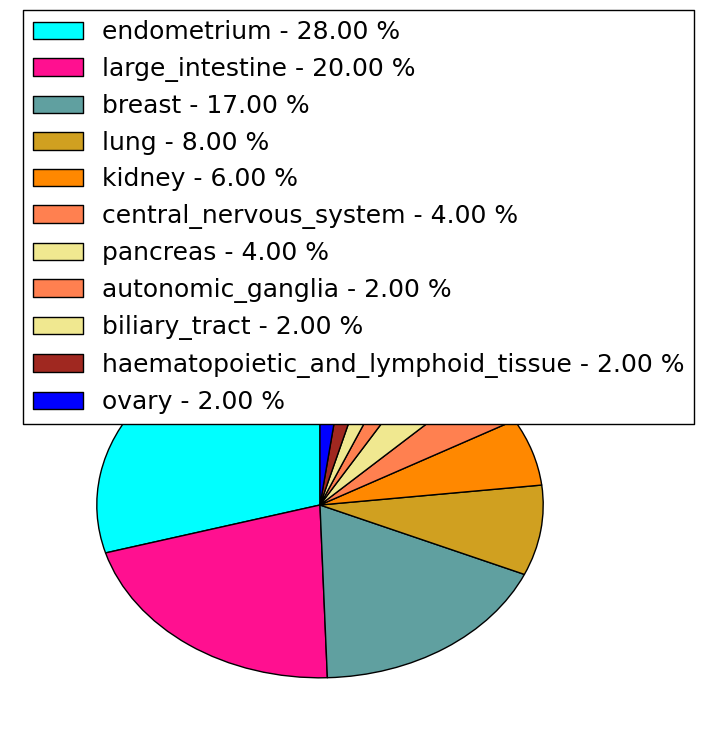
| * When you move the cursor on each content, you can see more deailed mutation information on the Tooltip. Those are primary_site,primary_histology,mutation(aa),pubmedID. |
| GRCh37 position | Mutation(aa) | Unique sampleID count |
| chr19:49489140-49489140 | p.A215A | 2 |
| chr19:49477915-49477915 | p.R462G | 2 |
| chr19:49494653-49494653 | p.T69M | 2 |
| chr19:49473096-49473096 | p.R609H | 2 |
| chr19:49477527-49477527 | p.R498C | 2 |
| chr19:49481193-49481193 | p.I432M | 2 |
| chr19:49473876-49473876 | p.R579Q | 2 |
| chr19:49481210-49481210 | p.M427V | 2 |
| chr19:49477898-49477898 | p.N467N | 1 |
| chr19:49481246-49481246 | p.D415N | 1 |
| Top |
|
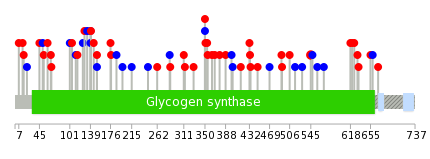 |
| Point Mutation/ Tissue ID | 1 | 2 | 3 | 4 | 5 | 6 | 7 | 8 | 9 | 10 | 11 | 12 | 13 | 14 | 15 | 16 | 17 | 18 | 19 | 20 |
| # sample | 5 | 5 | 6 | 7 | 3 | 7 | 1 | 5 | 9 | 5 | 1 | 13 | ||||||||
| # mutation | 5 | 5 | 6 | 7 | 4 | 7 | 1 | 5 | 9 | 5 | 1 | 14 | ||||||||
| nonsynonymous SNV | 4 | 5 | 4 | 5 | 3 | 3 | 1 | 4 | 3 | 13 | ||||||||||
| synonymous SNV | 1 | 2 | 2 | 1 | 4 | 1 | 4 | 5 | 2 | 1 | 1 |
| cf) Tissue ID; Tissue type (1; BLCA[Bladder Urothelial Carcinoma], 2; BRCA[Breast invasive carcinoma], 3; CESC[Cervical squamous cell carcinoma and endocervical adenocarcinoma], 4; COAD[Colon adenocarcinoma], 5; GBM[Glioblastoma multiforme], 6; Glioma Low Grade, 7; HNSC[Head and Neck squamous cell carcinoma], 8; KICH[Kidney Chromophobe], 9; KIRC[Kidney renal clear cell carcinoma], 10; KIRP[Kidney renal papillary cell carcinoma], 11; LAML[Acute Myeloid Leukemia], 12; LUAD[Lung adenocarcinoma], 13; LUSC[Lung squamous cell carcinoma], 14; OV[Ovarian serous cystadenocarcinoma ], 15; PAAD[Pancreatic adenocarcinoma], 16; PRAD[Prostate adenocarcinoma], 17; SKCM[Skin Cutaneous Melanoma], 18:STAD[Stomach adenocarcinoma], 19:THCA[Thyroid carcinoma], 20:UCEC[Uterine Corpus Endometrial Carcinoma]) |
| Top |
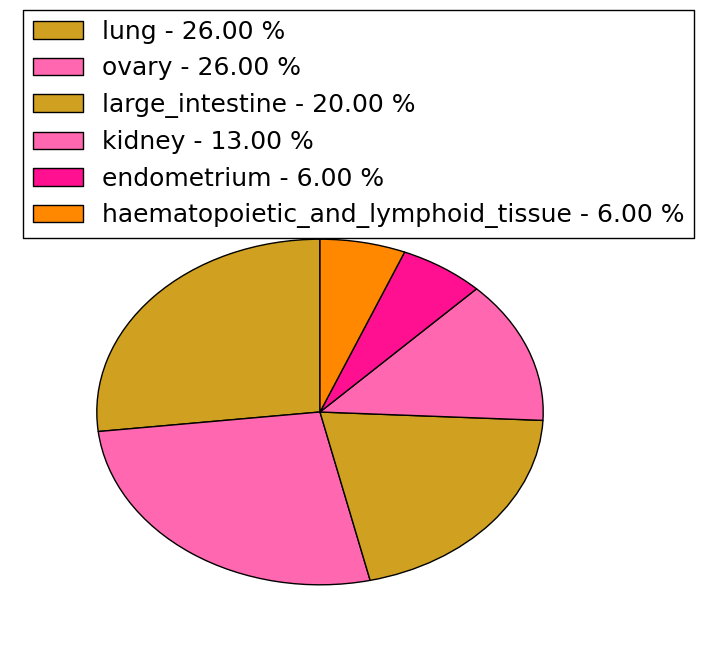
| * We represented just top 10 SNVs. When you move the cursor on each content, you can see more deailed mutation information on the Tooltip. Those are primary_site, primary_histology, mutation(aa), pubmedID. |
| Genomic Position | Mutation(aa) | Unique sampleID count |
| chr19:49473096 | p.R545H,GYS1 | 2 |
| chr19:49494701 | p.M363V,GYS1 | 1 |
| chr19:49481235 | p.R177L,GYS1 | 1 |
| chr19:49486081 | p.G66E,GYS1 | 1 |
| chr19:49473059 | p.S529S,GYS1 | 1 |
| chr19:49490508 | p.M355V,GYS1 | 1 |
| chr19:49477529 | p.H176R,GYS1 | 1 |
| chr19:49494706 | p.D60N,GYS1 | 1 |
| chr19:49481246 | p.R516R,GYS1 | 1 |
| chr19:49488755 | p.K354N,GYS1 | 1 |
| * Copy number data were extracted from TCGA using R package TCGA-Assembler. The URLs of all public data files on TCGA DCC data server were gathered on Jan-05-2015. Function ProcessCNAData in TCGA-Assembler package was used to obtain gene-level copy number value which is calculated as the average copy number of the genomic region of a gene. |
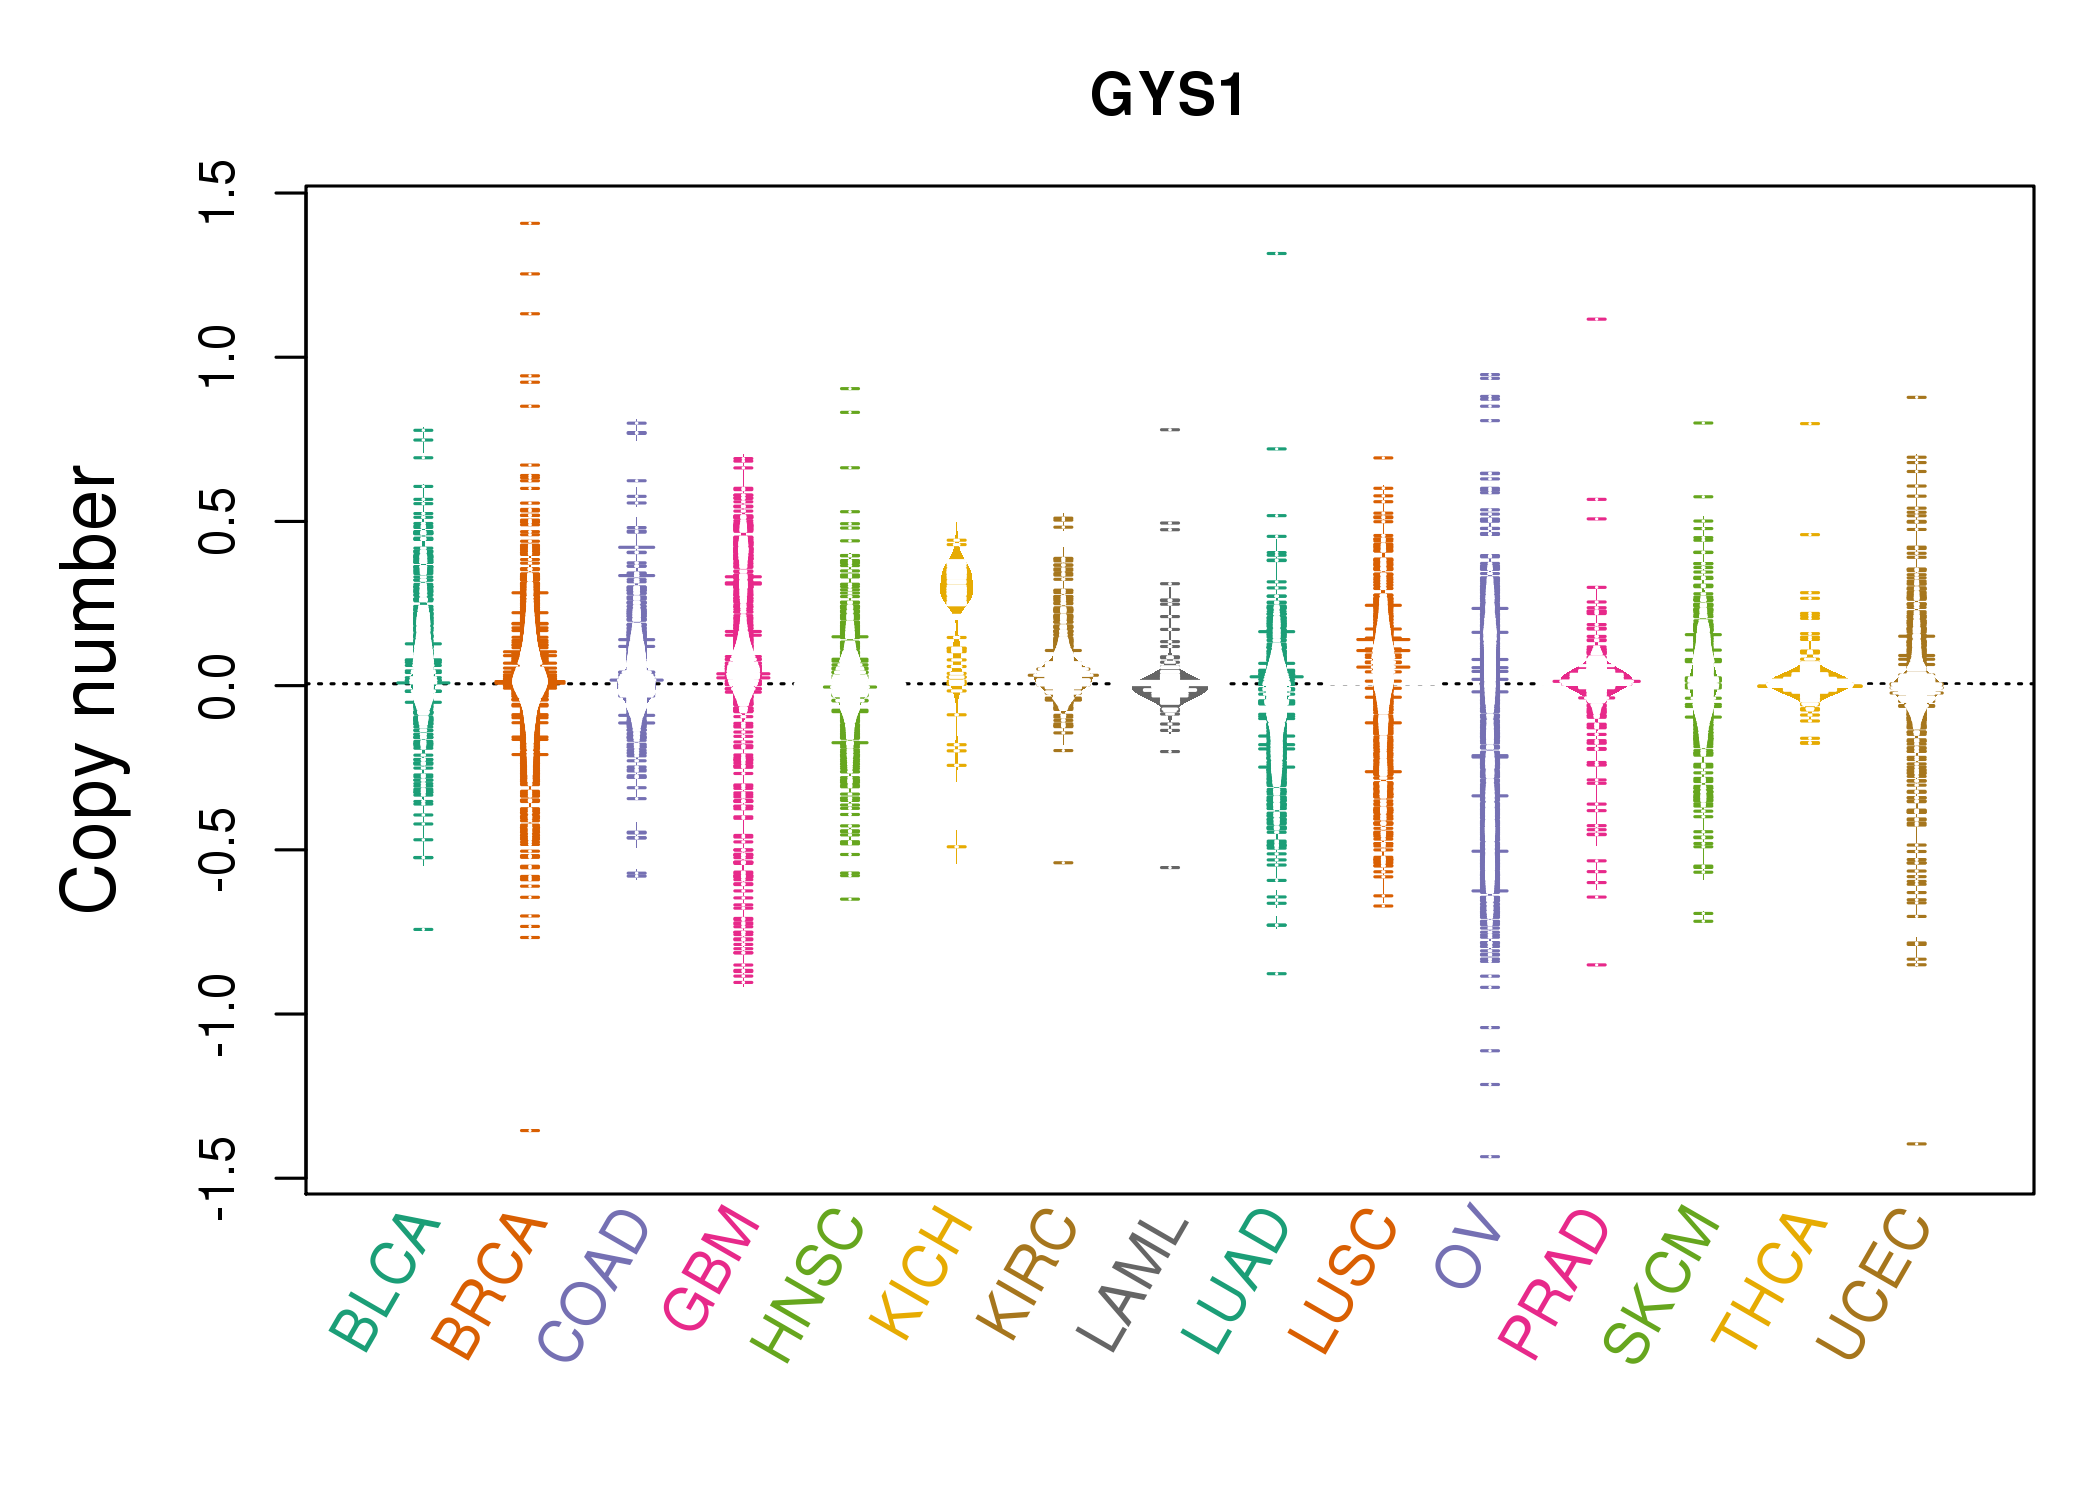 |
| cf) Tissue ID[Tissue type]: BLCA[Bladder Urothelial Carcinoma], BRCA[Breast invasive carcinoma], CESC[Cervical squamous cell carcinoma and endocervical adenocarcinoma], COAD[Colon adenocarcinoma], GBM[Glioblastoma multiforme], Glioma Low Grade, HNSC[Head and Neck squamous cell carcinoma], KICH[Kidney Chromophobe], KIRC[Kidney renal clear cell carcinoma], KIRP[Kidney renal papillary cell carcinoma], LAML[Acute Myeloid Leukemia], LUAD[Lung adenocarcinoma], LUSC[Lung squamous cell carcinoma], OV[Ovarian serous cystadenocarcinoma ], PAAD[Pancreatic adenocarcinoma], PRAD[Prostate adenocarcinoma], SKCM[Skin Cutaneous Melanoma], STAD[Stomach adenocarcinoma], THCA[Thyroid carcinoma], UCEC[Uterine Corpus Endometrial Carcinoma] |
| Top |
| Gene Expression for GYS1 |
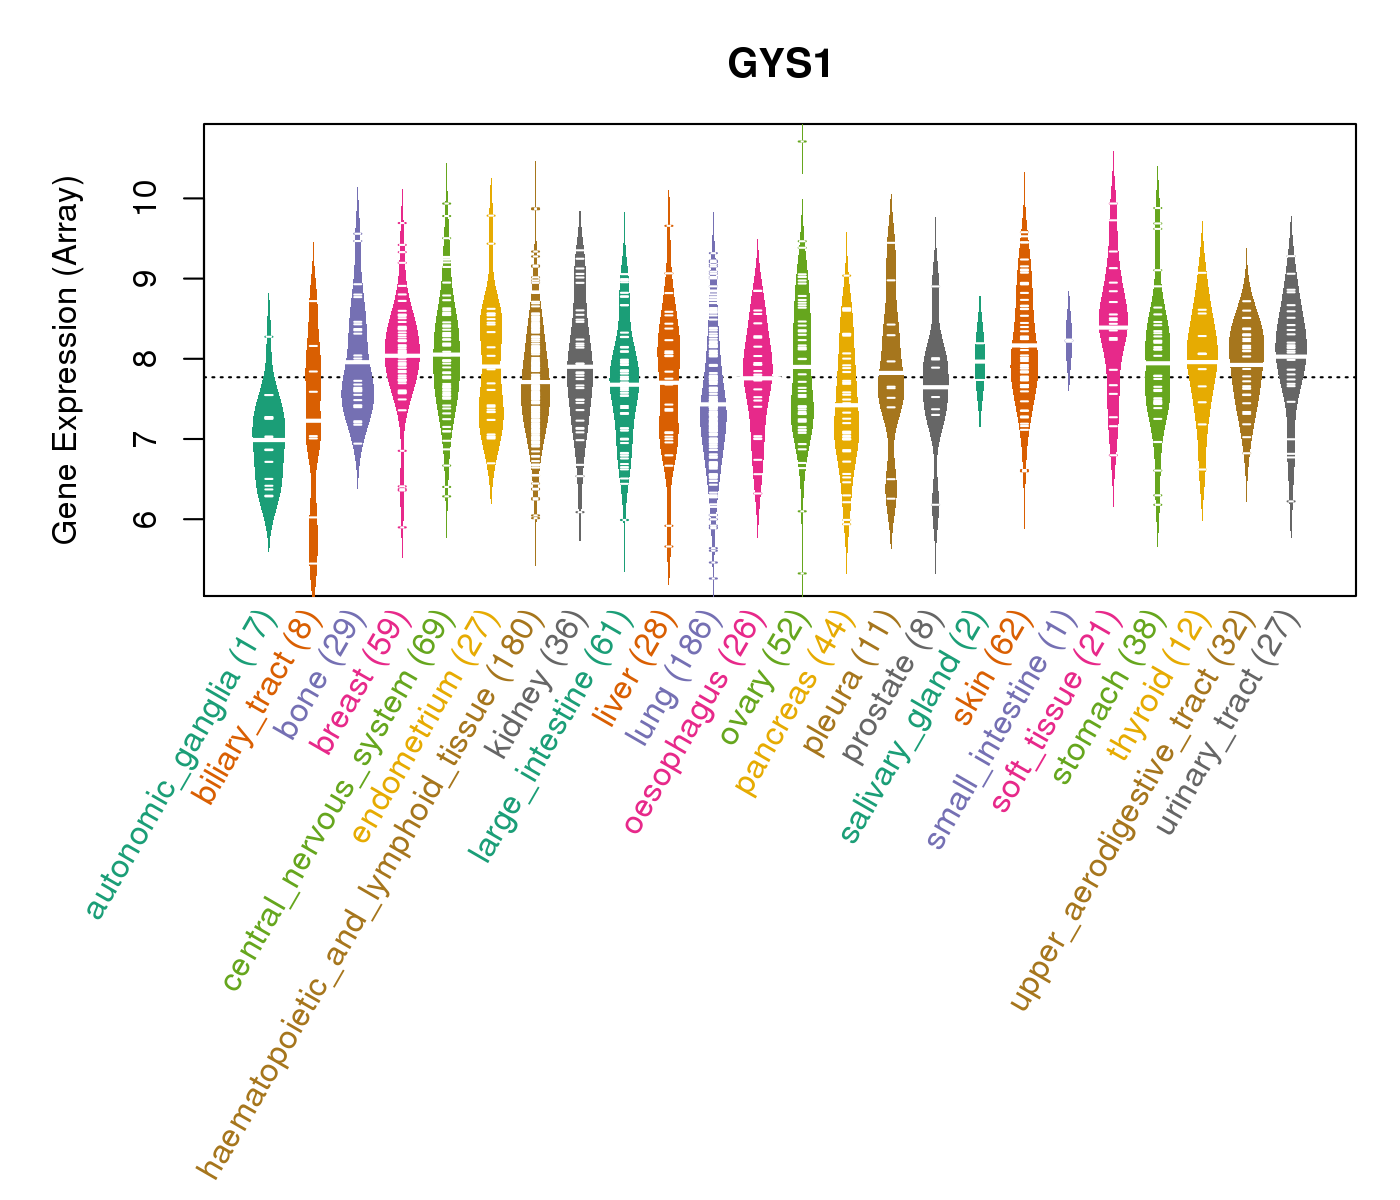
| * CCLE gene expression data were extracted from CCLE_Expression_Entrez_2012-10-18.res: Gene-centric RMA-normalized mRNA expression data. |
 |
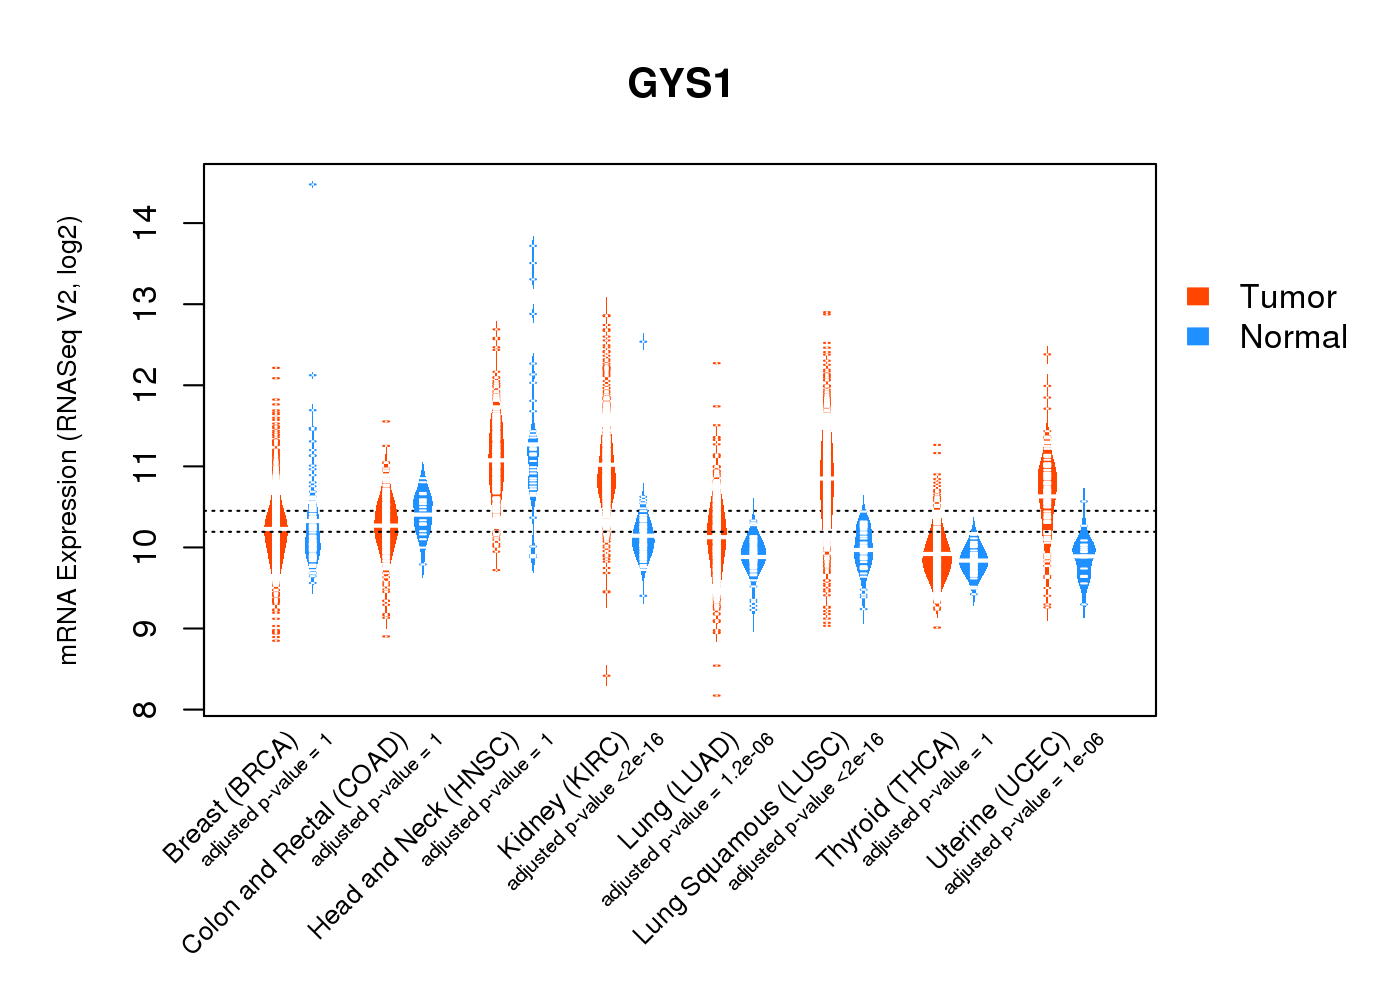
| * Normalized gene expression data of RNASeqV2 was extracted from TCGA using R package TCGA-Assembler. The URLs of all public data files on TCGA DCC data server were gathered at Jan-05-2015. Only eight cancer types have enough normal control samples for differential expression analysis. (t test, adjusted p<0.05 (using Benjamini-Hochberg FDR)) |
 |
| Top |
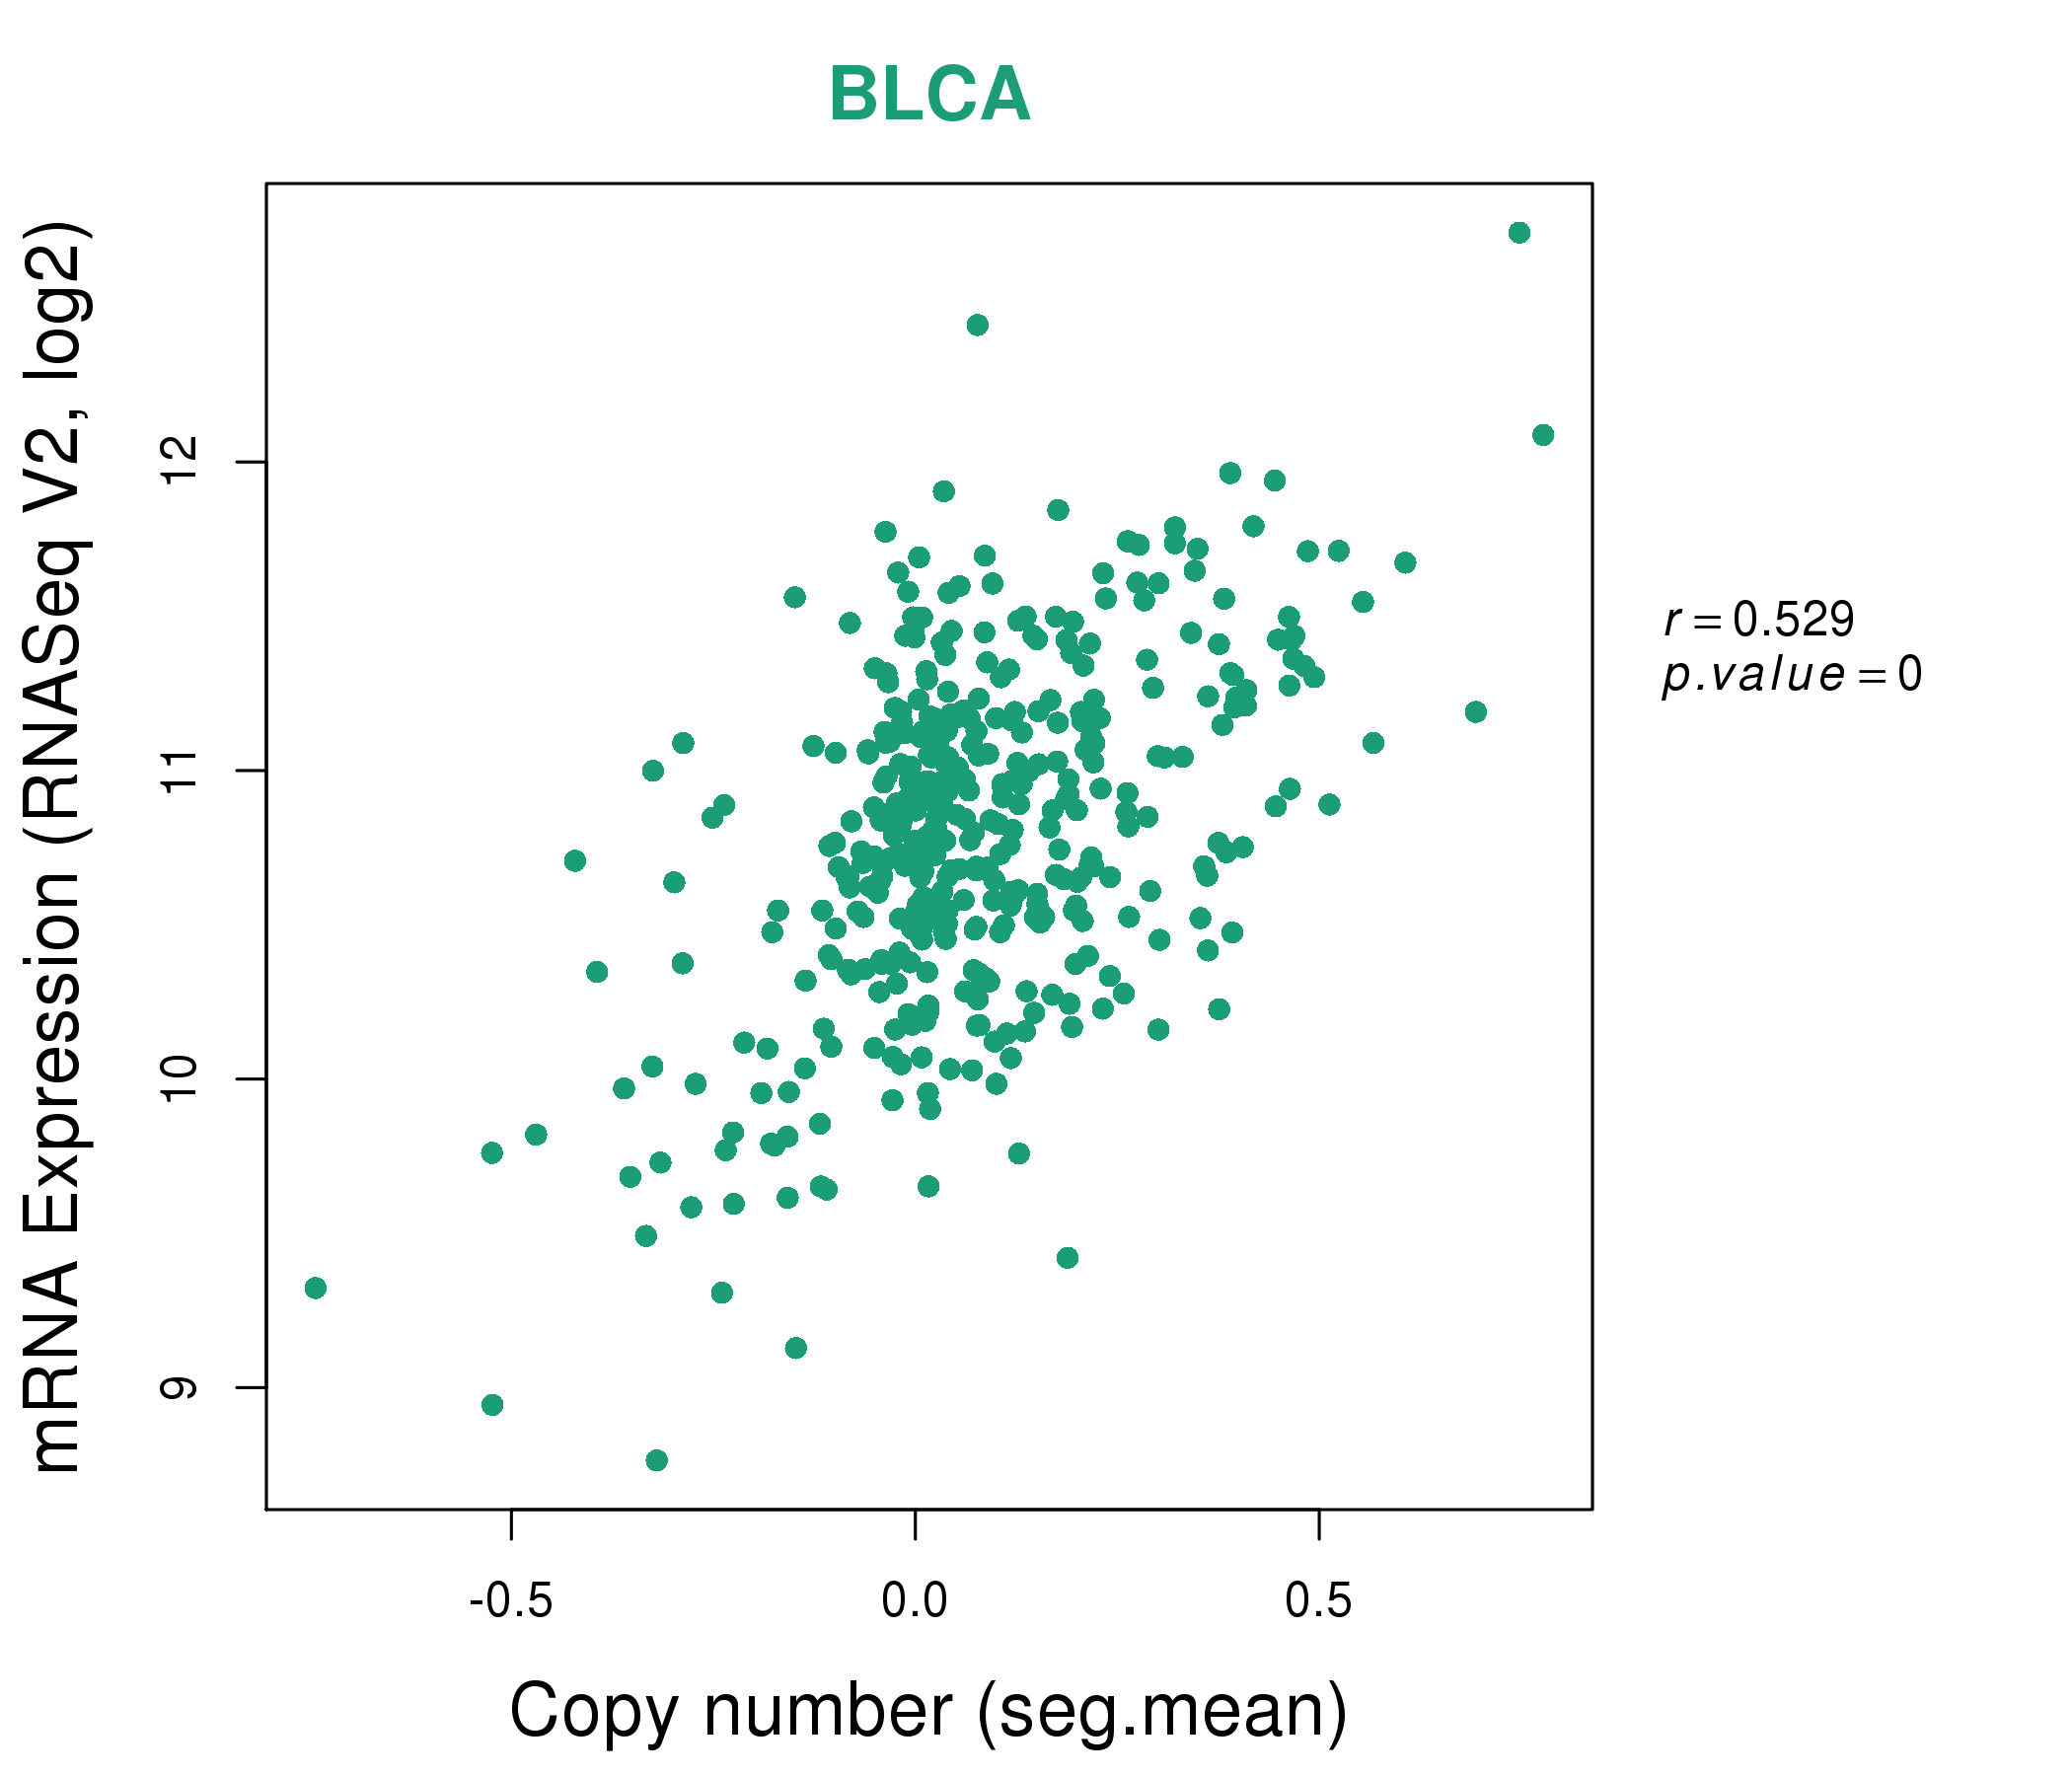
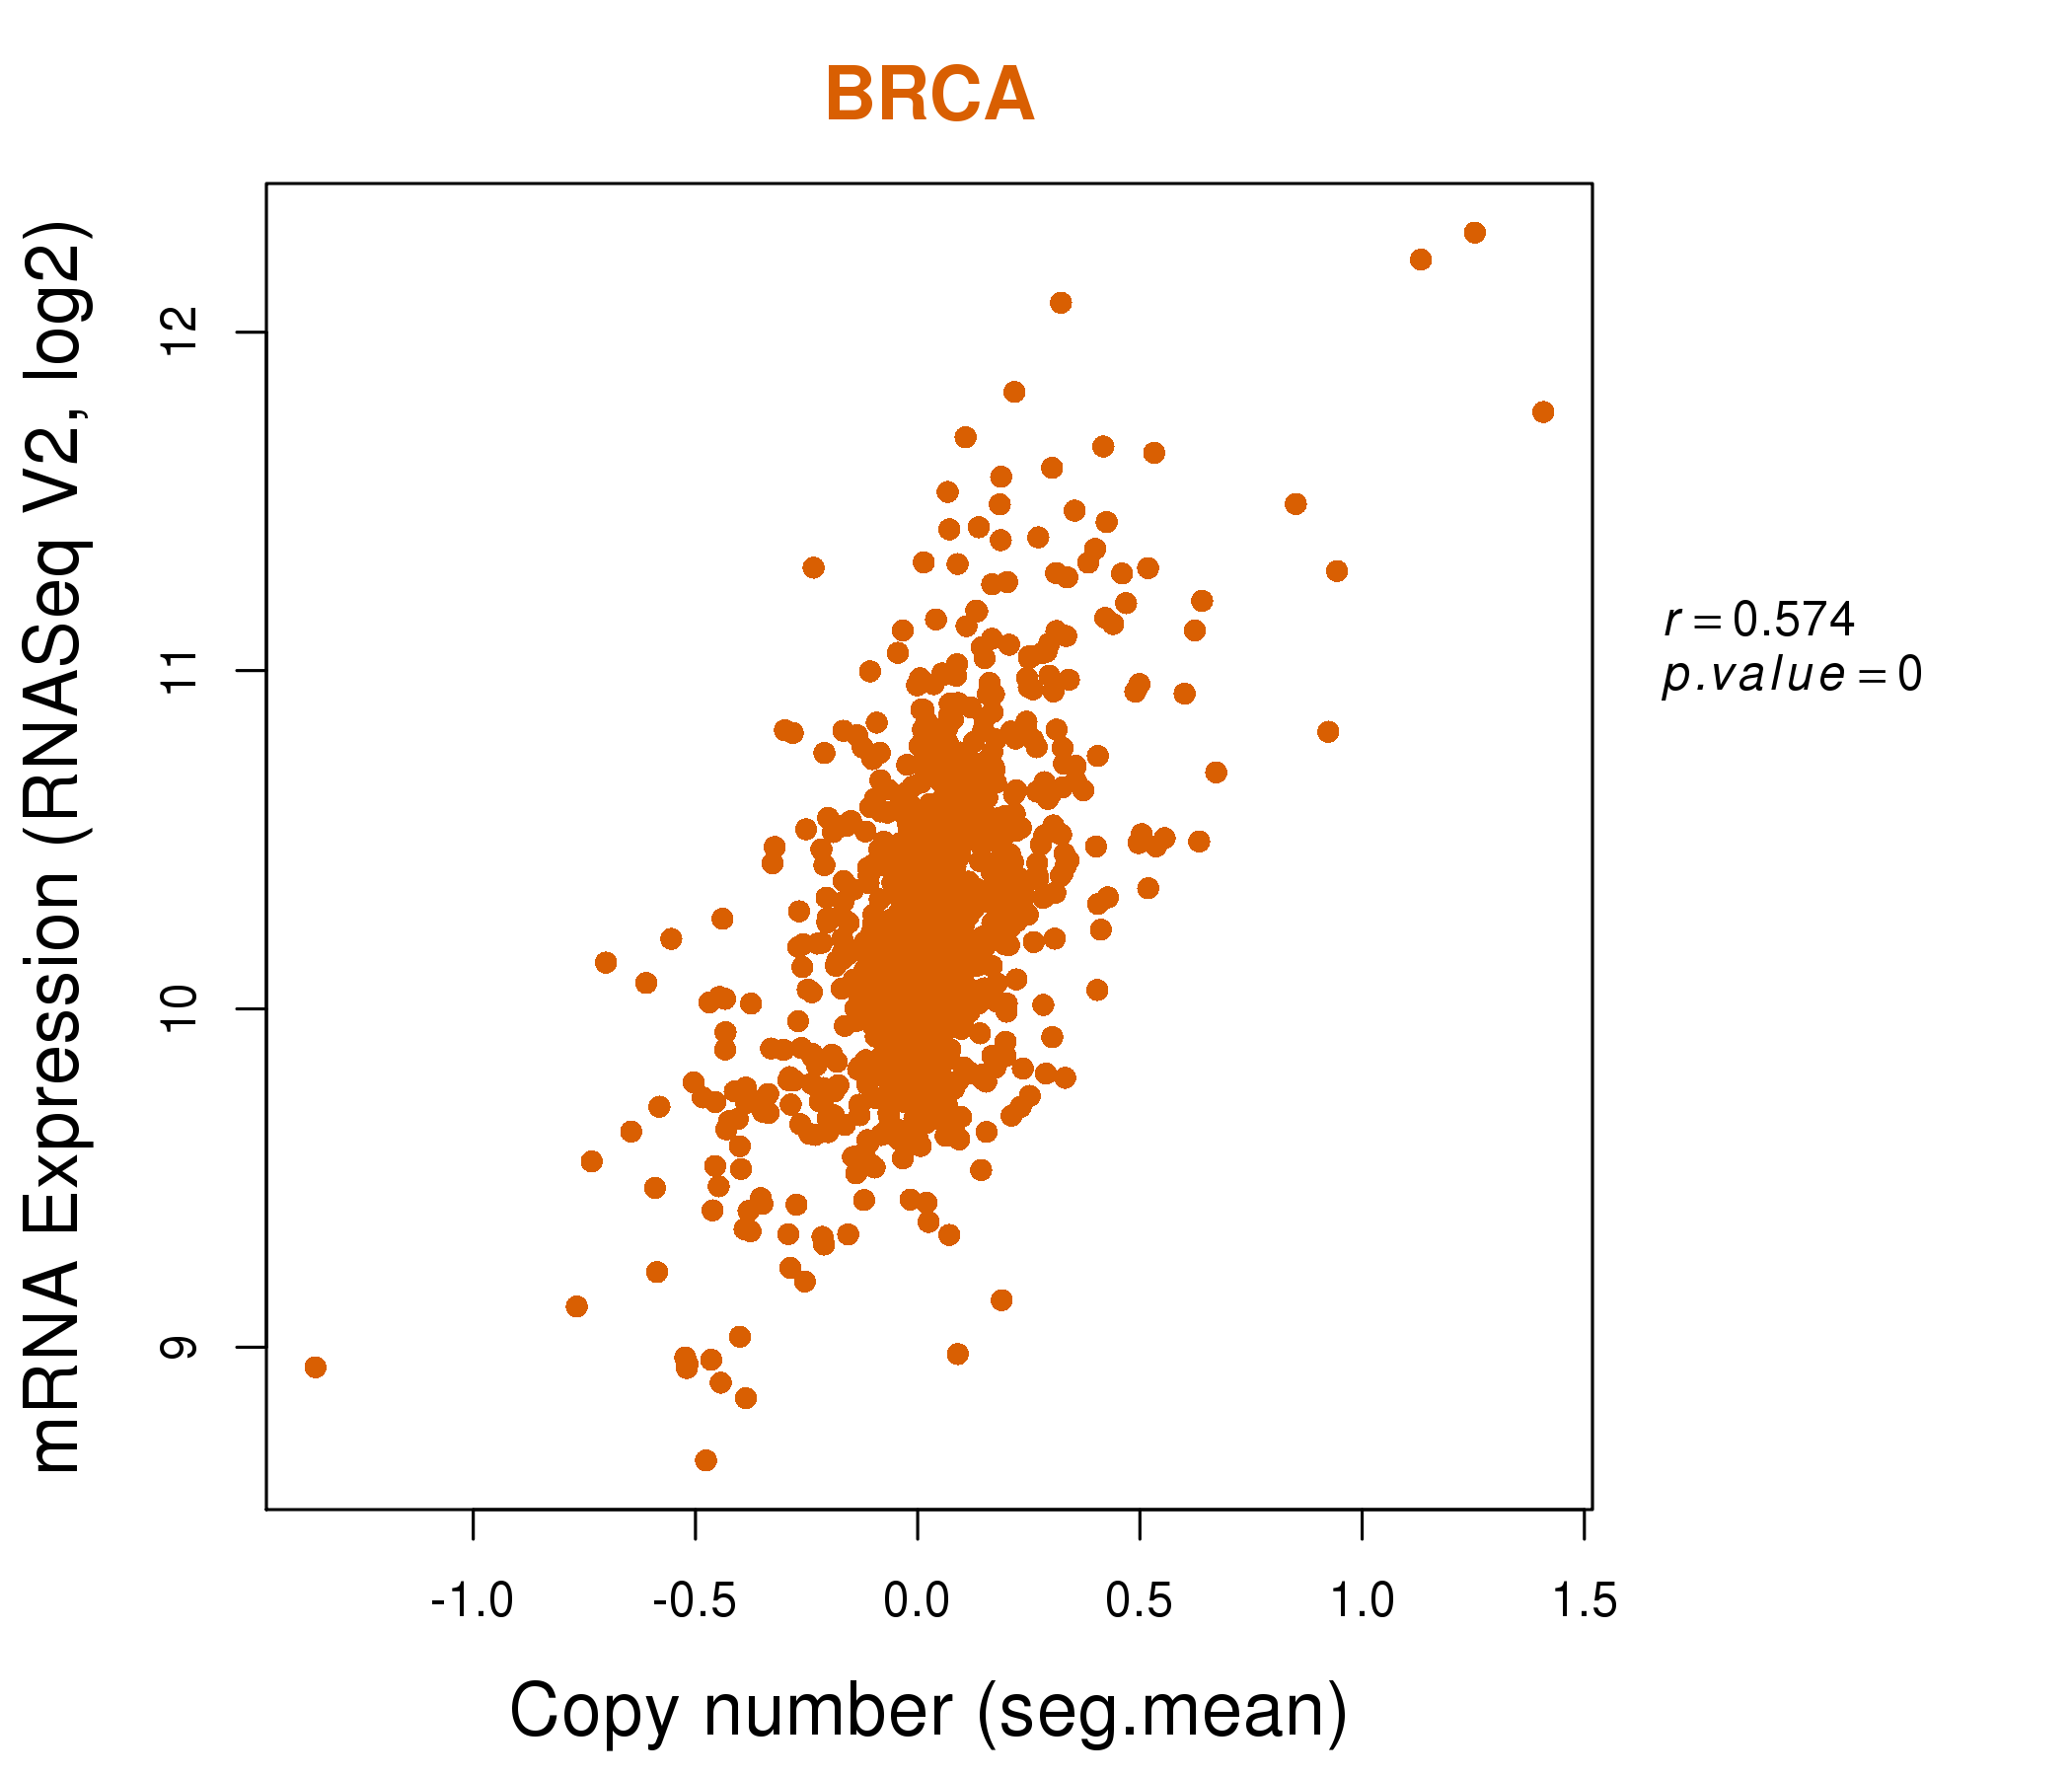
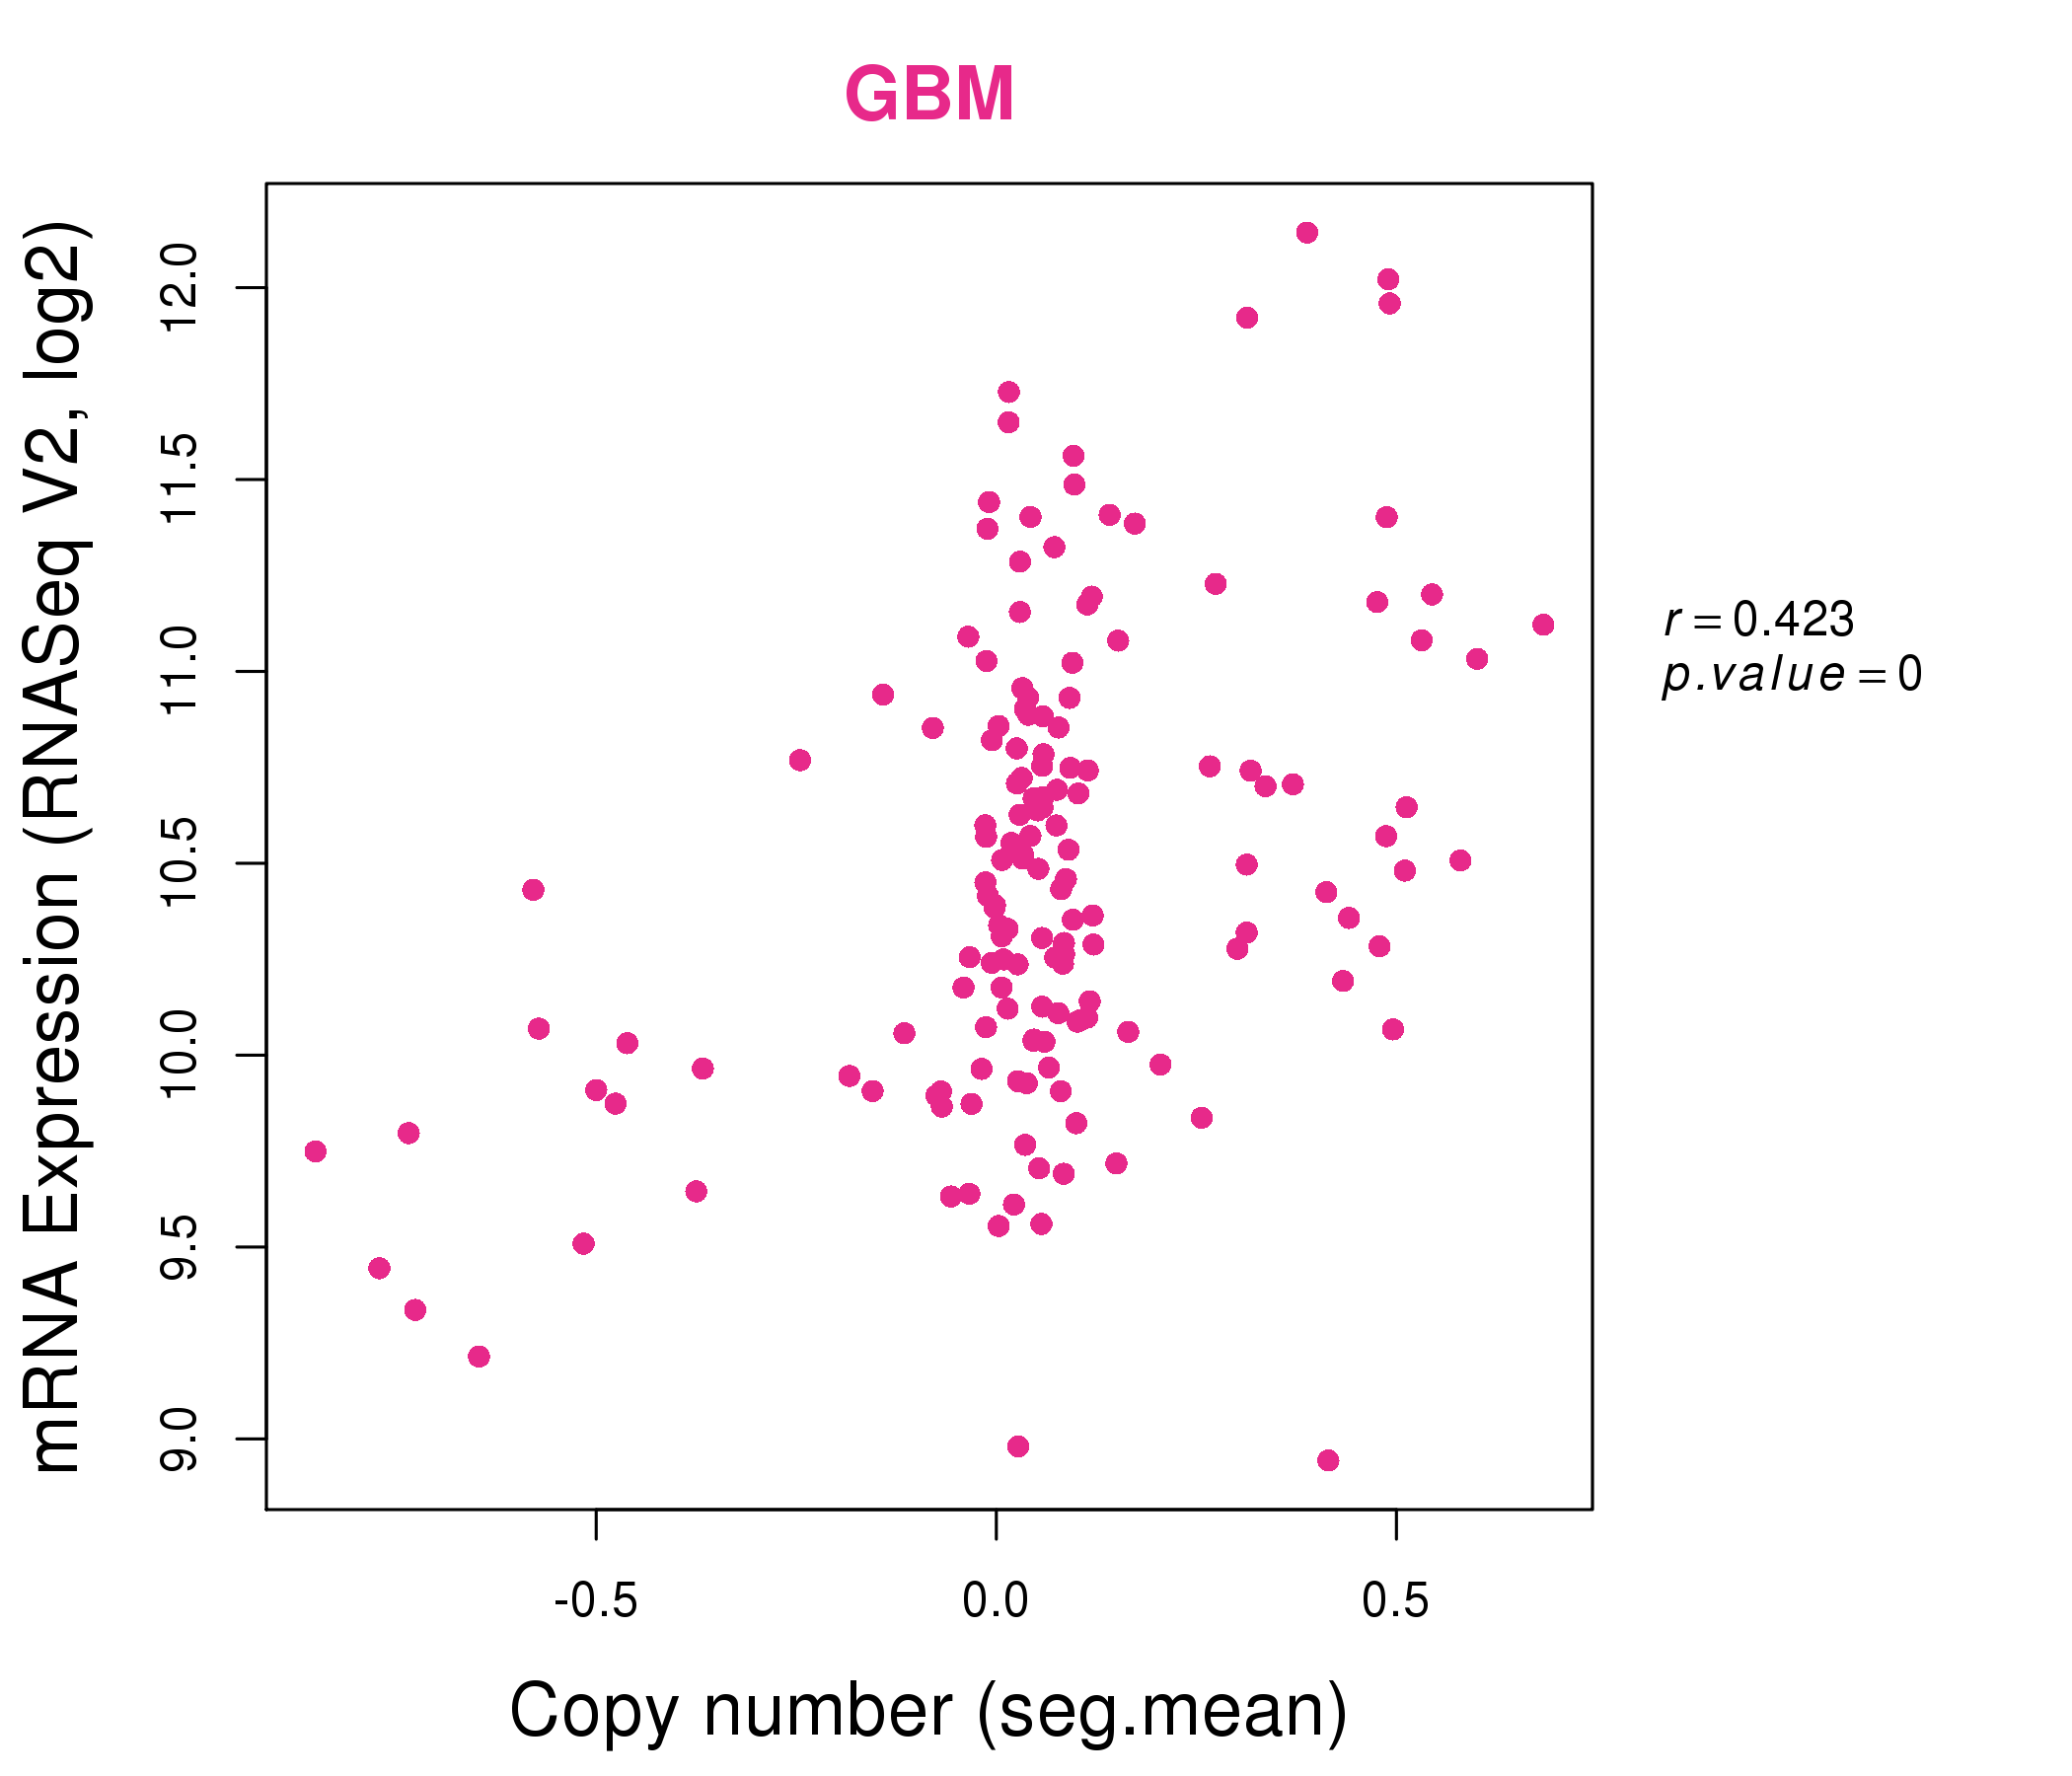
| * This plots show the correlation between CNV and gene expression. |
: Open all plots for all cancer types
 |
|
 |
|
| Top |
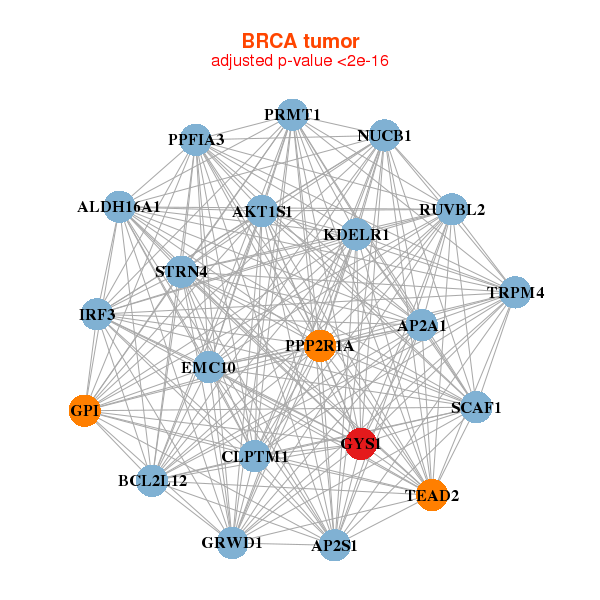
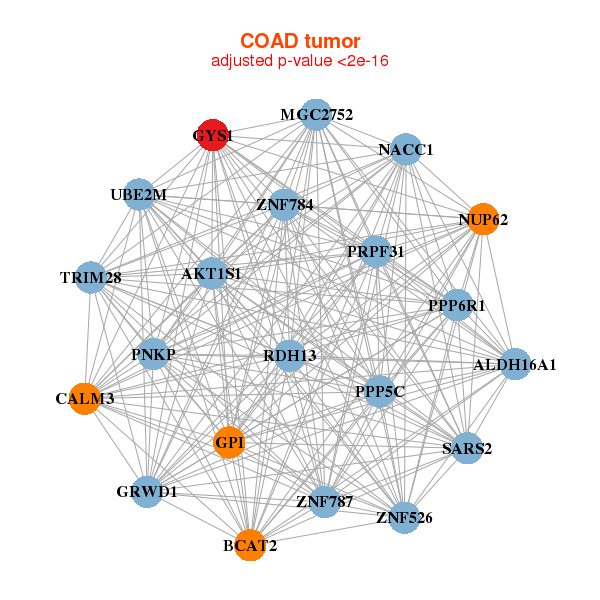
| Gene-Gene Network Information |
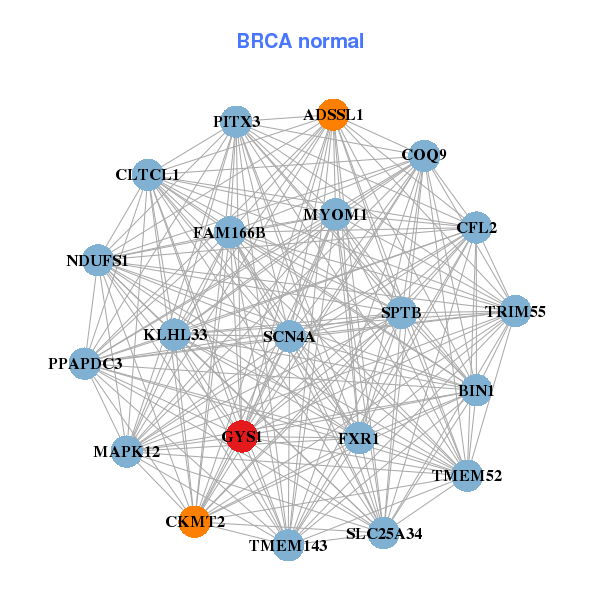
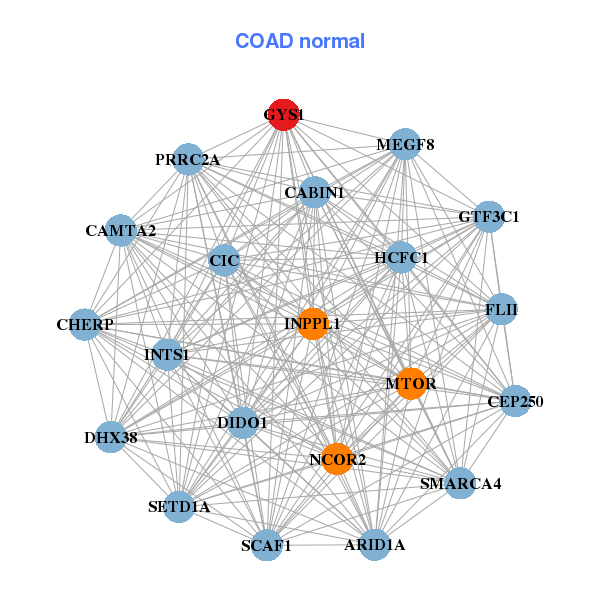
| * Co-Expression network figures were drawn using R package igraph. Only the top 20 genes with the highest correlations were shown. Red circle: input gene, orange circle: cell metabolism gene, sky circle: other gene |
: Open all plots for all cancer types
 |
|
| AKT1S1,ALDH16A1,AP2A1,AP2S1,BCL2L12,EMC10,CLPTM1, GPI,GRWD1,GYS1,IRF3,KDELR1,NUCB1,PPFIA3, PPP2R1A,PRMT1,RUVBL2,SCAF1,STRN4,TEAD2,TRPM4 | ADSSL1,BIN1,CFL2,CKMT2,CLTCL1,COQ9,FAM166B, FXR1,GYS1,KLHL33,MAPK12,MYOM1,NDUFS1,PITX3, PPAPDC3,SCN4A,SLC25A34,SPTB,TMEM143,TMEM52,TRIM55 |
 |
|
| AKT1S1,ALDH16A1,BCAT2,CALM3,GPI,GRWD1,GYS1, MGC2752,NACC1,NUP62,PNKP,PPP5C,PRPF31,RDH13, PPP6R1,SARS2,TRIM28,UBE2M,ZNF526,ZNF784,ZNF787 | ARID1A,PRRC2A,CABIN1,CAMTA2,CEP250,CHERP,CIC, DHX38,DIDO1,FLII,GTF3C1,GYS1,HCFC1,INPPL1, INTS1,MEGF8,MTOR,NCOR2,SCAF1,SETD1A,SMARCA4 |
| * Co-Expression network figures were drawn using R package igraph. Only the top 20 genes with the highest correlations were shown. Red circle: input gene, orange circle: cell metabolism gene, sky circle: other gene |
: Open all plots for all cancer types
| Top |
: Open all interacting genes' information including KEGG pathway for all interacting genes from DAVID
| Top |
| Pharmacological Information for GYS1 |
| There's no related Drug. |
| Top |
| Cross referenced IDs for GYS1 |
| * We obtained these cross-references from Uniprot database. It covers 150 different DBs, 18 categories. http://www.uniprot.org/help/cross_references_section |
: Open all cross reference information
|
Copyright © 2016-Present - The Univsersity of Texas Health Science Center at Houston @ |