|
|||||||||||||||||||||||||||||||||||||||||||||||||||||||||||||||||||||||||||||||||||||||||||||||||||||||||||||||||||||||||||||||||||||||||||||||||||||||||||||||||||||||||||||||||||||||||||||||||||||||||||||||||||||||||||||||||||||||||||||||||||||||||||||||||||||||||||||||||||||||||||||||||||||||||||||||||||||||||||||||||||||||||||||
| |
| Phenotypic Information (metabolism pathway, cancer, disease, phenome) |
| |
| |
| Gene-Gene Network Information: Co-Expression Network, Interacting Genes & KEGG |
| |
|


| Gene Summary for GYS2 |
| Basic gene info. | Gene symbol | GYS2 |
| Gene name | glycogen synthase 2 (liver) | |
| Synonyms | - | |
| Cytomap | UCSC genome browser: 12p12.2 | |
| Genomic location | chr12 :21689122-21757781 | |
| Type of gene | protein-coding | |
| RefGenes | NM_021957.3, | |
| Ensembl id | ENSG00000111713 | |
| Description | glycogen [starch] synthase, liver | |
| Modification date | 20141207 | |
| dbXrefs | MIM : 138571 | |
| HGNC : HGNC | ||
| Ensembl : ENSG00000111713 | ||
| HPRD : 00722 | ||
| Vega : OTTHUMG00000169135 | ||
| Protein | UniProt: go to UniProt's Cross Reference DB Table | |
| Expression | CleanEX: HS_GYS2 | |
| BioGPS: 2998 | ||
| Gene Expression Atlas: ENSG00000111713 | ||
| The Human Protein Atlas: ENSG00000111713 | ||
| Pathway | NCI Pathway Interaction Database: GYS2 | |
| KEGG: GYS2 | ||
| REACTOME: GYS2 | ||
| ConsensusPathDB | ||
| Pathway Commons: GYS2 | ||
| Metabolism | MetaCyc: GYS2 | |
| HUMANCyc: GYS2 | ||
| Regulation | Ensembl's Regulation: ENSG00000111713 | |
| miRBase: chr12 :21,689,122-21,757,781 | ||
| TargetScan: NM_021957 | ||
| cisRED: ENSG00000111713 | ||
| Context | iHOP: GYS2 | |
| cancer metabolism search in PubMed: GYS2 | ||
| UCL Cancer Institute: GYS2 | ||
| Assigned class in ccmGDB | C | |
| Top |
| Phenotypic Information for GYS2(metabolism pathway, cancer, disease, phenome) |
| Cancer | CGAP: GYS2 |
| Familial Cancer Database: GYS2 | |
| * This gene is included in those cancer gene databases. |
|
|
|
|
|
|
| |||||||||||||||||||||||||||||||||||||||||||||||||||||||||||||||||||||||||||||||||||||||||||||||||||||||||||||||||||||||||||||||||||||||||||||||||||||||||||||||||||||||||||||||||||||||||||||||||||||||||||||||||||||||||||||||||||||||||||||||||||||||||||||||||||||||||||||||||||||||||||||||||||||||||||||||||||||||||||||||||||||||
Oncogene 1 | Significant driver gene in | ||||||||||||||||||||||||||||||||||||||||||||||||||||||||||||||||||||||||||||||||||||||||||||||||||||||||||||||||||||||||||||||||||||||||||||||||||||||||||||||||||||||||||||||||||||||||||||||||||||||||||||||||||||||||||||||||||||||||||||||||||||||||||||||||||||||||||||||||||||||||||||||||||||||||||||||||||||||||||||||||||||||||||||
| cf) number; DB name 1 Oncogene; http://nar.oxfordjournals.org/content/35/suppl_1/D721.long, 2 Tumor Suppressor gene; https://bioinfo.uth.edu/TSGene/, 3 Cancer Gene Census; http://www.nature.com/nrc/journal/v4/n3/abs/nrc1299.html, 4 CancerGenes; http://nar.oxfordjournals.org/content/35/suppl_1/D721.long, 5 Network of Cancer Gene; http://ncg.kcl.ac.uk/index.php, 1Therapeutic Vulnerabilities in Cancer; http://cbio.mskcc.org/cancergenomics/statius/ |
| KEGG_STARCH_AND_SUCROSE_METABOLISM REACTOME_METABOLISM_OF_CARBOHYDRATES REACTOME_GLUCOSE_METABOLISM | |
| OMIM | |
| Orphanet | |
| Disease | KEGG Disease: GYS2 |
| MedGen: GYS2 (Human Medical Genetics with Condition) | |
| ClinVar: GYS2 | |
| Phenotype | MGI: GYS2 (International Mouse Phenotyping Consortium) |
| PhenomicDB: GYS2 | |
| Mutations for GYS2 |
| * Under tables are showing count per each tissue to give us broad intuition about tissue specific mutation patterns.You can go to the detailed page for each mutation database's web site. |
| - Statistics for Tissue and Mutation type | Top |
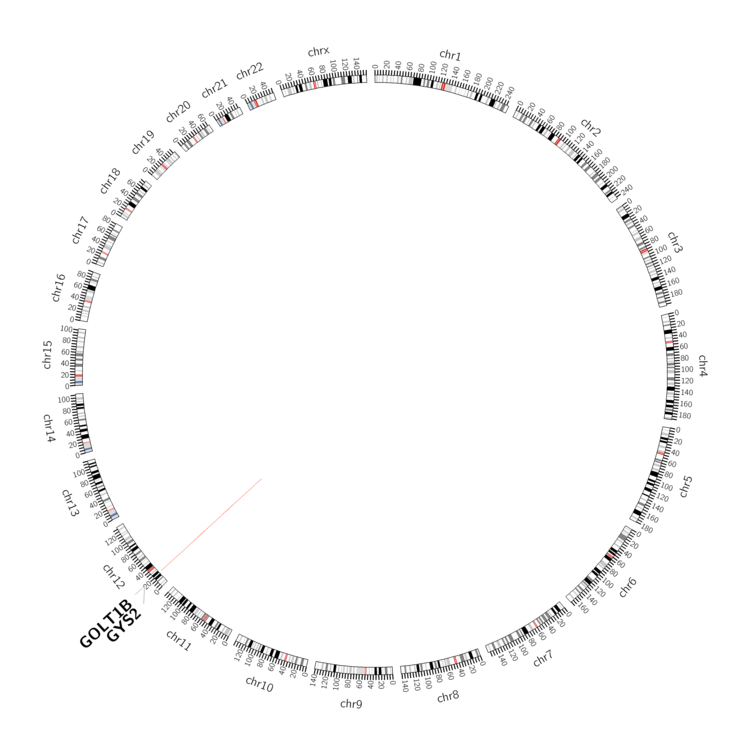 |
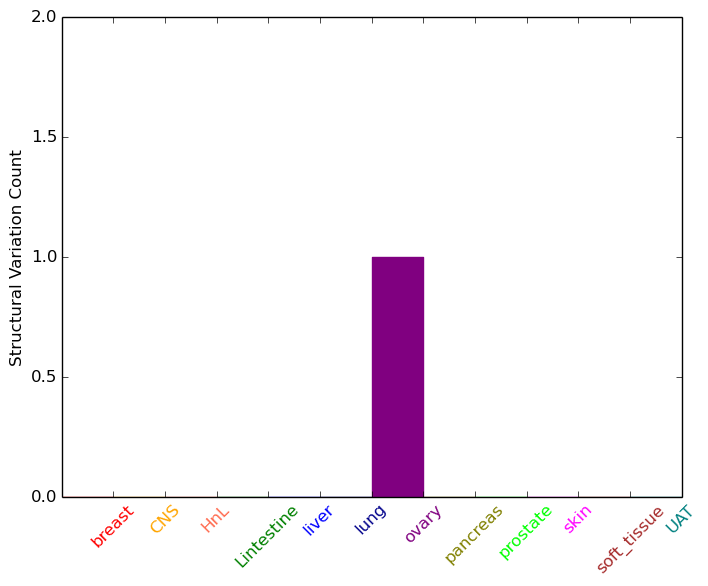
| - For Inter-chromosomal Variations |
| There's no inter-chromosomal structural variation. |
| - For Intra-chromosomal Variations |
| * Intra-chromosomal variantions includes 'intrachromosomal amplicon to amplicon', 'intrachromosomal amplicon to non-amplified dna', 'intrachromosomal deletion', 'intrachromosomal fold-back inversion', 'intrachromosomal inversion', 'intrachromosomal tandem duplication', 'Intrachromosomal unknown type', 'intrachromosomal with inverted orientation', 'intrachromosomal with non-inverted orientation'. |
 |
| Sample | Symbol_a | Chr_a | Start_a | End_a | Symbol_b | Chr_b | Start_b | End_b |
| ovary | GYS2 | chr12 | 21695379 | 21695399 | GOLT1B | chr12 | 21661409 | 21661429 |
| cf) Tissue number; Tissue name (1;Breast, 2;Central_nervous_system, 3;Haematopoietic_and_lymphoid_tissue, 4;Large_intestine, 5;Liver, 6;Lung, 7;Ovary, 8;Pancreas, 9;Prostate, 10;Skin, 11;Soft_tissue, 12;Upper_aerodigestive_tract) |
| * From mRNA Sanger sequences, Chitars2.0 arranged chimeric transcripts. This table shows GYS2 related fusion information. |
| ID | Head Gene | Tail Gene | Accession | Gene_a | qStart_a | qEnd_a | Chromosome_a | tStart_a | tEnd_a | Gene_a | qStart_a | qEnd_a | Chromosome_a | tStart_a | tEnd_a |
| BC070311 | SAA1 | 1 | 278 | 11 | 18287811 | 18291274 | GYS2 | 274 | 1184 | 12 | 21689127 | 21690037 | |
| BG563177 | SAA3P | 2 | 279 | 11 | 18134292 | 18270182 | GYS2 | 275 | 615 | 12 | 21689697 | 21690037 | |
| Top |
| Mutation type/ Tissue ID | brca | cns | cerv | endome | haematopo | kidn | Lintest | liver | lung | ns | ovary | pancre | prost | skin | stoma | thyro | urina | |||
| Total # sample | 1 | 3 | 3 | |||||||||||||||||
| GAIN (# sample) | 1 | 1 | 3 | |||||||||||||||||
| LOSS (# sample) | 2 |
| cf) Tissue ID; Tissue type (1; Breast, 2; Central_nervous_system, 3; Cervix, 4; Endometrium, 5; Haematopoietic_and_lymphoid_tissue, 6; Kidney, 7; Large_intestine, 8; Liver, 9; Lung, 10; NS, 11; Ovary, 12; Pancreas, 13; Prostate, 14; Skin, 15; Stomach, 16; Thyroid, 17; Urinary_tract) |
| Top |
|
 |
| Top |
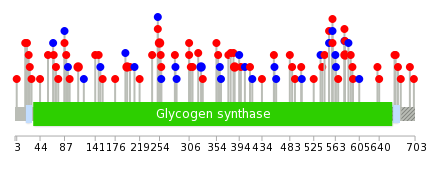
| Stat. for Non-Synonymous SNVs (# total SNVs=80) | (# total SNVs=24) |
 |  |
(# total SNVs=4) | (# total SNVs=1) |
 |  |
| Top |
| * When you move the cursor on each content, you can see more deailed mutation information on the Tooltip. Those are primary_site,primary_histology,mutation(aa),pubmedID. |
| GRCh37 position | Mutation(aa) | Unique sampleID count |
| chr12:21728965-21728965 | p.E110E | 3 |
| chr12:21716178-21716178 | p.R309* | 3 |
| chr12:21693414-21693414 | p.R580H | 3 |
| chr12:21711151-21711151 | p.R469S | 3 |
| chr12:21689968-21689968 | p.R678W | 3 |
| chr12:21689977-21689977 | p.E675* | 2 |
| chr12:21727167-21727167 | p.P197S | 2 |
| chr12:21721862-21721862 | p.V254M | 2 |
| chr12:21721868-21721868 | p.A252T | 2 |
| chr12:21715933-21715933 | p.F327F | 2 |
| Top |
|
 |
| Point Mutation/ Tissue ID | 1 | 2 | 3 | 4 | 5 | 6 | 7 | 8 | 9 | 10 | 11 | 12 | 13 | 14 | 15 | 16 | 17 | 18 | 19 | 20 |
| # sample | 4 | 3 | 17 | 1 | 6 | 3 | 2 | 6 | 7 | 3 | 21 | 6 | 1 | 13 | ||||||
| # mutation | 4 | 3 | 17 | 1 | 6 | 3 | 2 | 6 | 8 | 3 | 26 | 6 | 1 | 15 | ||||||
| nonsynonymous SNV | 3 | 1 | 14 | 5 | 1 | 2 | 5 | 4 | 3 | 19 | 3 | 12 | ||||||||
| synonymous SNV | 1 | 2 | 3 | 1 | 1 | 2 | 1 | 4 | 7 | 3 | 1 | 3 |
| cf) Tissue ID; Tissue type (1; BLCA[Bladder Urothelial Carcinoma], 2; BRCA[Breast invasive carcinoma], 3; CESC[Cervical squamous cell carcinoma and endocervical adenocarcinoma], 4; COAD[Colon adenocarcinoma], 5; GBM[Glioblastoma multiforme], 6; Glioma Low Grade, 7; HNSC[Head and Neck squamous cell carcinoma], 8; KICH[Kidney Chromophobe], 9; KIRC[Kidney renal clear cell carcinoma], 10; KIRP[Kidney renal papillary cell carcinoma], 11; LAML[Acute Myeloid Leukemia], 12; LUAD[Lung adenocarcinoma], 13; LUSC[Lung squamous cell carcinoma], 14; OV[Ovarian serous cystadenocarcinoma ], 15; PAAD[Pancreatic adenocarcinoma], 16; PRAD[Prostate adenocarcinoma], 17; SKCM[Skin Cutaneous Melanoma], 18:STAD[Stomach adenocarcinoma], 19:THCA[Thyroid carcinoma], 20:UCEC[Uterine Corpus Endometrial Carcinoma]) |
| Top |
| * We represented just top 10 SNVs. When you move the cursor on each content, you can see more deailed mutation information on the Tooltip. Those are primary_site, primary_histology, mutation(aa), pubmedID. |
| Genomic Position | Mutation(aa) | Unique sampleID count |
| chr12:21715933 | p.G111E | 2 |
| chr12:21721862 | p.R580H | 2 |
| chr12:21713332 | p.V254M | 2 |
| chr12:21693497 | p.F327F | 2 |
| chr12:21716187 | p.P197S | 2 |
| chr12:21693414 | p.I552M | 2 |
| chr12:21728963 | p.D306N | 2 |
| chr12:21727167 | p.R386Q | 2 |
| chr12:21699315 | p.G141D | 1 |
| chr12:21721852 | p.P24S | 1 |
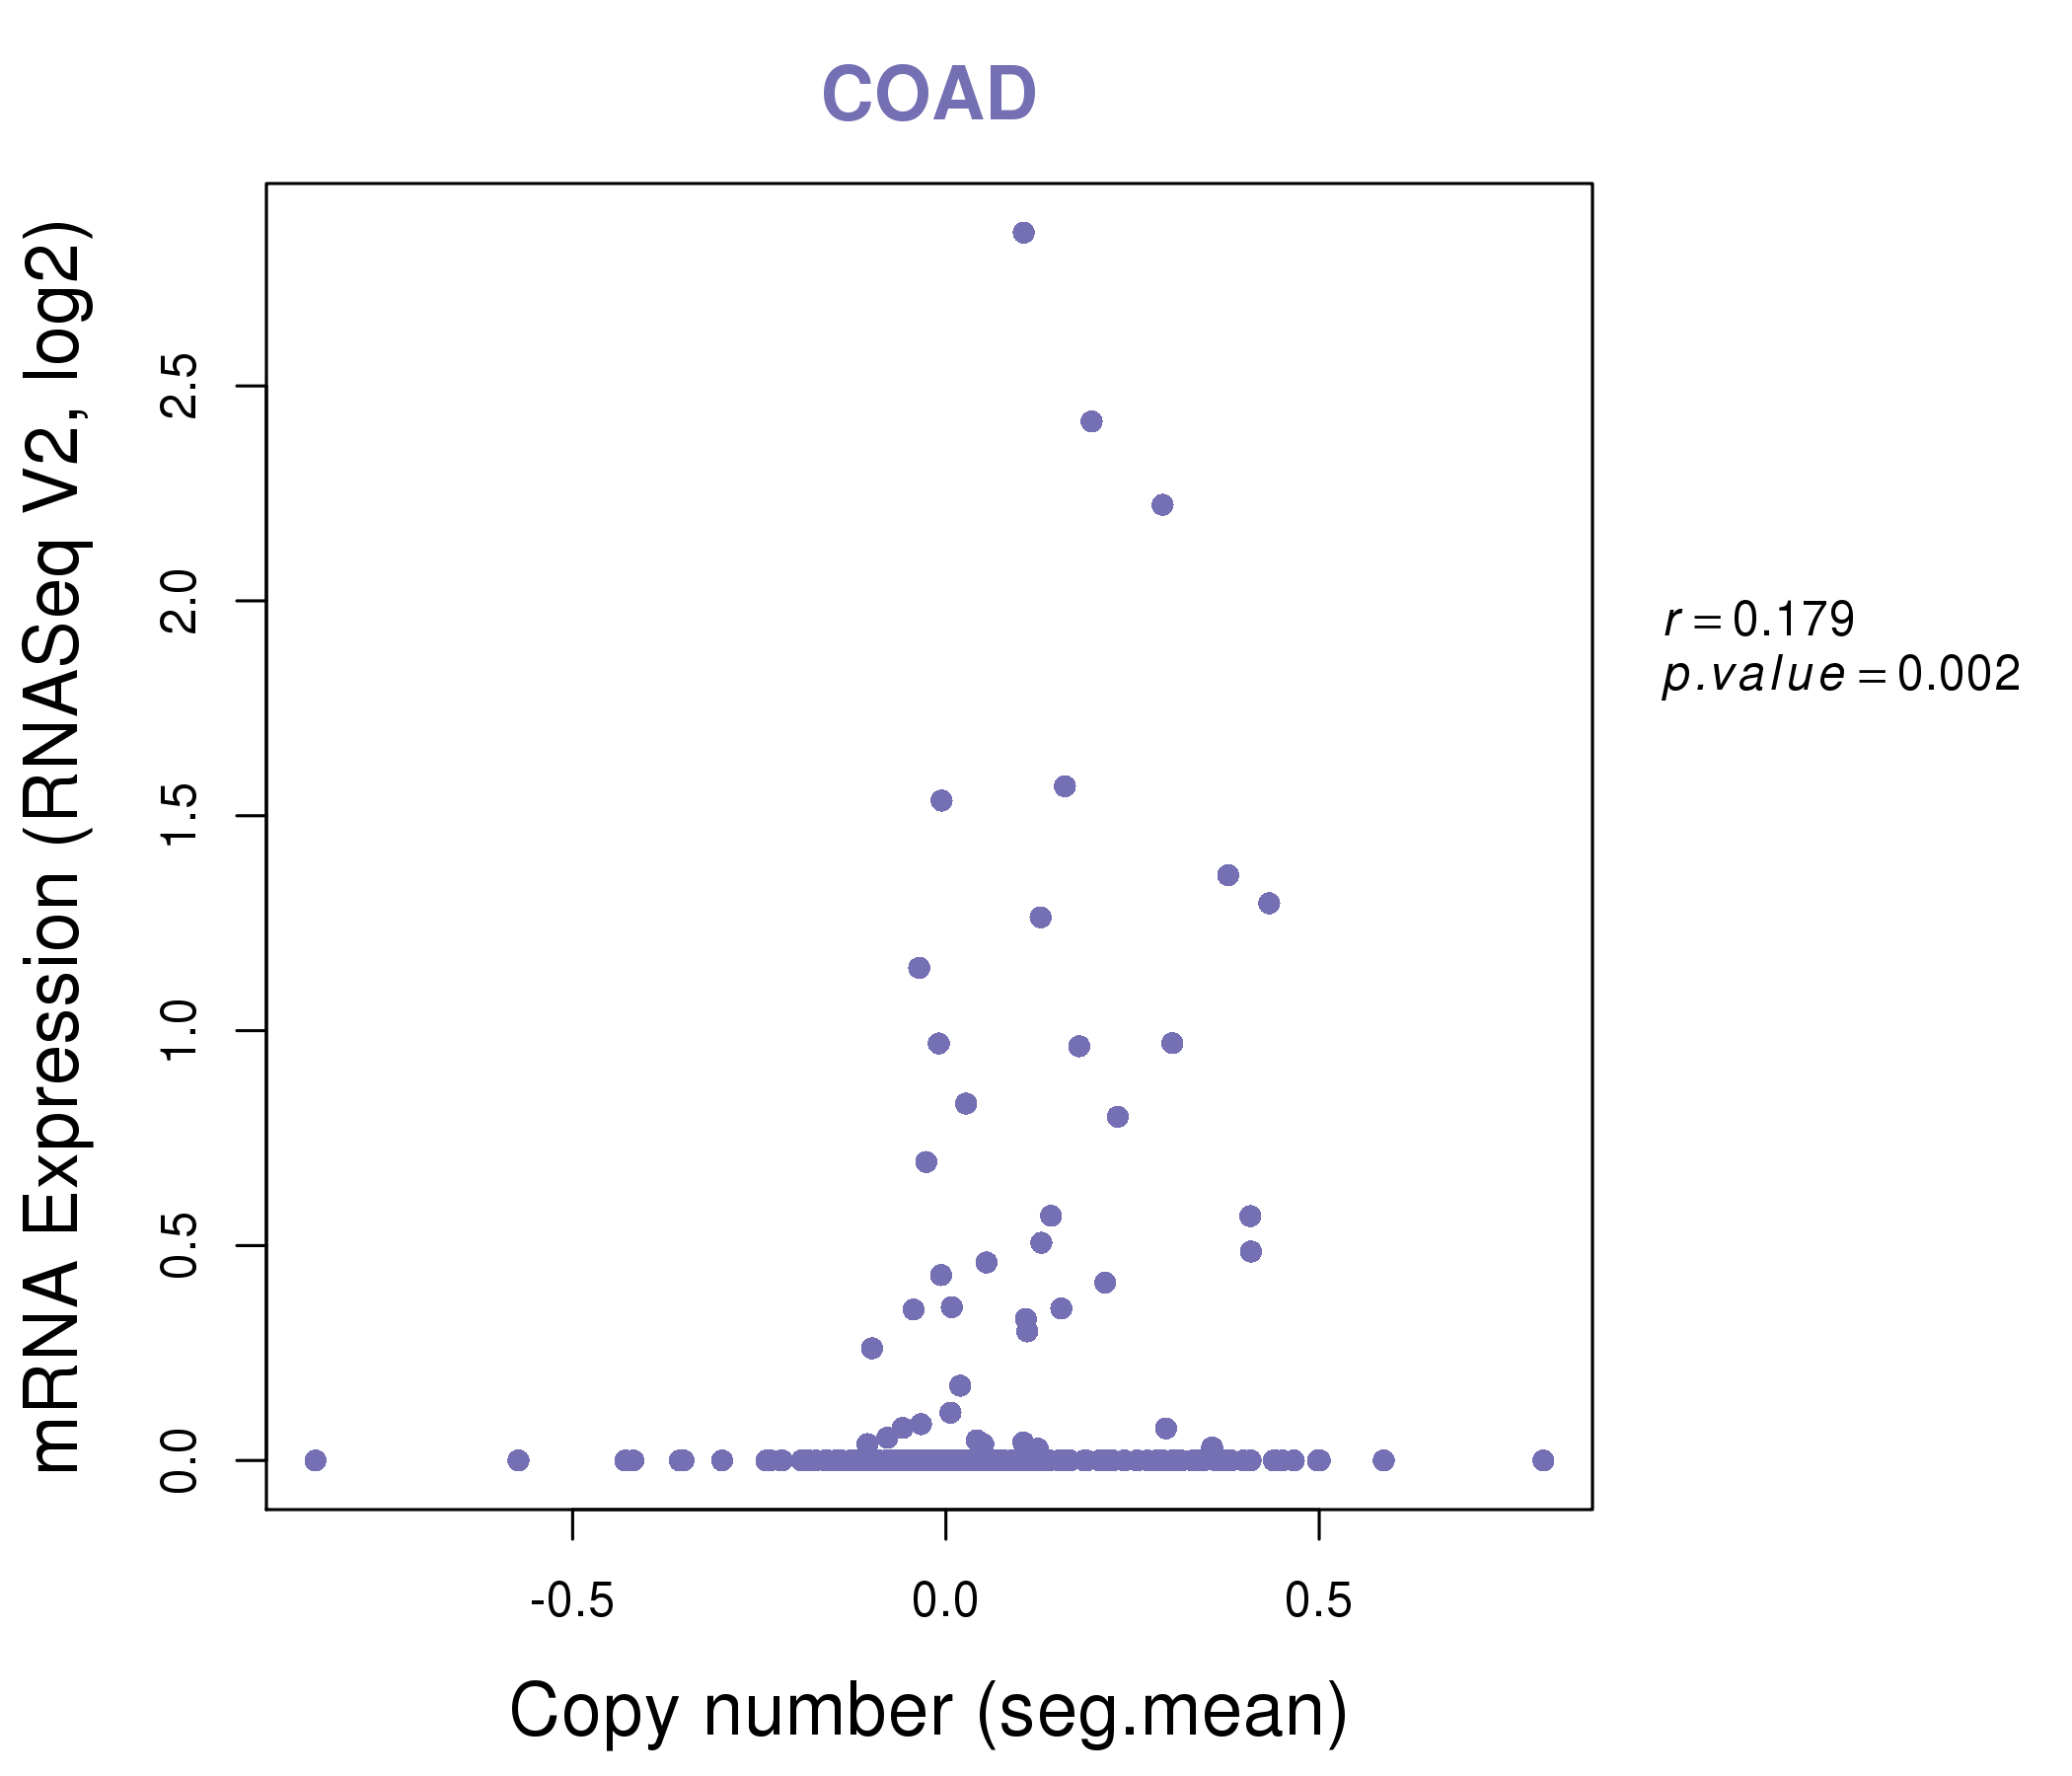
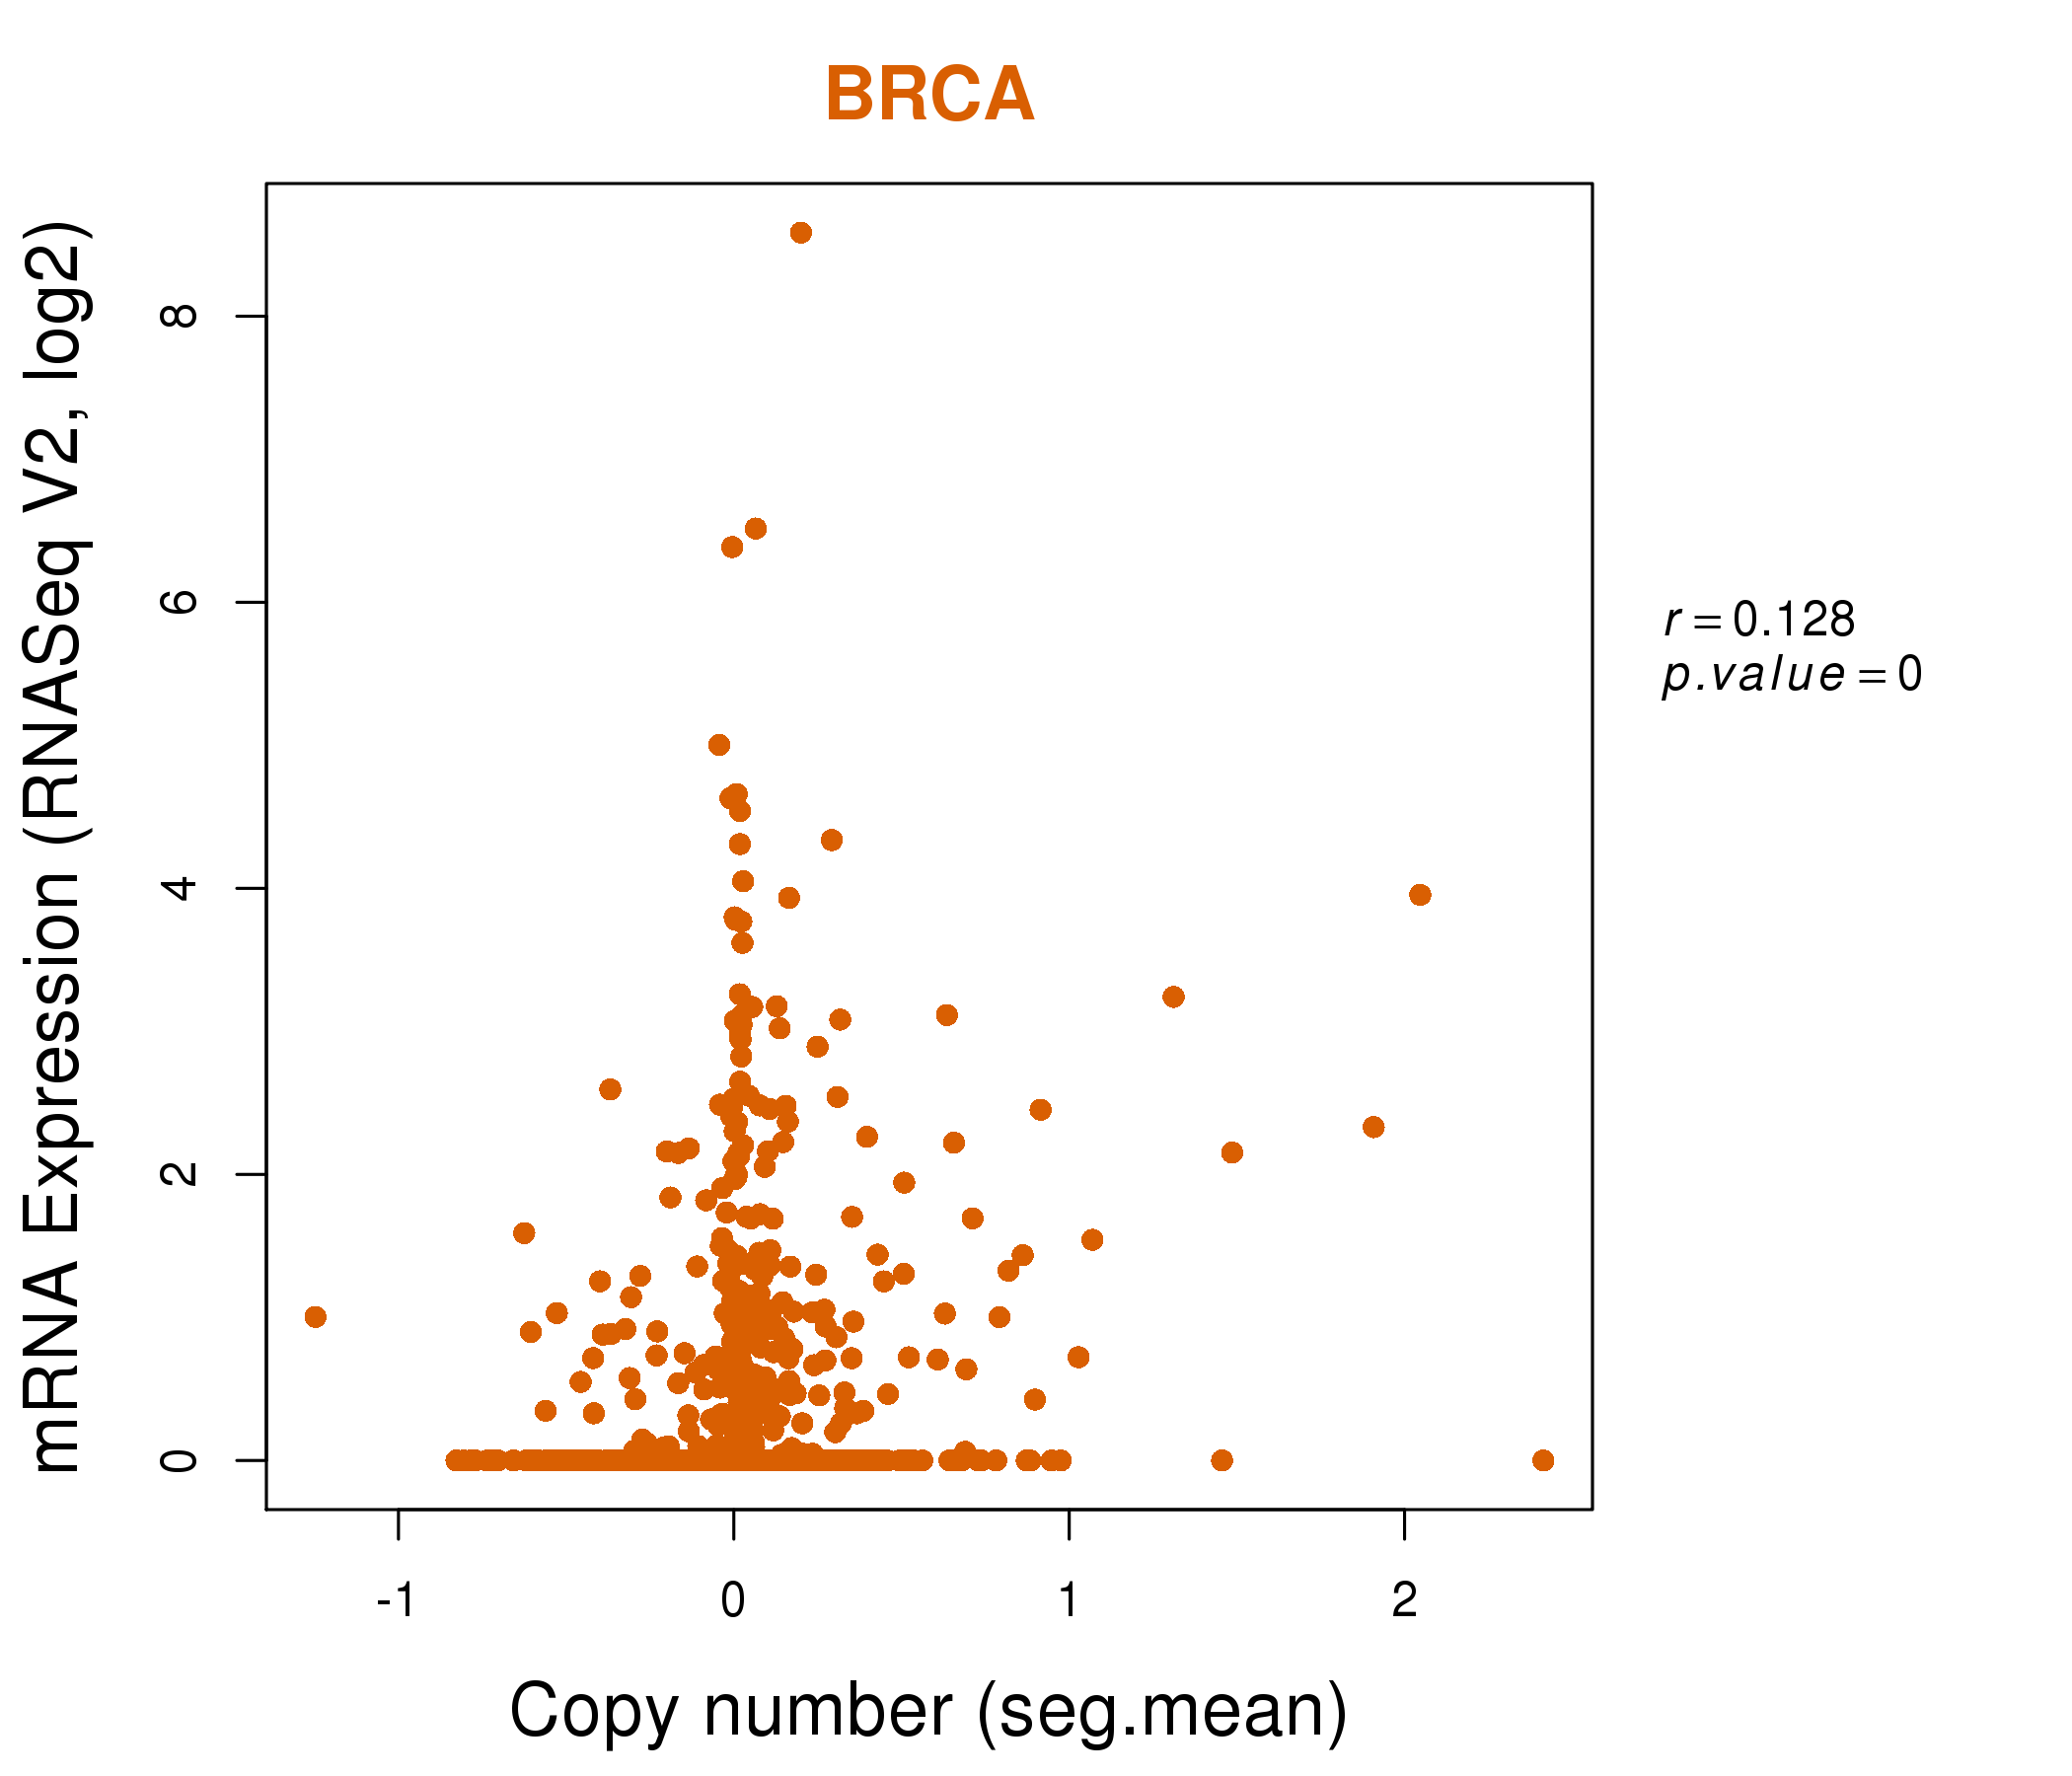
| * Copy number data were extracted from TCGA using R package TCGA-Assembler. The URLs of all public data files on TCGA DCC data server were gathered on Jan-05-2015. Function ProcessCNAData in TCGA-Assembler package was used to obtain gene-level copy number value which is calculated as the average copy number of the genomic region of a gene. |
 |
| cf) Tissue ID[Tissue type]: BLCA[Bladder Urothelial Carcinoma], BRCA[Breast invasive carcinoma], CESC[Cervical squamous cell carcinoma and endocervical adenocarcinoma], COAD[Colon adenocarcinoma], GBM[Glioblastoma multiforme], Glioma Low Grade, HNSC[Head and Neck squamous cell carcinoma], KICH[Kidney Chromophobe], KIRC[Kidney renal clear cell carcinoma], KIRP[Kidney renal papillary cell carcinoma], LAML[Acute Myeloid Leukemia], LUAD[Lung adenocarcinoma], LUSC[Lung squamous cell carcinoma], OV[Ovarian serous cystadenocarcinoma ], PAAD[Pancreatic adenocarcinoma], PRAD[Prostate adenocarcinoma], SKCM[Skin Cutaneous Melanoma], STAD[Stomach adenocarcinoma], THCA[Thyroid carcinoma], UCEC[Uterine Corpus Endometrial Carcinoma] |
| Top |
| Gene Expression for GYS2 |
| * CCLE gene expression data were extracted from CCLE_Expression_Entrez_2012-10-18.res: Gene-centric RMA-normalized mRNA expression data. |
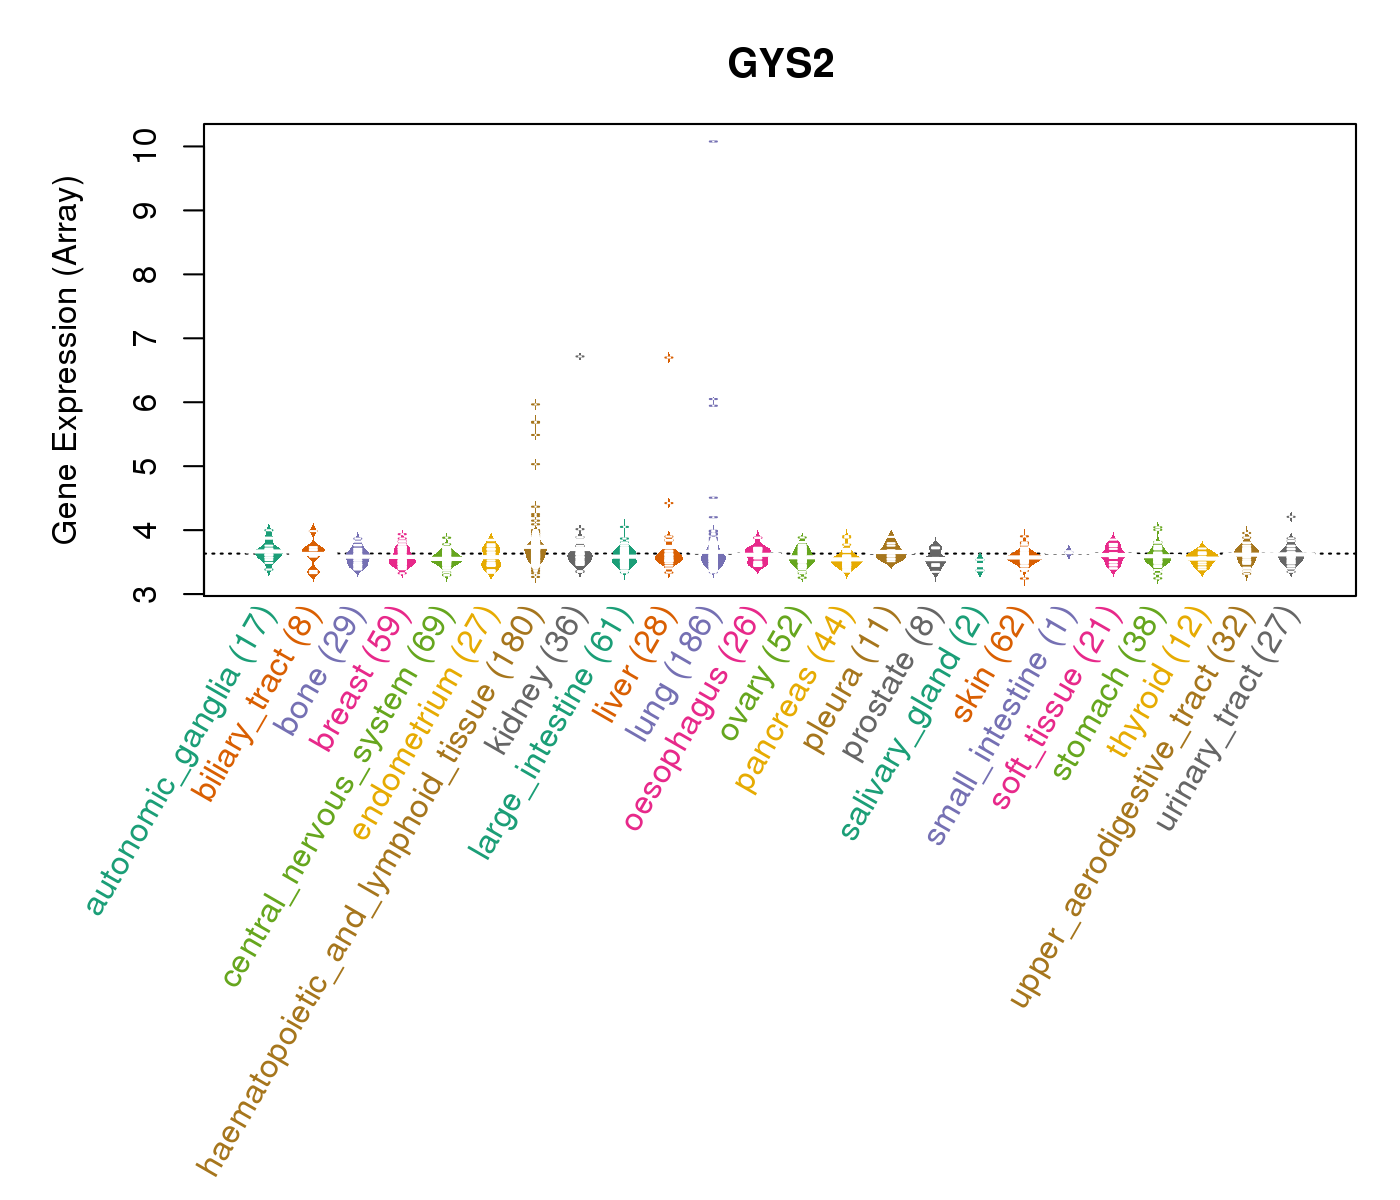 |
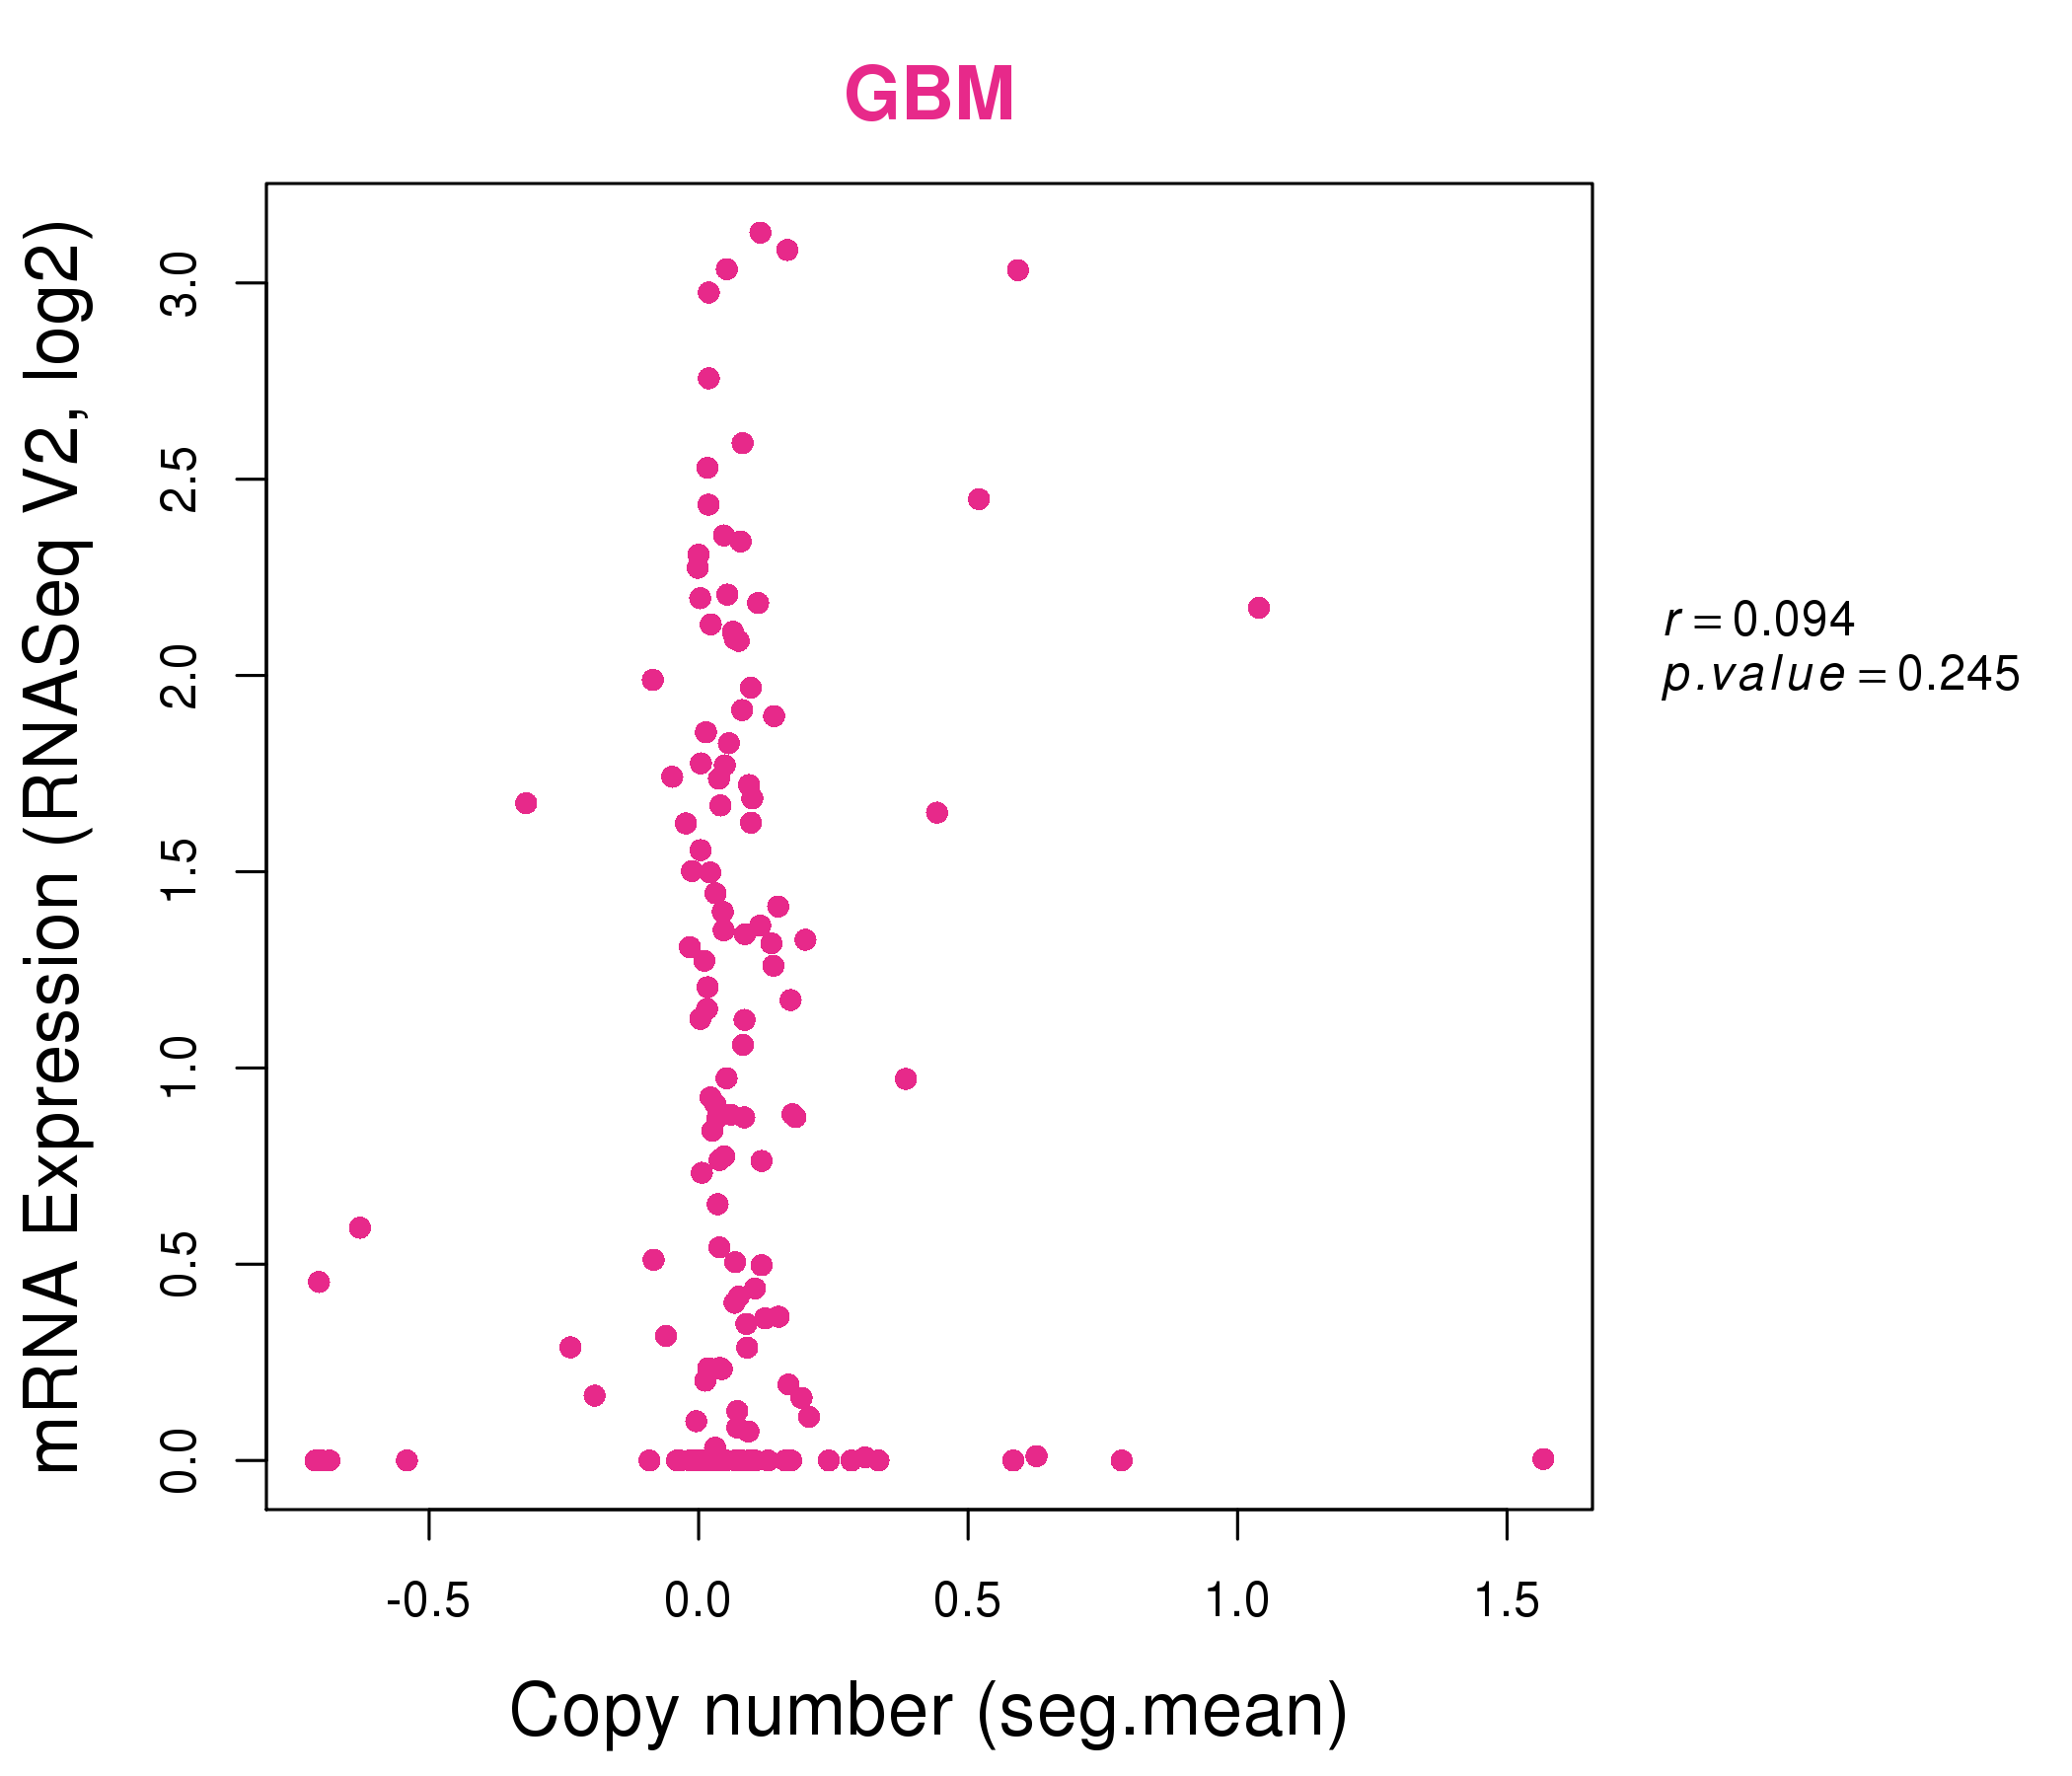
| * Normalized gene expression data of RNASeqV2 was extracted from TCGA using R package TCGA-Assembler. The URLs of all public data files on TCGA DCC data server were gathered at Jan-05-2015. Only eight cancer types have enough normal control samples for differential expression analysis. (t test, adjusted p<0.05 (using Benjamini-Hochberg FDR)) |
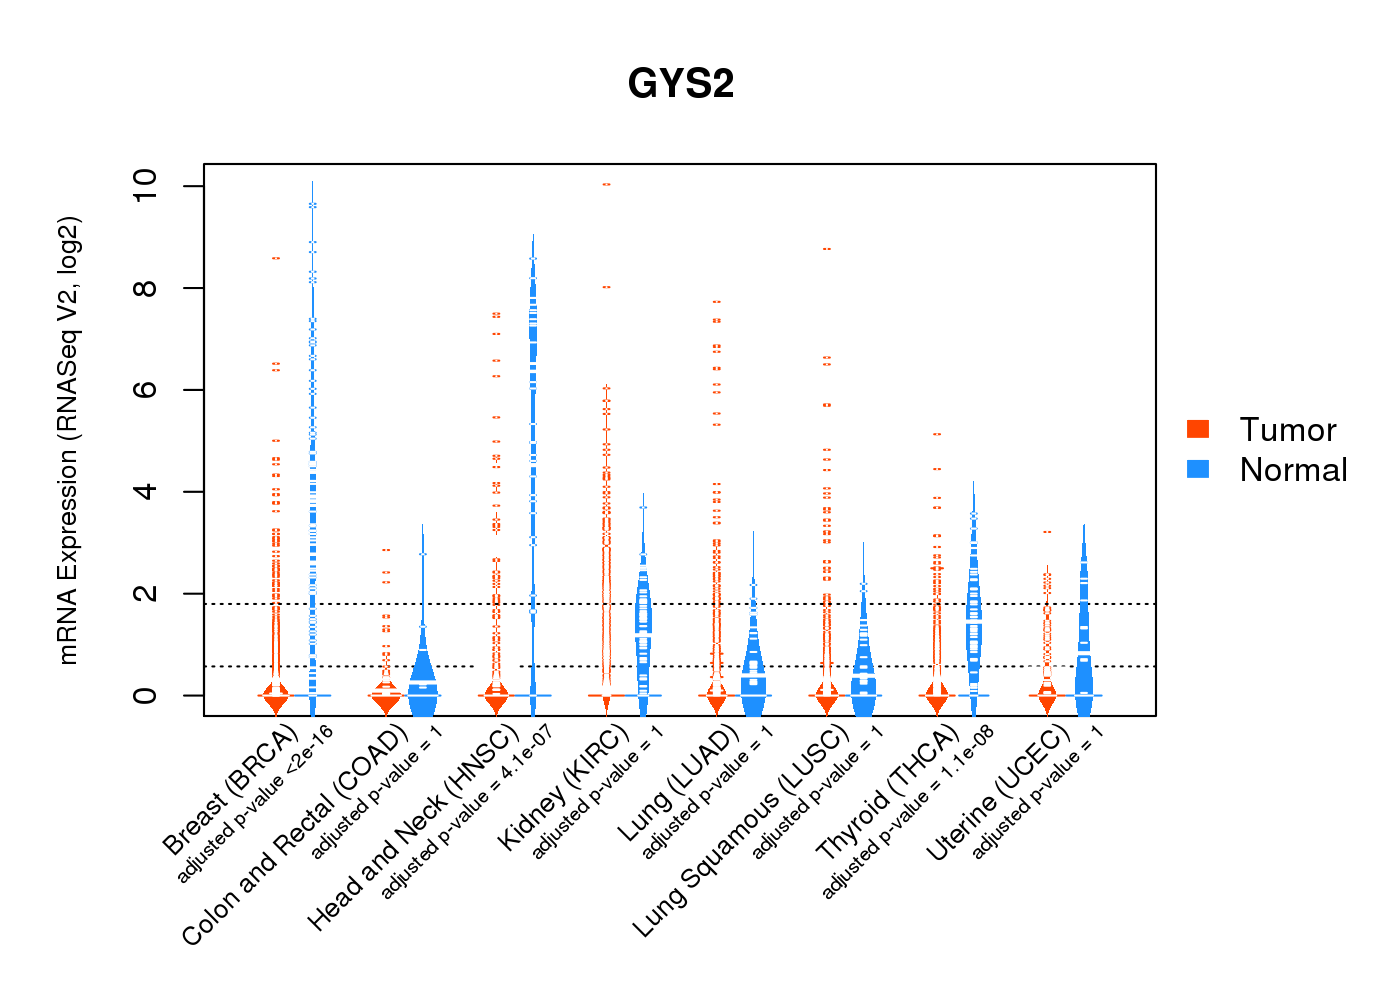 |
| Top |
| * This plots show the correlation between CNV and gene expression. |
: Open all plots for all cancer types
 |
|
 |
|
| Top |
| Gene-Gene Network Information |
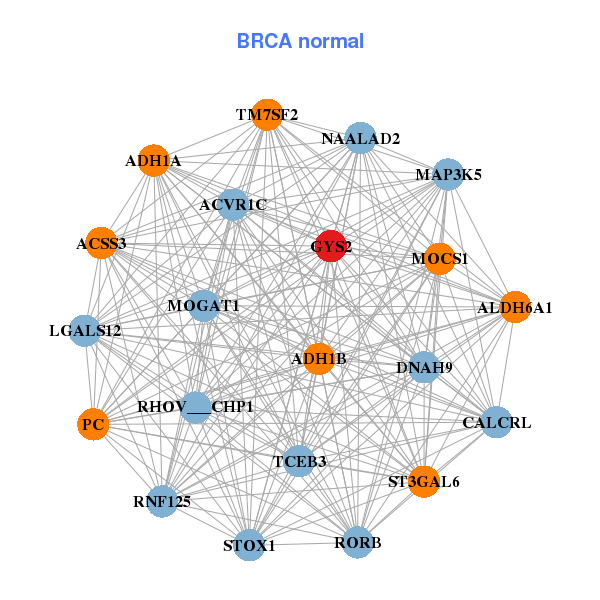
| * Co-Expression network figures were drawn using R package igraph. Only the top 20 genes with the highest correlations were shown. Red circle: input gene, orange circle: cell metabolism gene, sky circle: other gene |
: Open all plots for all cancer types
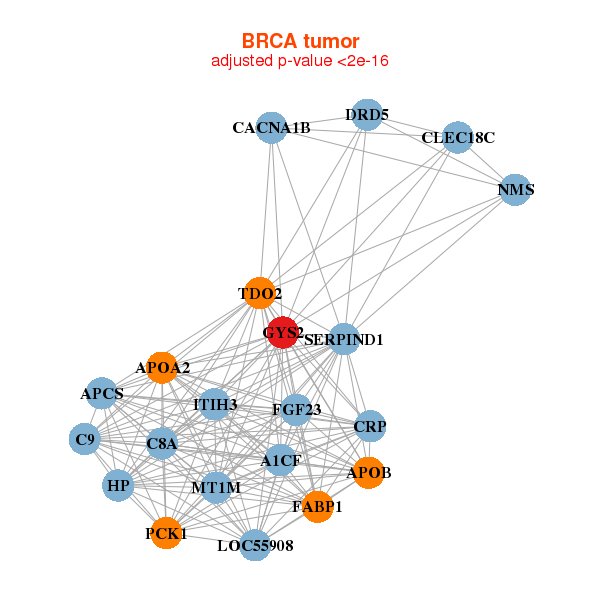 |
| ||||
| A1CF,APCS,APOA2,APOB,C8A,C9,CACNA1B, CLEC18C,CRP,DRD5,FABP1,FGF23,GYS2,HP, ITIH3,LOC55908,MT1M,NMS,PCK1,SERPIND1,TDO2 | ACSS3,ACVR1C,ADH1A,ADH1B,ALDH6A1,CALCRL,RHOV___CHP1, DNAH9,GYS2,LGALS12,MAP3K5,MOCS1,MOGAT1,NAALAD2, PC,RNF125,RORB,ST3GAL6,STOX1,TCEB3,TM7SF2 | ||||
 |
| ||||
| CRNN,GJB6,GYS2,IL36A,KLK13,KRT14,KRT24, KRT6A,KRT6C,KRT78,KRTDAP,CERS3,LCE3D,LCE3E, MRGPRX3,SPRR2B,SPRR2C,SPRR2E,SPRR2F,TGM1,TMPRSS11D | CCDC144NL,CD300LG,CHRDL2,CNBD1,DEFB124,DGAT2,DPYS, DYDC1,GLYCAM1,GYS2,LGALS12,LIM2,LOC55908,LPL, MARCO,NKX6-2,OR3A4P,SBSN,SLC7A10,SNORA22,THRSP |
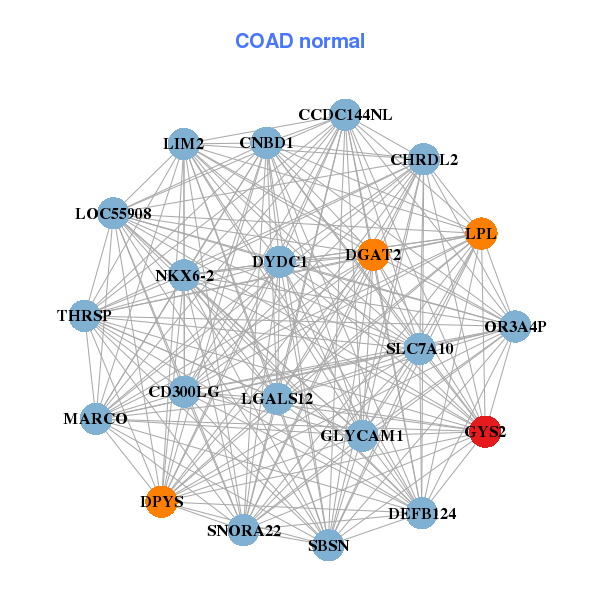
| * Co-Expression network figures were drawn using R package igraph. Only the top 20 genes with the highest correlations were shown. Red circle: input gene, orange circle: cell metabolism gene, sky circle: other gene |
: Open all plots for all cancer types
| Top |
: Open all interacting genes' information including KEGG pathway for all interacting genes from DAVID
| Top |
| Pharmacological Information for GYS2 |
| DB Category | DB Name | DB's ID and Url link |
| * Gene Centered Interaction Network. |
 |
| * Drug Centered Interaction Network. |
| DrugBank ID | Target Name | Drug Groups | Generic Name | Drug Centered Network | Drug Structure |
| DB01033 | glycogen synthase 2 (liver) | approved | Mercaptopurine | 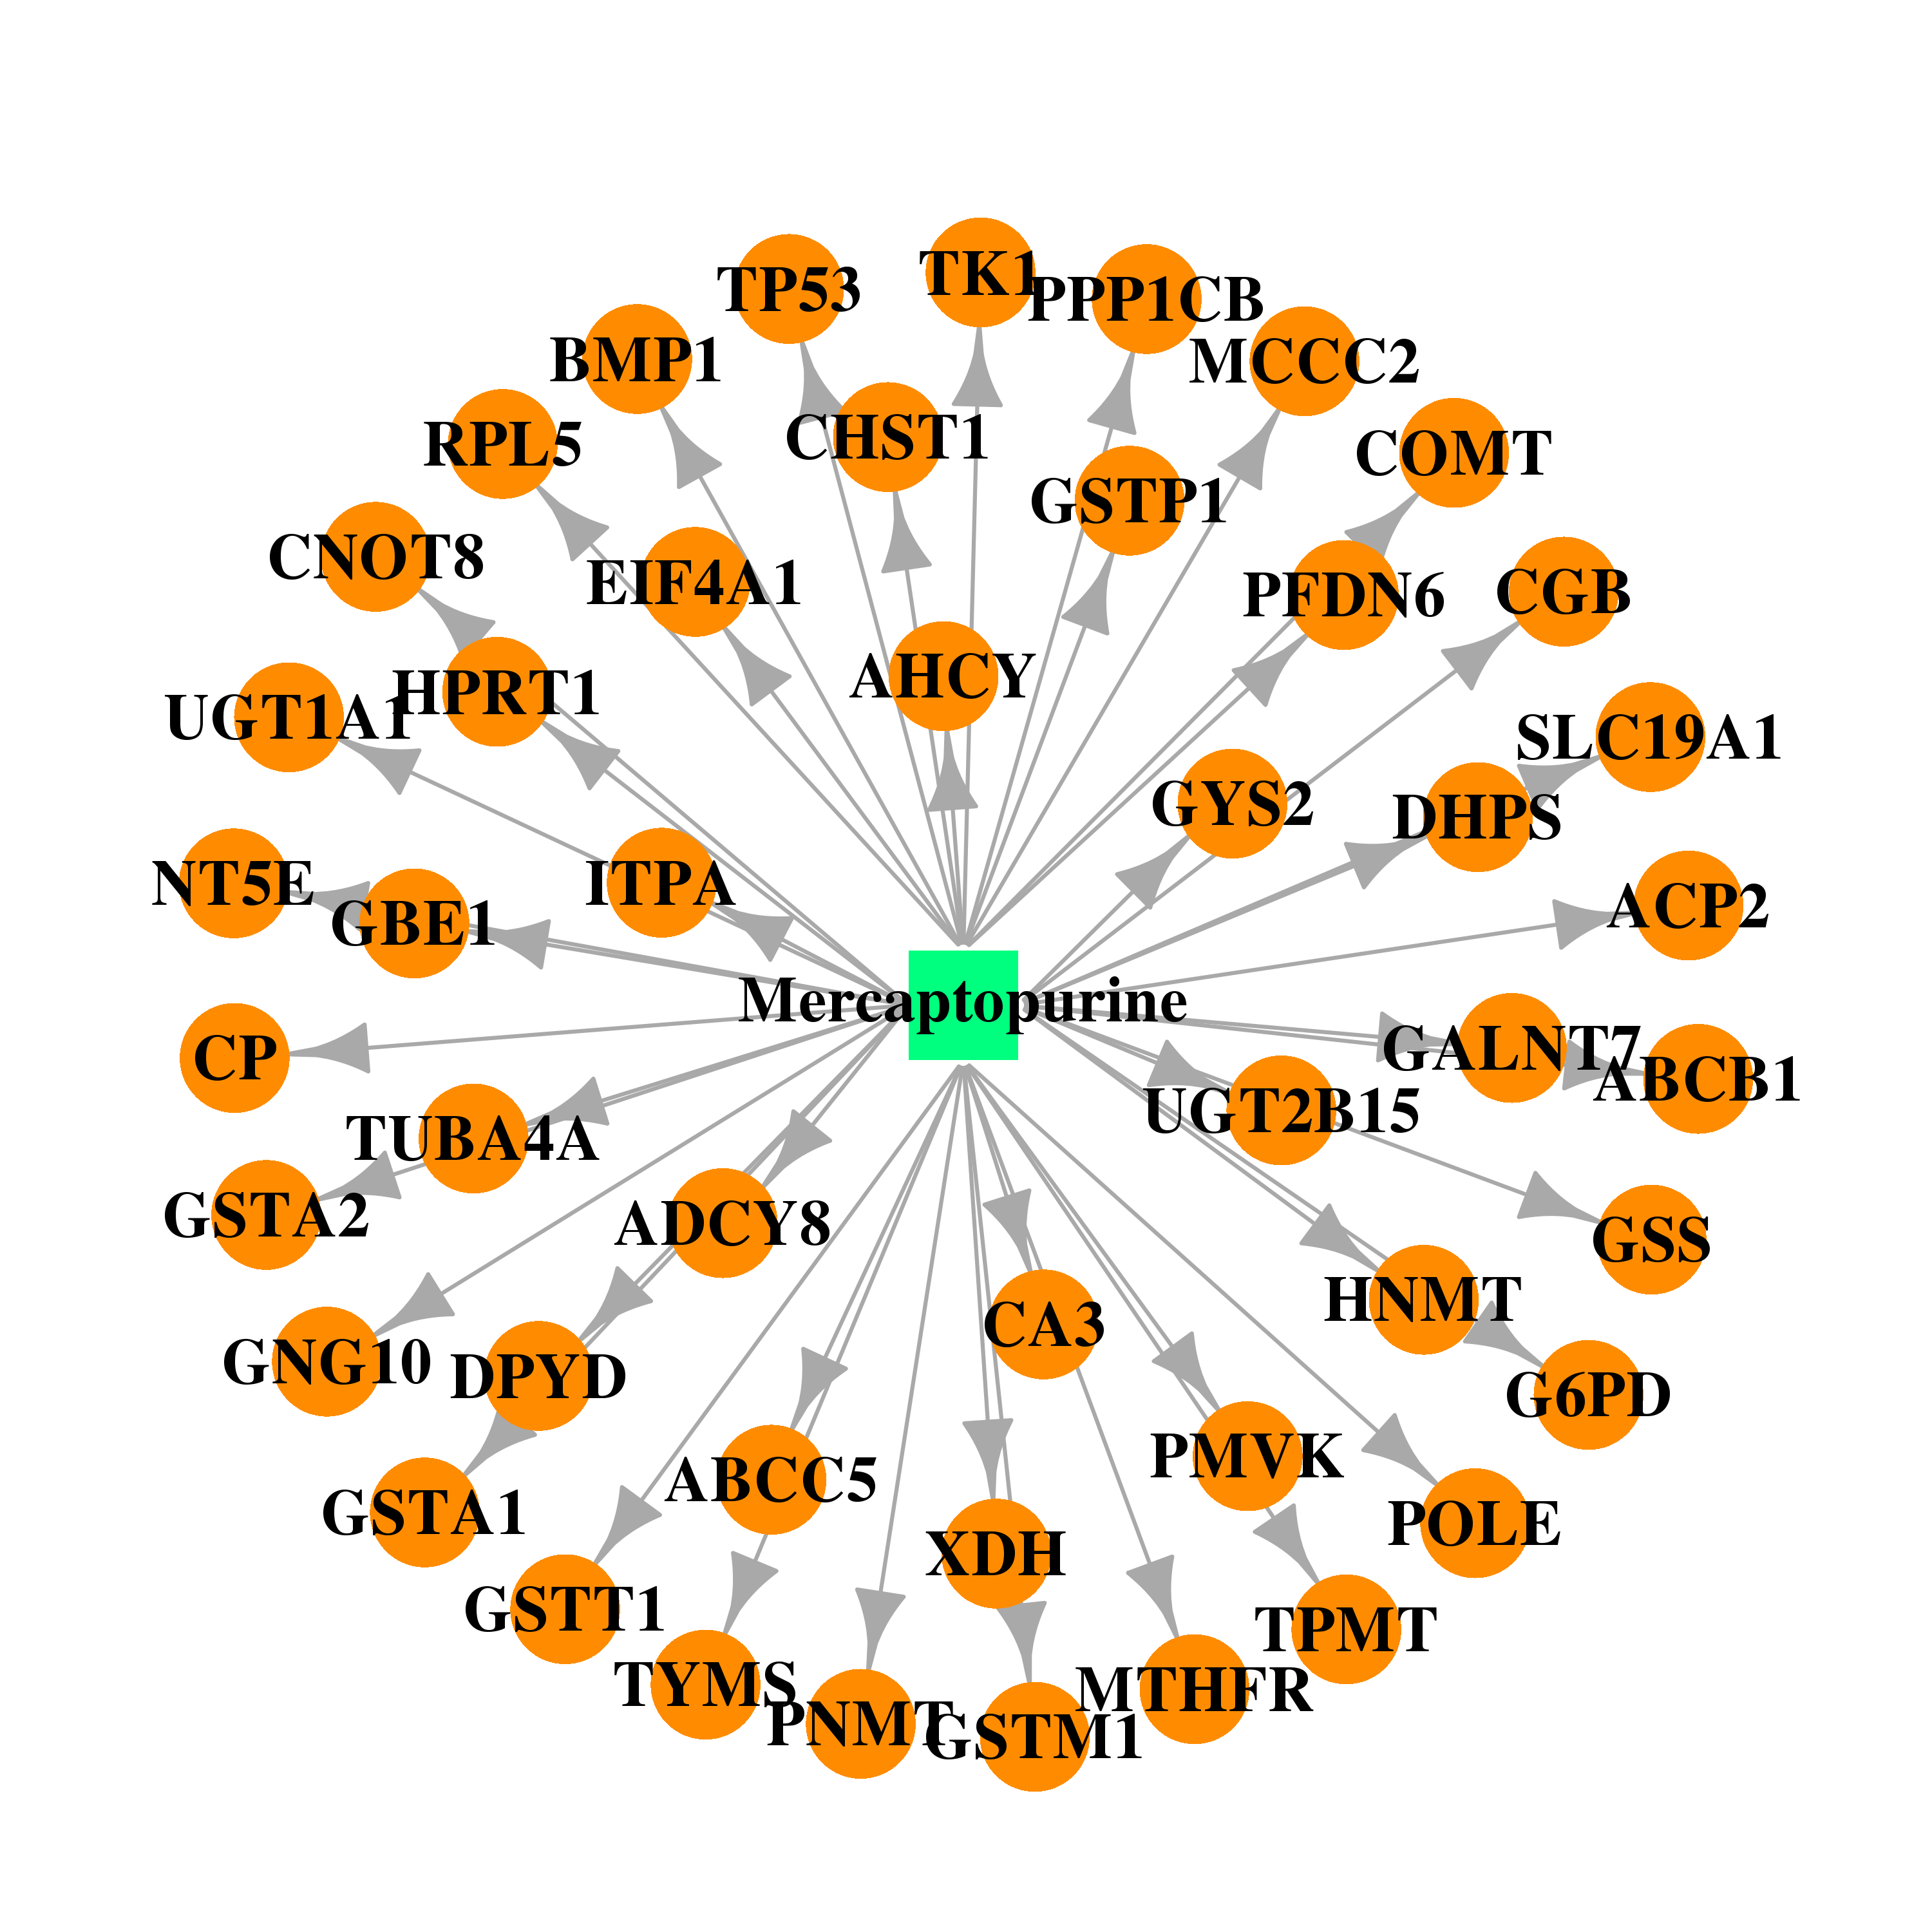 | 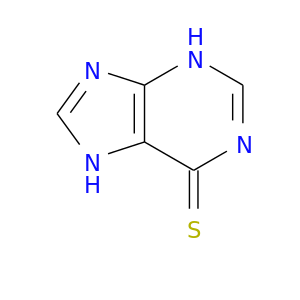 |
| Top |
| Cross referenced IDs for GYS2 |
| * We obtained these cross-references from Uniprot database. It covers 150 different DBs, 18 categories. http://www.uniprot.org/help/cross_references_section |
: Open all cross reference information
|
Copyright © 2016-Present - The Univsersity of Texas Health Science Center at Houston @ |