|
|||||||||||||||||||||||||||||||||||||||||||||||||||||||||||||||||||||||||||||||||||||||||||||||||||||||||||||||||||||||||||||||||||||||||||||||||||||||||||||||||||||||||||||||||||||||||||||||||||||||||||||||||||||||||||||||||||||||||||||||||||||||||||||||||||||||||||||||||||||||||||||||||||||||||||||||||||||||||||||||||||||||||||||
| |
| Phenotypic Information (metabolism pathway, cancer, disease, phenome) |
| |
| |
| Gene-Gene Network Information: Co-Expression Network, Interacting Genes & KEGG |
| |
|


| Gene Summary for HADHA |
| Basic gene info. | Gene symbol | HADHA |
| Gene name | hydroxyacyl-CoA dehydrogenase/3-ketoacyl-CoA thiolase/enoyl-CoA hydratase (trifunctional protein), alpha subunit | |
| Synonyms | ECHA|GBP|HADH|LCEH|LCHAD|MTPA|TP-ALPHA | |
| Cytomap | UCSC genome browser: 2p23 | |
| Genomic location | chr2 :26413503-26467594 | |
| Type of gene | protein-coding | |
| RefGenes | NM_000182.4, | |
| Ensembl id | ENSG00000084754 | |
| Description | 3-ketoacyl-Coenzyme A (CoA) thiolase, alpha subunit3-oxoacyl-CoA thiolase78 kDa gastrin-binding proteingastrin-binding proteinhydroxyacyl-Coenzyme A dehydrogenase/3-ketoacyl-Coenzyme A thiolase/enoyl-Coenzyme A hydratase (trifunctional protein), alpha | |
| Modification date | 20141207 | |
| dbXrefs | MIM : 600890 | |
| HGNC : HGNC | ||
| Ensembl : ENSG00000084754 | ||
| HPRD : 02934 | ||
| Vega : OTTHUMG00000096979 | ||
| Protein | UniProt: go to UniProt's Cross Reference DB Table | |
| Expression | CleanEX: HS_HADHA | |
| BioGPS: 3030 | ||
| Gene Expression Atlas: ENSG00000084754 | ||
| The Human Protein Atlas: ENSG00000084754 | ||
| Pathway | NCI Pathway Interaction Database: HADHA | |
| KEGG: HADHA | ||
| REACTOME: HADHA | ||
| ConsensusPathDB | ||
| Pathway Commons: HADHA | ||
| Metabolism | MetaCyc: HADHA | |
| HUMANCyc: HADHA | ||
| Regulation | Ensembl's Regulation: ENSG00000084754 | |
| miRBase: chr2 :26,413,503-26,467,594 | ||
| TargetScan: NM_000182 | ||
| cisRED: ENSG00000084754 | ||
| Context | iHOP: HADHA | |
| cancer metabolism search in PubMed: HADHA | ||
| UCL Cancer Institute: HADHA | ||
| Assigned class in ccmGDB | C | |
| Top |
| Phenotypic Information for HADHA(metabolism pathway, cancer, disease, phenome) |
| Cancer | CGAP: HADHA |
| Familial Cancer Database: HADHA | |
| * This gene is included in those cancer gene databases. |
|
|
|
|
|
|
| |||||||||||||||||||||||||||||||||||||||||||||||||||||||||||||||||||||||||||||||||||||||||||||||||||||||||||||||||||||||||||||||||||||||||||||||||||||||||||||||||||||||||||||||||||||||||||||||||||||||||||||||||||||||||||||||||||||||||||||||||||||||||||||||||||||||||||||||||||||||||||||||||||||||||||||||||||||||||||||||||||||||
Oncogene 1 | Significant driver gene in | ||||||||||||||||||||||||||||||||||||||||||||||||||||||||||||||||||||||||||||||||||||||||||||||||||||||||||||||||||||||||||||||||||||||||||||||||||||||||||||||||||||||||||||||||||||||||||||||||||||||||||||||||||||||||||||||||||||||||||||||||||||||||||||||||||||||||||||||||||||||||||||||||||||||||||||||||||||||||||||||||||||||||||||
| cf) number; DB name 1 Oncogene; http://nar.oxfordjournals.org/content/35/suppl_1/D721.long, 2 Tumor Suppressor gene; https://bioinfo.uth.edu/TSGene/, 3 Cancer Gene Census; http://www.nature.com/nrc/journal/v4/n3/abs/nrc1299.html, 4 CancerGenes; http://nar.oxfordjournals.org/content/35/suppl_1/D721.long, 5 Network of Cancer Gene; http://ncg.kcl.ac.uk/index.php, 1Therapeutic Vulnerabilities in Cancer; http://cbio.mskcc.org/cancergenomics/statius/ |
| KEGG_FATTY_ACID_METABOLISM KEGG_TRYPTOPHAN_METABOLISM KEGG_BETA_ALANINE_METABOLISM KEGG_PROPANOATE_METABOLISM KEGG_BUTANOATE_METABOLISM REACTOME_PHOSPHOLIPID_METABOLISM REACTOME_METABOLISM_OF_LIPIDS_AND_LIPOPROTEINS | |
| OMIM | |
| Orphanet | |
| Disease | KEGG Disease: HADHA |
| MedGen: HADHA (Human Medical Genetics with Condition) | |
| ClinVar: HADHA | |
| Phenotype | MGI: HADHA (International Mouse Phenotyping Consortium) |
| PhenomicDB: HADHA | |
| Mutations for HADHA |
| * Under tables are showing count per each tissue to give us broad intuition about tissue specific mutation patterns.You can go to the detailed page for each mutation database's web site. |
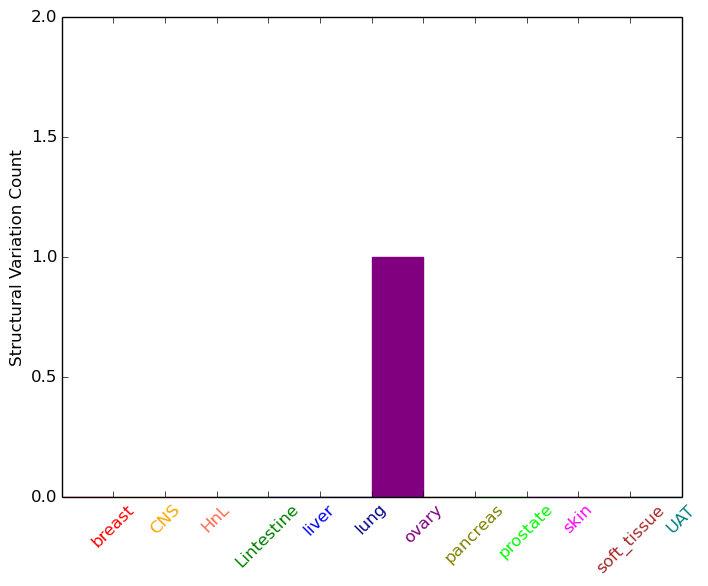
| - Statistics for Tissue and Mutation type | Top |
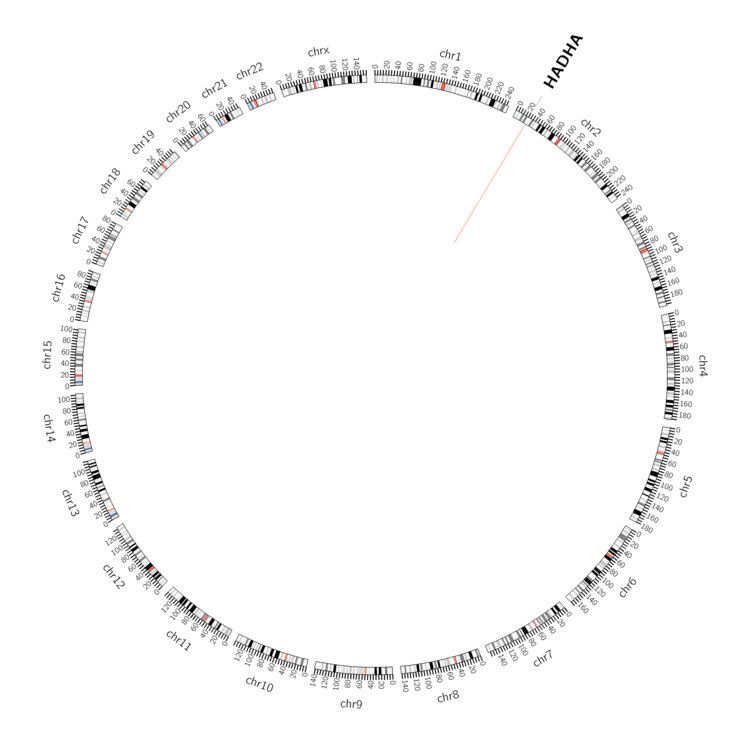 |
| - For Inter-chromosomal Variations |
| There's no inter-chromosomal structural variation. |
| - For Intra-chromosomal Variations |
| * Intra-chromosomal variantions includes 'intrachromosomal amplicon to amplicon', 'intrachromosomal amplicon to non-amplified dna', 'intrachromosomal deletion', 'intrachromosomal fold-back inversion', 'intrachromosomal inversion', 'intrachromosomal tandem duplication', 'Intrachromosomal unknown type', 'intrachromosomal with inverted orientation', 'intrachromosomal with non-inverted orientation'. |
 |
| Sample | Symbol_a | Chr_a | Start_a | End_a | Symbol_b | Chr_b | Start_b | End_b |
| ovary | HADHA | chr2 | 26442008 | 26442028 | HADHA | chr2 | 26442999 | 26443019 |
| cf) Tissue number; Tissue name (1;Breast, 2;Central_nervous_system, 3;Haematopoietic_and_lymphoid_tissue, 4;Large_intestine, 5;Liver, 6;Lung, 7;Ovary, 8;Pancreas, 9;Prostate, 10;Skin, 11;Soft_tissue, 12;Upper_aerodigestive_tract) |
| * From mRNA Sanger sequences, Chitars2.0 arranged chimeric transcripts. This table shows HADHA related fusion information. |
| ID | Head Gene | Tail Gene | Accession | Gene_a | qStart_a | qEnd_a | Chromosome_a | tStart_a | tEnd_a | Gene_a | qStart_a | qEnd_a | Chromosome_a | tStart_a | tEnd_a |
| AI110722 | NID1 | 1 | 88 | 1 | 236206110 | 236206197 | HADHA | 76 | 569 | 2 | 26426936 | 26437998 | |
| AA873450 | HADHA | 1 | 357 | 2 | 26413742 | 26414098 | CHID1 | 358 | 437 | 11 | 904706 | 904786 | |
| AF074629 | NID1 | 1 | 88 | 1 | 236206110 | 236206197 | HADHA | 76 | 569 | 2 | 26426936 | 26437998 | |
| BF804747 | GAS5 | 11 | 98 | 1 | 173833812 | 173834423 | HADHA | 86 | 107 | 2 | 26462649 | 26462671 | |
| BQ330936 | HADHA | 48 | 257 | 2 | 26417980 | 26420647 | HADHA | 254 | 346 | 2 | 26416589 | 26417478 | |
| Top |
| Mutation type/ Tissue ID | brca | cns | cerv | endome | haematopo | kidn | Lintest | liver | lung | ns | ovary | pancre | prost | skin | stoma | thyro | urina | |||
| Total # sample | 1 | |||||||||||||||||||
| GAIN (# sample) | ||||||||||||||||||||
| LOSS (# sample) | 1 |
| cf) Tissue ID; Tissue type (1; Breast, 2; Central_nervous_system, 3; Cervix, 4; Endometrium, 5; Haematopoietic_and_lymphoid_tissue, 6; Kidney, 7; Large_intestine, 8; Liver, 9; Lung, 10; NS, 11; Ovary, 12; Pancreas, 13; Prostate, 14; Skin, 15; Stomach, 16; Thyroid, 17; Urinary_tract) |
| Top |
|
 |
| Top |
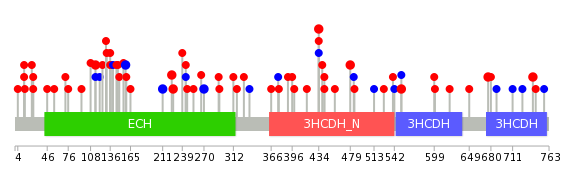
| Stat. for Non-Synonymous SNVs (# total SNVs=49) | (# total SNVs=19) |
 | 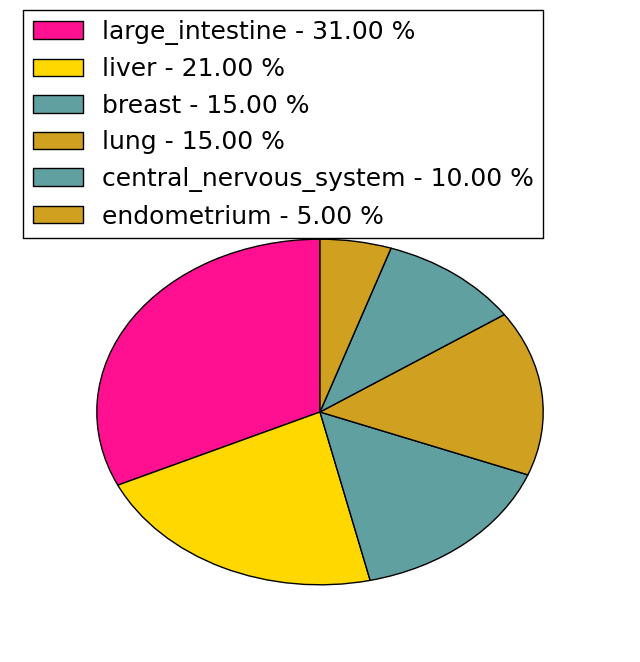 |
(# total SNVs=1) | (# total SNVs=1) |
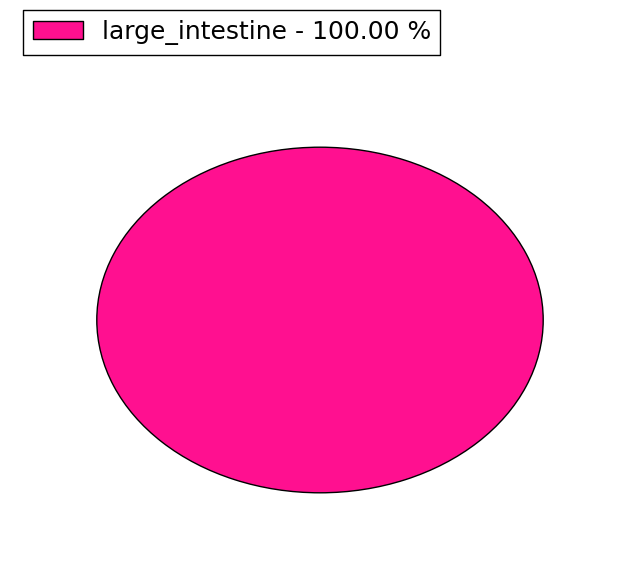 |  |
| Top |
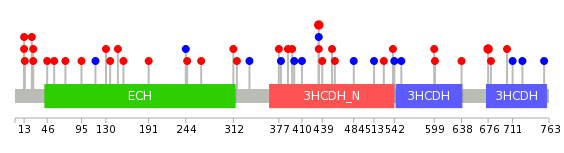
| * When you move the cursor on each content, you can see more deailed mutation information on the Tooltip. Those are primary_site,primary_histology,mutation(aa),pubmedID. |
| GRCh37 position | Mutation(aa) | Unique sampleID count |
| chr2:26424110-26424110 | p.D434N | 3 |
| chr2:26437359-26437359 | p.R291* | 3 |
| chr2:26457194-26457194 | p.E115A | 2 |
| chr2:26414471-26414471 | p.R676H | 2 |
| chr2:26438044-26438044 | p.G226A | 2 |
| chr2:26453065-26453065 | p.P224L | 2 |
| chr2:26420604-26420604 | p.L479F | 2 |
| chr2:26457131-26457131 | p.P136H | 2 |
| chr2:26453103-26453103 | p.R211R | 2 |
| chr2:26414192-26414192 | p.Y740C | 2 |
| Top |
|
 |
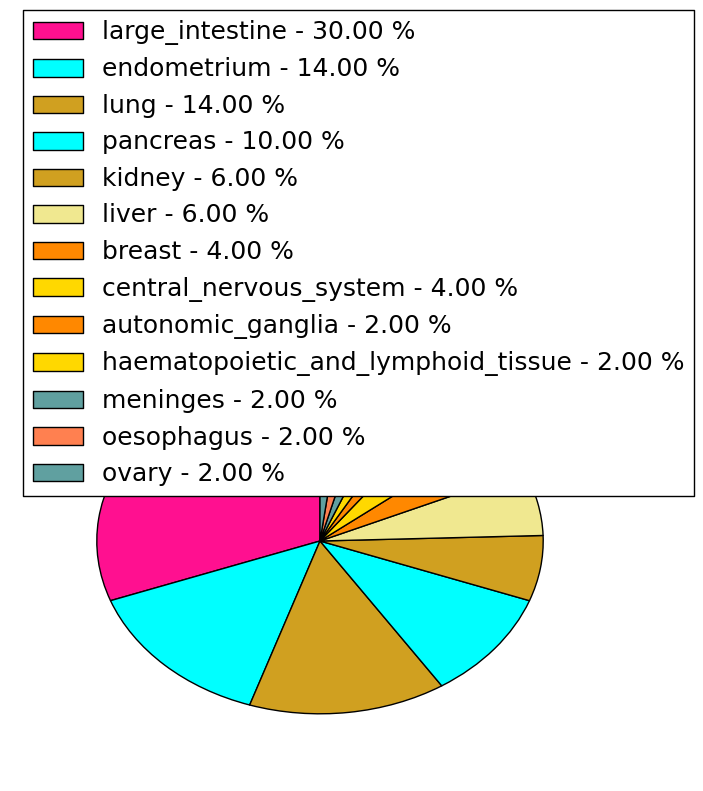
| Point Mutation/ Tissue ID | 1 | 2 | 3 | 4 | 5 | 6 | 7 | 8 | 9 | 10 | 11 | 12 | 13 | 14 | 15 | 16 | 17 | 18 | 19 | 20 |
| # sample | 3 | 2 | 1 | 10 | 1 | 2 | 2 | 1 | 4 | 1 | 1 | 6 | 3 | 1 | 7 | |||||
| # mutation | 3 | 2 | 1 | 11 | 1 | 2 | 2 | 1 | 5 | 1 | 1 | 6 | 3 | 1 | 8 | |||||
| nonsynonymous SNV | 3 | 1 | 7 | 1 | 2 | 2 | 1 | 2 | 1 | 6 | 2 | 1 | 7 | |||||||
| synonymous SNV | 2 | 4 | 3 | 1 | 1 | 1 |
| cf) Tissue ID; Tissue type (1; BLCA[Bladder Urothelial Carcinoma], 2; BRCA[Breast invasive carcinoma], 3; CESC[Cervical squamous cell carcinoma and endocervical adenocarcinoma], 4; COAD[Colon adenocarcinoma], 5; GBM[Glioblastoma multiforme], 6; Glioma Low Grade, 7; HNSC[Head and Neck squamous cell carcinoma], 8; KICH[Kidney Chromophobe], 9; KIRC[Kidney renal clear cell carcinoma], 10; KIRP[Kidney renal papillary cell carcinoma], 11; LAML[Acute Myeloid Leukemia], 12; LUAD[Lung adenocarcinoma], 13; LUSC[Lung squamous cell carcinoma], 14; OV[Ovarian serous cystadenocarcinoma ], 15; PAAD[Pancreatic adenocarcinoma], 16; PRAD[Prostate adenocarcinoma], 17; SKCM[Skin Cutaneous Melanoma], 18:STAD[Stomach adenocarcinoma], 19:THCA[Thyroid carcinoma], 20:UCEC[Uterine Corpus Endometrial Carcinoma]) |
| Top |
| * We represented just top 10 SNVs. When you move the cursor on each content, you can see more deailed mutation information on the Tooltip. Those are primary_site, primary_histology, mutation(aa), pubmedID. |
| Genomic Position | Mutation(aa) | Unique sampleID count |
| chr2:26424110 | p.D434N | 3 |
| chr2:26414471 | p.R676H | 2 |
| chr2:26435480 | p.G703R | 1 |
| chr2:26416532 | p.P136L | 1 |
| chr2:26459821 | p.R680T | 1 |
| chr2:26424108 | p.D410D | 1 |
| chr2:26437925 | p.L130I | 1 |
| chr2:26416536 | p.R399R | 1 |
| chr2:26461815 | p.E115E | 1 |
| chr2:26437984 | p.I638V | 1 |
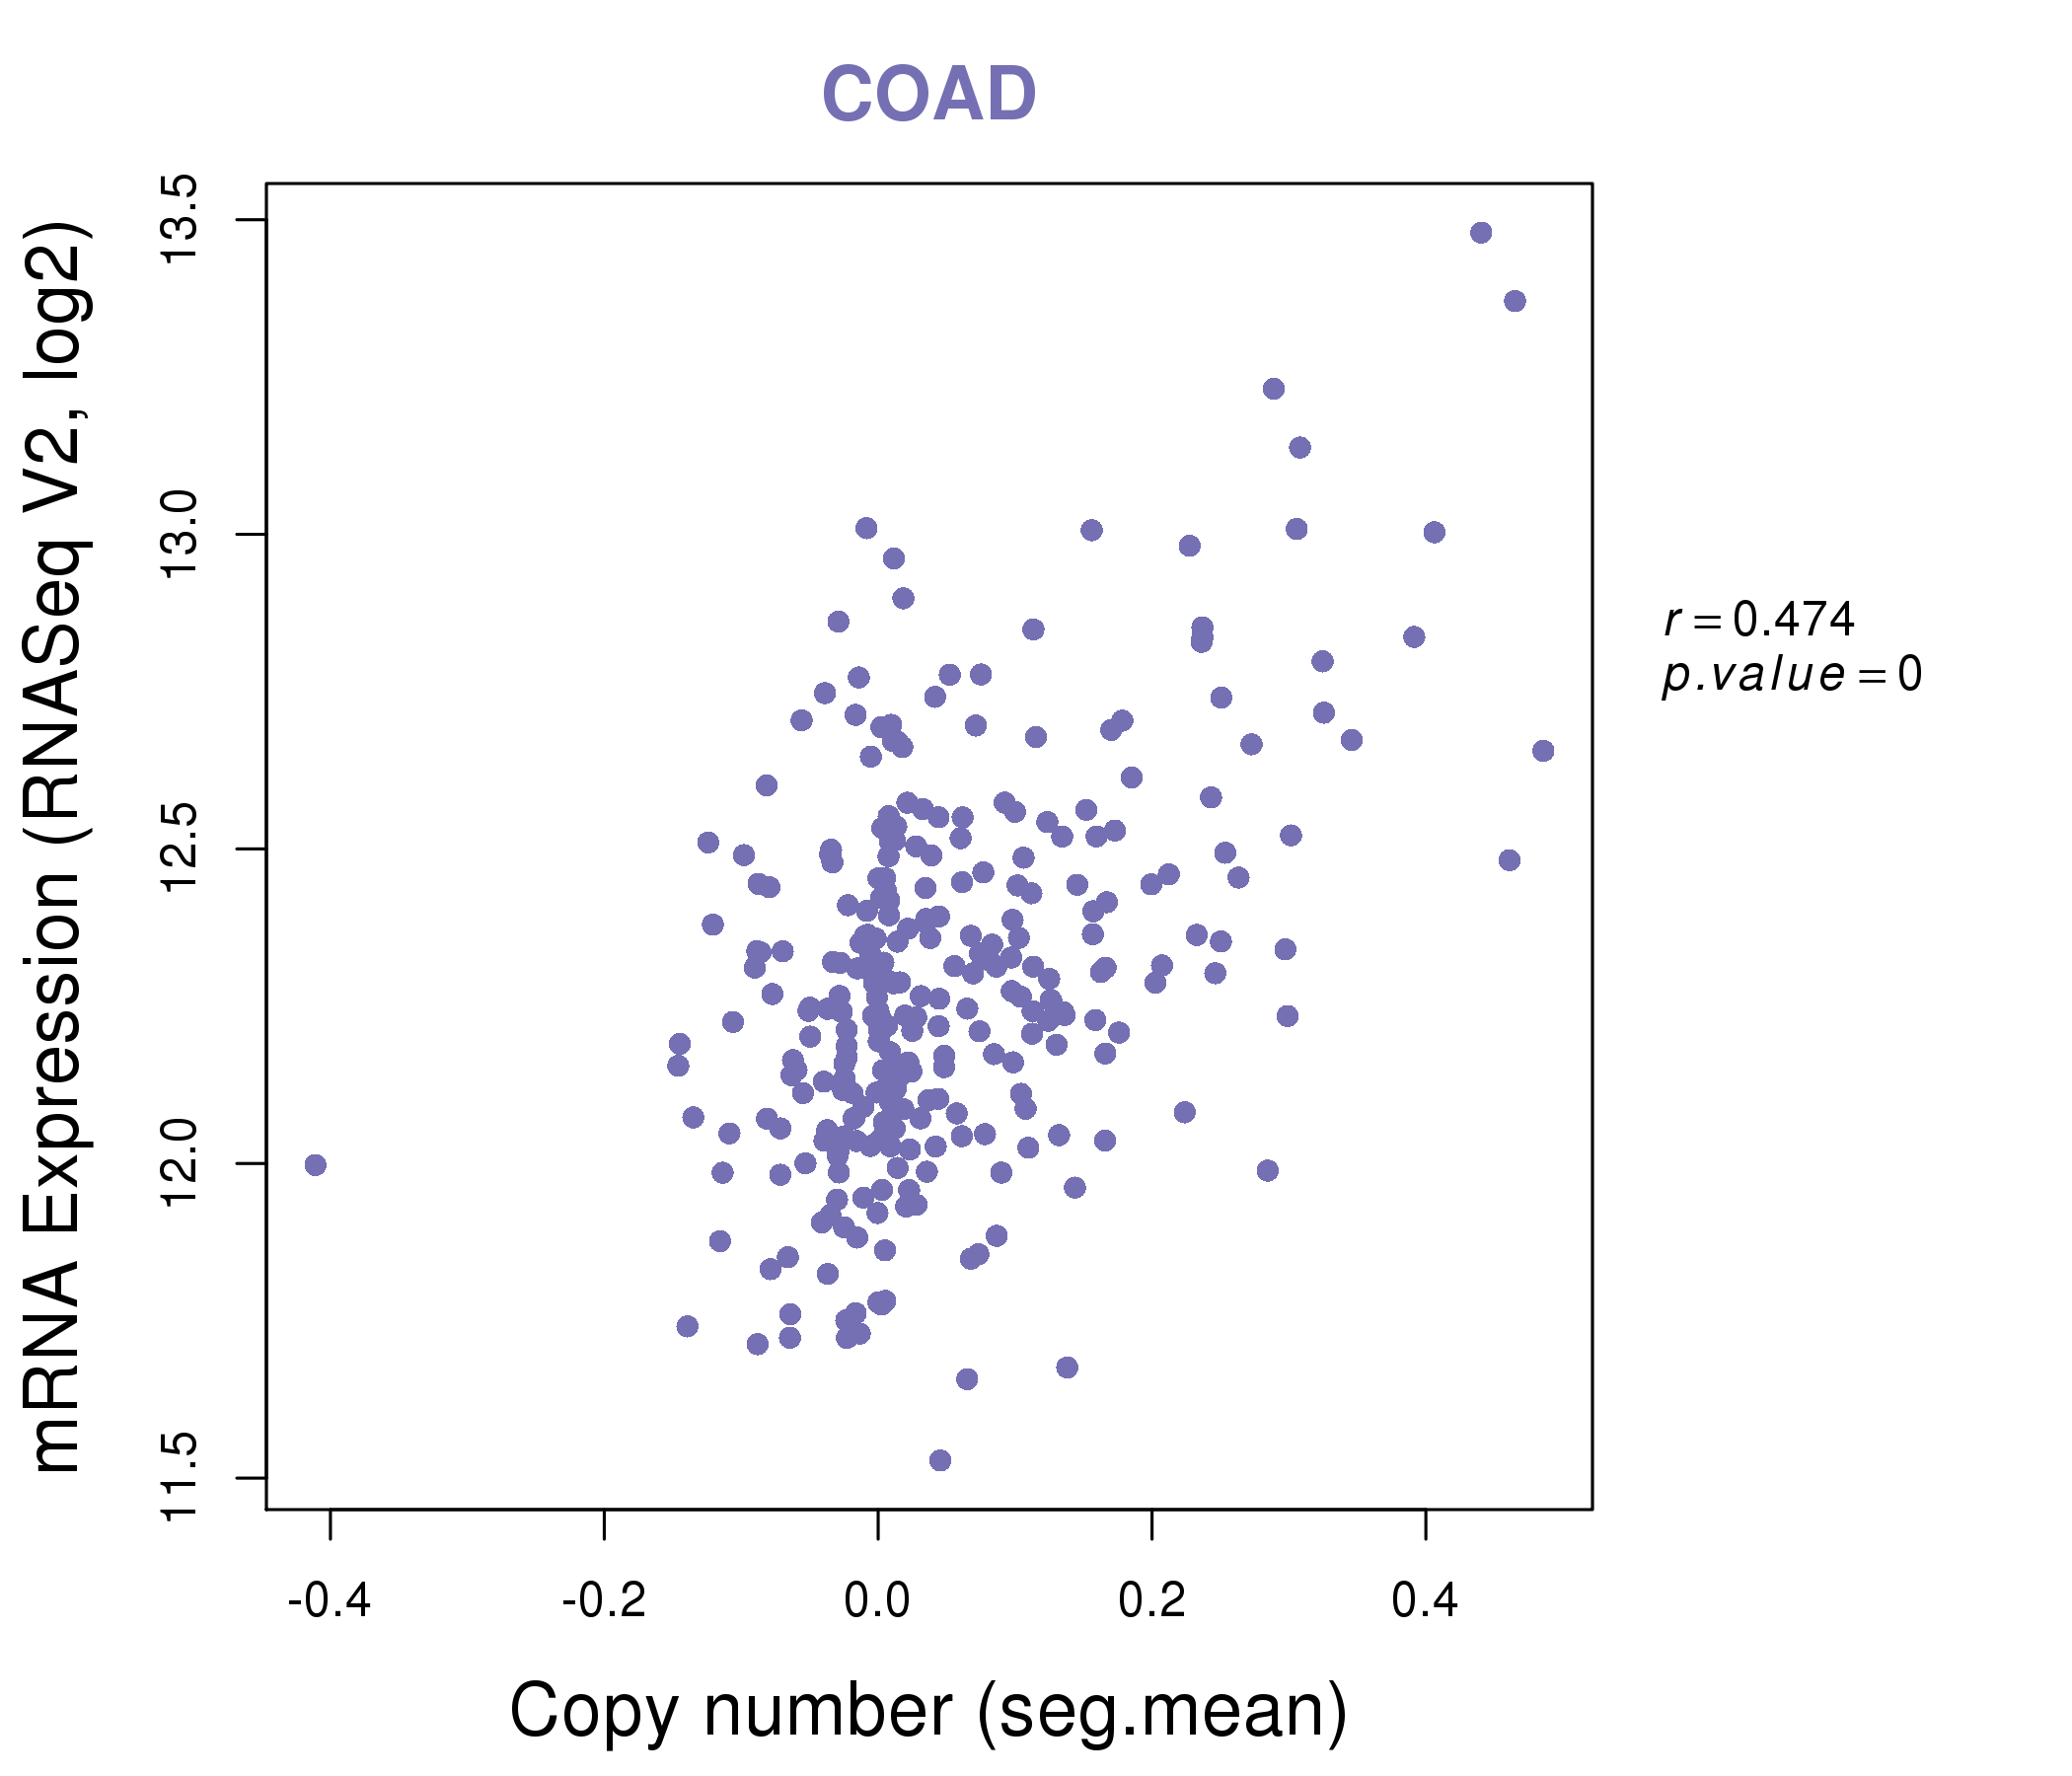
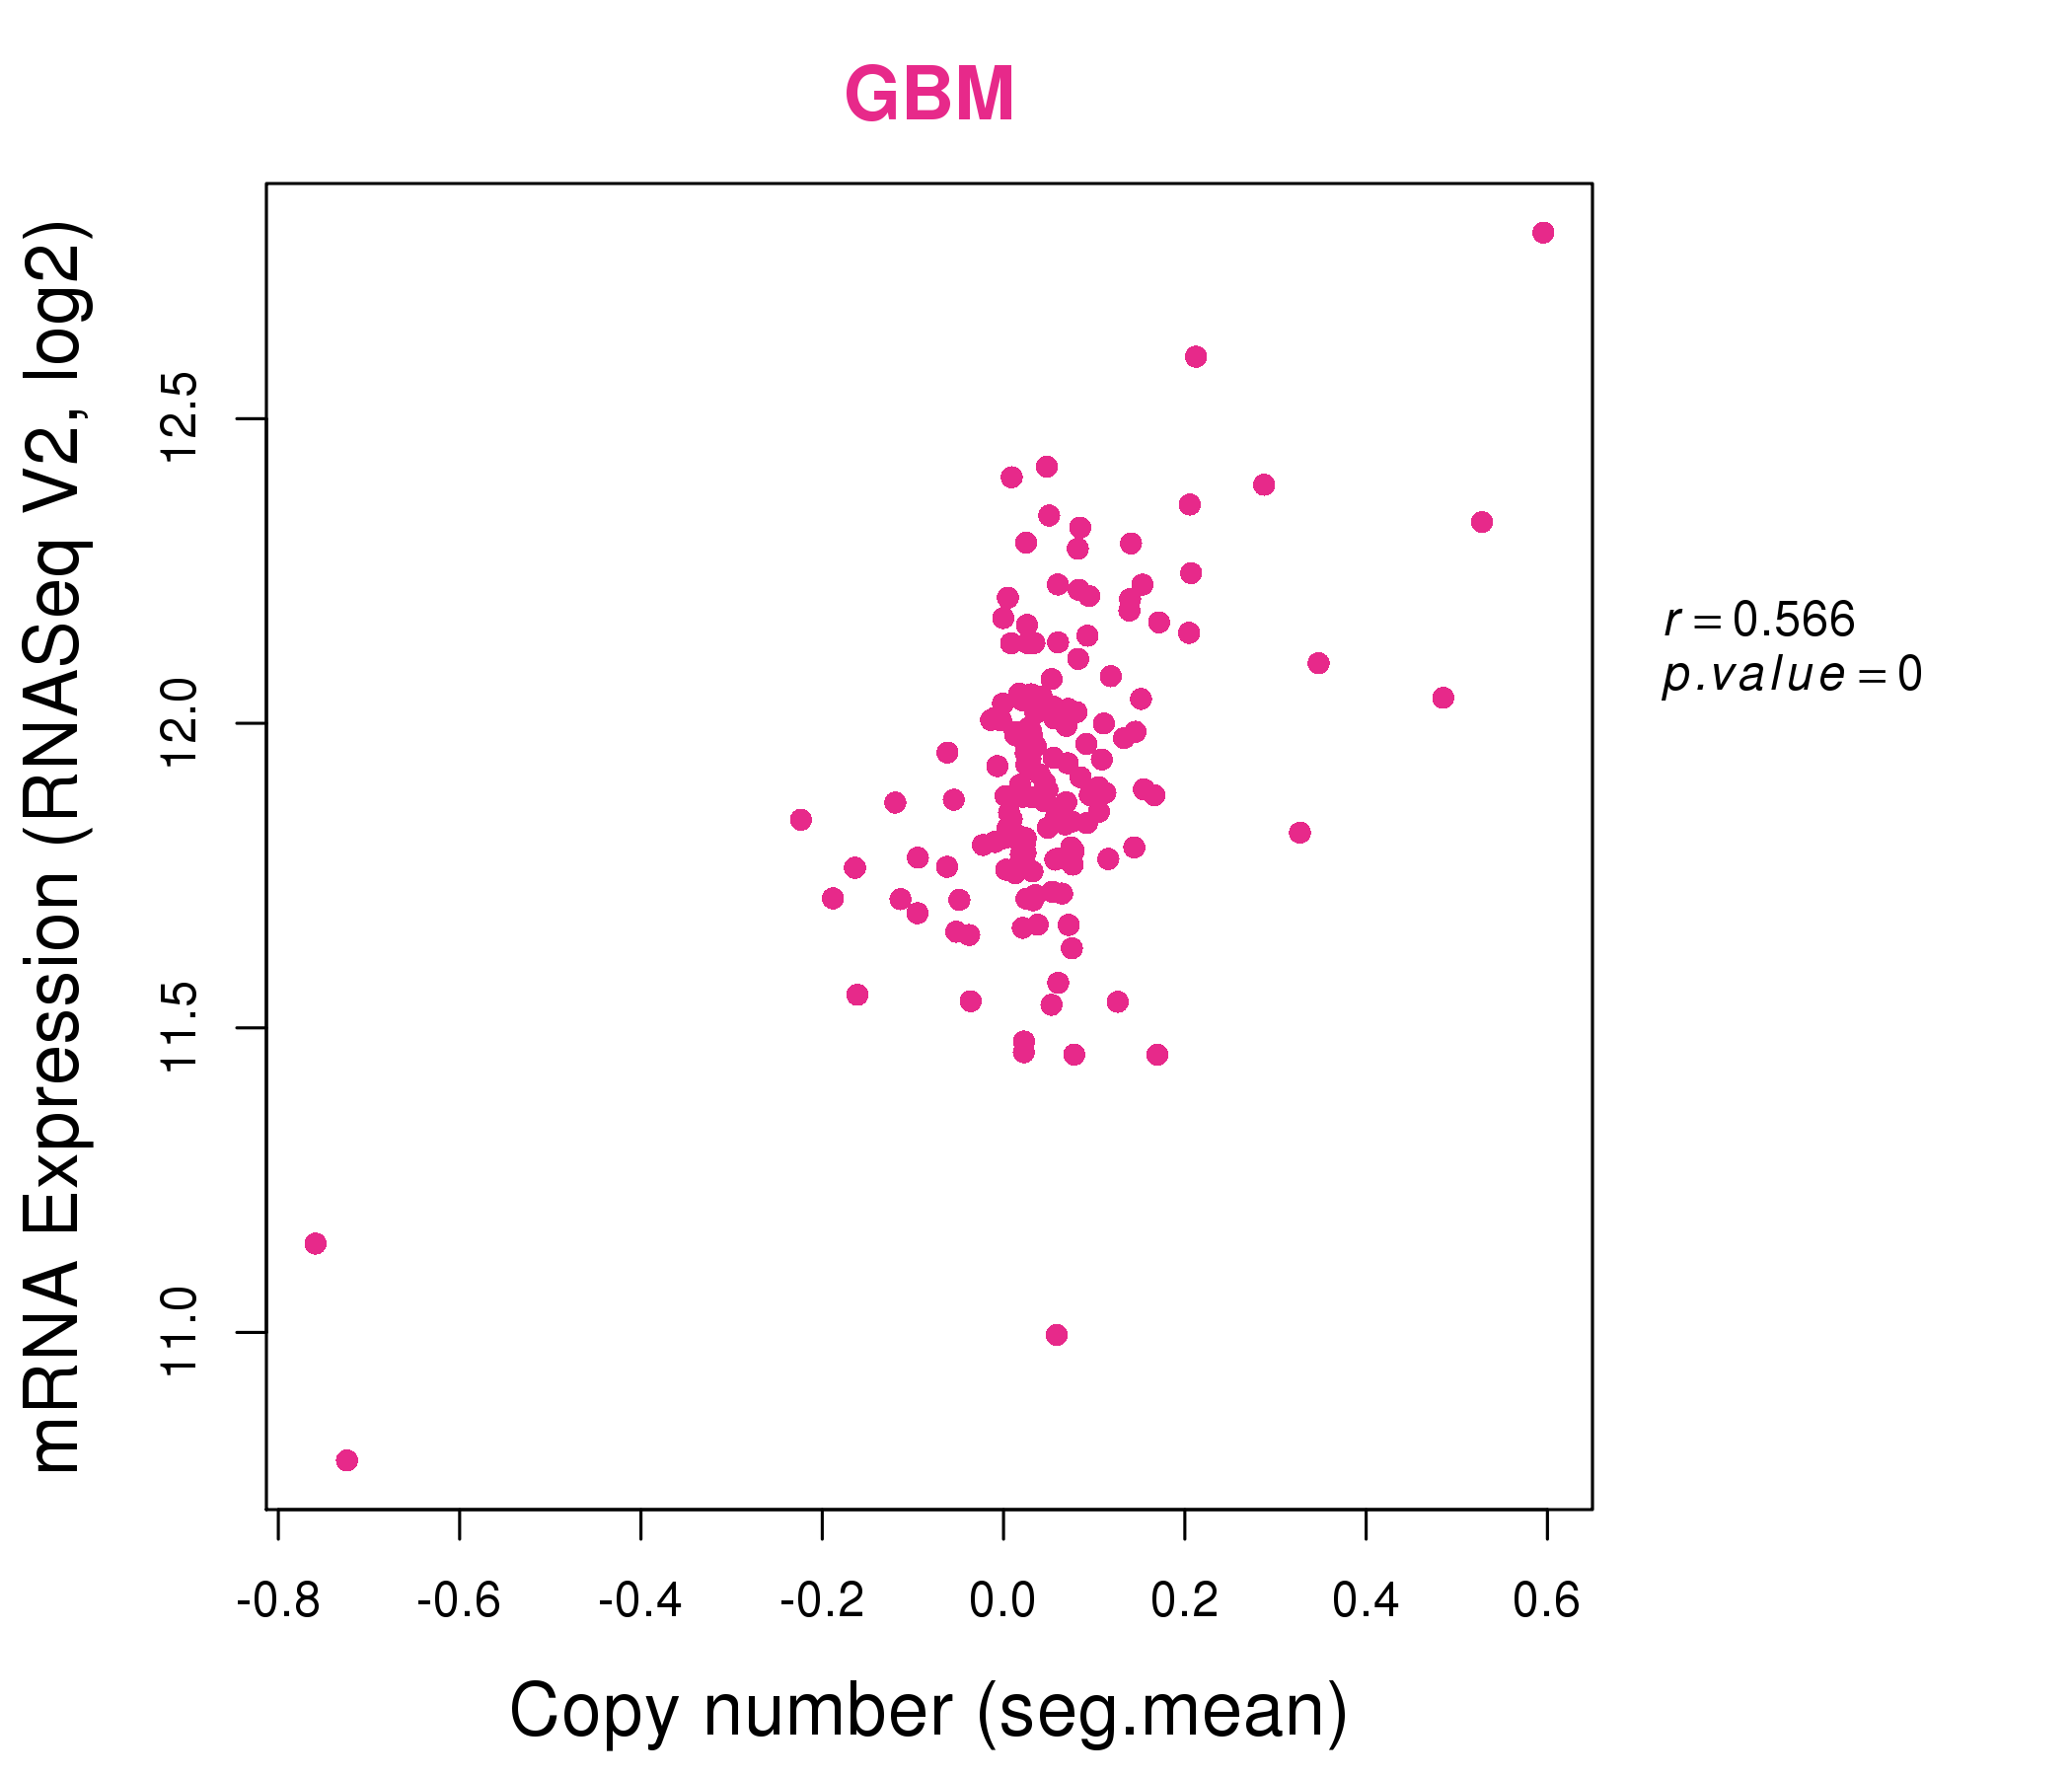
| * Copy number data were extracted from TCGA using R package TCGA-Assembler. The URLs of all public data files on TCGA DCC data server were gathered on Jan-05-2015. Function ProcessCNAData in TCGA-Assembler package was used to obtain gene-level copy number value which is calculated as the average copy number of the genomic region of a gene. |
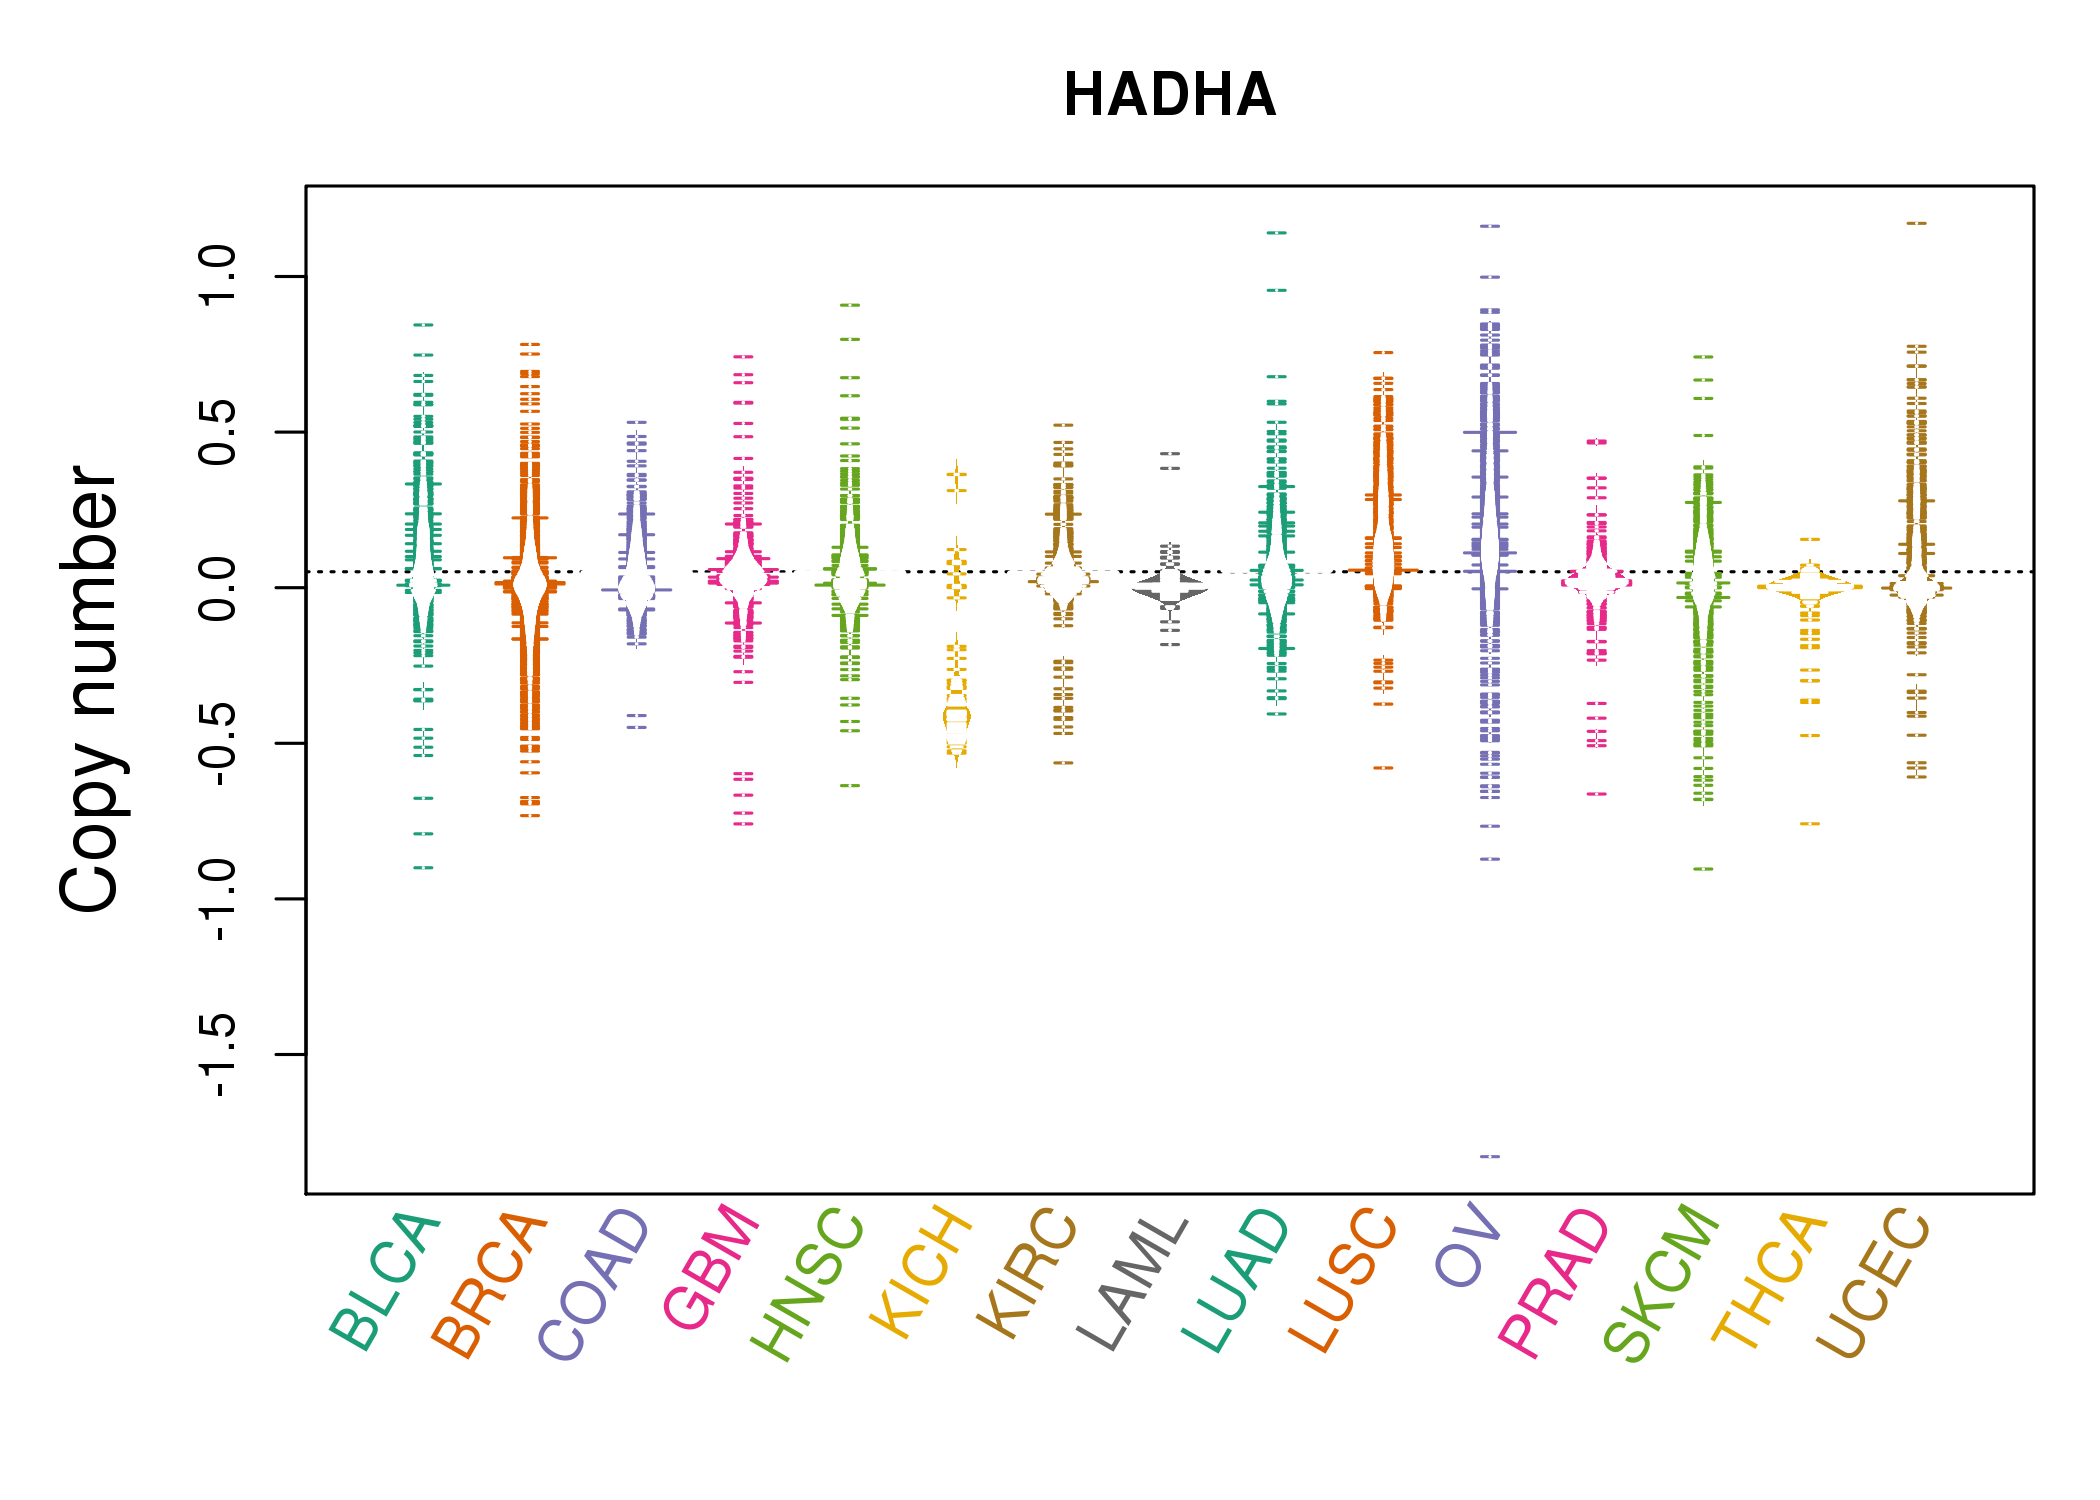 |
| cf) Tissue ID[Tissue type]: BLCA[Bladder Urothelial Carcinoma], BRCA[Breast invasive carcinoma], CESC[Cervical squamous cell carcinoma and endocervical adenocarcinoma], COAD[Colon adenocarcinoma], GBM[Glioblastoma multiforme], Glioma Low Grade, HNSC[Head and Neck squamous cell carcinoma], KICH[Kidney Chromophobe], KIRC[Kidney renal clear cell carcinoma], KIRP[Kidney renal papillary cell carcinoma], LAML[Acute Myeloid Leukemia], LUAD[Lung adenocarcinoma], LUSC[Lung squamous cell carcinoma], OV[Ovarian serous cystadenocarcinoma ], PAAD[Pancreatic adenocarcinoma], PRAD[Prostate adenocarcinoma], SKCM[Skin Cutaneous Melanoma], STAD[Stomach adenocarcinoma], THCA[Thyroid carcinoma], UCEC[Uterine Corpus Endometrial Carcinoma] |
| Top |
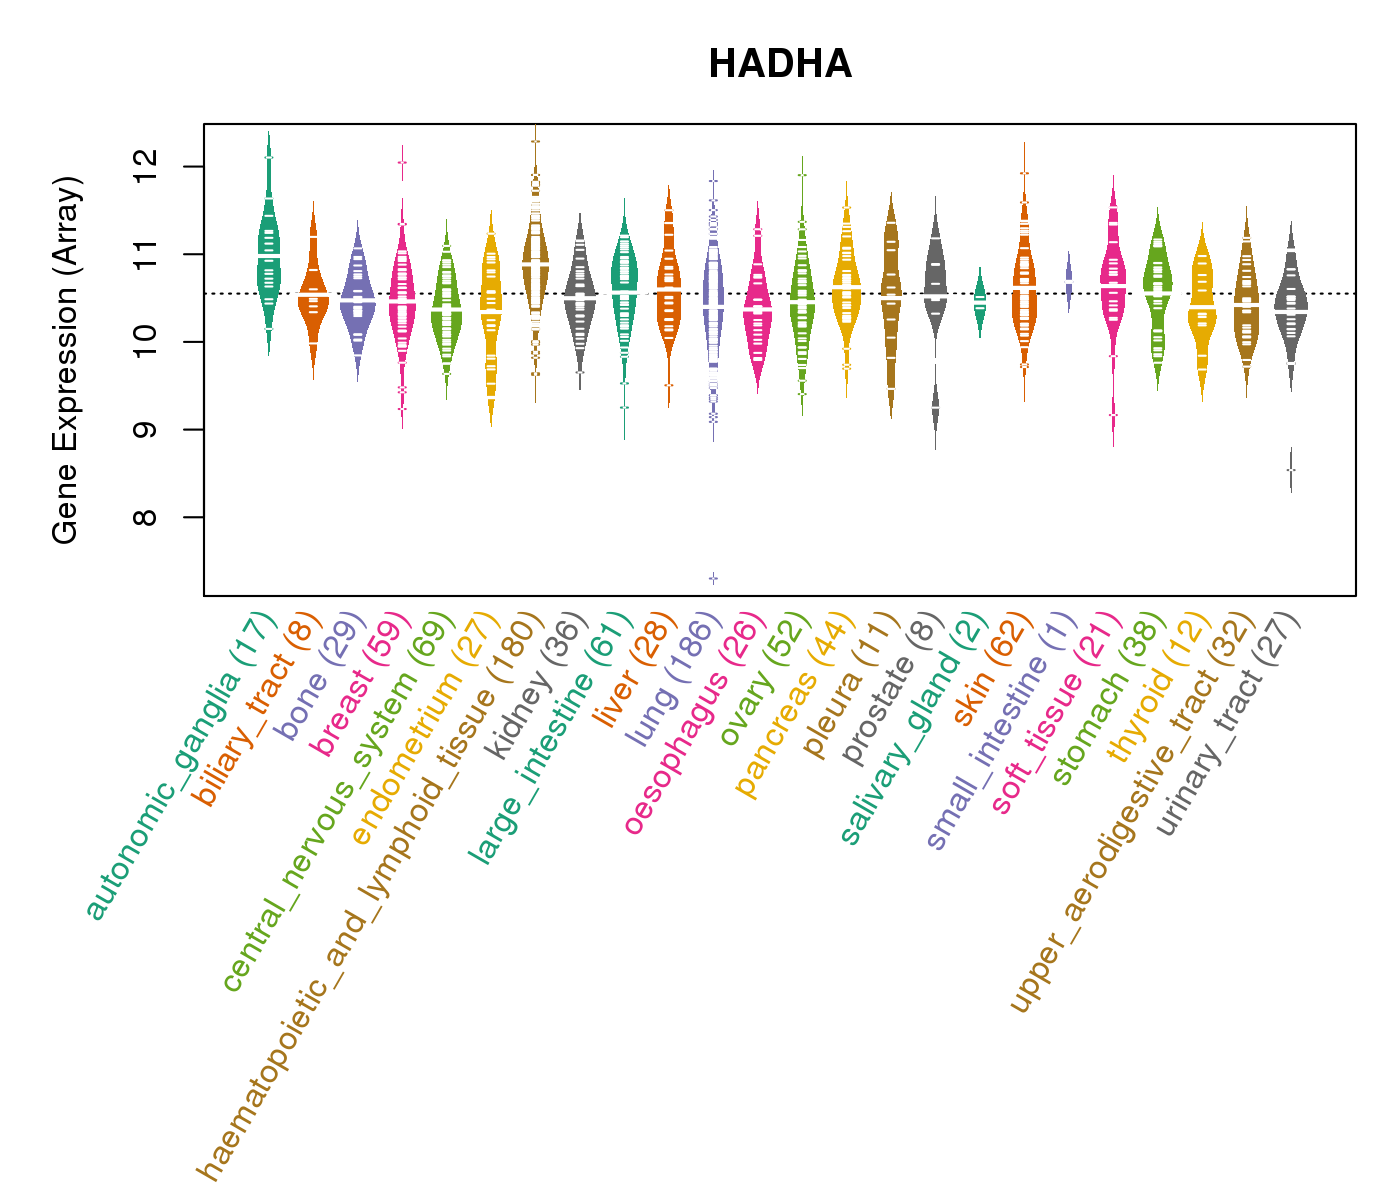
| Gene Expression for HADHA |
| * CCLE gene expression data were extracted from CCLE_Expression_Entrez_2012-10-18.res: Gene-centric RMA-normalized mRNA expression data. |
 |
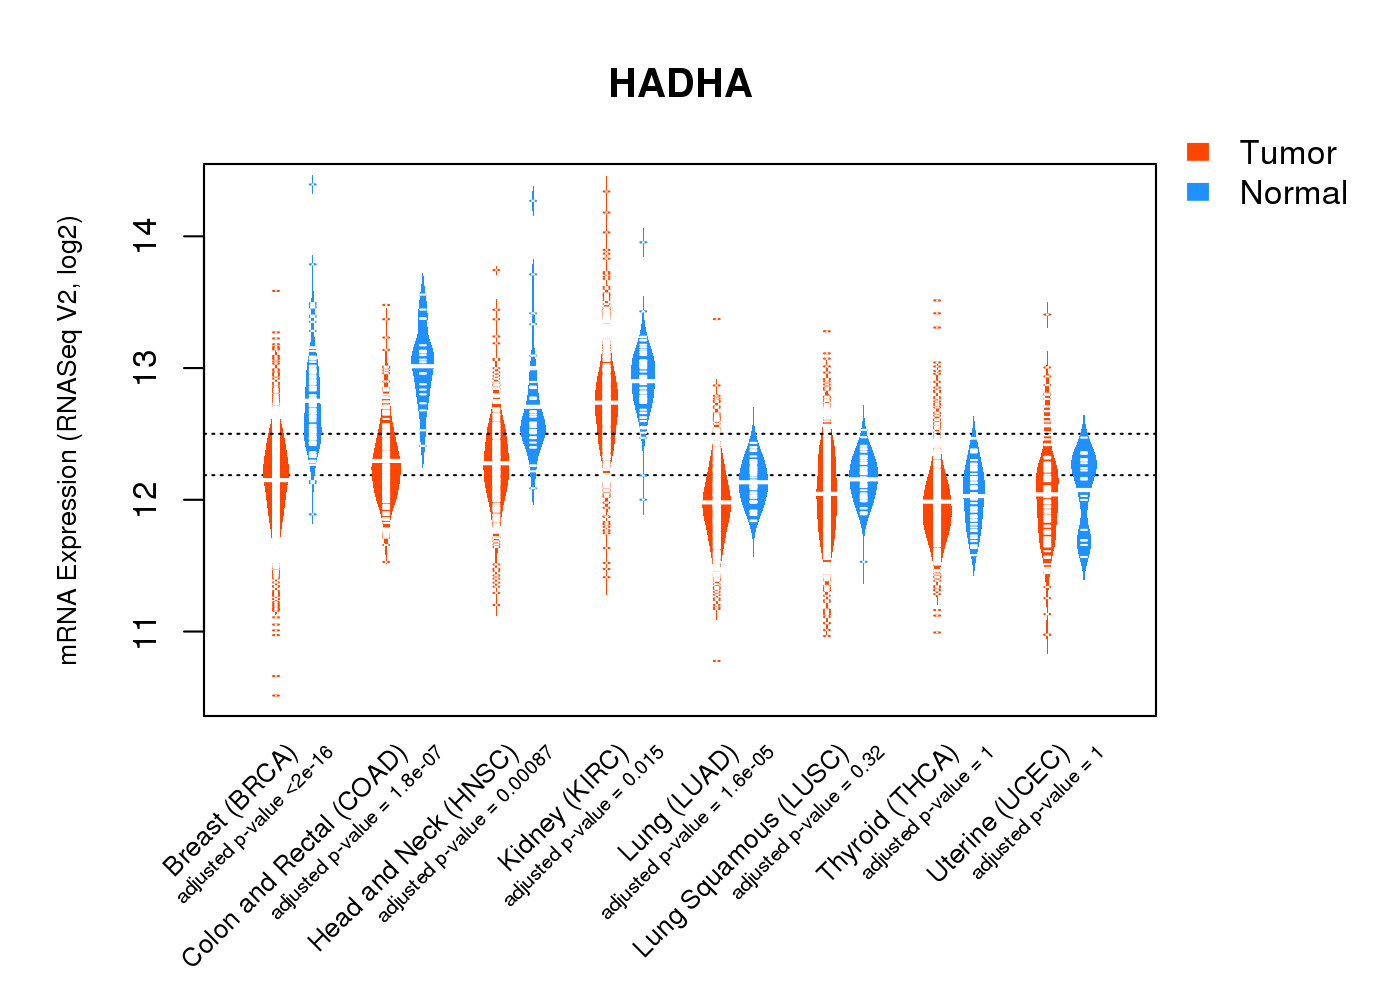
| * Normalized gene expression data of RNASeqV2 was extracted from TCGA using R package TCGA-Assembler. The URLs of all public data files on TCGA DCC data server were gathered at Jan-05-2015. Only eight cancer types have enough normal control samples for differential expression analysis. (t test, adjusted p<0.05 (using Benjamini-Hochberg FDR)) |
 |
| Top |
| * This plots show the correlation between CNV and gene expression. |
: Open all plots for all cancer types
 |
|
 |
|

| Top |
| Gene-Gene Network Information |
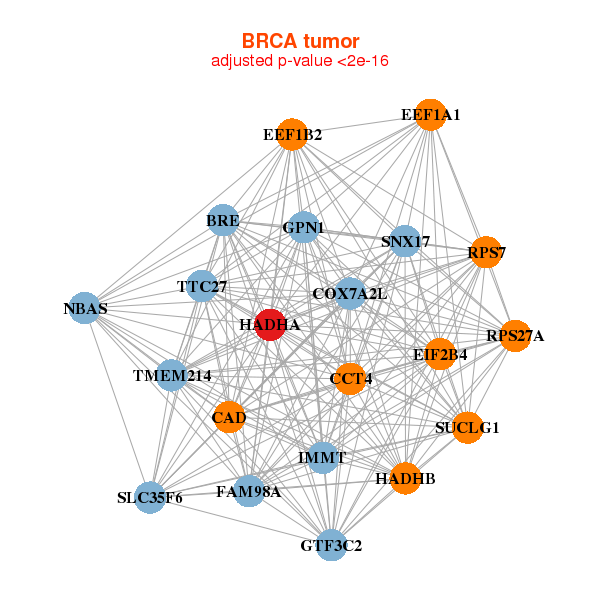
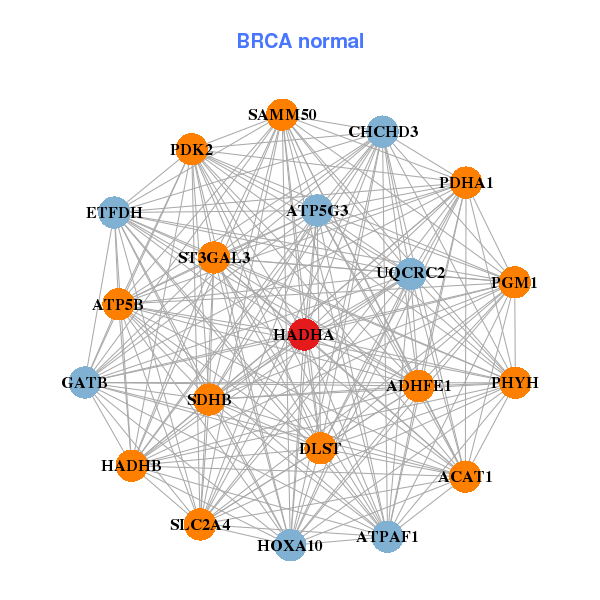
| * Co-Expression network figures were drawn using R package igraph. Only the top 20 genes with the highest correlations were shown. Red circle: input gene, orange circle: cell metabolism gene, sky circle: other gene |
: Open all plots for all cancer types
 |
| ||||
| BRE,SLC35F6,CAD,CCT4,COX7A2L,EEF1A1,EEF1B2, EIF2B4,FAM98A,GPN1,GTF3C2,HADHA,HADHB,IMMT, NBAS,RPS27A,RPS7,SNX17,SUCLG1,TMEM214,TTC27 | ACAT1,ADHFE1,ATP5B,ATP5G3,ATPAF1,CHCHD3,DLST, ETFDH,HADHA,HADHB,HOXA10,PDHA1,PDK2,GATB, PGM1,PHYH,SAMM50,SDHB,SLC2A4,ST3GAL3,UQCRC2 | ||||
 |
| ||||
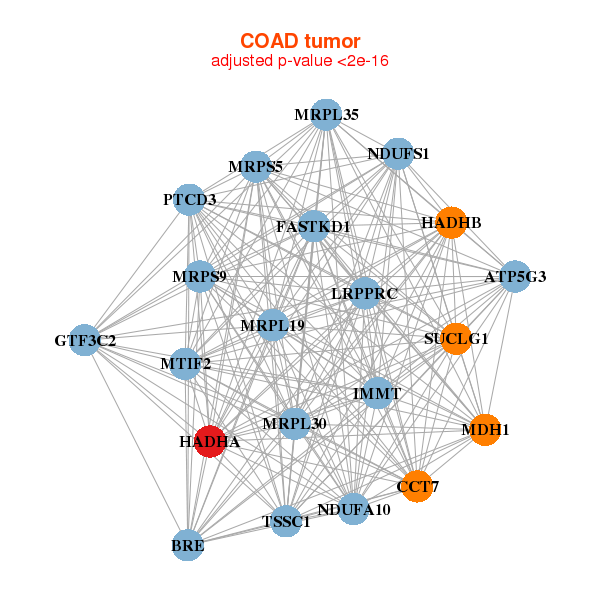
| ATP5G3,BRE,CCT7,FASTKD1,GTF3C2,HADHA,HADHB, IMMT,LRPPRC,MDH1,MRPL19,MRPL30,MRPL35,MRPS5, MRPS9,MTIF2,NDUFA10,NDUFS1,PTCD3,SUCLG1,TSSC1 | ACO2,ACOX1,ACSL5,AGPAT3,ANKS4B,ANO10,DAPK2, GDPD2,HADHA,HADHB,KALRN,KBTBD11,LASP1,LPCAT3, MGAT4A,PBLD,POR,SLC27A4,SLC41A2,SPHK2,TOR1AIP2 |
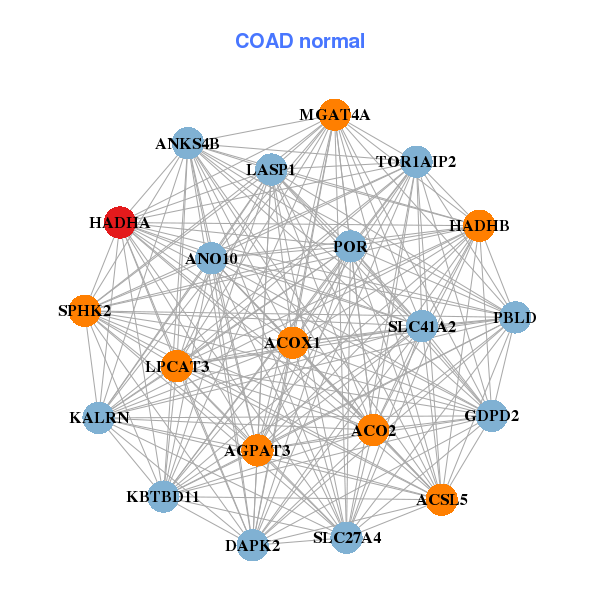
| * Co-Expression network figures were drawn using R package igraph. Only the top 20 genes with the highest correlations were shown. Red circle: input gene, orange circle: cell metabolism gene, sky circle: other gene |
: Open all plots for all cancer types
| Top |
: Open all interacting genes' information including KEGG pathway for all interacting genes from DAVID
| Top |
| Pharmacological Information for HADHA |
| DB Category | DB Name | DB's ID and Url link |
| * Gene Centered Interaction Network. |
 |
| * Drug Centered Interaction Network. |
| DrugBank ID | Target Name | Drug Groups | Generic Name | Drug Centered Network | Drug Structure |
| DB00157 | hydroxyacyl-CoA dehydrogenase/3-ketoacyl-CoA thiolase/enoyl-CoA hydratase (trifunctional protein), alpha subunit | approved; nutraceutical | NADH |  |  |
| Top |
| Cross referenced IDs for HADHA |
| * We obtained these cross-references from Uniprot database. It covers 150 different DBs, 18 categories. http://www.uniprot.org/help/cross_references_section |
: Open all cross reference information
|
Copyright © 2016-Present - The Univsersity of Texas Health Science Center at Houston @ |