|
||||||||||||||||||||||||||||||||||||||||||||||||||||||||||||||||||||||||||||||||||||||||||||||||||||||||||||||||||||||||||||||||||||||||||||||||||||||||||||||||||||||||||||||||||||||||||||||||||||||||||||||||||||||||||||||||||||||||||||||||||||||||||||||||||||||||||||||||||||||||||||||||||||||||||||||||||||||||||
| |
| Phenotypic Information (metabolism pathway, cancer, disease, phenome) |
| |
| |
| Gene-Gene Network Information: Co-Expression Network, Interacting Genes & KEGG |
| |
|


| Gene Summary for HADHB |
| Basic gene info. | Gene symbol | HADHB |
| Gene name | hydroxyacyl-CoA dehydrogenase/3-ketoacyl-CoA thiolase/enoyl-CoA hydratase (trifunctional protein), beta subunit | |
| Synonyms | ECHB|MTPB|TP-BETA | |
| Cytomap | UCSC genome browser: 2p23 | |
| Genomic location | chr2 :26467615-26513333 | |
| Type of gene | protein-coding | |
| RefGenes | NM_000183.2, NM_001281512.1,NM_001281513.1, | |
| Ensembl id | ENSG00000138029 | |
| Description | 2-enoyl-Coenzyme A (CoA) hydratase, beta subunit3-ketoacyl-Coenzyme A (CoA) thiolase of mitochondrial trifunctional protein, beta subunitacetyl-CoA acyltransferasebeta-ketothiolasehydroxyacyl-Coenzyme A dehydrogenase/3-ketoacyl-Coenzyme A thiolase/eno | |
| Modification date | 20141207 | |
| dbXrefs | MIM : 143450 | |
| HGNC : HGNC | ||
| Ensembl : ENSG00000138029 | ||
| HPRD : 00887 | ||
| Vega : OTTHUMG00000096978 | ||
| Protein | UniProt: P55084 go to UniProt's Cross Reference DB Table | |
| Expression | CleanEX: HS_HADHB | |
| BioGPS: 3032 | ||
| Gene Expression Atlas: ENSG00000138029 | ||
| The Human Protein Atlas: ENSG00000138029 | ||
| Pathway | NCI Pathway Interaction Database: HADHB | |
| KEGG: HADHB | ||
| REACTOME: HADHB | ||
| ConsensusPathDB | ||
| Pathway Commons: HADHB | ||
| Metabolism | MetaCyc: HADHB | |
| HUMANCyc: HADHB | ||
| Regulation | Ensembl's Regulation: ENSG00000138029 | |
| miRBase: chr2 :26,467,615-26,513,333 | ||
| TargetScan: NM_000183 | ||
| cisRED: ENSG00000138029 | ||
| Context | iHOP: HADHB | |
| cancer metabolism search in PubMed: HADHB | ||
| UCL Cancer Institute: HADHB | ||
| Assigned class in ccmGDB | A - This gene has a literature evidence and it belongs to cancer gene. | |
| References showing role of HADHB in cancer cell metabolism | 1. Mazzio EA, Boukli N, Rivera N, Soliman KF (2012) Pericellular pH homeostasis is a primary function of the Warburg effect: inversion of metabolic systems to control lactate steady state in tumor cells. Cancer Sci 103: 422-432. doi: 10.1111/j.1349-7006.2012.02206.x. pmid: 3294166. go to article 2. Zhou Z, Zhou J, Du Y (2012) Estrogen receptor alpha interacts with mitochondrial protein HADHB and affects beta-oxidation activity. Mol Cell Proteomics 11: M111 011056. doi: 10.1074/mcp.M111.011056. pmid: 3394935. go to article 3. Fernandez-Hernando C, Suarez Y, Rayner KJ, Moore KJ (2011) MicroRNAs in lipid metabolism. Curr Opin Lipidol 22: 86-92. doi: 10.1097/MOL.0b013e3283428d9d. pmid: 3096067. go to article 4. Zhou Z, Zhou J, Du Y (2012) Estrogen receptor beta interacts and colocalizes with HADHB in mitochondria. Biochem Biophys Res Commun 427: 305-308. doi: 10.1016/j.bbrc.2012.09.047. pmid: 3485071. go to article | |
| Top |
| Phenotypic Information for HADHB(metabolism pathway, cancer, disease, phenome) |
| Cancer | CGAP: HADHB |
| Familial Cancer Database: HADHB | |
| * This gene is included in those cancer gene databases. |
|
|
|
|
|
|
| ||||||||||||||||||||||||||||||||||||||||||||||||||||||||||||||||||||||||||||||||||||||||||||||||||||||||||||||||||||||||||||||||||||||||||||||||||||||||||||||||||||||||||||||||||||||||||||||||||||||||||||||||||||||||||||||||||||||||||||||||||||||||||||||||||||||||||||||||||||||||||||||||||||||||||||||||||||
Oncogene 1 | Significant driver gene in | |||||||||||||||||||||||||||||||||||||||||||||||||||||||||||||||||||||||||||||||||||||||||||||||||||||||||||||||||||||||||||||||||||||||||||||||||||||||||||||||||||||||||||||||||||||||||||||||||||||||||||||||||||||||||||||||||||||||||||||||||||||||||||||||||||||||||||||||||||||||||||||||||||||||||||||||||||||||||
| cf) number; DB name 1 Oncogene; http://nar.oxfordjournals.org/content/35/suppl_1/D721.long, 2 Tumor Suppressor gene; https://bioinfo.uth.edu/TSGene/, 3 Cancer Gene Census; http://www.nature.com/nrc/journal/v4/n3/abs/nrc1299.html, 4 CancerGenes; http://nar.oxfordjournals.org/content/35/suppl_1/D721.long, 5 Network of Cancer Gene; http://ncg.kcl.ac.uk/index.php, 1Therapeutic Vulnerabilities in Cancer; http://cbio.mskcc.org/cancergenomics/statius/ |
| KEGG_FATTY_ACID_METABOLISM REACTOME_PHOSPHOLIPID_METABOLISM REACTOME_METABOLISM_OF_LIPIDS_AND_LIPOPROTEINS | |
| OMIM | 143450; gene. 609015; phenotype. |
| Orphanet | 746; Mitochondrial trifunctional protein deficiency. |
| Disease | KEGG Disease: HADHB |
| MedGen: HADHB (Human Medical Genetics with Condition) | |
| ClinVar: HADHB | |
| Phenotype | MGI: HADHB (International Mouse Phenotyping Consortium) |
| PhenomicDB: HADHB | |
| Mutations for HADHB |
| * Under tables are showing count per each tissue to give us broad intuition about tissue specific mutation patterns.You can go to the detailed page for each mutation database's web site. |
| - Statistics for Tissue and Mutation type | Top |
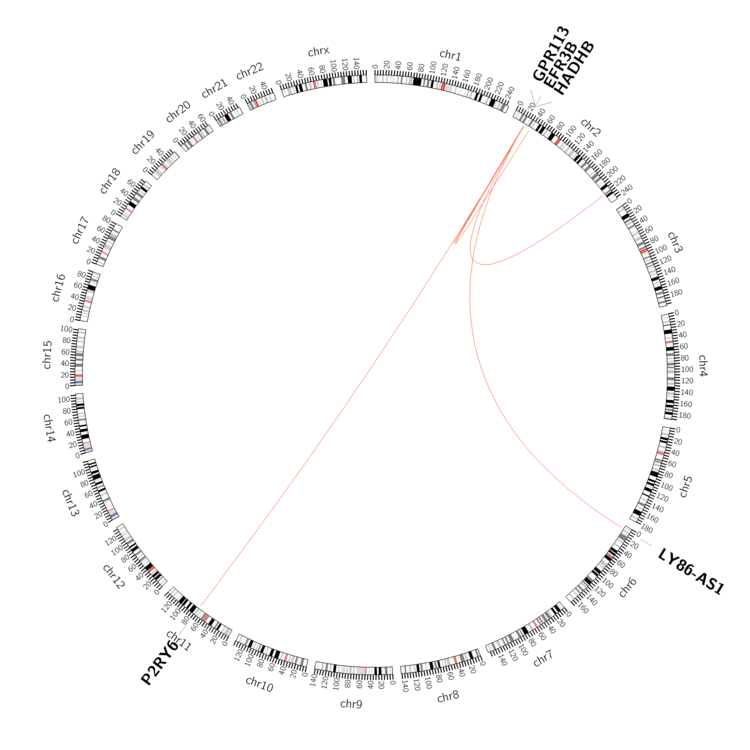 |
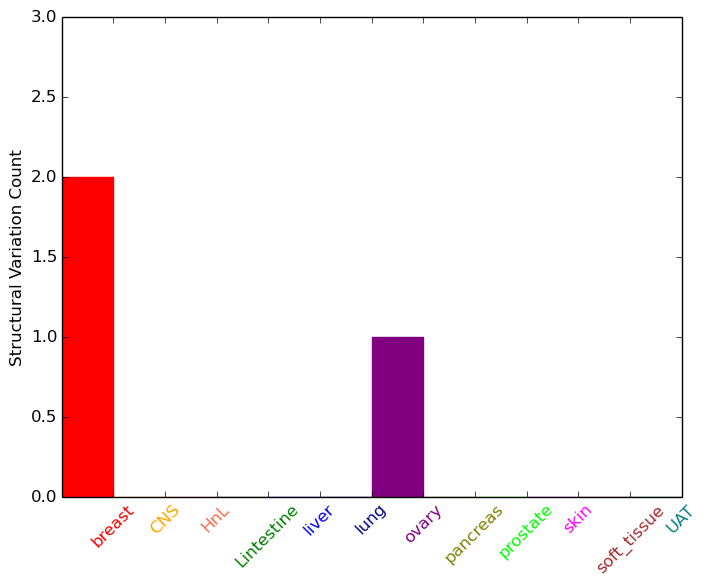
| - For Inter-chromosomal Variations |
| * Inter-chromosomal variantions includes 'interchromosomal amplicon to amplicon', 'interchromosomal amplicon to non-amplified dna', 'interchromosomal insertion', 'Interchromosomal unknown type'. |
 |
| - For Intra-chromosomal Variations |
| * Intra-chromosomal variantions includes 'intrachromosomal amplicon to amplicon', 'intrachromosomal amplicon to non-amplified dna', 'intrachromosomal deletion', 'intrachromosomal fold-back inversion', 'intrachromosomal inversion', 'intrachromosomal tandem duplication', 'Intrachromosomal unknown type', 'intrachromosomal with inverted orientation', 'intrachromosomal with non-inverted orientation'. |
 |
| Sample | Symbol_a | Chr_a | Start_a | End_a | Symbol_b | Chr_b | Start_b | End_b |
| breast | HADHB | chr2 | 26499144 | 26499144 | GPR113 | chr2 | 26541553 | 26541553 |
| breast | HADHB | chr2 | 26500776 | 26500776 | chr2 | 222957214 | 222957214 | |
| breast | HADHB | chr2 | 26500921 | 26500921 | EFR3B | chr2 | 25373697 | 25373697 |
| breast | HADHB | chr2 | 26500921 | 26500921 | LY86-AS1 | chr6 | 6402870 | 6402870 |
| ovary | HADHB | chr2 | 26473261 | 26473281 | chr2 | 38659886 | 38659906 | |
| ovary | HADHB | chr2 | 26492282 | 26492302 | P2RY6 | chr11 | 72996068 | 72996088 |
| cf) Tissue number; Tissue name (1;Breast, 2;Central_nervous_system, 3;Haematopoietic_and_lymphoid_tissue, 4;Large_intestine, 5;Liver, 6;Lung, 7;Ovary, 8;Pancreas, 9;Prostate, 10;Skin, 11;Soft_tissue, 12;Upper_aerodigestive_tract) |
| * From mRNA Sanger sequences, Chitars2.0 arranged chimeric transcripts. This table shows HADHB related fusion information. |
| ID | Head Gene | Tail Gene | Accession | Gene_a | qStart_a | qEnd_a | Chromosome_a | tStart_a | tEnd_a | Gene_a | qStart_a | qEnd_a | Chromosome_a | tStart_a | tEnd_a |
| DA426922 | BOLA2 | 1 | 214 | 16 | 29830861 | 29831656 | HADHB | 212 | 522 | 2 | 26486245 | 26499999 | |
| AI004639 | HADHB | 2 | 100 | 2 | 26512870 | 26512968 | AHSA1 | 95 | 253 | 14 | 77928517 | 77929074 | |
| Top |
| Mutation type/ Tissue ID | brca | cns | cerv | endome | haematopo | kidn | Lintest | liver | lung | ns | ovary | pancre | prost | skin | stoma | thyro | urina | |||
| Total # sample | 1 | 1 | 1 | |||||||||||||||||
| GAIN (# sample) | 1 | |||||||||||||||||||
| LOSS (# sample) | 1 | 1 |
| cf) Tissue ID; Tissue type (1; Breast, 2; Central_nervous_system, 3; Cervix, 4; Endometrium, 5; Haematopoietic_and_lymphoid_tissue, 6; Kidney, 7; Large_intestine, 8; Liver, 9; Lung, 10; NS, 11; Ovary, 12; Pancreas, 13; Prostate, 14; Skin, 15; Stomach, 16; Thyroid, 17; Urinary_tract) |
| Top |
|
 |
| Top |
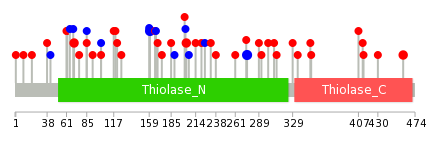
| Stat. for Non-Synonymous SNVs (# total SNVs=36) | (# total SNVs=13) |
 | 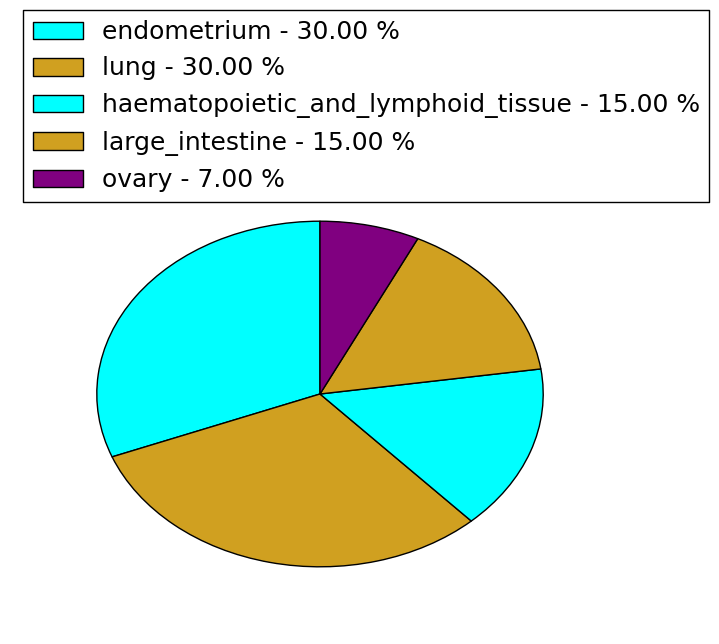 |
(# total SNVs=1) | (# total SNVs=1) |
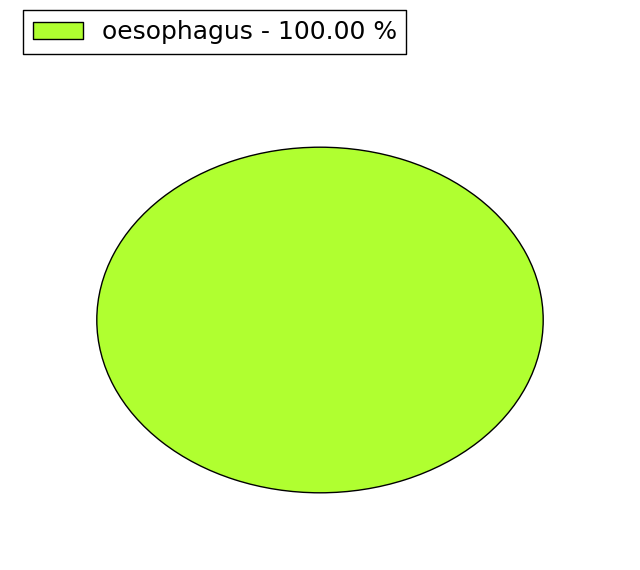 | 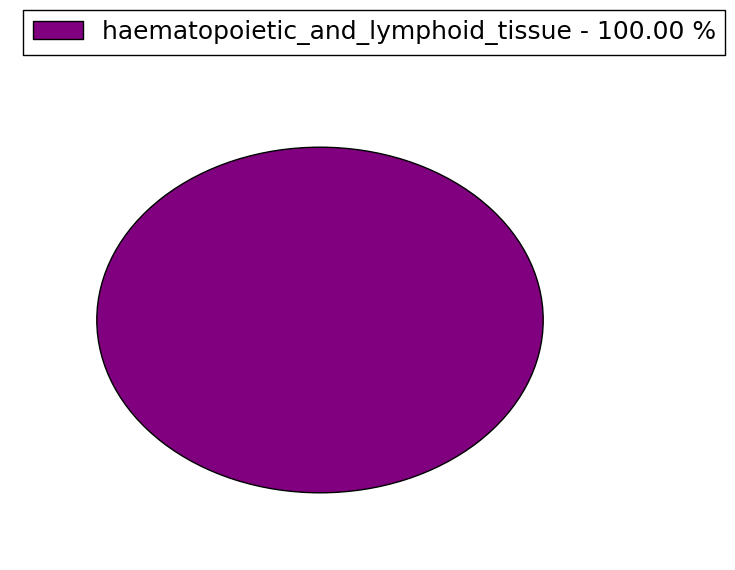 |
| Top |
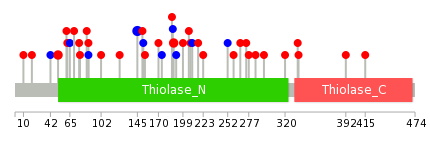
| * When you move the cursor on each content, you can see more deailed mutation information on the Tooltip. Those are primary_site,primary_histology,mutation(aa),pubmedID. |
| GRCh37 position | Mutation(aa) | Unique sampleID count |
| chr2:26501519-26501519 | p.I160I | 3 |
| chr2:26502875-26502875 | p.V275V | 3 |
| chr2:26501646-26501646 | p.R203* | 3 |
| chr2:26508429-26508429 | p.A460V | 2 |
| chr2:26486347-26486347 | p.S70L | 2 |
| chr2:26492866-26492866 | p.? | 2 |
| chr2:26501647-26501647 | p.R203Q | 2 |
| chr2:26507820-26507820 | p.T407A | 1 |
| chr2:26486264-26486264 | p.T42T | 1 |
| chr2:26501657-26501657 | p.F206F | 1 |
| Top |
|
 |
| Point Mutation/ Tissue ID | 1 | 2 | 3 | 4 | 5 | 6 | 7 | 8 | 9 | 10 | 11 | 12 | 13 | 14 | 15 | 16 | 17 | 18 | 19 | 20 |
| # sample | 2 | 2 | 9 | 2 | 3 | 5 | 4 | 1 | 1 | 6 | 4 | 7 | ||||||||
| # mutation | 2 | 2 | 9 | 2 | 3 | 5 | 4 | 1 | 1 | 6 | 4 | 7 | ||||||||
| nonsynonymous SNV | 2 | 2 | 8 | 1 | 3 | 5 | 3 | 1 | 2 | 4 | 4 | |||||||||
| synonymous SNV | 1 | 1 | 1 | 1 | 4 | 3 |
| cf) Tissue ID; Tissue type (1; BLCA[Bladder Urothelial Carcinoma], 2; BRCA[Breast invasive carcinoma], 3; CESC[Cervical squamous cell carcinoma and endocervical adenocarcinoma], 4; COAD[Colon adenocarcinoma], 5; GBM[Glioblastoma multiforme], 6; Glioma Low Grade, 7; HNSC[Head and Neck squamous cell carcinoma], 8; KICH[Kidney Chromophobe], 9; KIRC[Kidney renal clear cell carcinoma], 10; KIRP[Kidney renal papillary cell carcinoma], 11; LAML[Acute Myeloid Leukemia], 12; LUAD[Lung adenocarcinoma], 13; LUSC[Lung squamous cell carcinoma], 14; OV[Ovarian serous cystadenocarcinoma ], 15; PAAD[Pancreatic adenocarcinoma], 16; PRAD[Prostate adenocarcinoma], 17; SKCM[Skin Cutaneous Melanoma], 18:STAD[Stomach adenocarcinoma], 19:THCA[Thyroid carcinoma], 20:UCEC[Uterine Corpus Endometrial Carcinoma]) |
| Top |
| * We represented just top 10 SNVs. When you move the cursor on each content, you can see more deailed mutation information on the Tooltip. Those are primary_site, primary_histology, mutation(aa), pubmedID. |
| Genomic Position | Mutation(aa) | Unique sampleID count |
| chr2:26501519 | p.I145I,HADHB | 3 |
| chr2:26501647 | p.R188Q,HADHB | 2 |
| chr2:26486289 | p.I51L,HADHB | 2 |
| chr2:26502035 | p.L65L,HADHB | 1 |
| chr2:26486322 | p.F187F,HADHB | 1 |
| chr2:26502980 | p.A320T,HADHB | 1 |
| chr2:26501535 | p.S70L,HADHB | 1 |
| chr2:26502041 | p.Q335H,HADHB | 1 |
| chr2:26486333 | p.P76T,HADHB | 1 |
| chr2:26505782 | p.F191F,HADHB | 1 |
| * Copy number data were extracted from TCGA using R package TCGA-Assembler. The URLs of all public data files on TCGA DCC data server were gathered on Jan-05-2015. Function ProcessCNAData in TCGA-Assembler package was used to obtain gene-level copy number value which is calculated as the average copy number of the genomic region of a gene. |
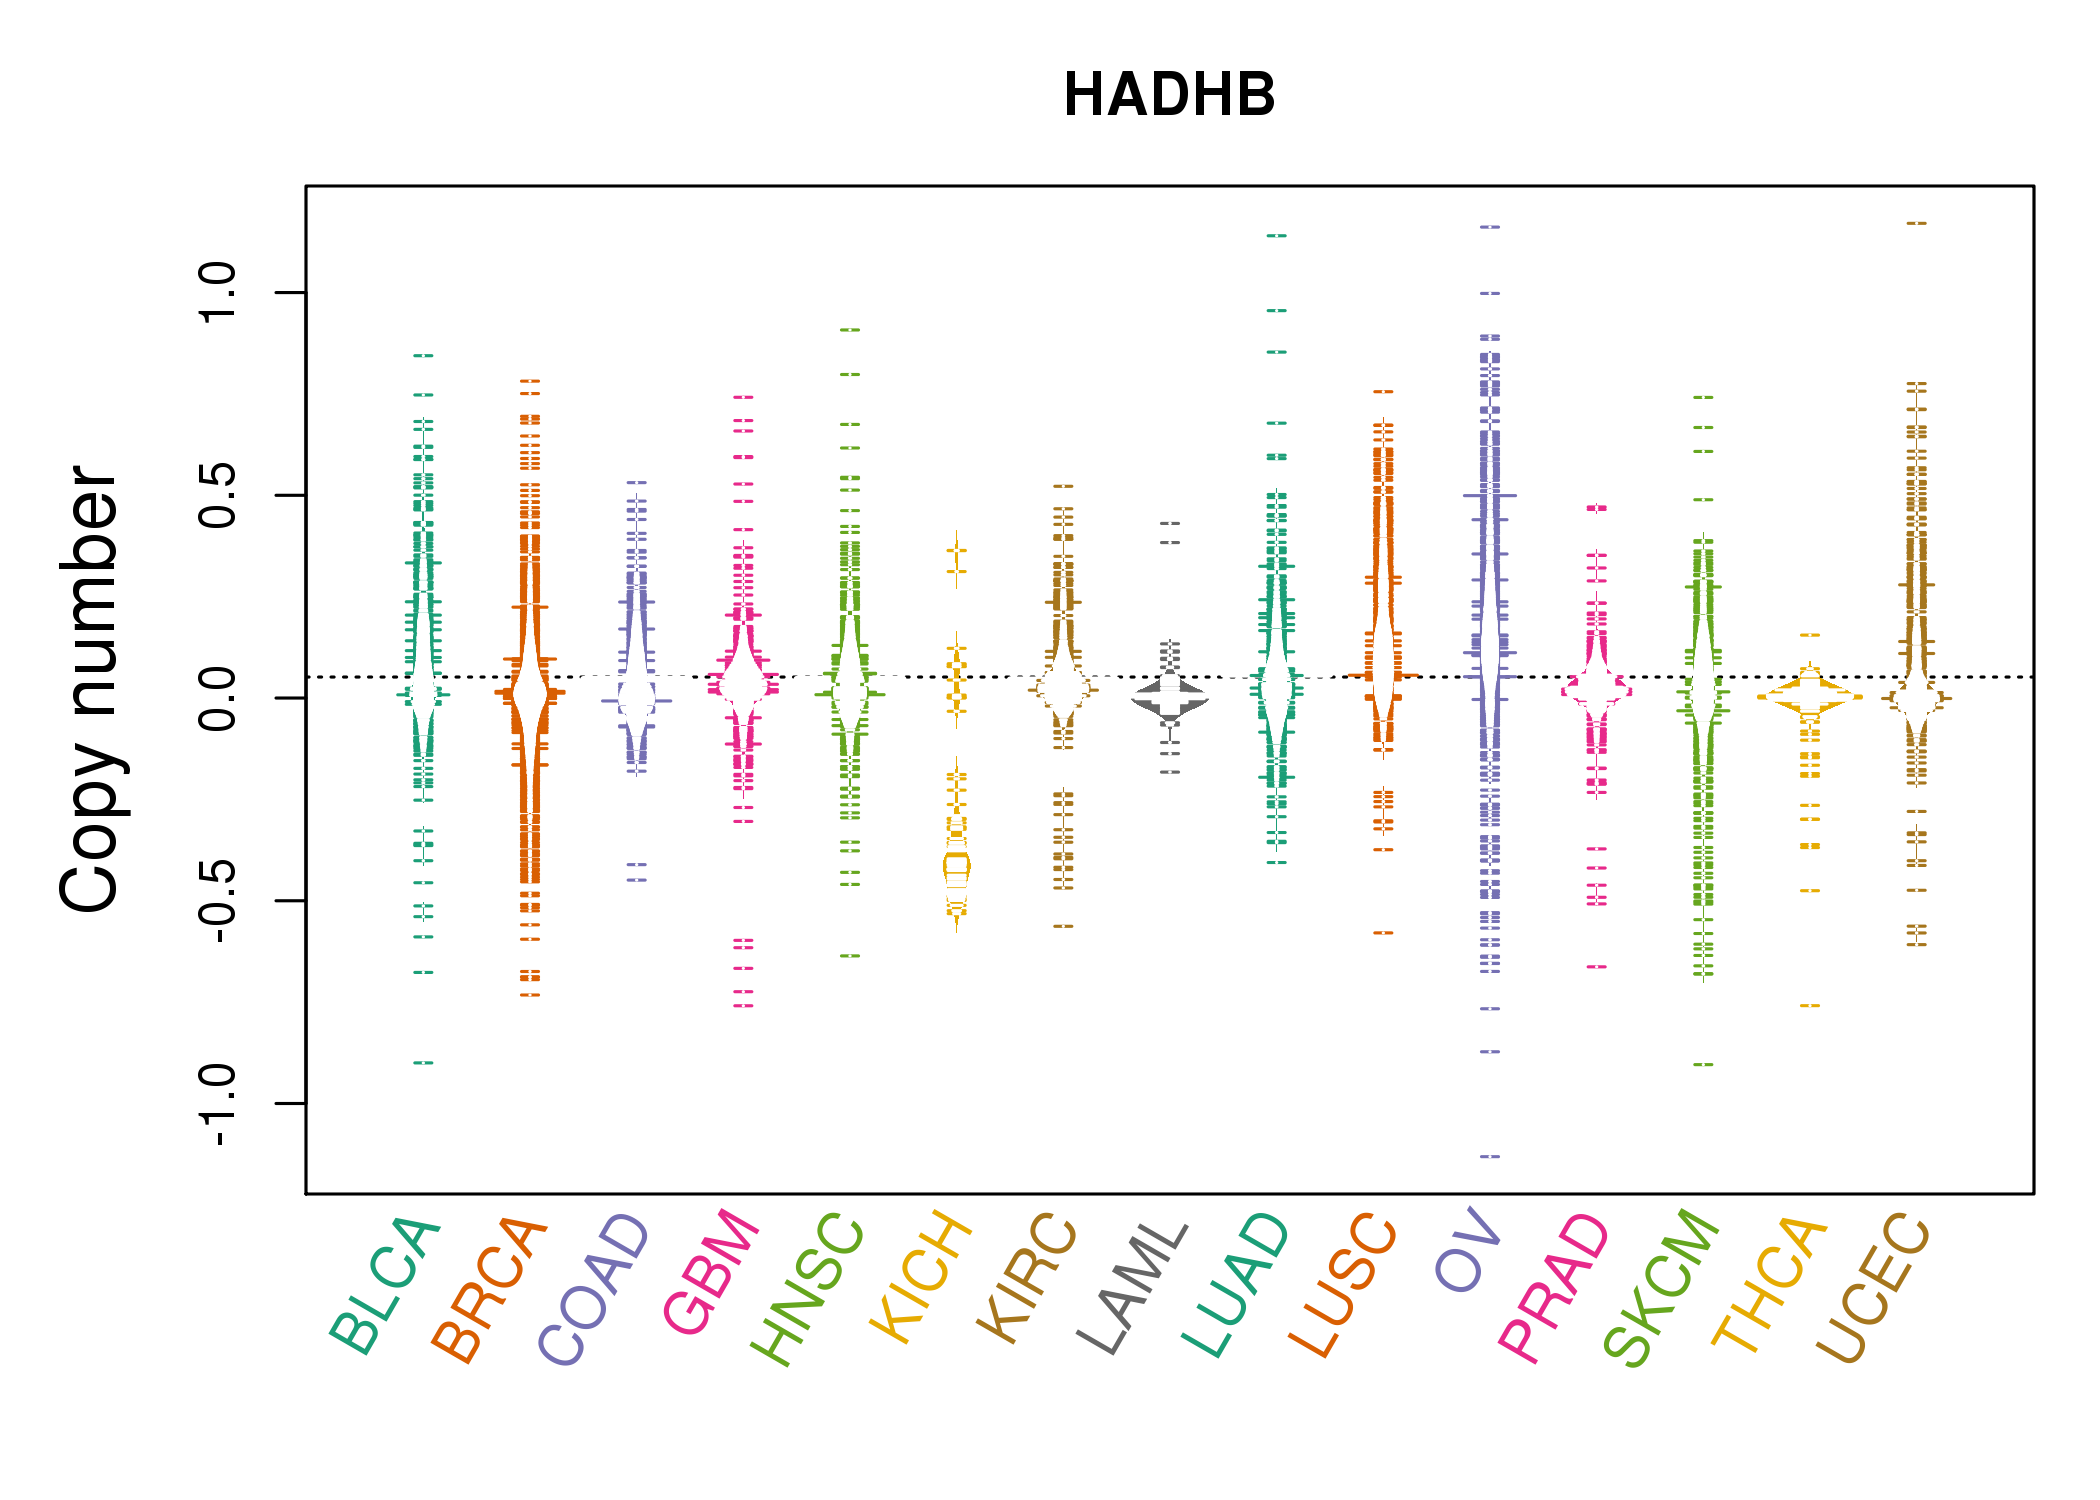 |
| cf) Tissue ID[Tissue type]: BLCA[Bladder Urothelial Carcinoma], BRCA[Breast invasive carcinoma], CESC[Cervical squamous cell carcinoma and endocervical adenocarcinoma], COAD[Colon adenocarcinoma], GBM[Glioblastoma multiforme], Glioma Low Grade, HNSC[Head and Neck squamous cell carcinoma], KICH[Kidney Chromophobe], KIRC[Kidney renal clear cell carcinoma], KIRP[Kidney renal papillary cell carcinoma], LAML[Acute Myeloid Leukemia], LUAD[Lung adenocarcinoma], LUSC[Lung squamous cell carcinoma], OV[Ovarian serous cystadenocarcinoma ], PAAD[Pancreatic adenocarcinoma], PRAD[Prostate adenocarcinoma], SKCM[Skin Cutaneous Melanoma], STAD[Stomach adenocarcinoma], THCA[Thyroid carcinoma], UCEC[Uterine Corpus Endometrial Carcinoma] |
| Top |
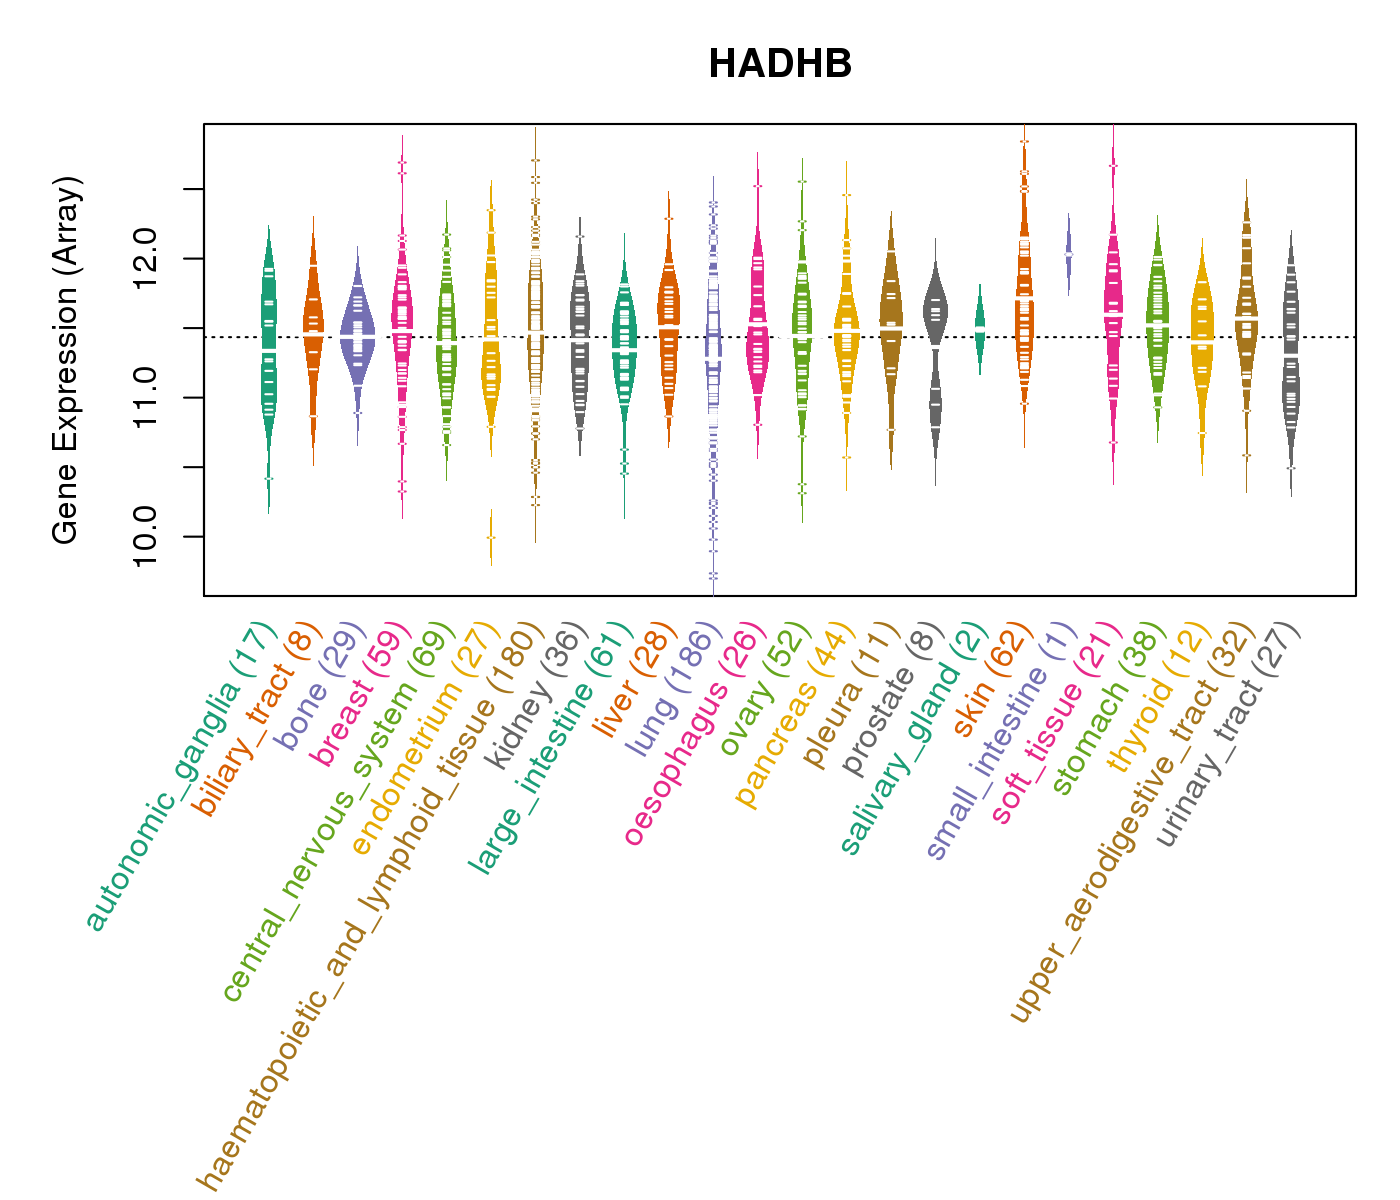
| Gene Expression for HADHB |
| * CCLE gene expression data were extracted from CCLE_Expression_Entrez_2012-10-18.res: Gene-centric RMA-normalized mRNA expression data. |
 |
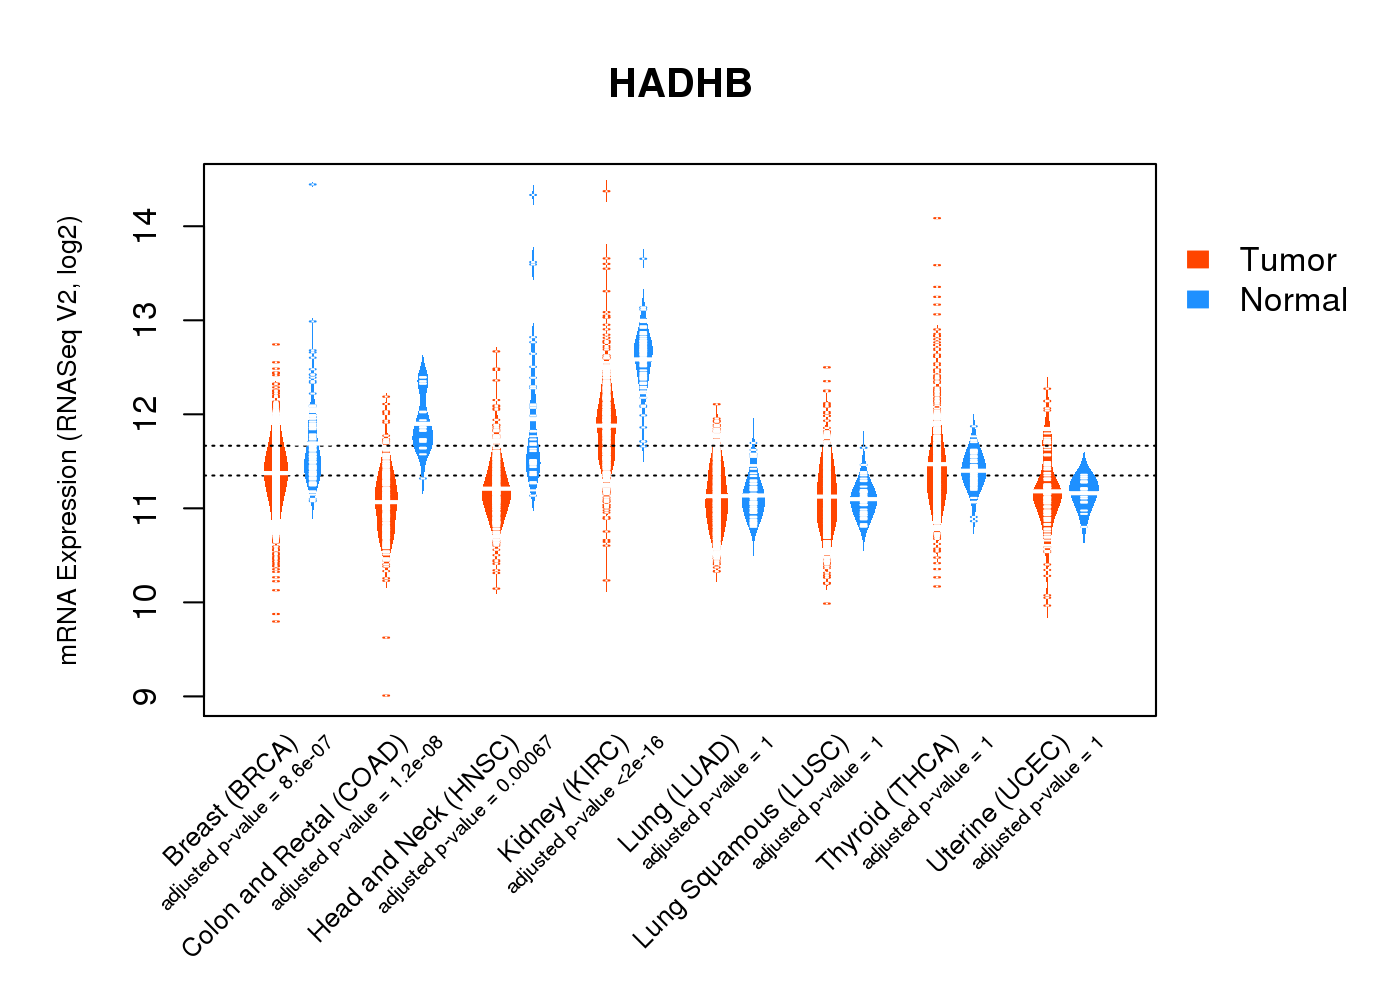
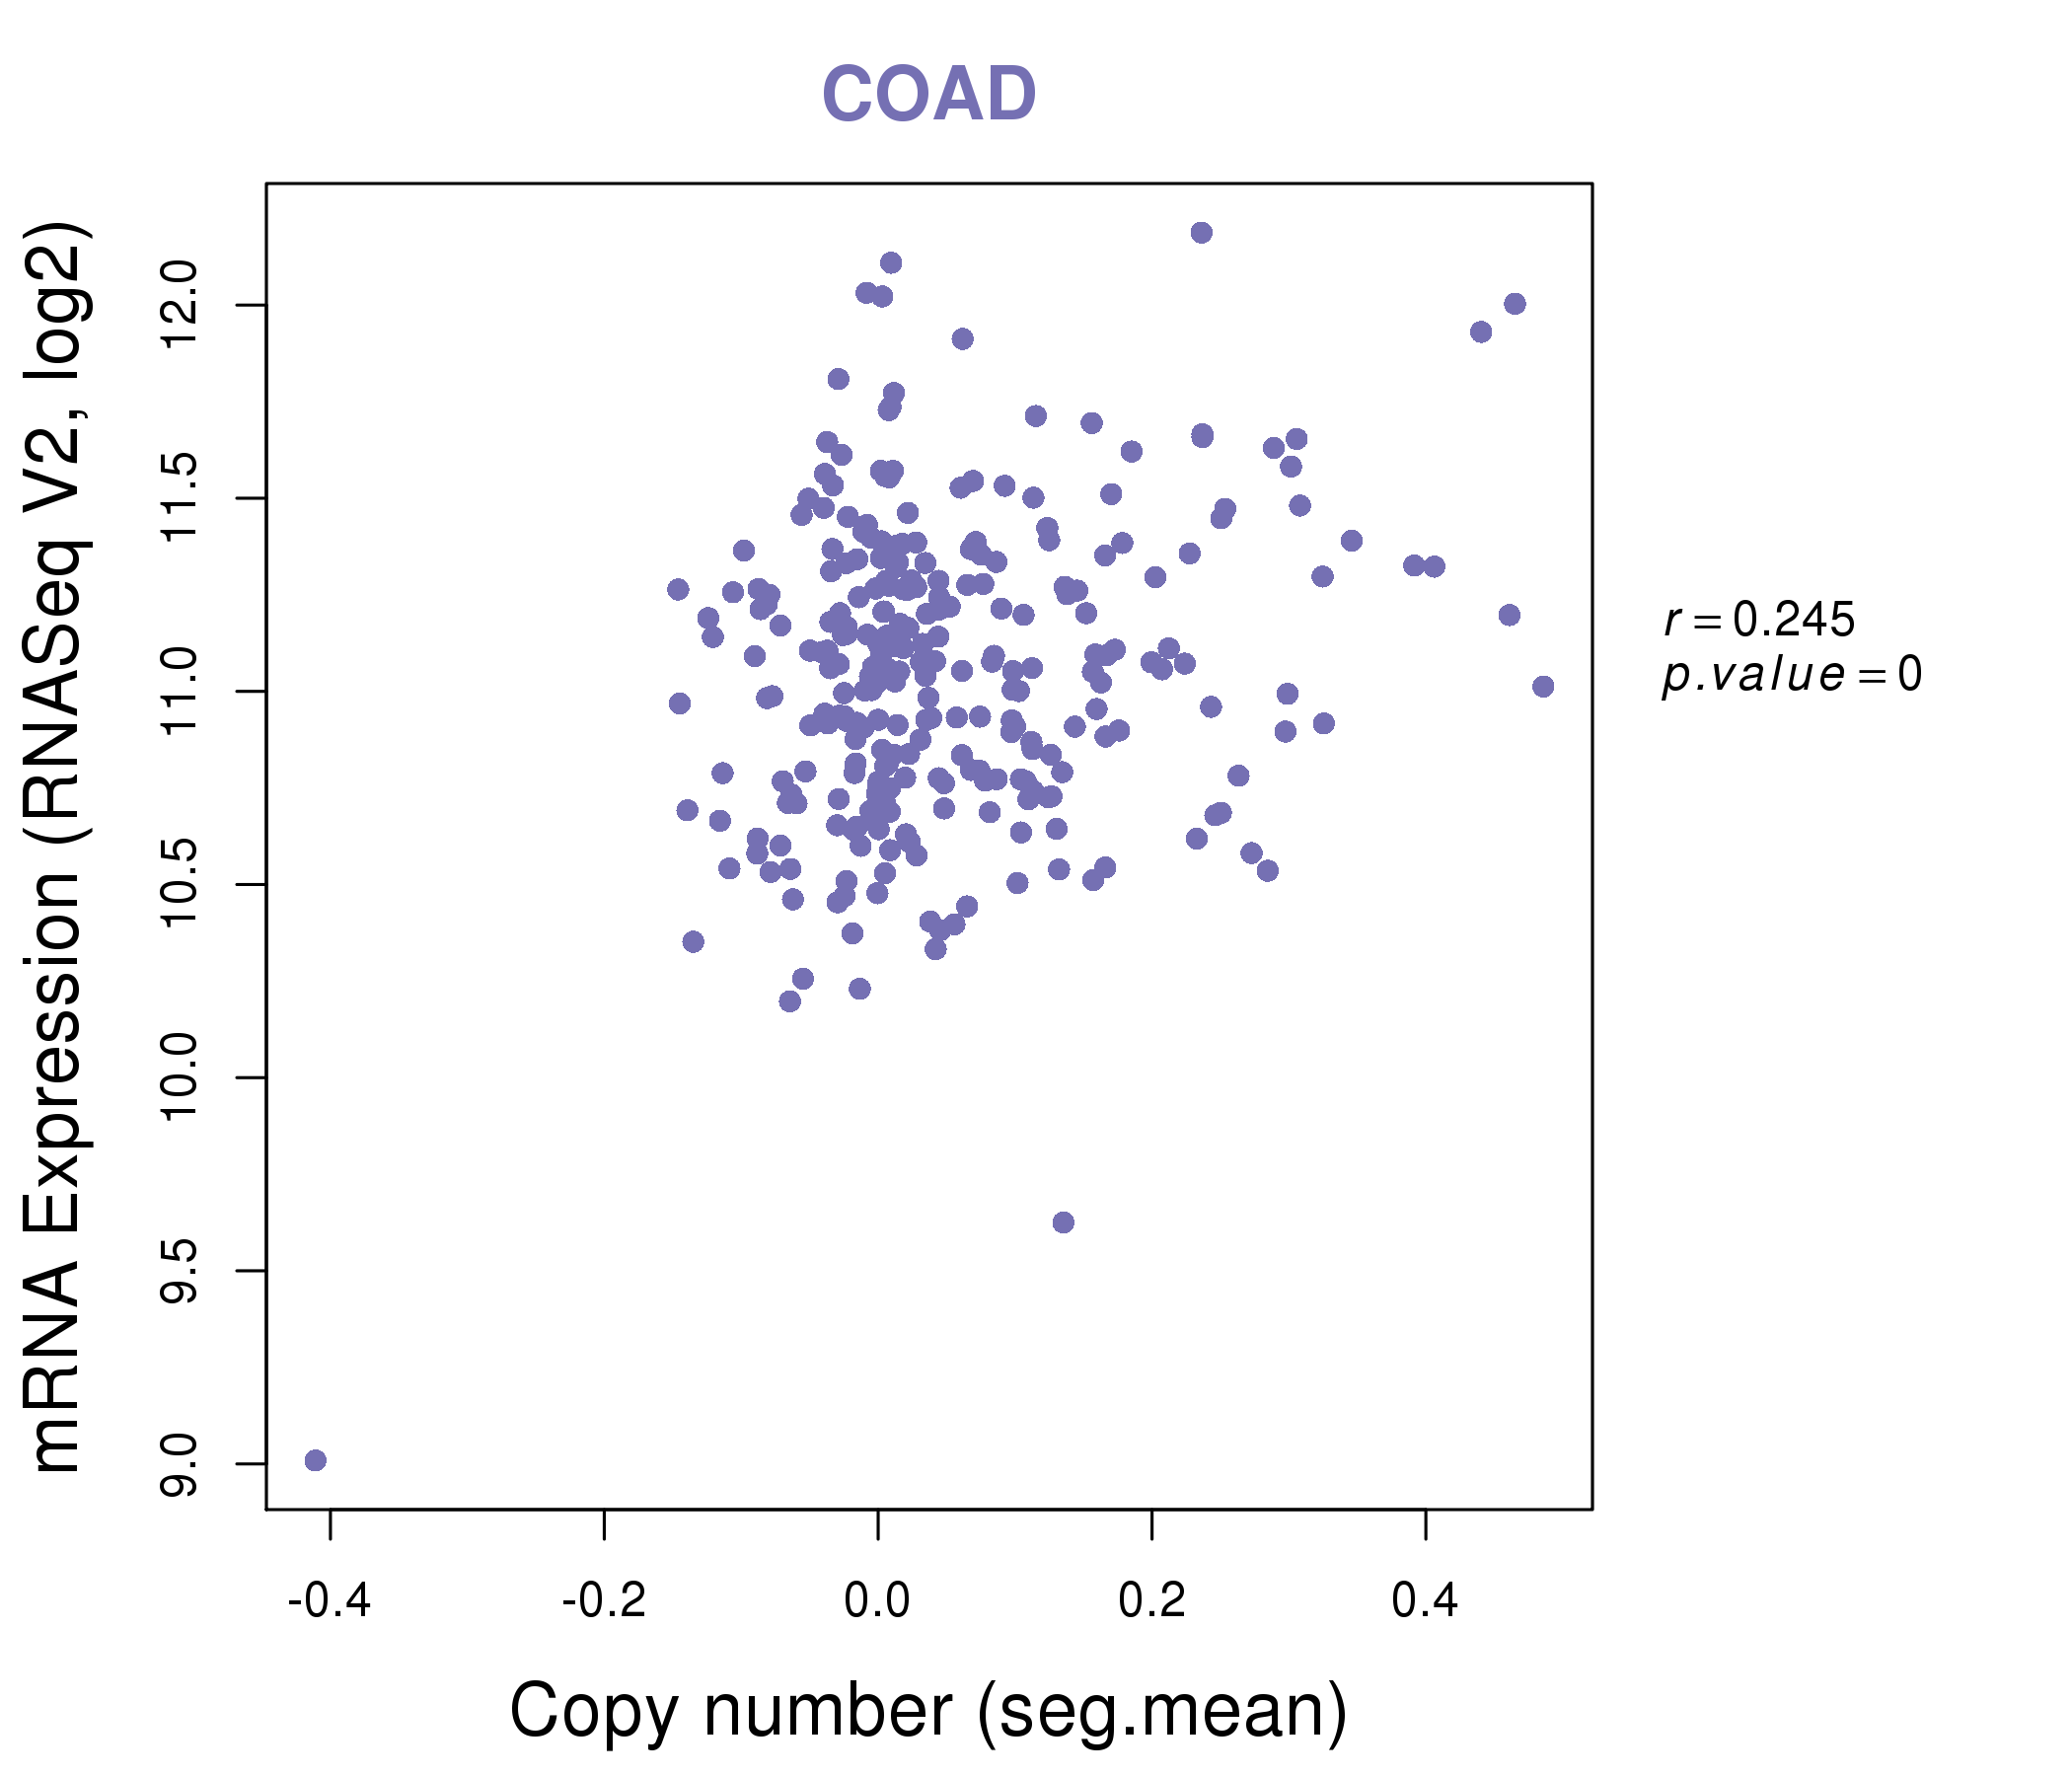
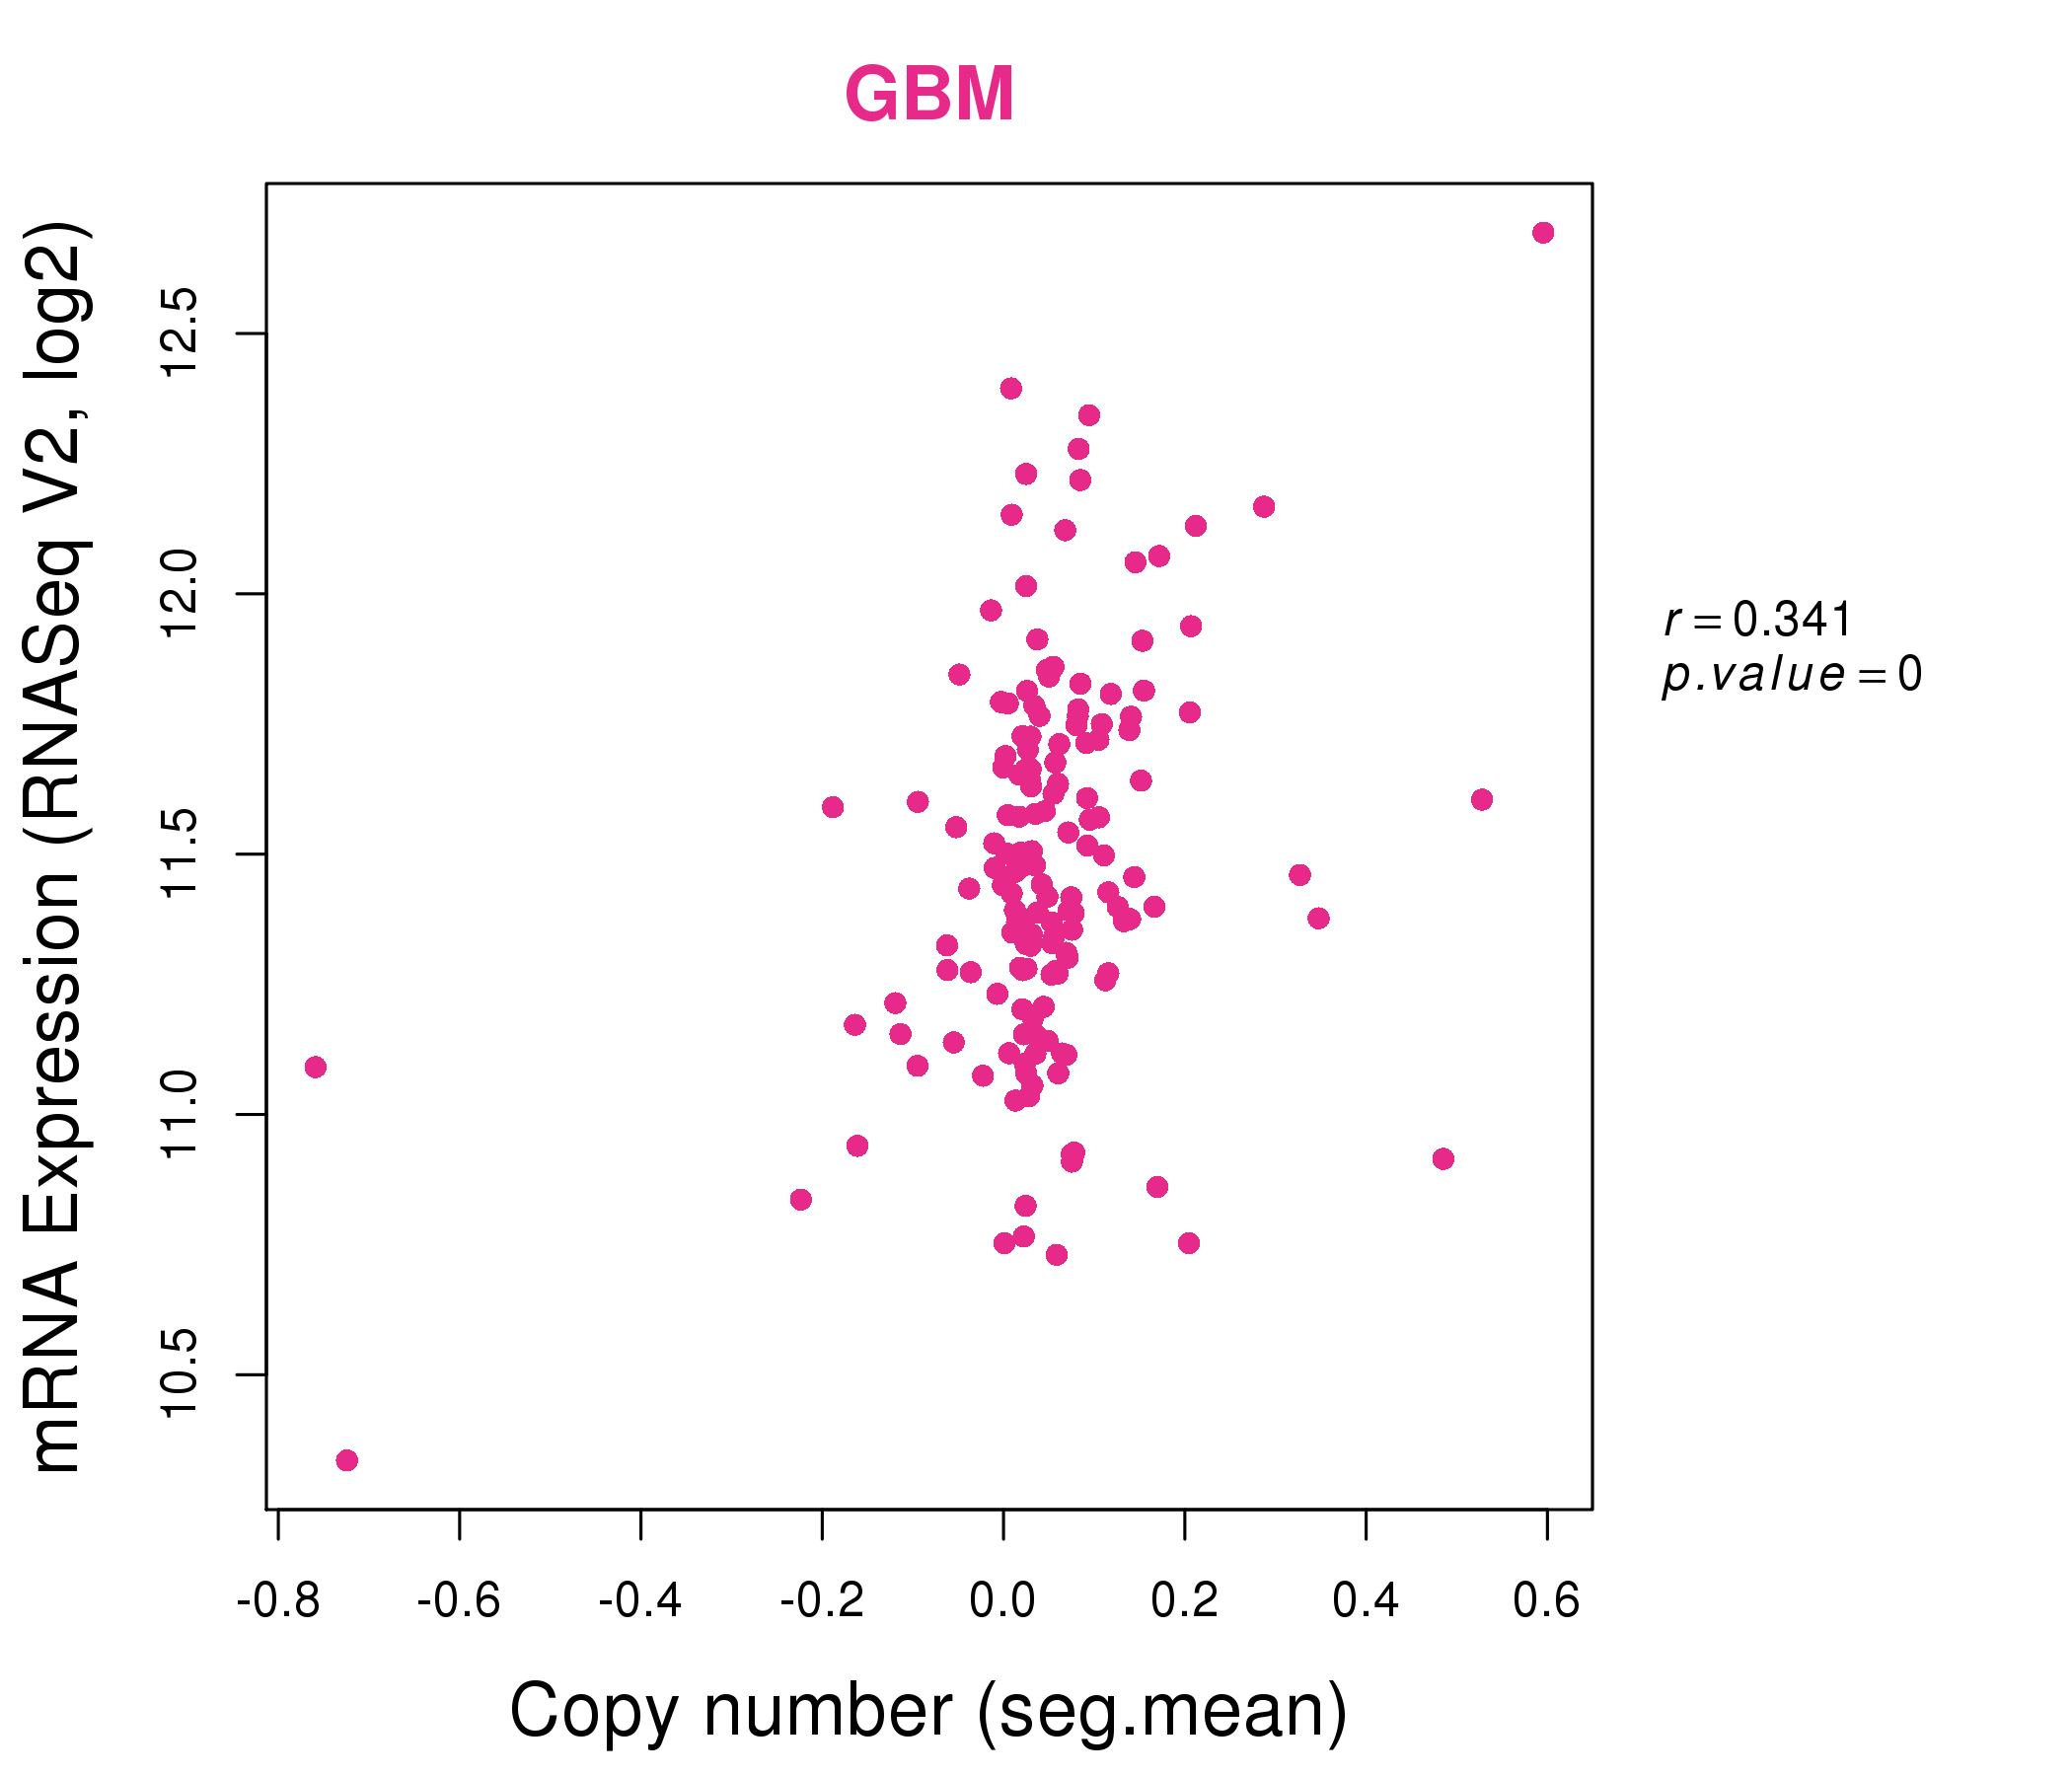
| * Normalized gene expression data of RNASeqV2 was extracted from TCGA using R package TCGA-Assembler. The URLs of all public data files on TCGA DCC data server were gathered at Jan-05-2015. Only eight cancer types have enough normal control samples for differential expression analysis. (t test, adjusted p<0.05 (using Benjamini-Hochberg FDR)) |
 |
| Top |
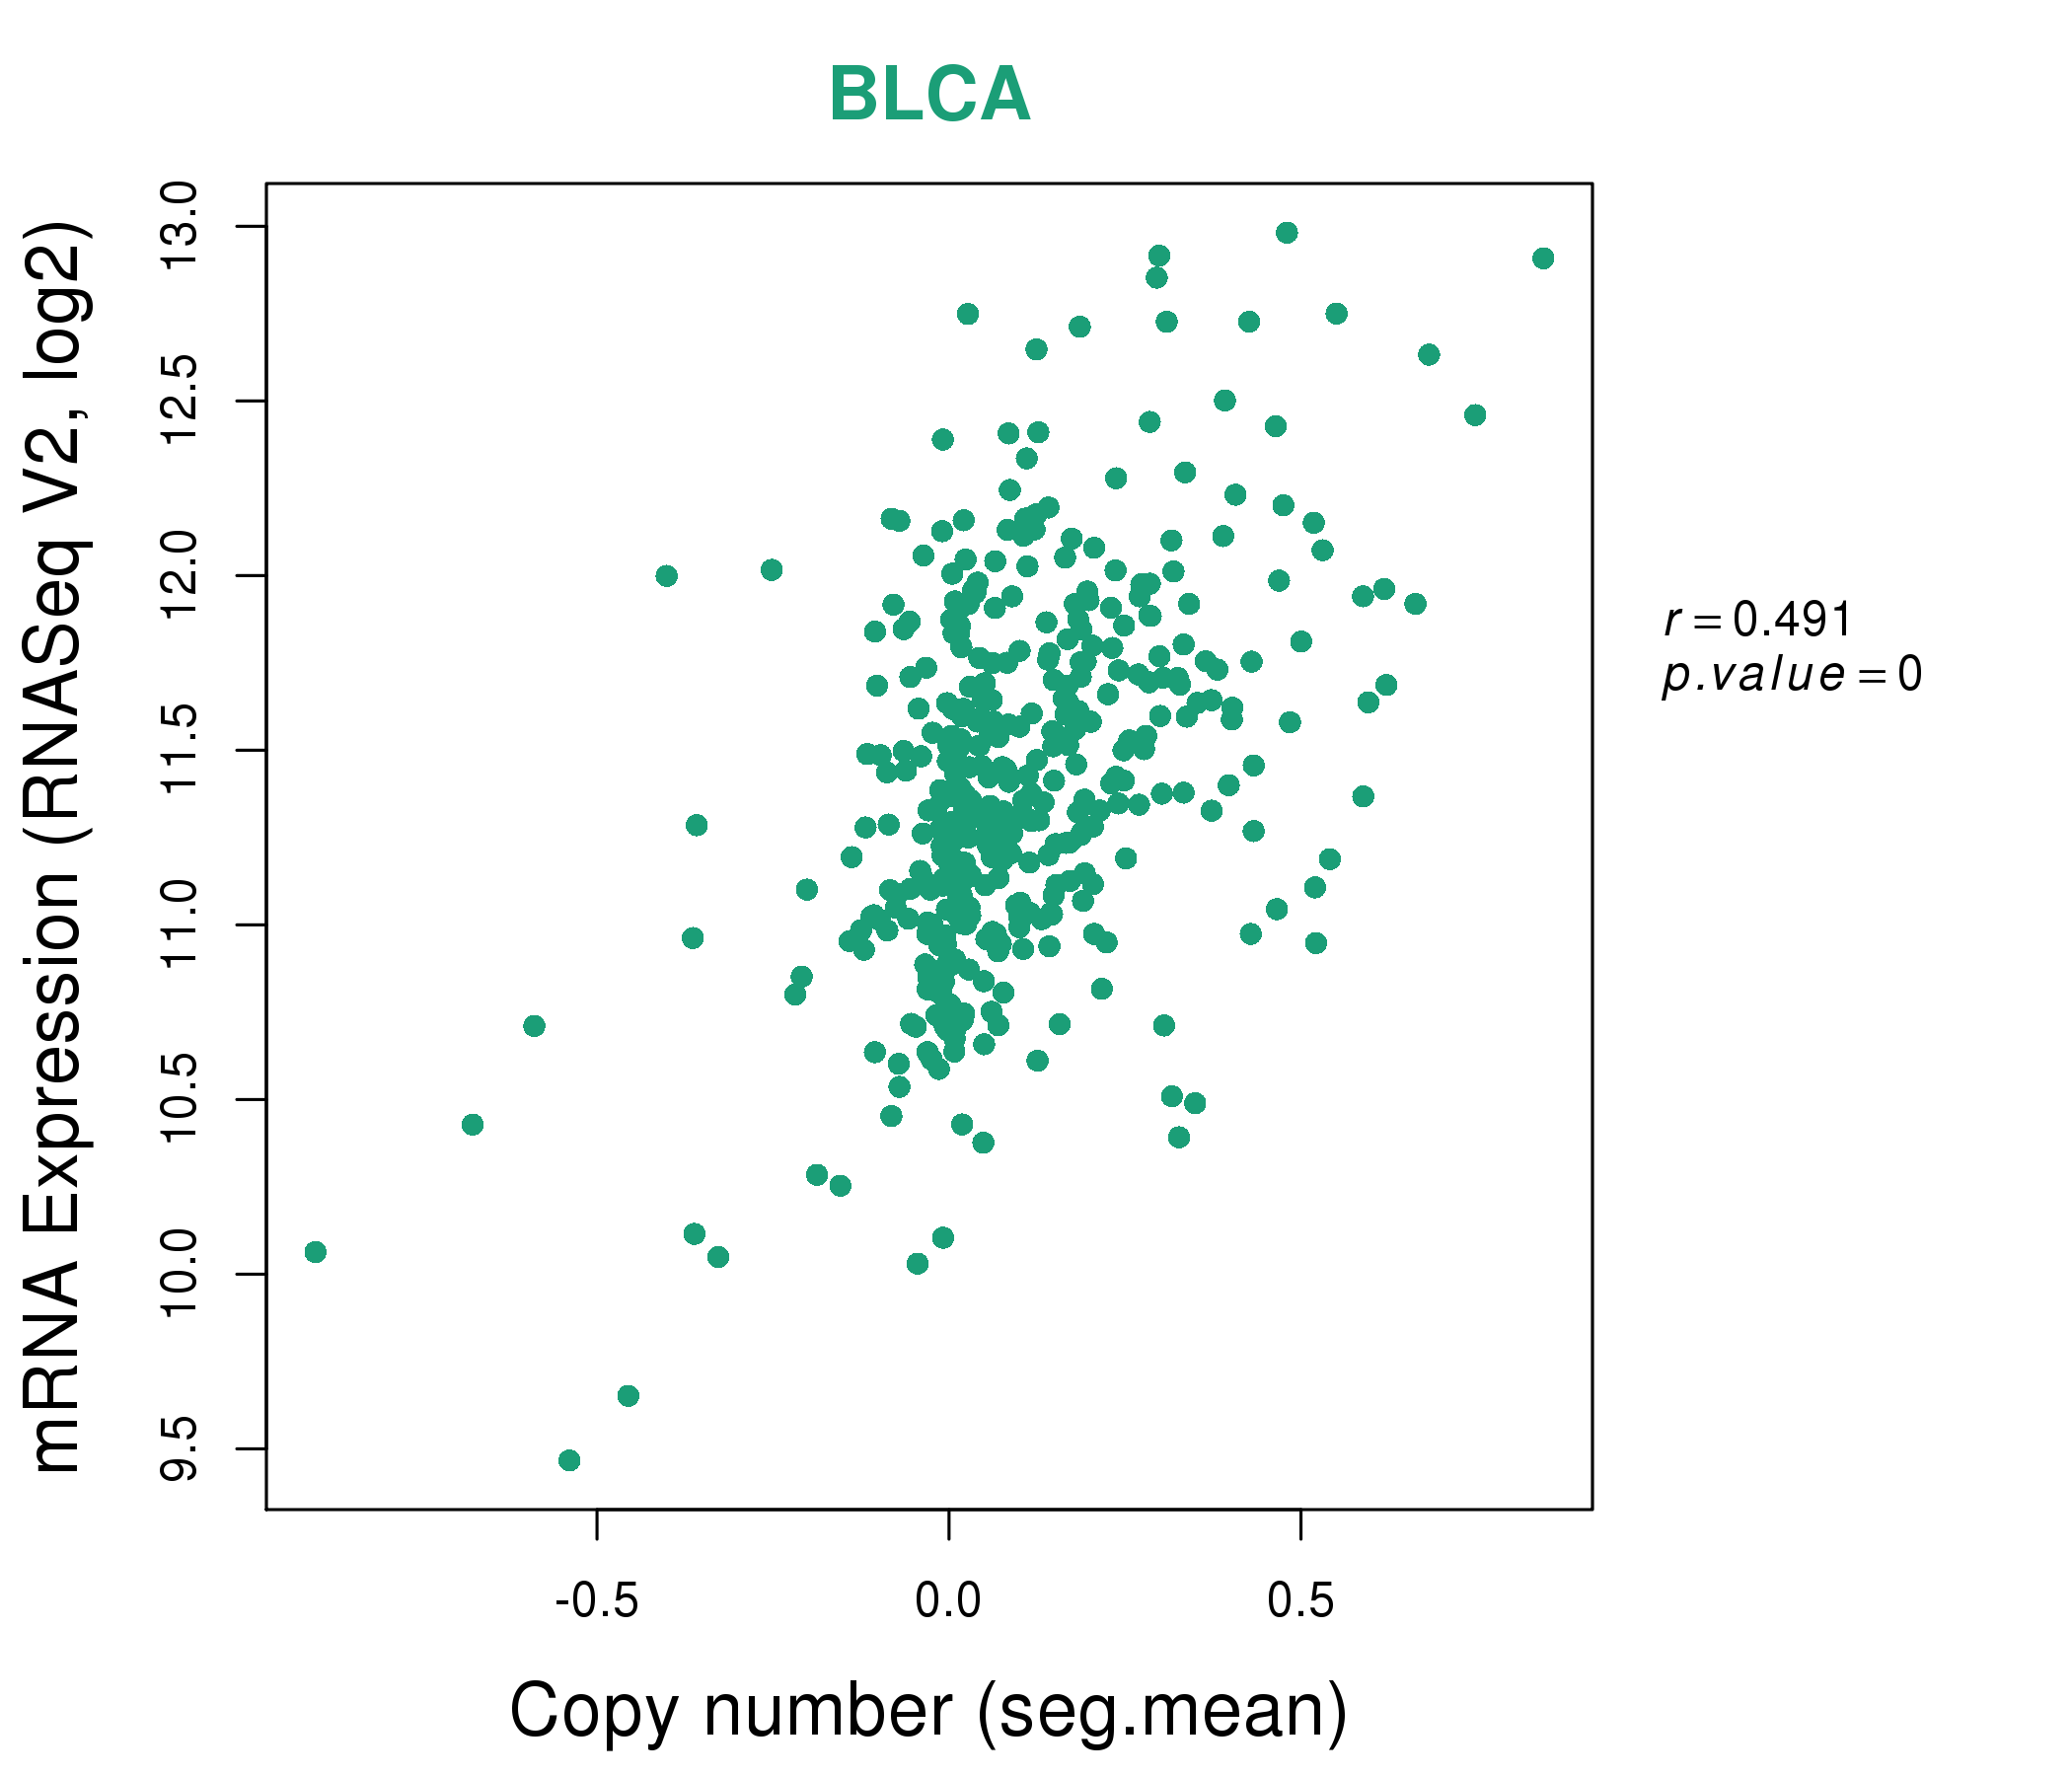
| * This plots show the correlation between CNV and gene expression. |
: Open all plots for all cancer types
 |
|
 |
|

| Top |
| Gene-Gene Network Information |
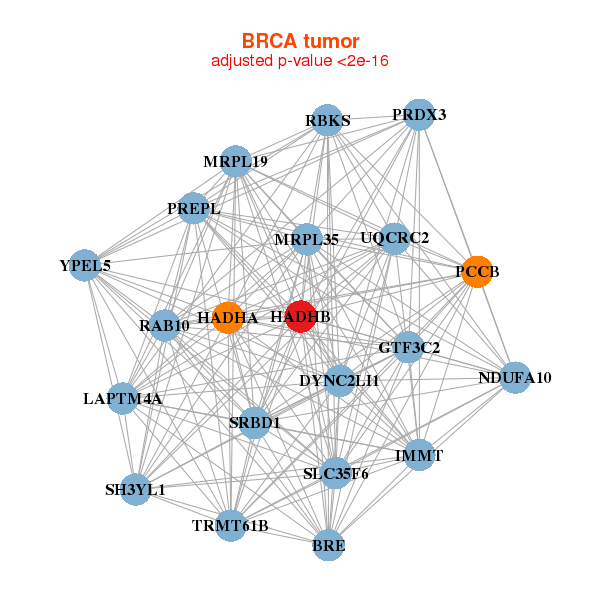
| * Co-Expression network figures were drawn using R package igraph. Only the top 20 genes with the highest correlations were shown. Red circle: input gene, orange circle: cell metabolism gene, sky circle: other gene |
: Open all plots for all cancer types
 |
|
| BRE,SLC35F6,DYNC2LI1,GTF3C2,HADHA,HADHB,IMMT, LAPTM4A,MRPL19,MRPL35,NDUFA10,PCCB,PRDX3,PREPL, RAB10,RBKS,SH3YL1,SRBD1,TRMT61B,UQCRC2,YPEL5 | ACAT1,ATP5B,ADCK3,COX5A,EPM2A,MTFR1L,FH, HADHB,KLHL31,NDUFS1,NNT,NRD1,PDHX,PHYH, PPP3CB,RRAGD,RXRG,SCN4A,SDHB,SNTA1,UQCRFS1 |
 |
|
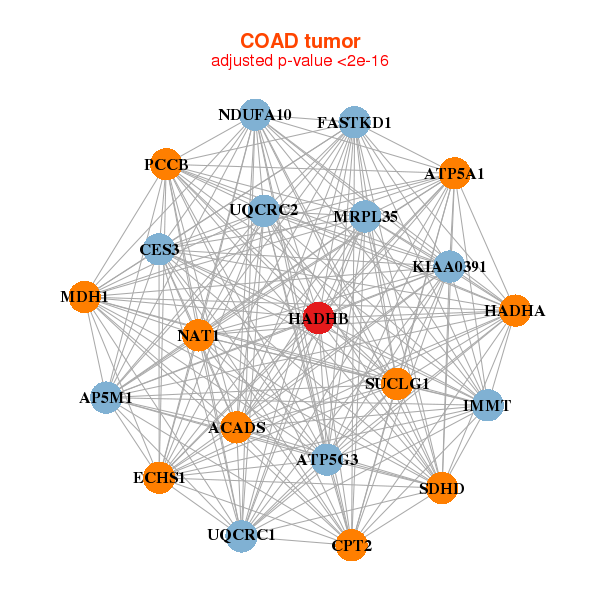
| ACADS,ATP5A1,ATP5G3,CES3,CPT2,ECHS1,FASTKD1, HADHA,HADHB,IMMT,KIAA0391,MDH1,MRPL35,AP5M1, NAT1,NDUFA10,PCCB,SDHD,SUCLG1,UQCRC1,UQCRC2 | ACSL5,AKR1B10,BTD,CROT,CYP2B6,CYP2C18,GDPD2, HADHA,HADHB,HSD17B11,NCOA4,PBLD,PGRMC1,PRAP1, RBKS,SLC23A3,SLC3A1,SNX24,TMBIM6,TMEM82,TOR1AIP2 |
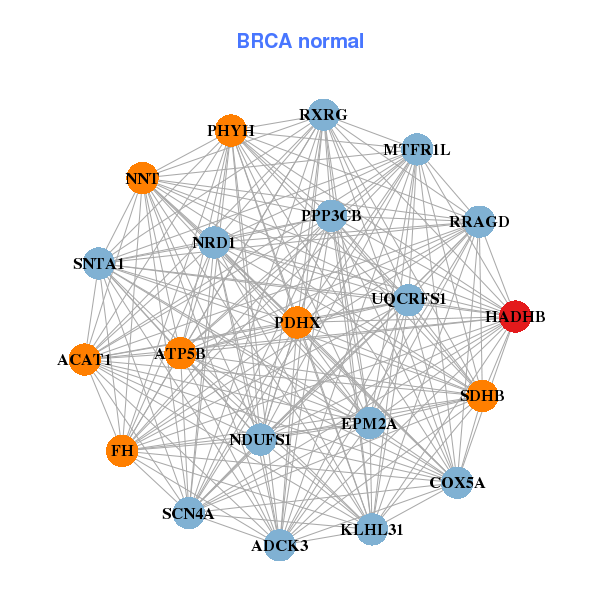

| * Co-Expression network figures were drawn using R package igraph. Only the top 20 genes with the highest correlations were shown. Red circle: input gene, orange circle: cell metabolism gene, sky circle: other gene |
: Open all plots for all cancer types
| Top |
: Open all interacting genes' information including KEGG pathway for all interacting genes from DAVID
| Top |
| Pharmacological Information for HADHB |
| There's no related Drug. |
| Top |
| Cross referenced IDs for HADHB |
| * We obtained these cross-references from Uniprot database. It covers 150 different DBs, 18 categories. http://www.uniprot.org/help/cross_references_section |
: Open all cross reference information
|
Copyright © 2016-Present - The Univsersity of Texas Health Science Center at Houston @ |