|
||||||||||||||||||||||||||||||||||||||||||||||||||||||||||||||||||||||||||||||||||||||||||||||||||||||||||||||||||||||||||||||||||||||||||||||||||||||||||||||||||||||||||||||||||||||||||||||||||||||||||||||||||||||||||||||||||||||||||||||||||||||||||||||||||||||||||||||||||||||||||||||||||||||||||||||||||||||||||
| |
| Phenotypic Information (metabolism pathway, cancer, disease, phenome) |
| |
| |
| Gene-Gene Network Information: Co-Expression Network, Interacting Genes & KEGG |
| |
|


| Gene Summary for HAS2 |
| Basic gene info. | Gene symbol | HAS2 |
| Gene name | hyaluronan synthase 2 | |
| Synonyms | - | |
| Cytomap | UCSC genome browser: 8q24.12 | |
| Genomic location | chr8 :122625270-122653630 | |
| Type of gene | protein-coding | |
| RefGenes | NM_005328.2, | |
| Ensembl id | ENSG00000170961 | |
| Description | HA synthase 2hyaluronate synthase 2hyaluronic acid synthase 2 | |
| Modification date | 20141207 | |
| dbXrefs | MIM : 601636 | |
| HGNC : HGNC | ||
| HPRD : 07045 | ||
| Protein | UniProt: Q92819 go to UniProt's Cross Reference DB Table | |
| Expression | CleanEX: HS_HAS2 | |
| BioGPS: 3037 | ||
| Gene Expression Atlas: ENSG00000170961 | ||
| The Human Protein Atlas: ENSG00000170961 | ||
| Pathway | NCI Pathway Interaction Database: HAS2 | |
| KEGG: HAS2 | ||
| REACTOME: HAS2 | ||
| ConsensusPathDB | ||
| Pathway Commons: HAS2 | ||
| Metabolism | MetaCyc: HAS2 | |
| HUMANCyc: HAS2 | ||
| Regulation | Ensembl's Regulation: ENSG00000170961 | |
| miRBase: chr8 :122,625,270-122,653,630 | ||
| TargetScan: NM_005328 | ||
| cisRED: ENSG00000170961 | ||
| Context | iHOP: HAS2 | |
| cancer metabolism search in PubMed: HAS2 | ||
| UCL Cancer Institute: HAS2 | ||
| Assigned class in ccmGDB | A - This gene has a literature evidence and it belongs to cancer gene. | |
| References showing role of HAS2 in cancer cell metabolism | 1. Vigetti D, Passi A (2014) Hyaluronan synthases posttranslational regulation in cancer. Adv Cancer Res 123: 95-119. doi: 10.1016/B978-0-12-800092-2.00004-6. go to article | |
| Top |
| Phenotypic Information for HAS2(metabolism pathway, cancer, disease, phenome) |
| Cancer | CGAP: HAS2 |
| Familial Cancer Database: HAS2 | |
| * This gene is included in those cancer gene databases. |
|
|
|
|
|
|
| ||||||||||||||||||||||||||||||||||||||||||||||||||||||||||||||||||||||||||||||||||||||||||||||||||||||||||||||||||||||||||||||||||||||||||||||||||||||||||||||||||||||||||||||||||||||||||||||||||||||||||||||||||||||||||||||||||||||||||||||||||||||||||||||||||||||||||||||||||||||||||||||||||||||||||||||||||||
Oncogene 1 | Significant driver gene in | |||||||||||||||||||||||||||||||||||||||||||||||||||||||||||||||||||||||||||||||||||||||||||||||||||||||||||||||||||||||||||||||||||||||||||||||||||||||||||||||||||||||||||||||||||||||||||||||||||||||||||||||||||||||||||||||||||||||||||||||||||||||||||||||||||||||||||||||||||||||||||||||||||||||||||||||||||||||||
| cf) number; DB name 1 Oncogene; http://nar.oxfordjournals.org/content/35/suppl_1/D721.long, 2 Tumor Suppressor gene; https://bioinfo.uth.edu/TSGene/, 3 Cancer Gene Census; http://www.nature.com/nrc/journal/v4/n3/abs/nrc1299.html, 4 CancerGenes; http://nar.oxfordjournals.org/content/35/suppl_1/D721.long, 5 Network of Cancer Gene; http://ncg.kcl.ac.uk/index.php, 1Therapeutic Vulnerabilities in Cancer; http://cbio.mskcc.org/cancergenomics/statius/ |
| REACTOME_HYALURONAN_METABOLISM REACTOME_METABOLISM_OF_CARBOHYDRATES | |
| OMIM | 601636; gene. |
| Orphanet | |
| Disease | KEGG Disease: HAS2 |
| MedGen: HAS2 (Human Medical Genetics with Condition) | |
| ClinVar: HAS2 | |
| Phenotype | MGI: HAS2 (International Mouse Phenotyping Consortium) |
| PhenomicDB: HAS2 | |
| Mutations for HAS2 |
| * Under tables are showing count per each tissue to give us broad intuition about tissue specific mutation patterns.You can go to the detailed page for each mutation database's web site. |
| - Statistics for Tissue and Mutation type | Top |
 |
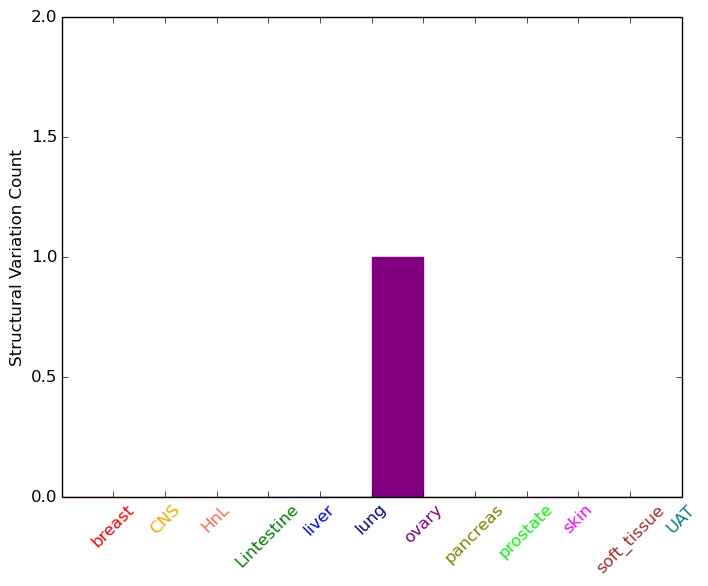
| - For Inter-chromosomal Variations |
| * Inter-chromosomal variantions includes 'interchromosomal amplicon to amplicon', 'interchromosomal amplicon to non-amplified dna', 'interchromosomal insertion', 'Interchromosomal unknown type'. |
 |
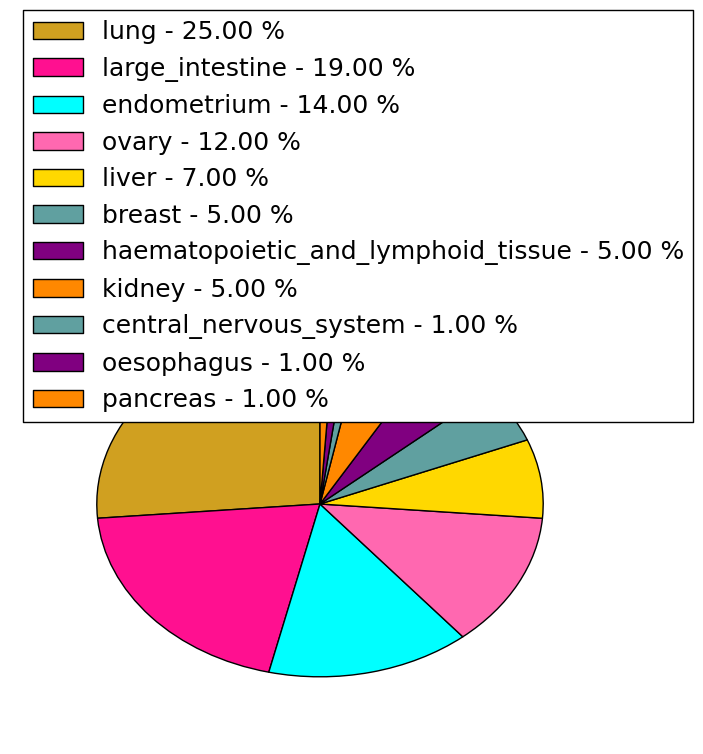
| - For Intra-chromosomal Variations |
| * Intra-chromosomal variantions includes 'intrachromosomal amplicon to amplicon', 'intrachromosomal amplicon to non-amplified dna', 'intrachromosomal deletion', 'intrachromosomal fold-back inversion', 'intrachromosomal inversion', 'intrachromosomal tandem duplication', 'Intrachromosomal unknown type', 'intrachromosomal with inverted orientation', 'intrachromosomal with non-inverted orientation'. |
 |
| Sample | Symbol_a | Chr_a | Start_a | End_a | Symbol_b | Chr_b | Start_b | End_b |
| breast | HAS2 | chr8 | 122648487 | 122648487 | chr15 | 98886682 | 98886682 | |
| ovary | HAS2 | chr8 | 122650473 | 122650493 | HAS2 | chr8 | 122650623 | 122650643 |
| cf) Tissue number; Tissue name (1;Breast, 2;Central_nervous_system, 3;Haematopoietic_and_lymphoid_tissue, 4;Large_intestine, 5;Liver, 6;Lung, 7;Ovary, 8;Pancreas, 9;Prostate, 10;Skin, 11;Soft_tissue, 12;Upper_aerodigestive_tract) |
| * From mRNA Sanger sequences, Chitars2.0 arranged chimeric transcripts. This table shows HAS2 related fusion information. |
| ID | Head Gene | Tail Gene | Accession | Gene_a | qStart_a | qEnd_a | Chromosome_a | tStart_a | tEnd_a | Gene_a | qStart_a | qEnd_a | Chromosome_a | tStart_a | tEnd_a |
| AF221548 | HAS2 | 74 | 405 | 8 | 122653093 | 122653424 | PLAG1 | 404 | 504 | 8 | 57083650 | 57083750 | |
| Top |
| Mutation type/ Tissue ID | brca | cns | cerv | endome | haematopo | kidn | Lintest | liver | lung | ns | ovary | pancre | prost | skin | stoma | thyro | urina | |||
| Total # sample | 1 | 2 | 2 | 1 | ||||||||||||||||
| GAIN (# sample) | 1 | 1 | 2 | 1 | ||||||||||||||||
| LOSS (# sample) | 1 |
| cf) Tissue ID; Tissue type (1; Breast, 2; Central_nervous_system, 3; Cervix, 4; Endometrium, 5; Haematopoietic_and_lymphoid_tissue, 6; Kidney, 7; Large_intestine, 8; Liver, 9; Lung, 10; NS, 11; Ovary, 12; Pancreas, 13; Prostate, 14; Skin, 15; Stomach, 16; Thyroid, 17; Urinary_tract) |
| Top |
|
 |
| Top |
| Stat. for Non-Synonymous SNVs (# total SNVs=71) | (# total SNVs=20) |
 |  |
(# total SNVs=3) | (# total SNVs=1) |
 |  |
| Top |
| * When you move the cursor on each content, you can see more deailed mutation information on the Tooltip. Those are primary_site,primary_histology,mutation(aa),pubmedID. |
| GRCh37 position | Mutation(aa) | Unique sampleID count |
| chr8:122641065-122641065 | p.T172T | 5 |
| chr8:122641020-122641020 | p.W187* | 4 |
| chr8:122641165-122641165 | p.G139V | 3 |
| chr8:122641102-122641102 | p.T160R | 3 |
| chr8:122641109-122641109 | p.G158S | 3 |
| chr8:122626535-122626535 | p.G491G | 3 |
| chr8:122641473-122641473 | p.F36L | 2 |
| chr8:122626715-122626715 | p.I431I | 2 |
| chr8:122626735-122626735 | p.S425C | 2 |
| chr8:122627011-122627011 | p.R333* | 2 |
| Top |
|
 |
| Point Mutation/ Tissue ID | 1 | 2 | 3 | 4 | 5 | 6 | 7 | 8 | 9 | 10 | 11 | 12 | 13 | 14 | 15 | 16 | 17 | 18 | 19 | 20 |
| # sample | 2 | 1 | 1 | 12 | 3 | 5 | 3 | 2 | 14 | 5 | 4 | 3 | 13 | 11 | ||||||
| # mutation | 2 | 1 | 1 | 9 | 3 | 5 | 3 | 2 | 13 | 5 | 4 | 3 | 12 | 12 | ||||||
| nonsynonymous SNV | 2 | 1 | 5 | 2 | 4 | 2 | 1 | 10 | 3 | 4 | 2 | 8 | 8 | |||||||
| synonymous SNV | 1 | 4 | 1 | 1 | 1 | 1 | 3 | 2 | 1 | 4 | 4 |
| cf) Tissue ID; Tissue type (1; BLCA[Bladder Urothelial Carcinoma], 2; BRCA[Breast invasive carcinoma], 3; CESC[Cervical squamous cell carcinoma and endocervical adenocarcinoma], 4; COAD[Colon adenocarcinoma], 5; GBM[Glioblastoma multiforme], 6; Glioma Low Grade, 7; HNSC[Head and Neck squamous cell carcinoma], 8; KICH[Kidney Chromophobe], 9; KIRC[Kidney renal clear cell carcinoma], 10; KIRP[Kidney renal papillary cell carcinoma], 11; LAML[Acute Myeloid Leukemia], 12; LUAD[Lung adenocarcinoma], 13; LUSC[Lung squamous cell carcinoma], 14; OV[Ovarian serous cystadenocarcinoma ], 15; PAAD[Pancreatic adenocarcinoma], 16; PRAD[Prostate adenocarcinoma], 17; SKCM[Skin Cutaneous Melanoma], 18:STAD[Stomach adenocarcinoma], 19:THCA[Thyroid carcinoma], 20:UCEC[Uterine Corpus Endometrial Carcinoma]) |
| Top |
| * We represented just top 10 SNVs. When you move the cursor on each content, you can see more deailed mutation information on the Tooltip. Those are primary_site, primary_histology, mutation(aa), pubmedID. |
| Genomic Position | Mutation(aa) | Unique sampleID count |
| chr8:122641165 | p.T172T | 4 |
| chr8:122641065 | p.G139D | 4 |
| chr8:122626535 | p.G491G | 3 |
| chr8:122641473 | p.I431I | 2 |
| chr8:122626661 | p.V481L | 2 |
| chr8:122626715 | p.P449P | 2 |
| chr8:122626567 | p.F36L | 2 |
| chr8:122641443 | p.D218H | 1 |
| chr8:122626368 | p.L128I | 1 |
| chr8:122627197 | p.F6L | 1 |
| * Copy number data were extracted from TCGA using R package TCGA-Assembler. The URLs of all public data files on TCGA DCC data server were gathered on Jan-05-2015. Function ProcessCNAData in TCGA-Assembler package was used to obtain gene-level copy number value which is calculated as the average copy number of the genomic region of a gene. |
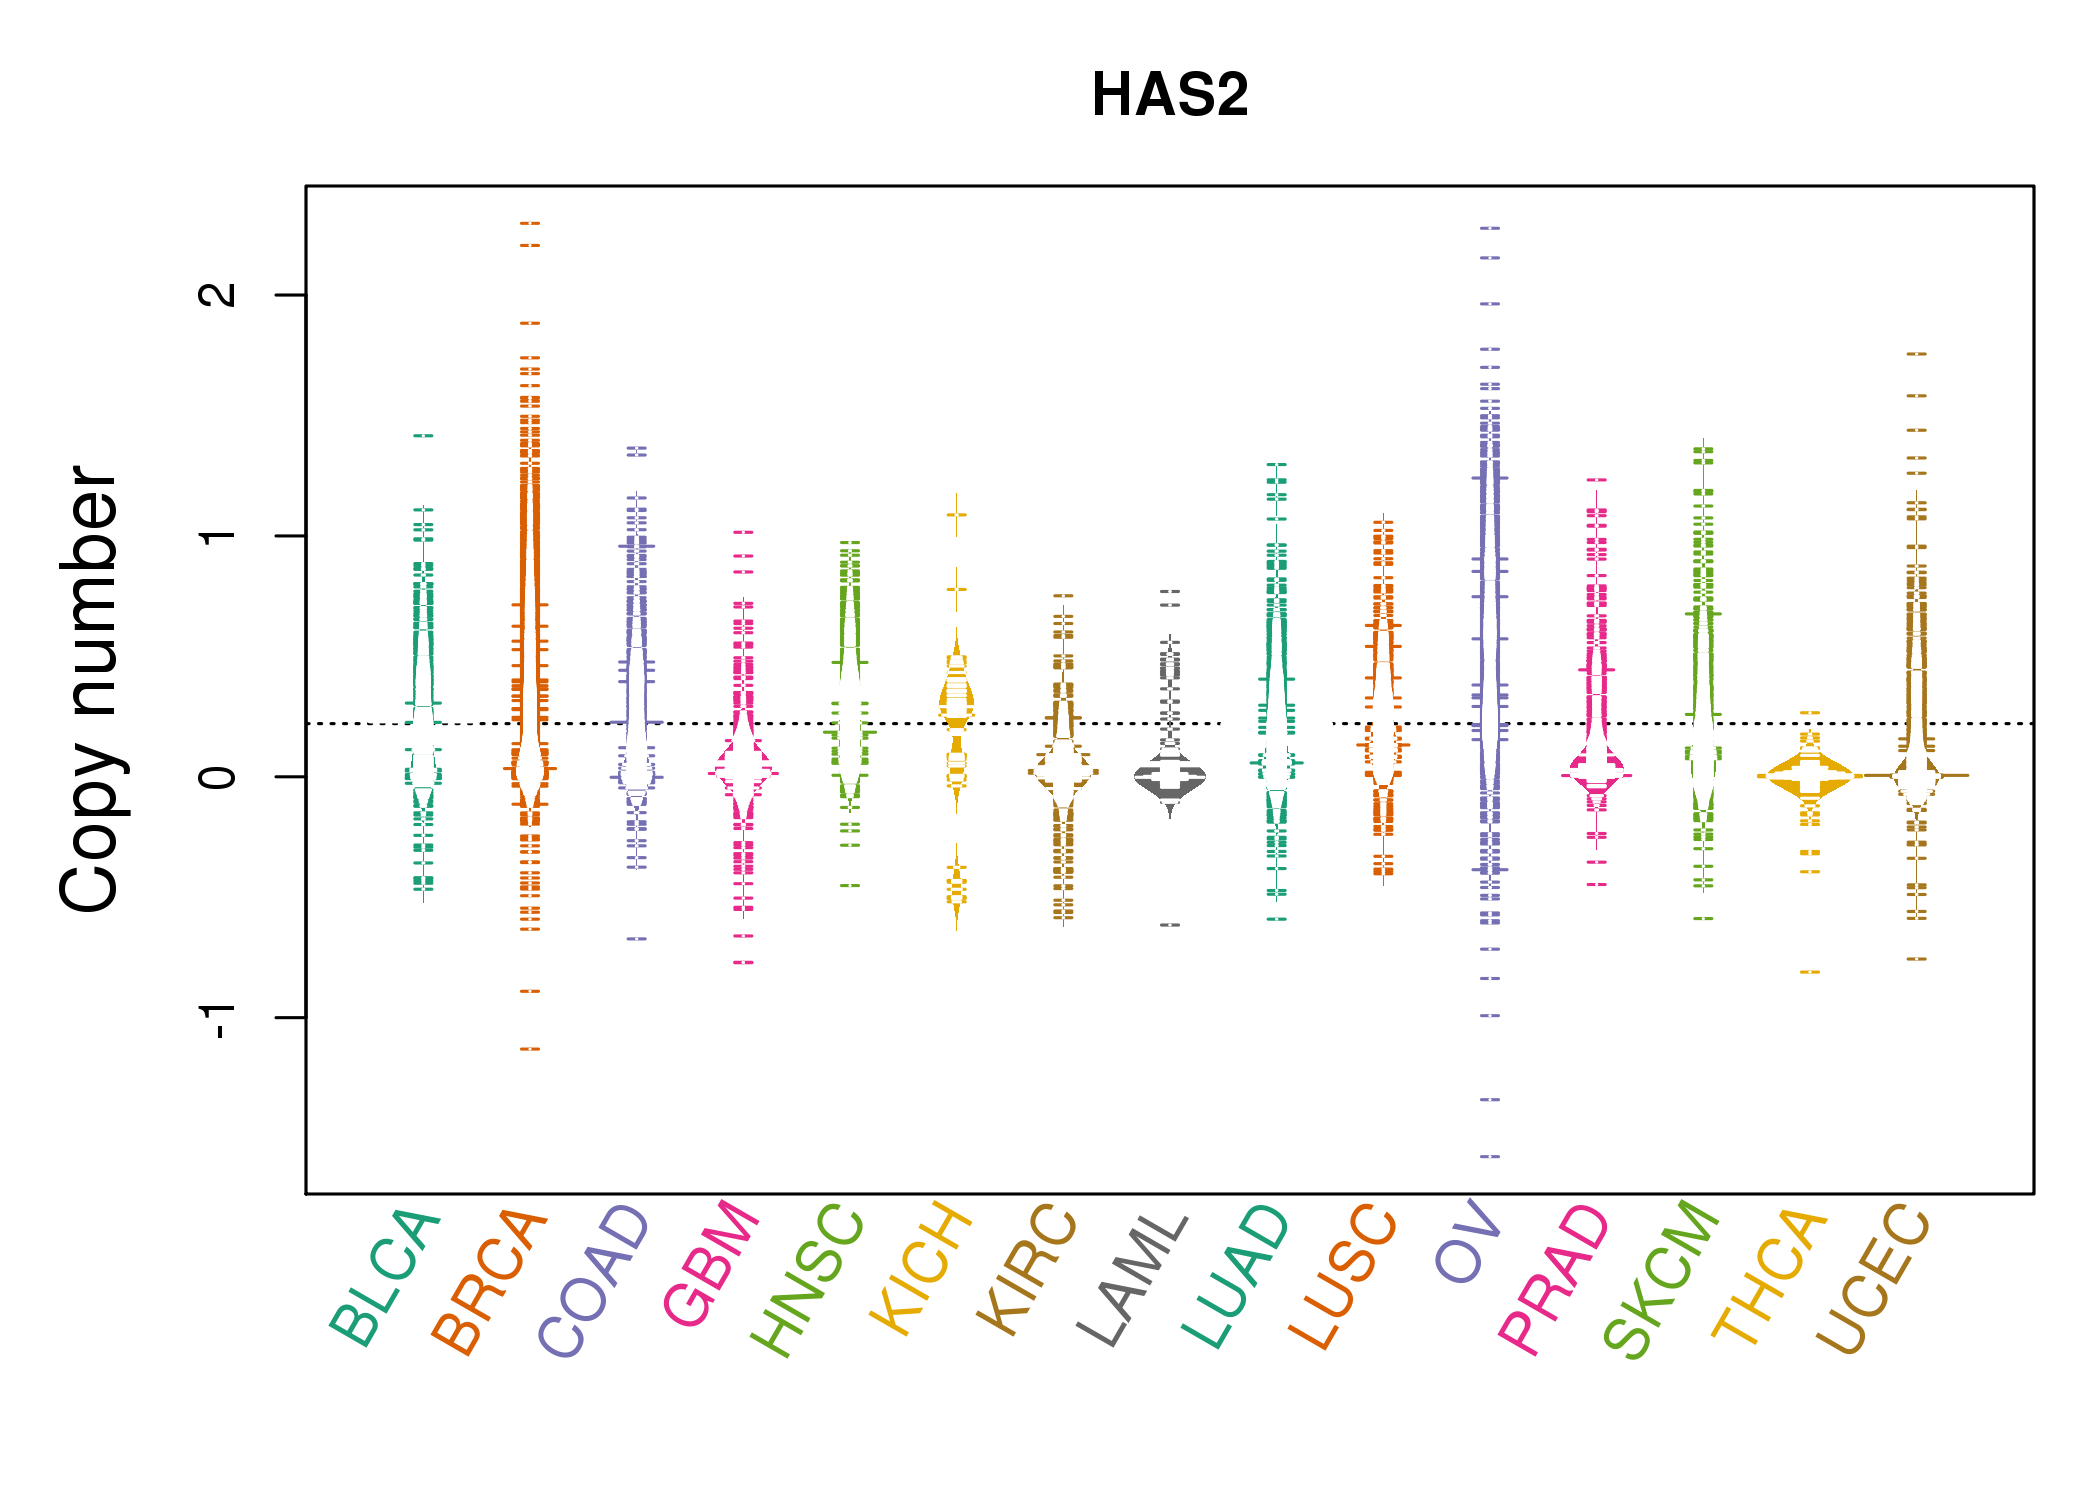 |
| cf) Tissue ID[Tissue type]: BLCA[Bladder Urothelial Carcinoma], BRCA[Breast invasive carcinoma], CESC[Cervical squamous cell carcinoma and endocervical adenocarcinoma], COAD[Colon adenocarcinoma], GBM[Glioblastoma multiforme], Glioma Low Grade, HNSC[Head and Neck squamous cell carcinoma], KICH[Kidney Chromophobe], KIRC[Kidney renal clear cell carcinoma], KIRP[Kidney renal papillary cell carcinoma], LAML[Acute Myeloid Leukemia], LUAD[Lung adenocarcinoma], LUSC[Lung squamous cell carcinoma], OV[Ovarian serous cystadenocarcinoma ], PAAD[Pancreatic adenocarcinoma], PRAD[Prostate adenocarcinoma], SKCM[Skin Cutaneous Melanoma], STAD[Stomach adenocarcinoma], THCA[Thyroid carcinoma], UCEC[Uterine Corpus Endometrial Carcinoma] |
| Top |
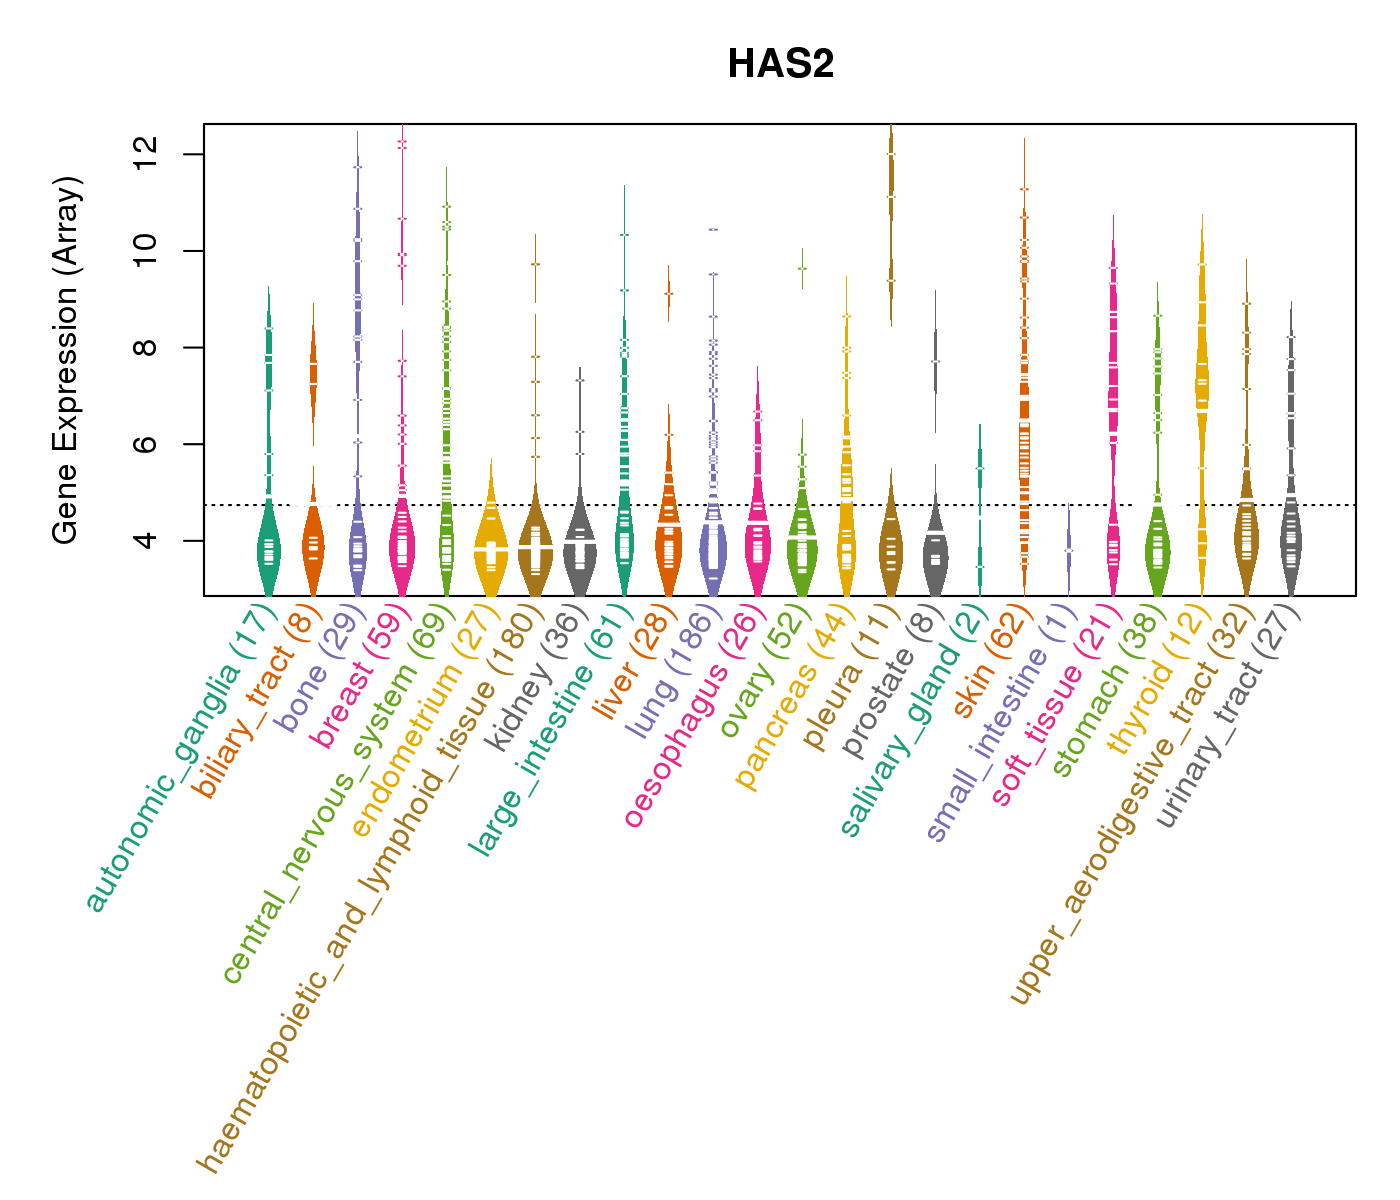
| Gene Expression for HAS2 |
| * CCLE gene expression data were extracted from CCLE_Expression_Entrez_2012-10-18.res: Gene-centric RMA-normalized mRNA expression data. |
 |
| * Normalized gene expression data of RNASeqV2 was extracted from TCGA using R package TCGA-Assembler. The URLs of all public data files on TCGA DCC data server were gathered at Jan-05-2015. Only eight cancer types have enough normal control samples for differential expression analysis. (t test, adjusted p<0.05 (using Benjamini-Hochberg FDR)) |
 |
| Top |
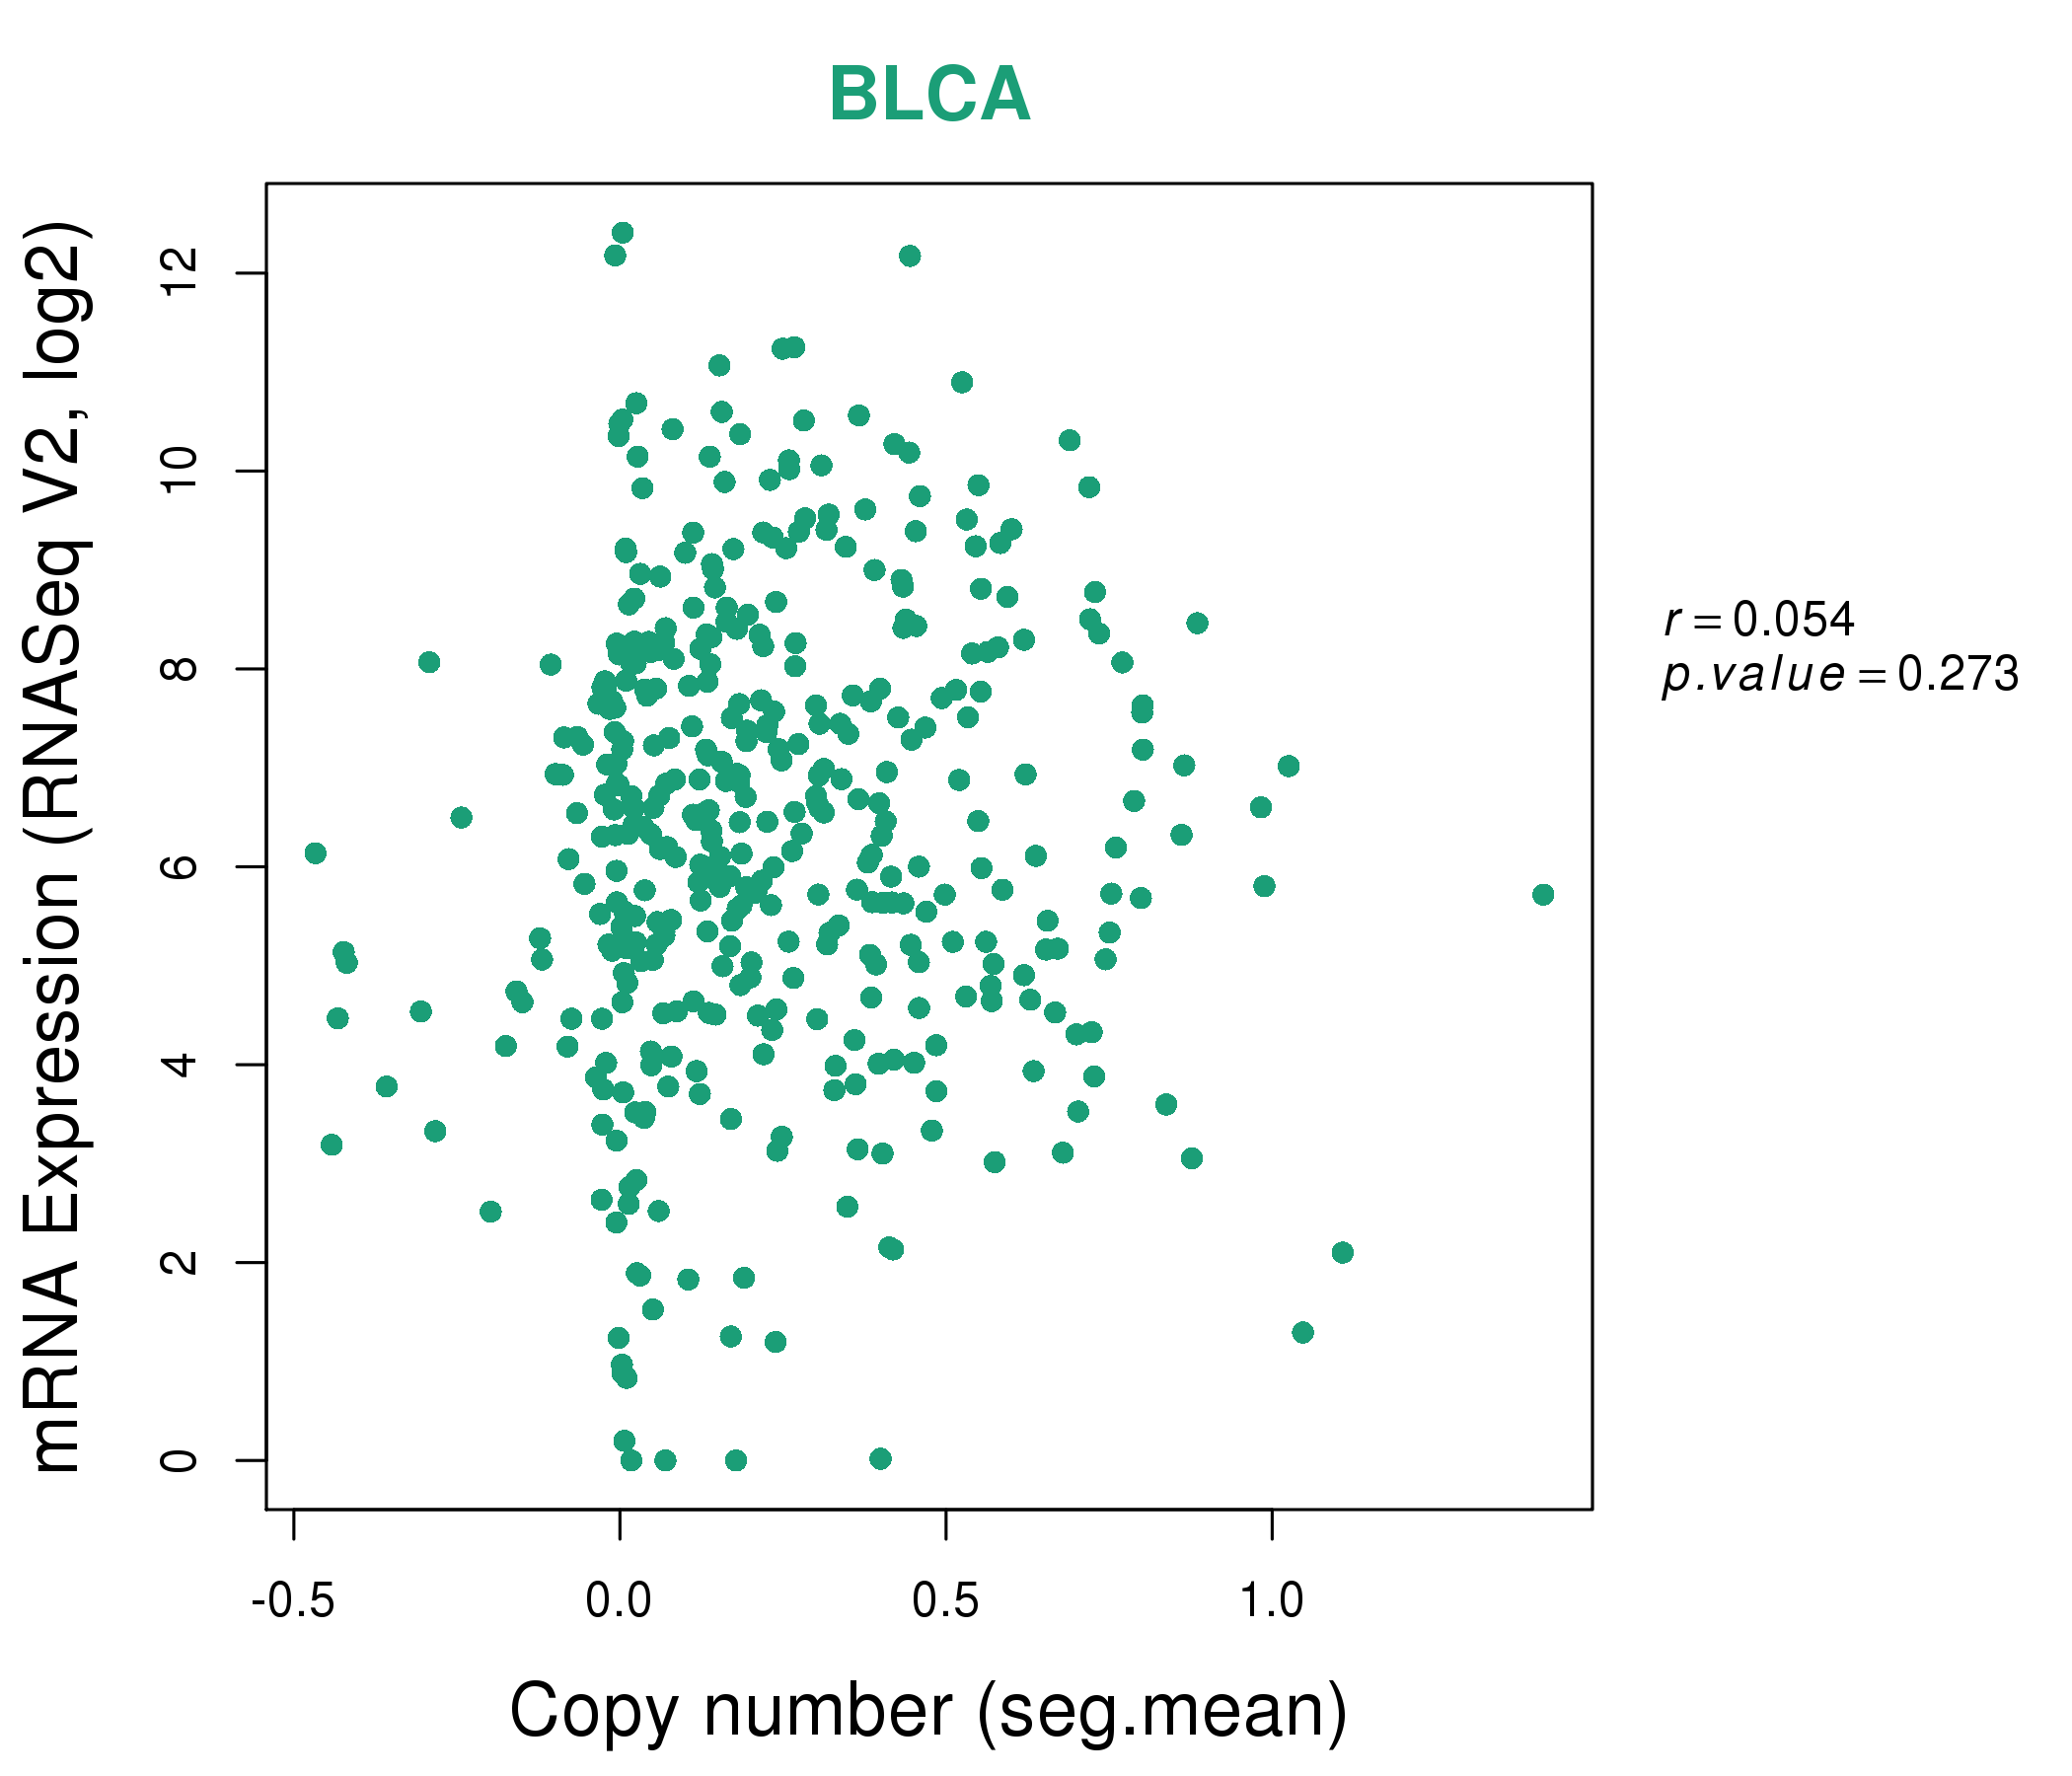
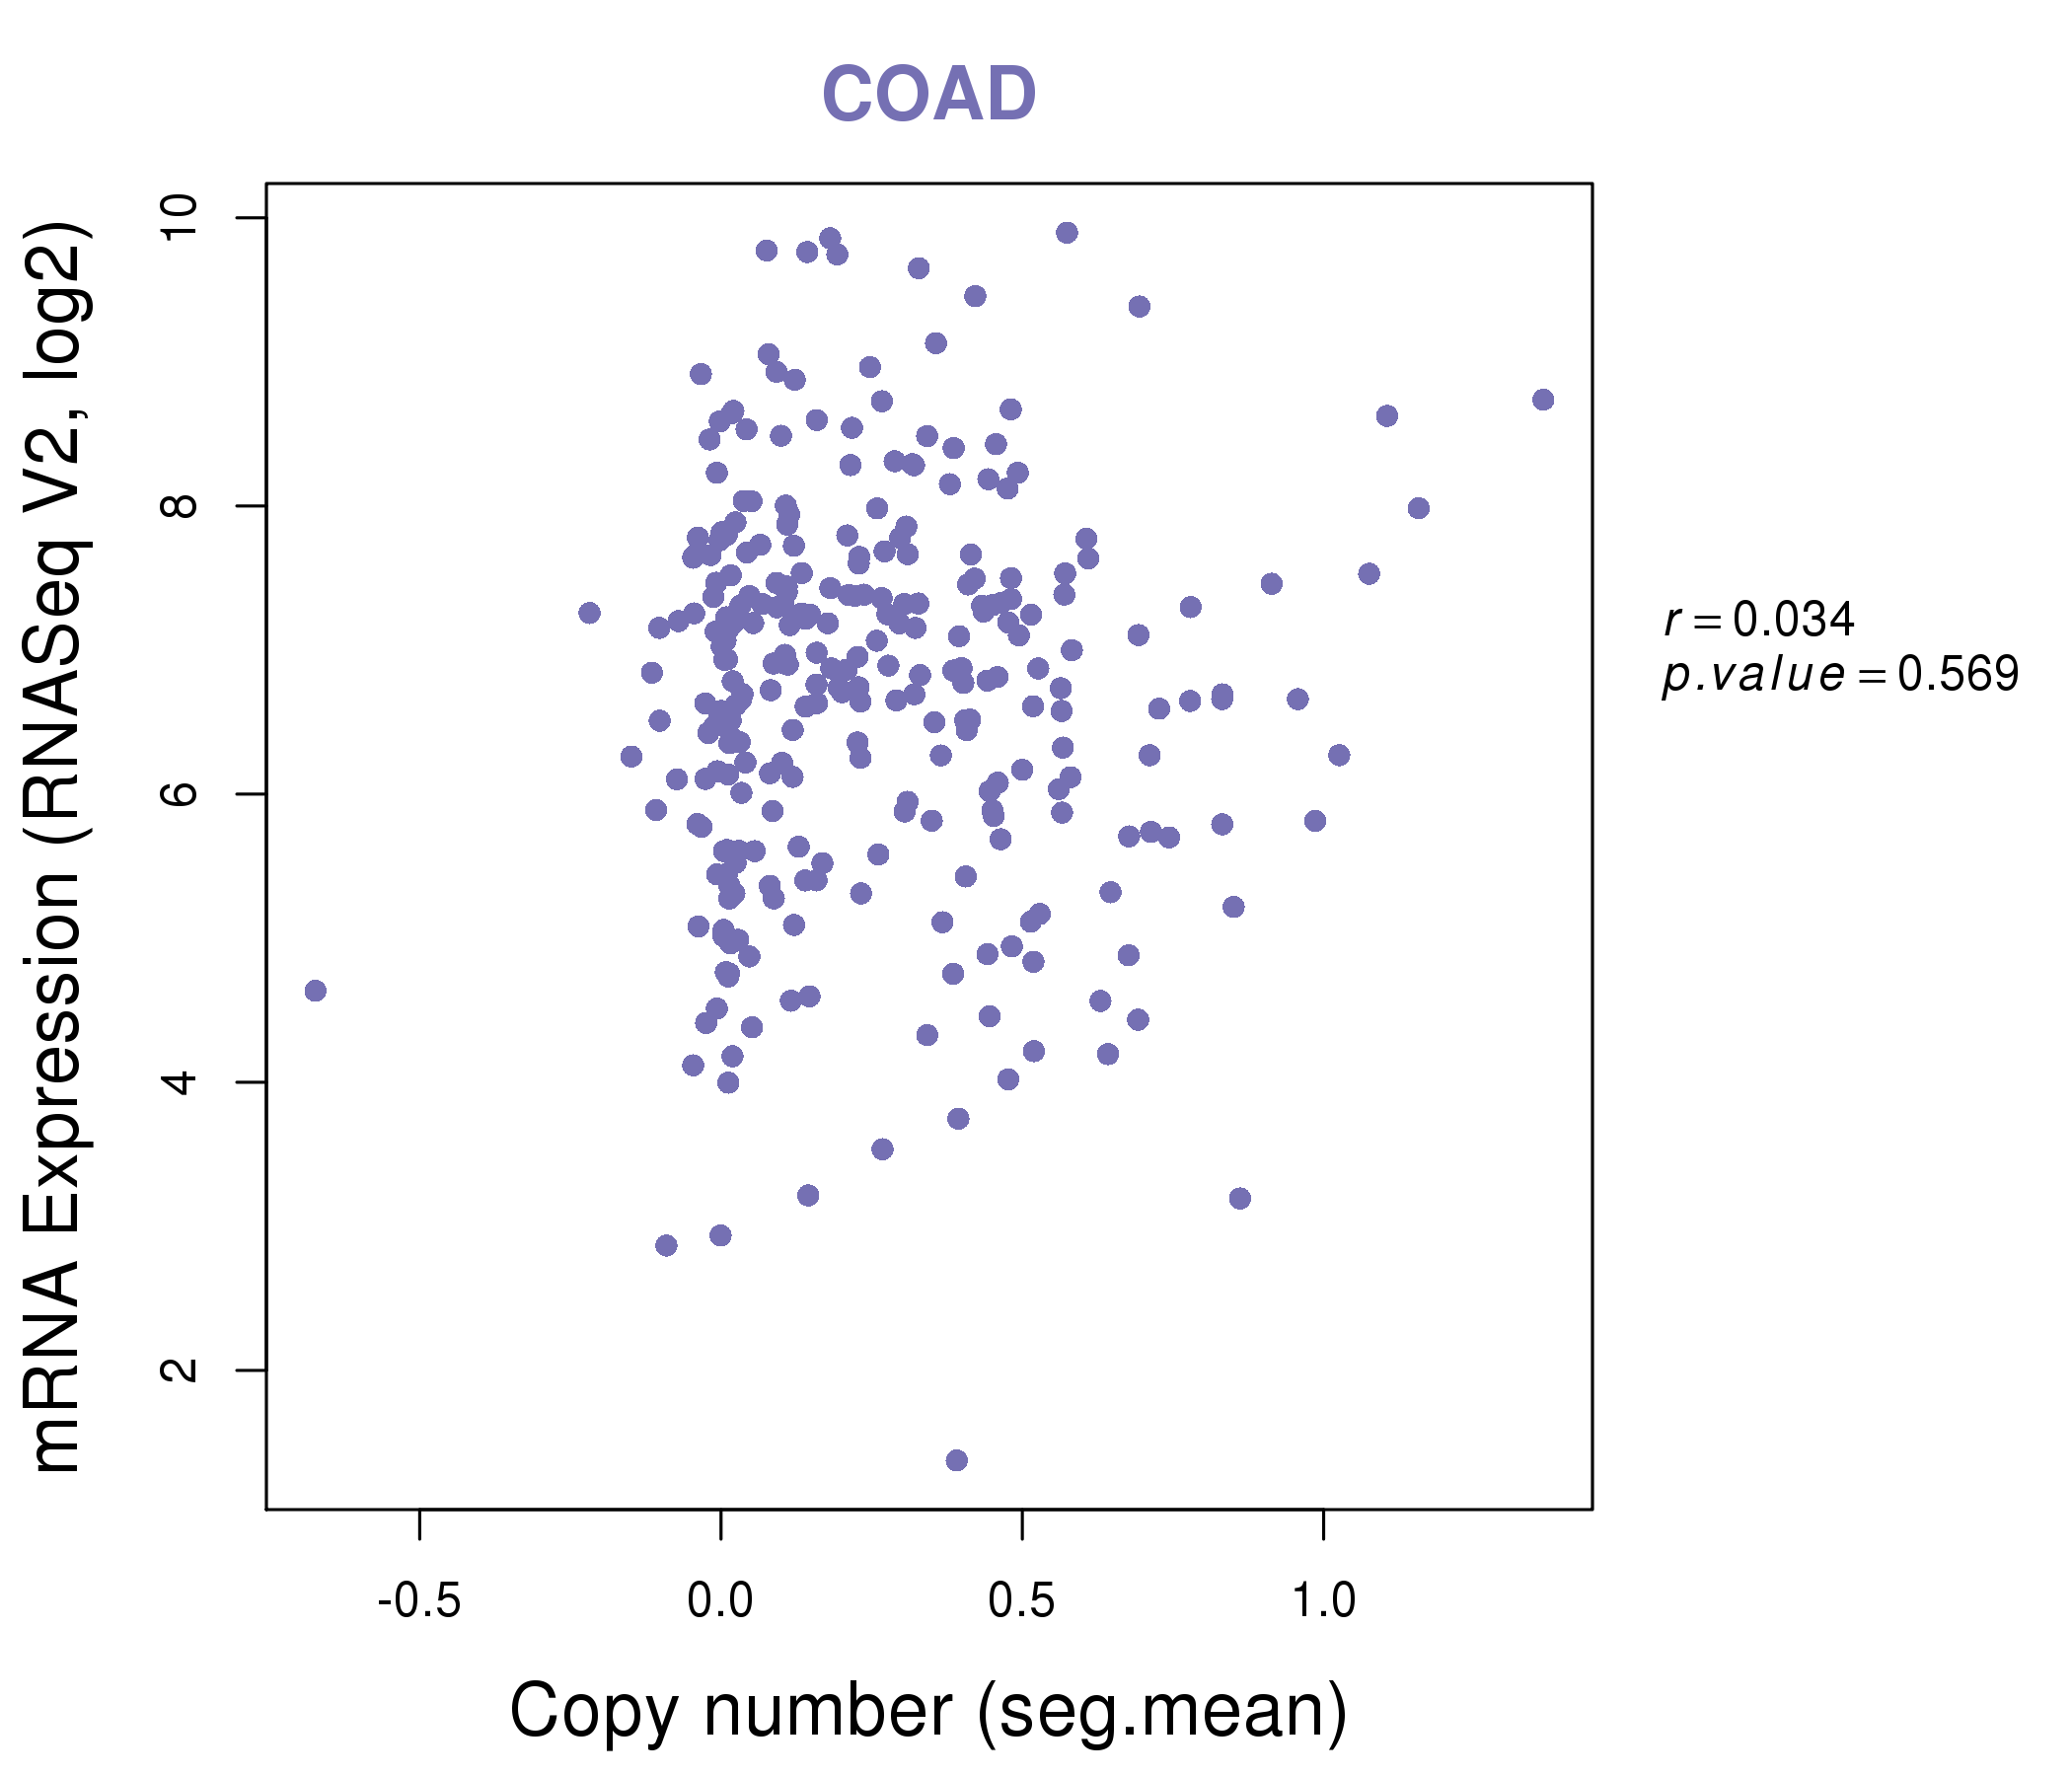
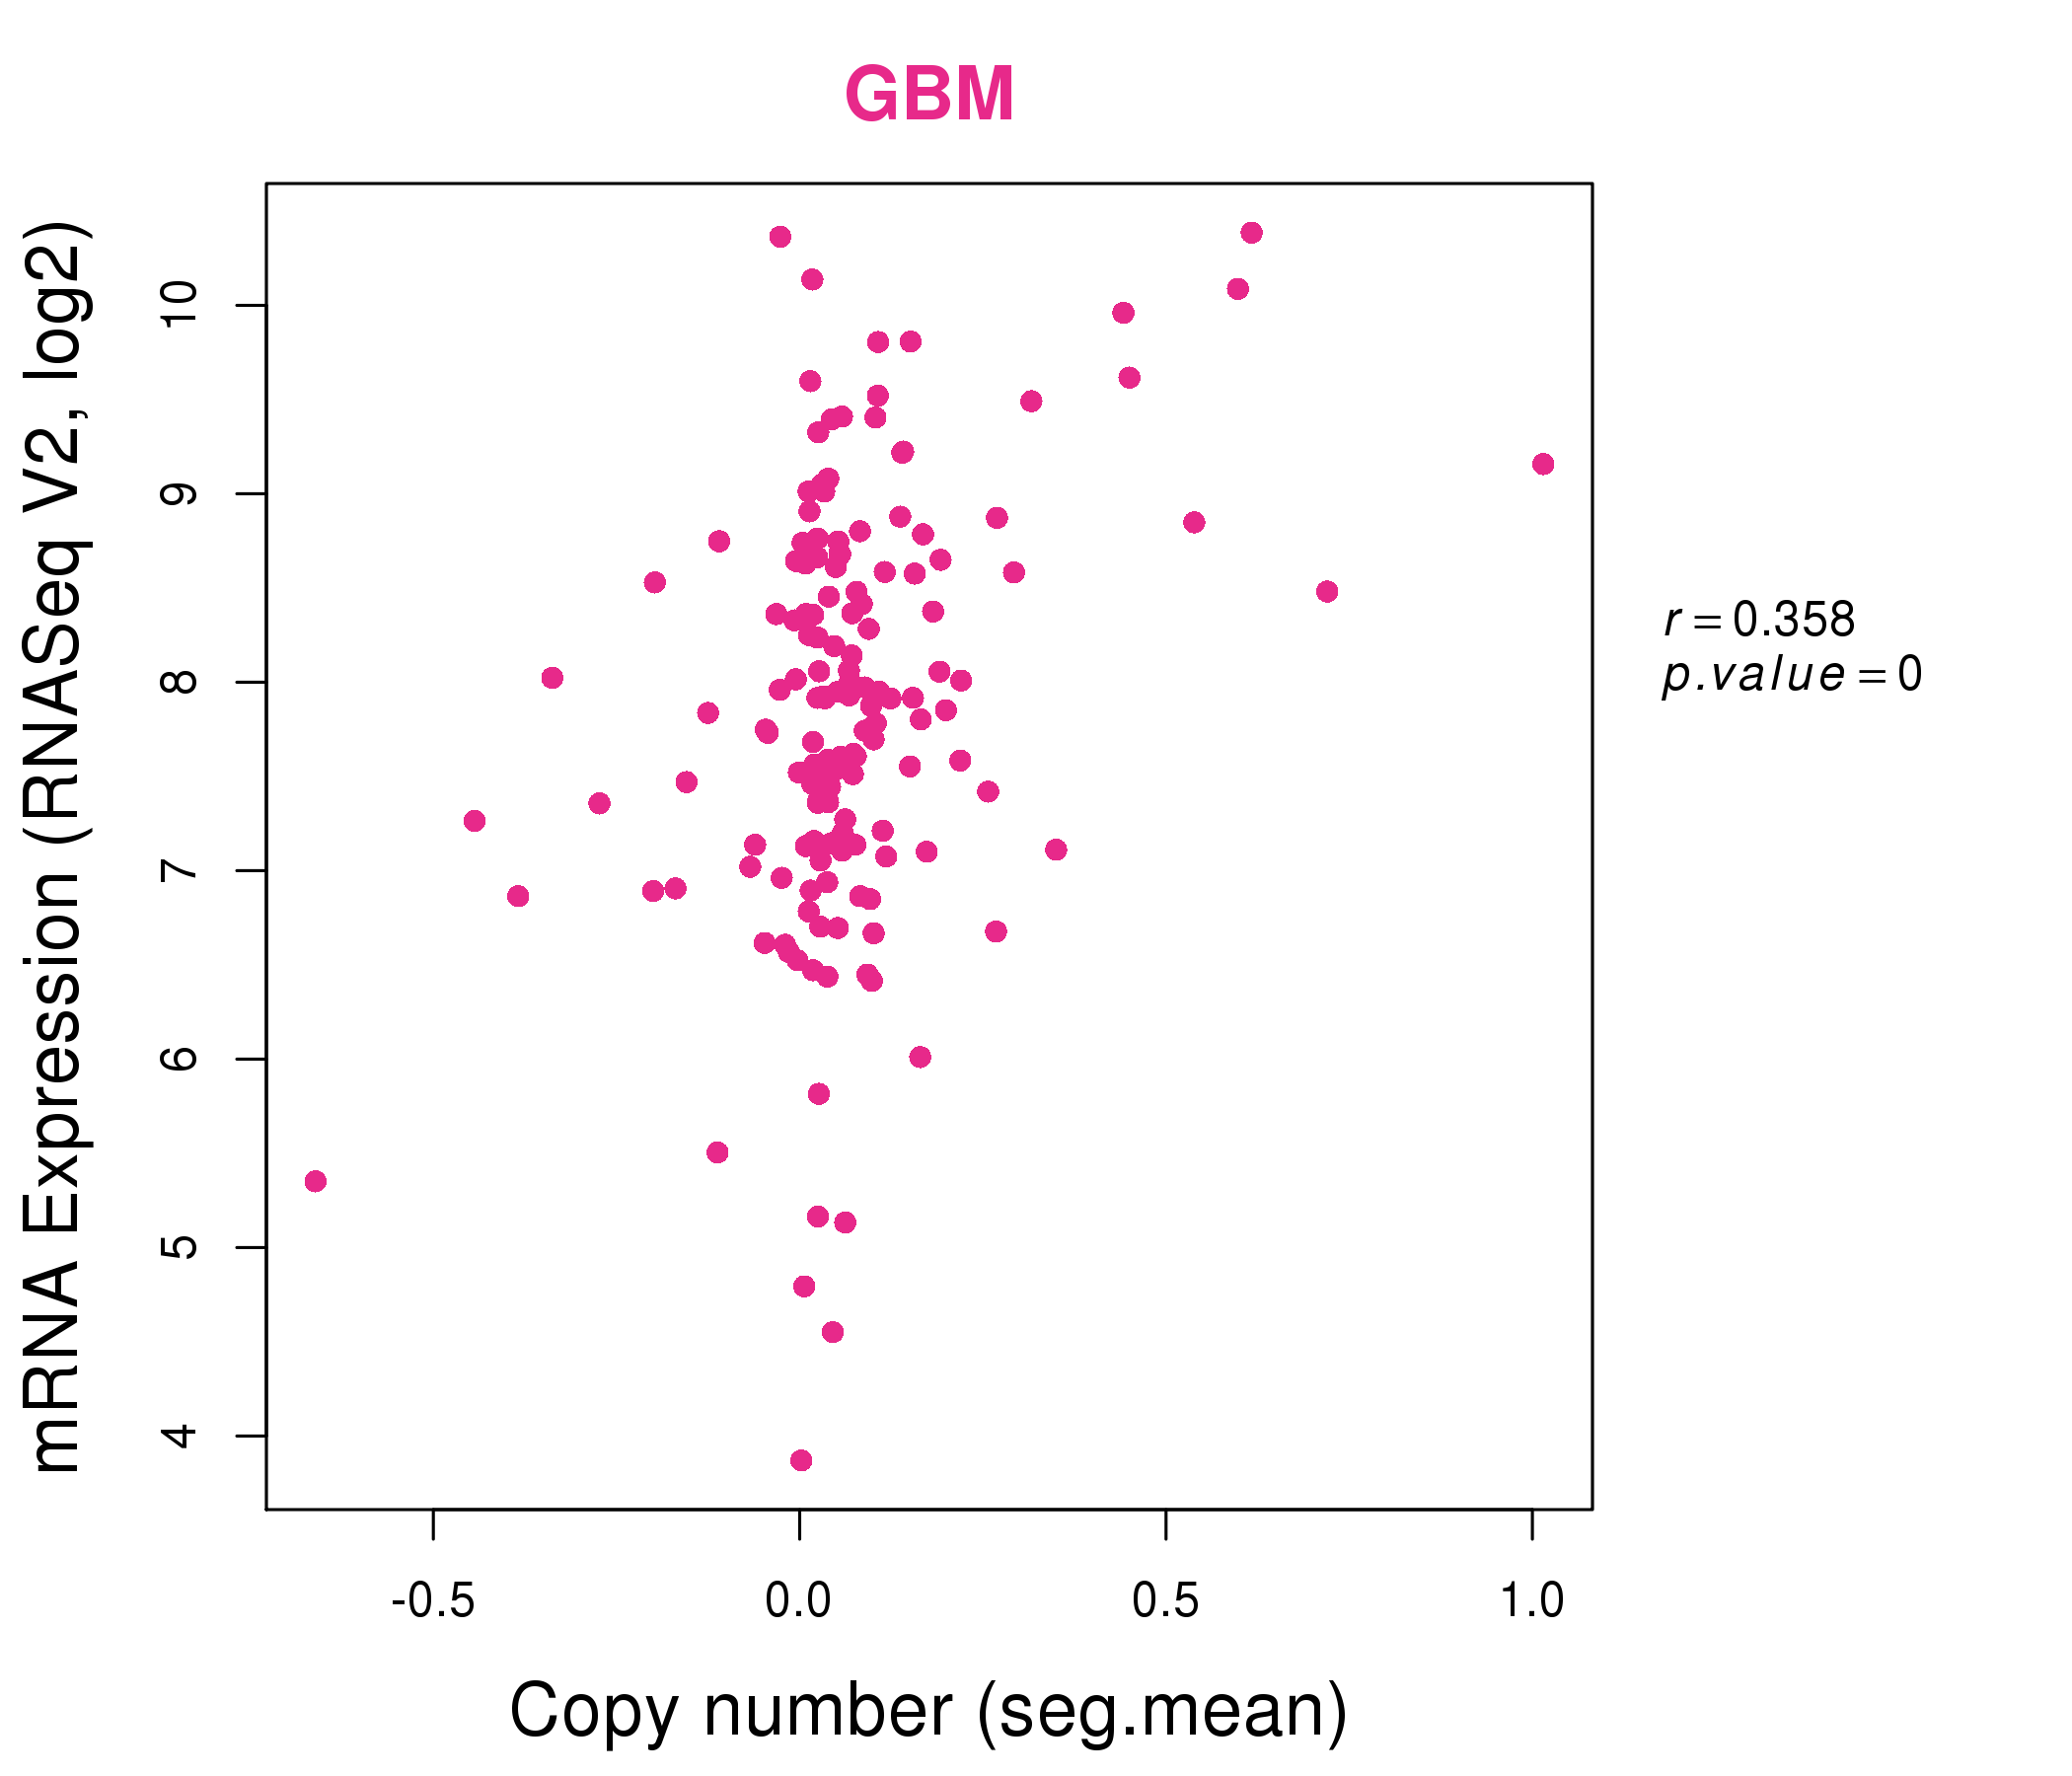
| * This plots show the correlation between CNV and gene expression. |
: Open all plots for all cancer types
 |
|
 |
|

| Top |
| Gene-Gene Network Information |
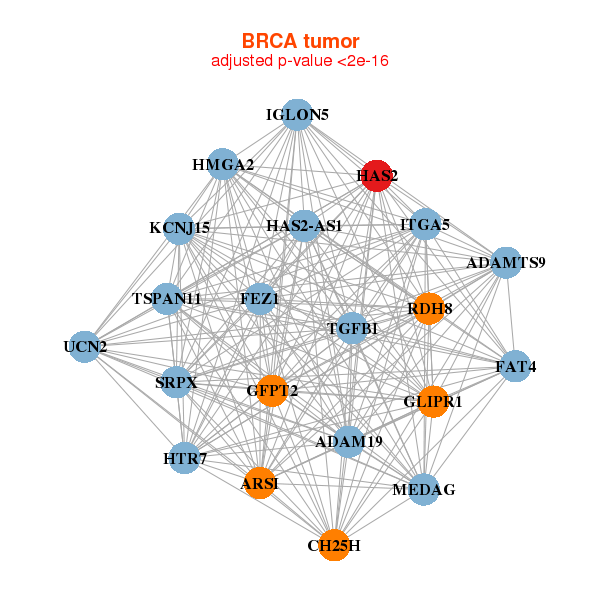
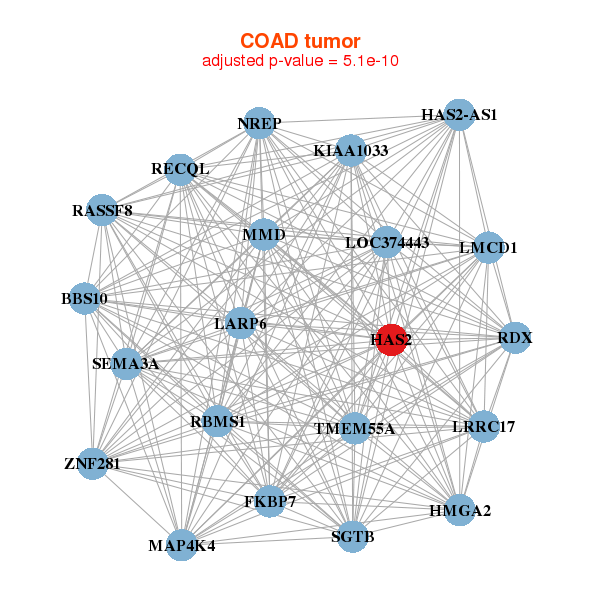
| * Co-Expression network figures were drawn using R package igraph. Only the top 20 genes with the highest correlations were shown. Red circle: input gene, orange circle: cell metabolism gene, sky circle: other gene |
: Open all plots for all cancer types
 |
|
| ADAM19,ADAMTS9,ARSI,MEDAG,CH25H,FAT4,FEZ1, GFPT2,GLIPR1,HAS2,HAS2-AS1,HMGA2,HTR7,IGLON5, ITGA5,KCNJ15,RDH8,SRPX,TGFBI,TSPAN11,UCN2 | MEDAG,CD70,ACKR3,FBN1,FGF18,FNDC1,FSTL1, GFPT2,GPR133,HAS1,HAS2,HAS2-AS1,ITGB3,KLF4, LMX1A,MFAP5,SCARA5,SPSB4,UAP1,WNT10B,XPNPEP2 |
 |
|
| BBS10,NREP,FKBP7,HAS2,HAS2-AS1,HMGA2,KIAA1033, LARP6,LMCD1,LOC374443,LRRC17,MAP4K4,MMD,RASSF8, RBMS1,RDX,RECQL,SEMA3A,SGTB,TMEM55A,ZNF281 | AGR2___C11orf96,C6orf141,DHX34,EGR4,FAM84A,FUT4,GJB3, HAS2,IDI2,KIAA0040,KRT39,LRFN4,LRRC7,LRRC8B, MYC,PHLDA1,SAMD5,SMCR5,TP53I11,YTHDF1,ZNF121 |
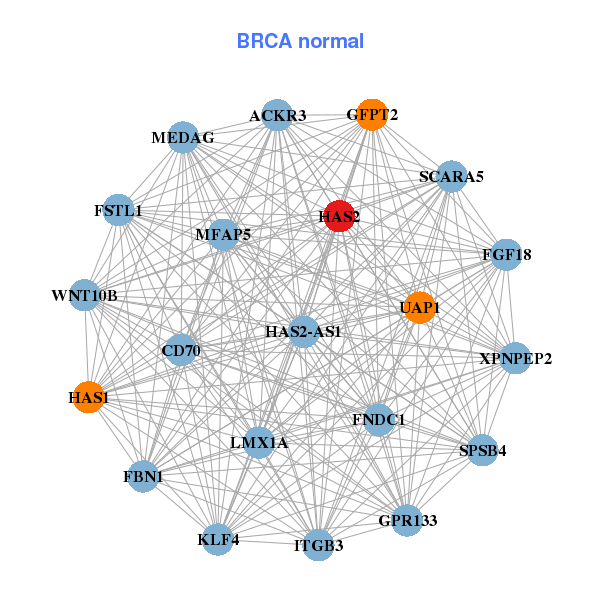
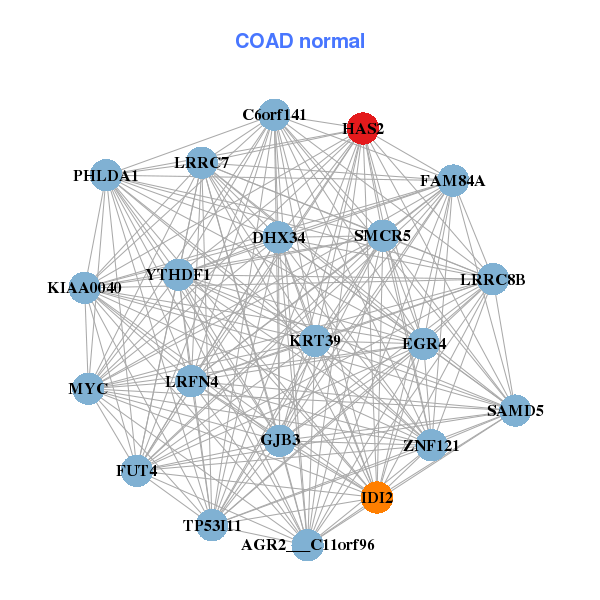
| * Co-Expression network figures were drawn using R package igraph. Only the top 20 genes with the highest correlations were shown. Red circle: input gene, orange circle: cell metabolism gene, sky circle: other gene |
: Open all plots for all cancer types
| Top |
: Open all interacting genes' information including KEGG pathway for all interacting genes from DAVID
| Top |
| Pharmacological Information for HAS2 |
| There's no related Drug. |
| Top |
| Cross referenced IDs for HAS2 |
| * We obtained these cross-references from Uniprot database. It covers 150 different DBs, 18 categories. http://www.uniprot.org/help/cross_references_section |
: Open all cross reference information
|
Copyright © 2016-Present - The Univsersity of Texas Health Science Center at Houston @ |