|
||||||||||||||||||||
| |
| Phenotypic Information (metabolism pathway, cancer, disease, phenome) |
| |
| |
| Gene-Gene Network Information: Co-Expression Network, Interacting Genes & KEGG |
| |
|


| Gene Summary for HAS3 |
| Basic gene info. | Gene symbol | HAS3 |
| Gene name | hyaluronan synthase 3 | |
| Synonyms | - | |
| Cytomap | UCSC genome browser: 16q22.1 | |
| Genomic location | chr16 :69141442-69151570 | |
| Type of gene | protein-coding | |
| RefGenes | NM_001199280.1, NM_005329.2,NM_138612.2, | |
| Ensembl id | ENSG00000103044 | |
| Description | HA synthase 3hyaluronate synthase 3hyaluronic acid synthase 3 | |
| Modification date | 20141207 | |
| dbXrefs | MIM : 602428 | |
| HGNC : HGNC | ||
| Ensembl : ENSG00000103044 | ||
| HPRD : 03889 | ||
| Vega : OTTHUMG00000137562 | ||
| Protein | UniProt: go to UniProt's Cross Reference DB Table | |
| Expression | CleanEX: HS_HAS3 | |
| BioGPS: 3038 | ||
| Gene Expression Atlas: ENSG00000103044 | ||
| The Human Protein Atlas: ENSG00000103044 | ||
| Pathway | NCI Pathway Interaction Database: HAS3 | |
| KEGG: HAS3 | ||
| REACTOME: HAS3 | ||
| ConsensusPathDB | ||
| Pathway Commons: HAS3 | ||
| Metabolism | MetaCyc: HAS3 | |
| HUMANCyc: HAS3 | ||
| Regulation | Ensembl's Regulation: ENSG00000103044 | |
| miRBase: chr16 :69,141,442-69,151,570 | ||
| TargetScan: NM_001199280 | ||
| cisRED: ENSG00000103044 | ||
| Context | iHOP: HAS3 | |
| cancer metabolism search in PubMed: HAS3 | ||
| UCL Cancer Institute: HAS3 | ||
| Assigned class in ccmGDB | C | |
| Top |
| Phenotypic Information for HAS3(metabolism pathway, cancer, disease, phenome) |
| Cancer | CGAP: HAS3 |
| Familial Cancer Database: HAS3 | |
| * This gene is included in those cancer gene databases. |
|
|
|
|
|
|
| ||||||||||||||
Oncogene 1 | Significant driver gene in | |||||||||||||||||||
| cf) number; DB name 1 Oncogene; http://nar.oxfordjournals.org/content/35/suppl_1/D721.long, 2 Tumor Suppressor gene; https://bioinfo.uth.edu/TSGene/, 3 Cancer Gene Census; http://www.nature.com/nrc/journal/v4/n3/abs/nrc1299.html, 4 CancerGenes; http://nar.oxfordjournals.org/content/35/suppl_1/D721.long, 5 Network of Cancer Gene; http://ncg.kcl.ac.uk/index.php, 1Therapeutic Vulnerabilities in Cancer; http://cbio.mskcc.org/cancergenomics/statius/ |
| REACTOME_HYALURONAN_METABOLISM REACTOME_METABOLISM_OF_CARBOHYDRATES | |
| OMIM | |
| Orphanet | |
| Disease | KEGG Disease: HAS3 |
| MedGen: HAS3 (Human Medical Genetics with Condition) | |
| ClinVar: HAS3 | |
| Phenotype | MGI: HAS3 (International Mouse Phenotyping Consortium) |
| PhenomicDB: HAS3 | |
| Mutations for HAS3 |
| * Under tables are showing count per each tissue to give us broad intuition about tissue specific mutation patterns.You can go to the detailed page for each mutation database's web site. |
| - Statistics for Tissue and Mutation type | Top |
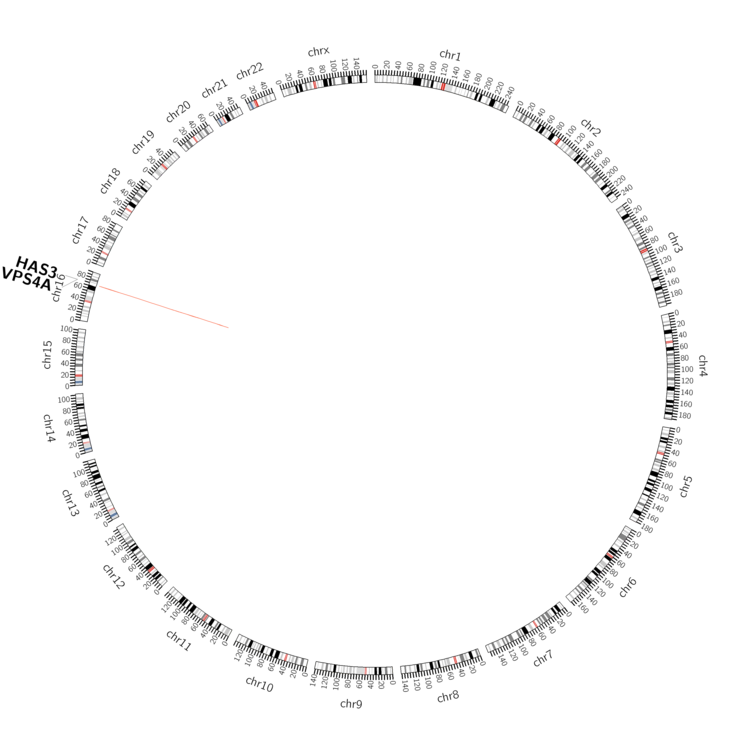 |
| - For Inter-chromosomal Variations |
| There's no inter-chromosomal structural variation. |
| - For Intra-chromosomal Variations |
| * Intra-chromosomal variantions includes 'intrachromosomal amplicon to amplicon', 'intrachromosomal amplicon to non-amplified dna', 'intrachromosomal deletion', 'intrachromosomal fold-back inversion', 'intrachromosomal inversion', 'intrachromosomal tandem duplication', 'Intrachromosomal unknown type', 'intrachromosomal with inverted orientation', 'intrachromosomal with non-inverted orientation'. |
 |
| Sample | Symbol_a | Chr_a | Start_a | End_a | Symbol_b | Chr_b | Start_b | End_b |
| ovary | HAS3 | chr16 | 69146022 | 69146042 | VPS4A | chr16 | 69353594 | 69353614 |
| cf) Tissue number; Tissue name (1;Breast, 2;Central_nervous_system, 3;Haematopoietic_and_lymphoid_tissue, 4;Large_intestine, 5;Liver, 6;Lung, 7;Ovary, 8;Pancreas, 9;Prostate, 10;Skin, 11;Soft_tissue, 12;Upper_aerodigestive_tract) |
| * From mRNA Sanger sequences, Chitars2.0 arranged chimeric transcripts. This table shows HAS3 related fusion information. |
| ID | Head Gene | Tail Gene | Accession | Gene_a | qStart_a | qEnd_a | Chromosome_a | tStart_a | tEnd_a | Gene_a | qStart_a | qEnd_a | Chromosome_a | tStart_a | tEnd_a |
| Top |
| There's no copy number variation information in COSMIC data for this gene. |
| Top |
|
 |
| Top |
| Stat. for Non-Synonymous SNVs (# total SNVs=27) | (# total SNVs=10) |
 |  |
(# total SNVs=1) | (# total SNVs=0) |
 |
| Top |
| * When you move the cursor on each content, you can see more deailed mutation information on the Tooltip. Those are primary_site,primary_histology,mutation(aa),pubmedID. |
| GRCh37 position | Mutation(aa) | Unique sampleID count |
| chr16:69143446-69143446 | p.A50T | 3 |
| chr16:69148815-69148815 | p.M436I | 2 |
| chr16:69148611-69148611 | p.N368K | 2 |
| chr16:69143542-69143542 | p.P82S | 1 |
| chr16:69148552-69148552 | p.R349W | 1 |
| chr16:69143703-69143703 | p.I135I | 1 |
| chr16:69148781-69148781 | p.T425I | 1 |
| chr16:69147349-69147349 | p.C214C | 1 |
| chr16:69143549-69143549 | p.R84Q | 1 |
| chr16:69148556-69148556 | p.W350* | 1 |
| Top |
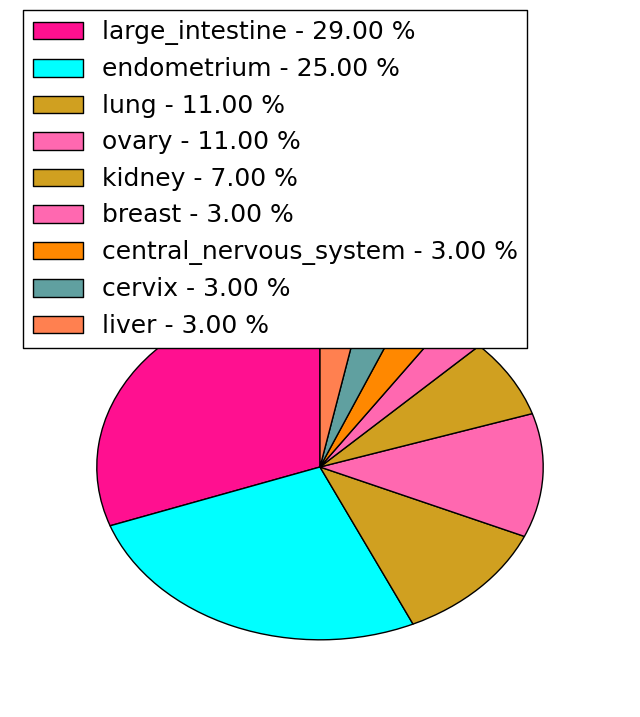
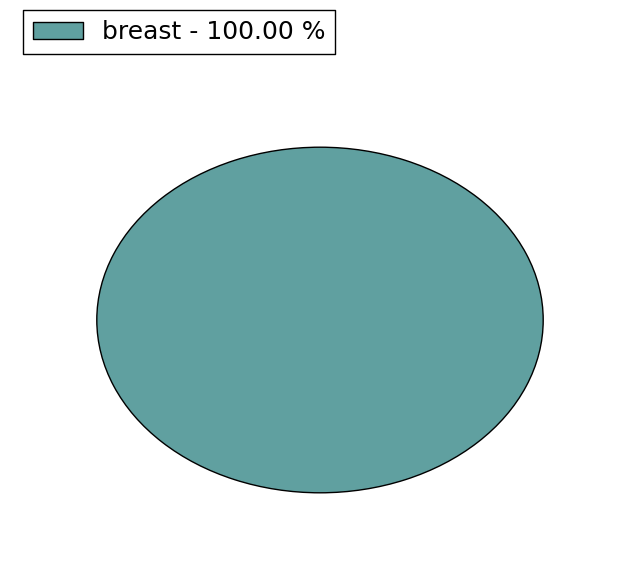
|
 |
| Point Mutation/ Tissue ID | 1 | 2 | 3 | 4 | 5 | 6 | 7 | 8 | 9 | 10 | 11 | 12 | 13 | 14 | 15 | 16 | 17 | 18 | 19 | 20 |
| # sample | 3 | 1 | 1 | 7 | 1 | 3 | 1 | 2 | 1 | 4 | 2 | 1 | 5 | 5 | 1 | 9 | ||||
| # mutation | 4 | 1 | 1 | 7 | 1 | 3 | 1 | 2 | 1 | 4 | 2 | 1 | 5 | 5 | 1 | 12 | ||||
| nonsynonymous SNV | 2 | 1 | 1 | 5 | 3 | 1 | 1 | 1 | 2 | 2 | 1 | 3 | 4 | 1 | 9 | |||||
| synonymous SNV | 2 | 2 | 1 | 1 | 2 | 2 | 1 | 3 |
| cf) Tissue ID; Tissue type (1; BLCA[Bladder Urothelial Carcinoma], 2; BRCA[Breast invasive carcinoma], 3; CESC[Cervical squamous cell carcinoma and endocervical adenocarcinoma], 4; COAD[Colon adenocarcinoma], 5; GBM[Glioblastoma multiforme], 6; Glioma Low Grade, 7; HNSC[Head and Neck squamous cell carcinoma], 8; KICH[Kidney Chromophobe], 9; KIRC[Kidney renal clear cell carcinoma], 10; KIRP[Kidney renal papillary cell carcinoma], 11; LAML[Acute Myeloid Leukemia], 12; LUAD[Lung adenocarcinoma], 13; LUSC[Lung squamous cell carcinoma], 14; OV[Ovarian serous cystadenocarcinoma ], 15; PAAD[Pancreatic adenocarcinoma], 16; PRAD[Prostate adenocarcinoma], 17; SKCM[Skin Cutaneous Melanoma], 18:STAD[Stomach adenocarcinoma], 19:THCA[Thyroid carcinoma], 20:UCEC[Uterine Corpus Endometrial Carcinoma]) |
| Top |
| * We represented just top 10 SNVs. When you move the cursor on each content, you can see more deailed mutation information on the Tooltip. Those are primary_site, primary_histology, mutation(aa), pubmedID. |
| Genomic Position | Mutation(aa) | Unique sampleID count |
| chr16:69148496 | p.R330Q,HAS3 | 3 |
| chr16:69148385 | p.S293T,HAS3 | 2 |
| chr16:69143549 | p.D129G,HAS3 | 1 |
| chr16:69148721 | p.D217H,HAS3 | 1 |
| chr16:69143776 | p.G470D,HAS3 | 1 |
| chr16:69152346 | p.Y131H,HAS3 | 1 |
| chr16:69147371 | p.P222A,HAS3 | 1 |
| chr16:69143594 | p.L513V,HAS3 | 1 |
| chr16:69148722 | p.I135I,HAS3 | 1 |
| chr16:69143815 | p.R230Q,HAS3 | 1 |
| * Copy number data were extracted from TCGA using R package TCGA-Assembler. The URLs of all public data files on TCGA DCC data server were gathered on Jan-05-2015. Function ProcessCNAData in TCGA-Assembler package was used to obtain gene-level copy number value which is calculated as the average copy number of the genomic region of a gene. |
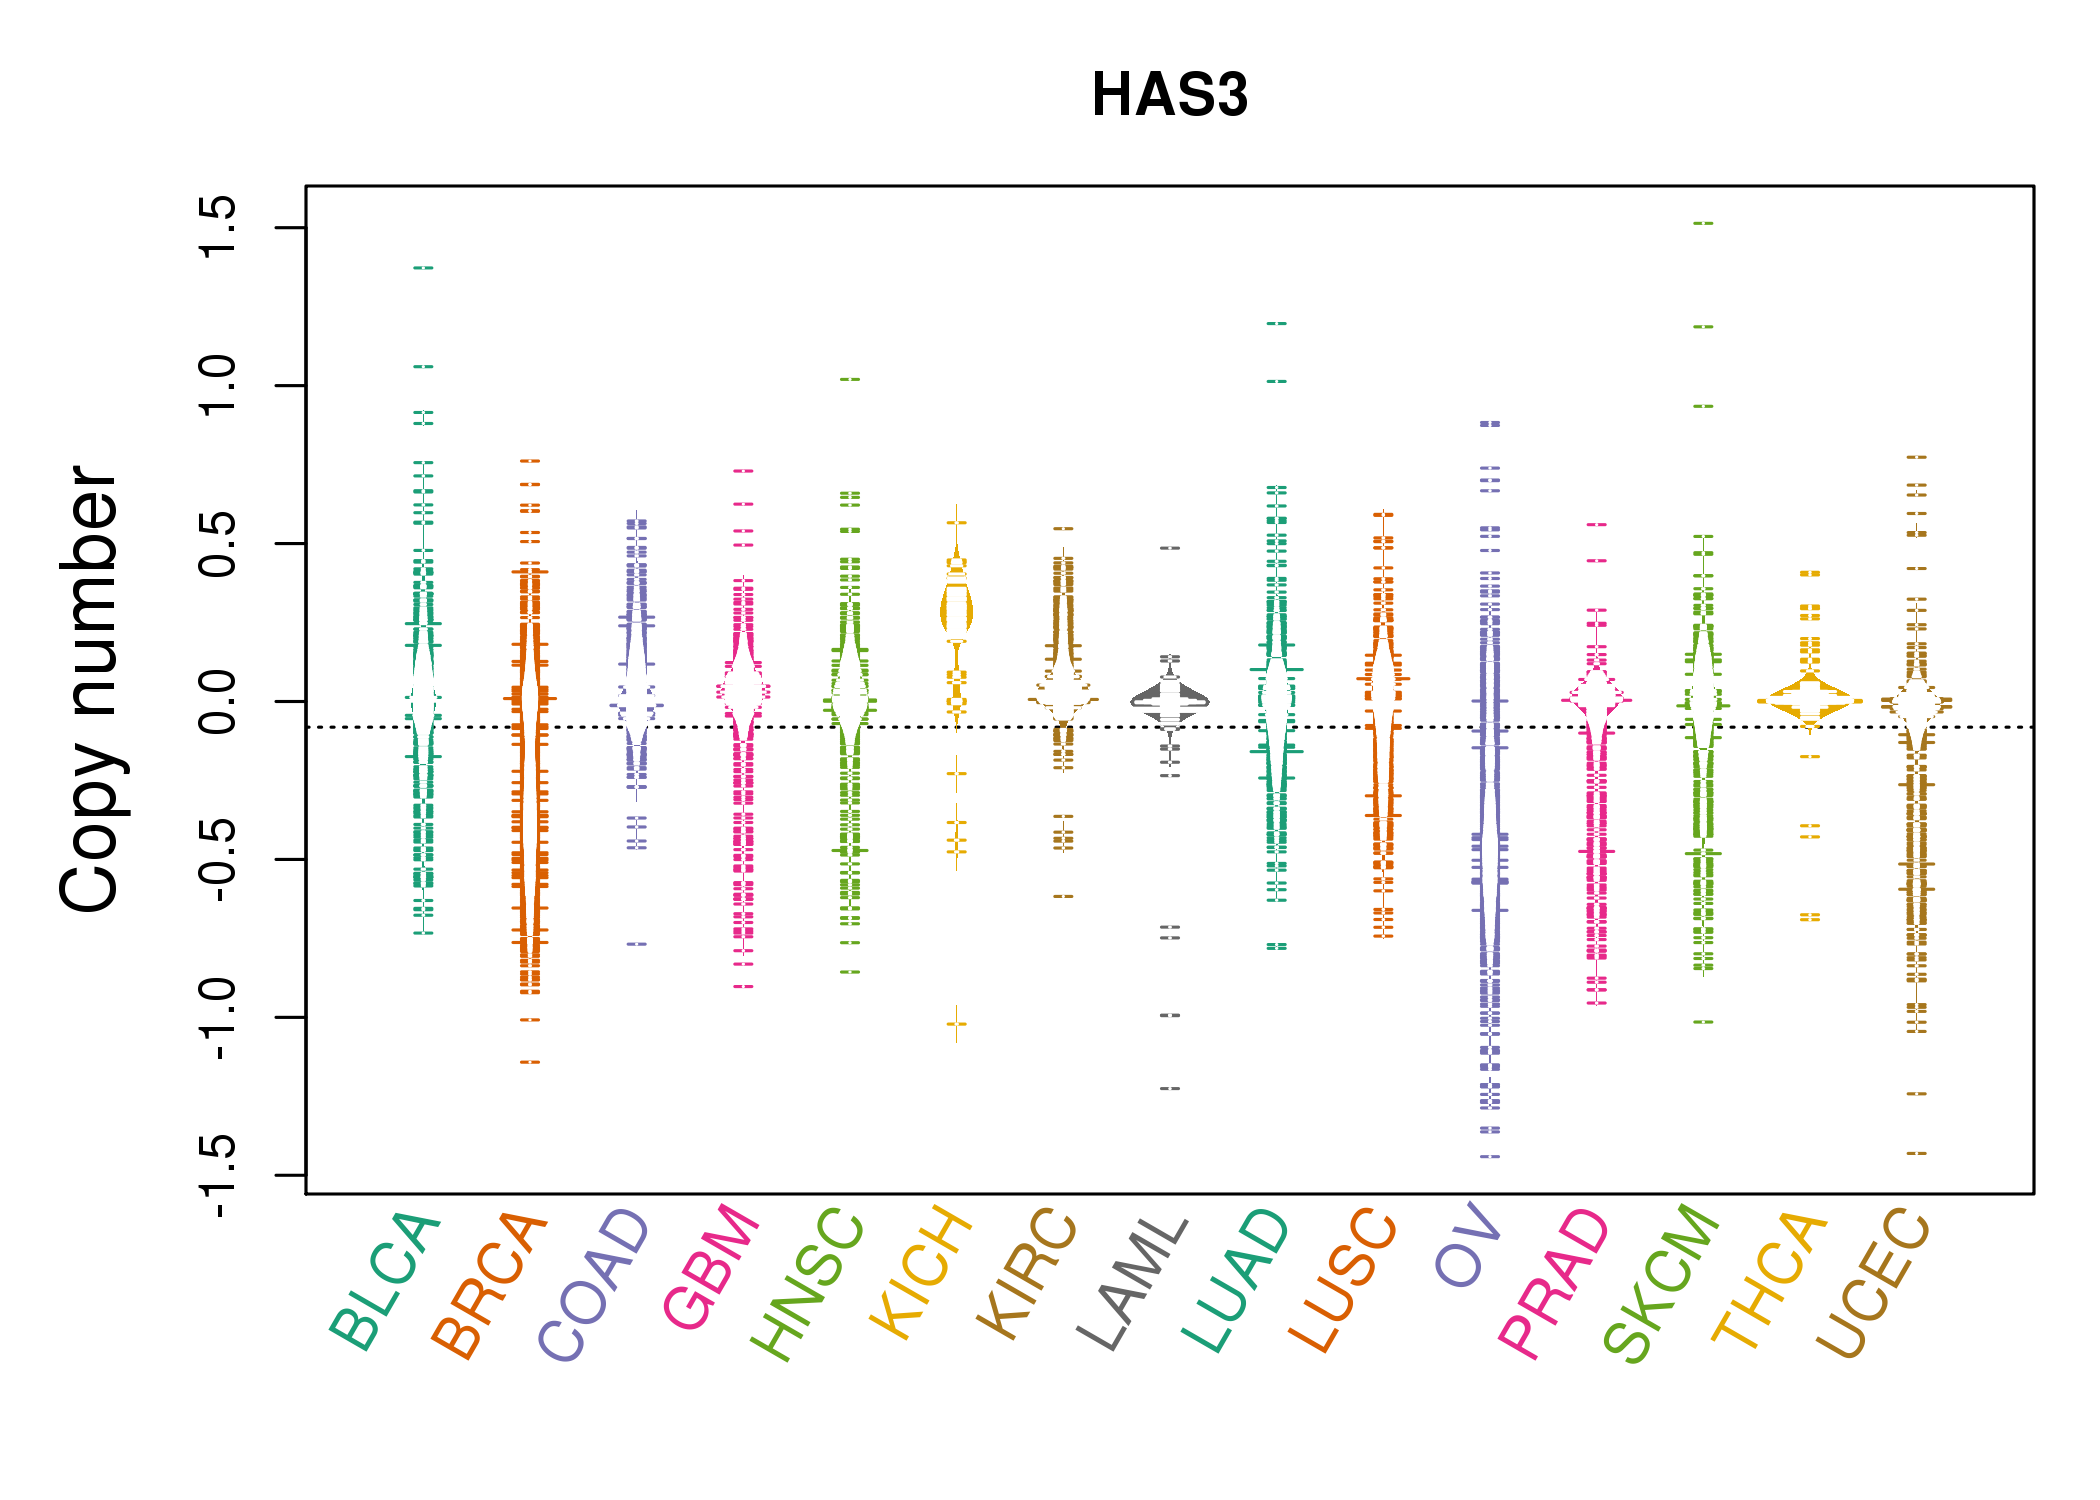 |
| cf) Tissue ID[Tissue type]: BLCA[Bladder Urothelial Carcinoma], BRCA[Breast invasive carcinoma], CESC[Cervical squamous cell carcinoma and endocervical adenocarcinoma], COAD[Colon adenocarcinoma], GBM[Glioblastoma multiforme], Glioma Low Grade, HNSC[Head and Neck squamous cell carcinoma], KICH[Kidney Chromophobe], KIRC[Kidney renal clear cell carcinoma], KIRP[Kidney renal papillary cell carcinoma], LAML[Acute Myeloid Leukemia], LUAD[Lung adenocarcinoma], LUSC[Lung squamous cell carcinoma], OV[Ovarian serous cystadenocarcinoma ], PAAD[Pancreatic adenocarcinoma], PRAD[Prostate adenocarcinoma], SKCM[Skin Cutaneous Melanoma], STAD[Stomach adenocarcinoma], THCA[Thyroid carcinoma], UCEC[Uterine Corpus Endometrial Carcinoma] |
| Top |
| Gene Expression for HAS3 |
| * CCLE gene expression data were extracted from CCLE_Expression_Entrez_2012-10-18.res: Gene-centric RMA-normalized mRNA expression data. |
 |
| * Normalized gene expression data of RNASeqV2 was extracted from TCGA using R package TCGA-Assembler. The URLs of all public data files on TCGA DCC data server were gathered at Jan-05-2015. Only eight cancer types have enough normal control samples for differential expression analysis. (t test, adjusted p<0.05 (using Benjamini-Hochberg FDR)) |
 |
| Top |
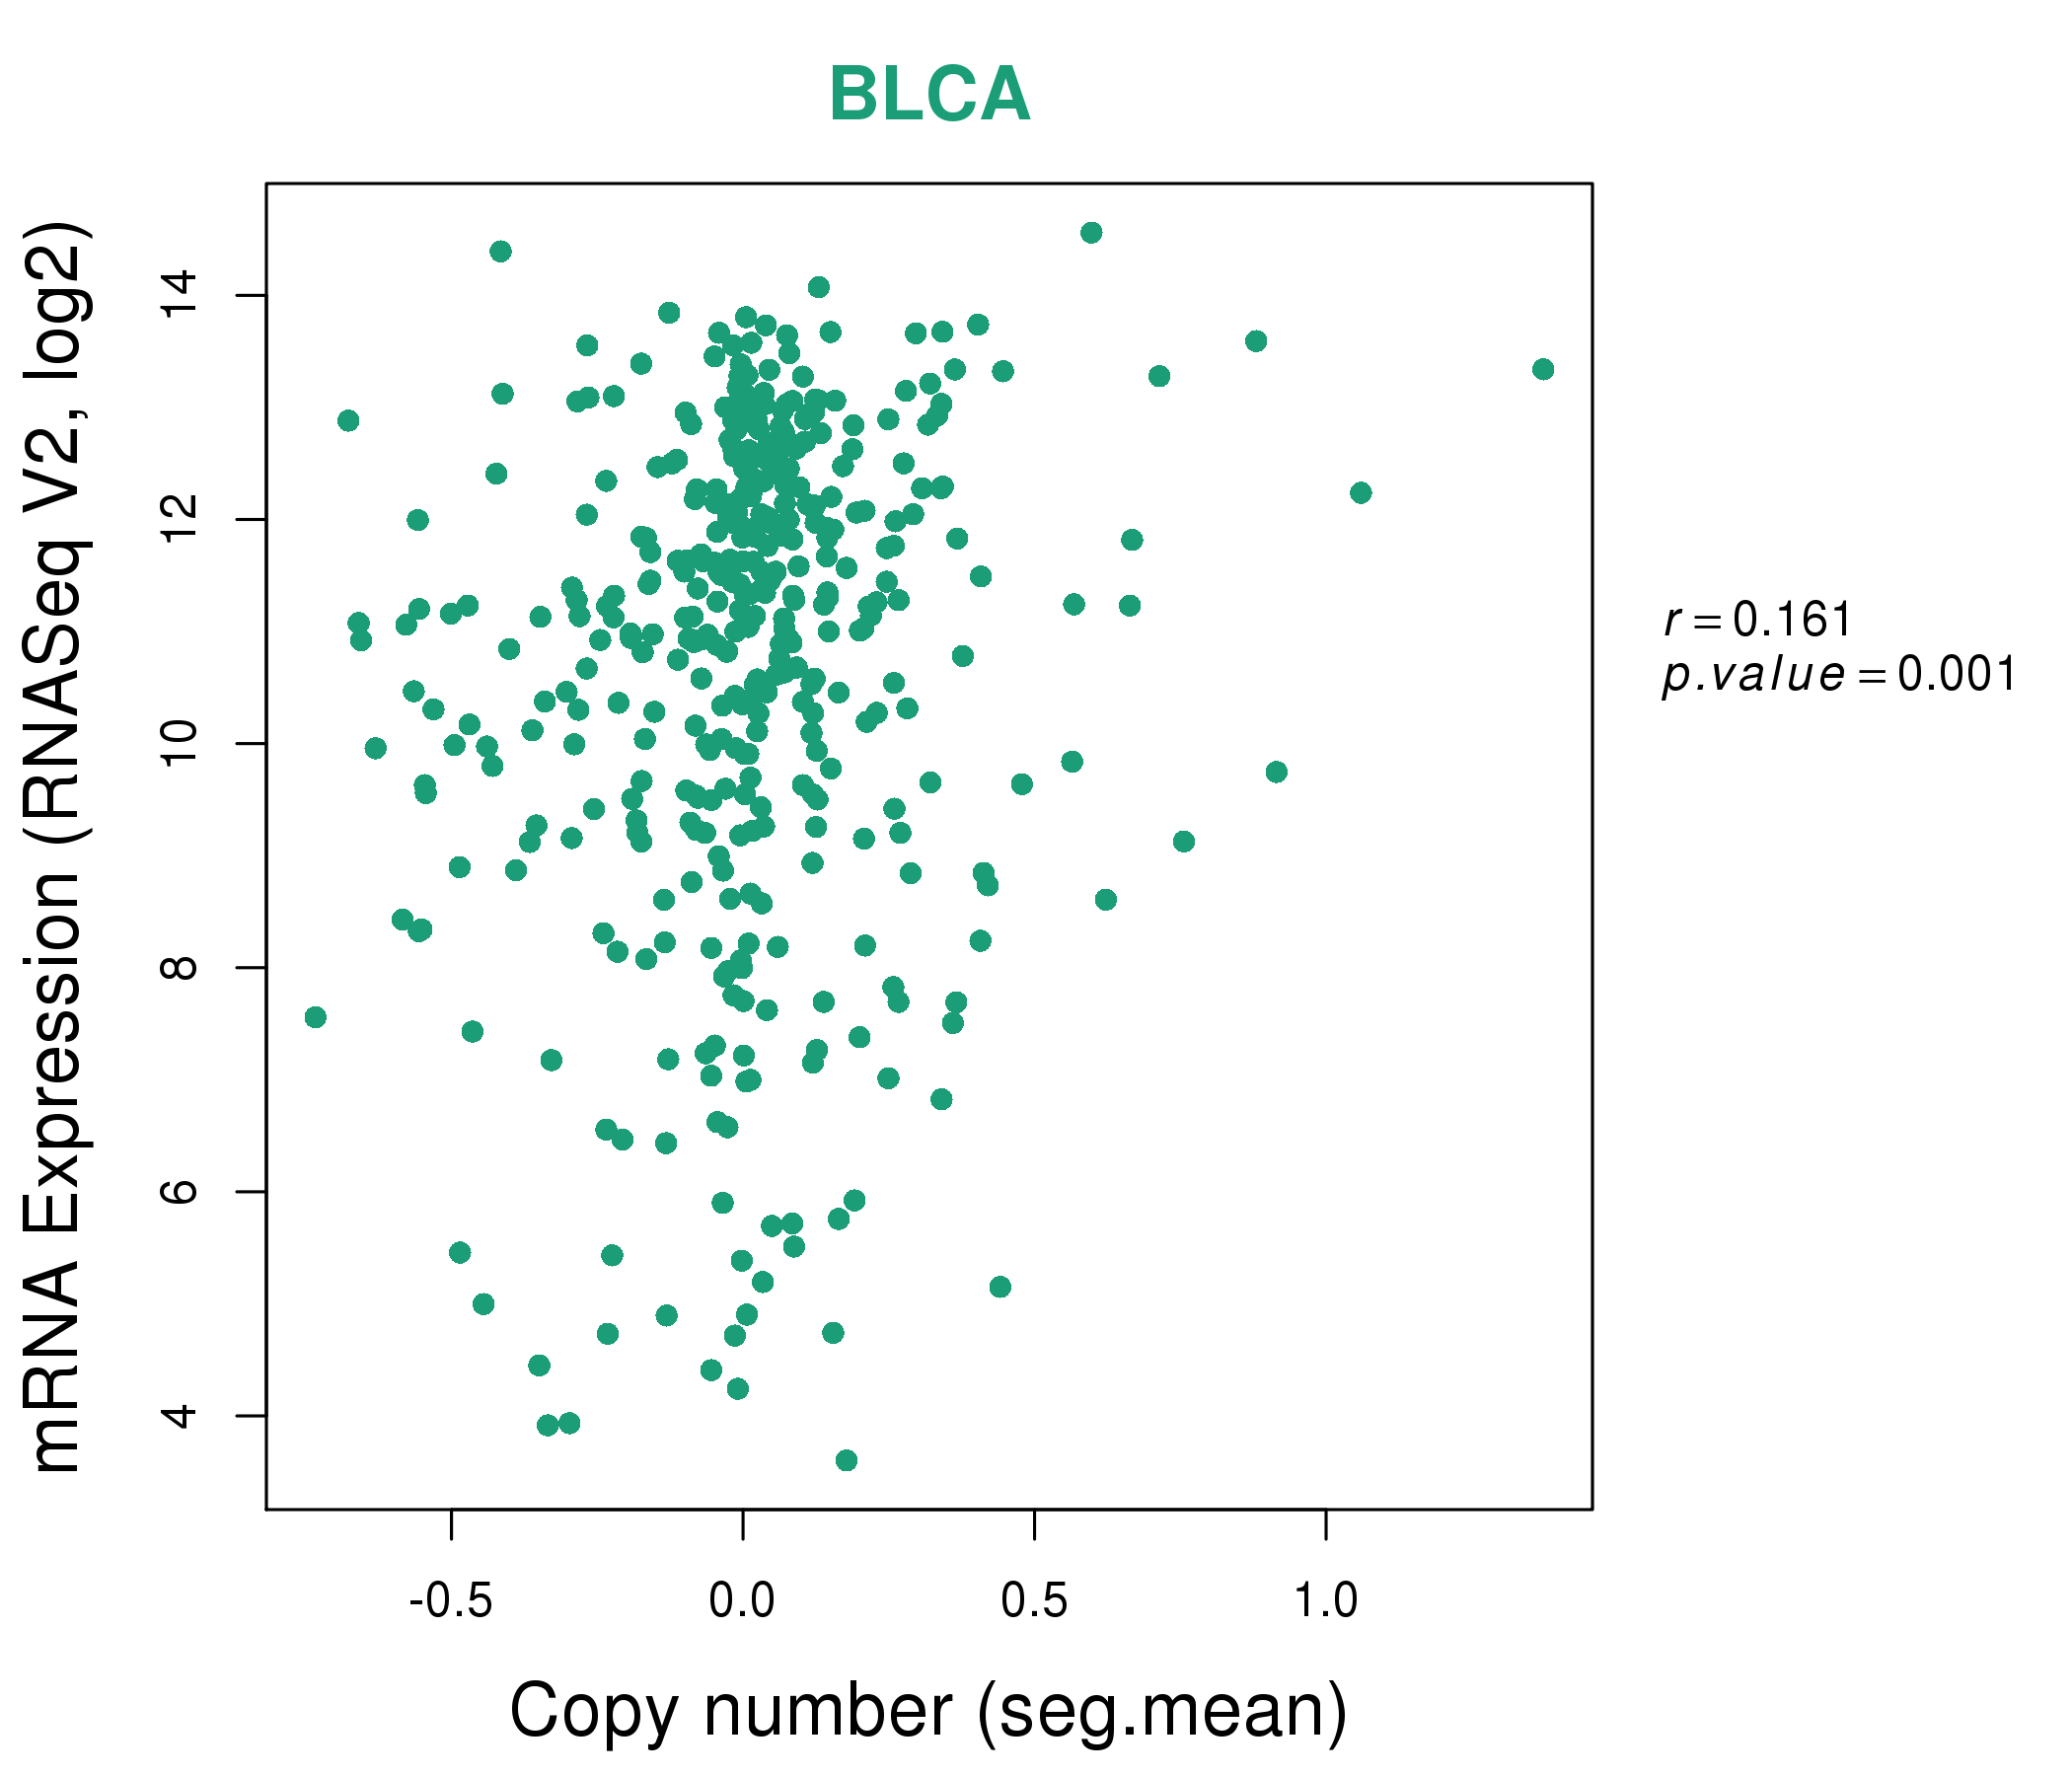
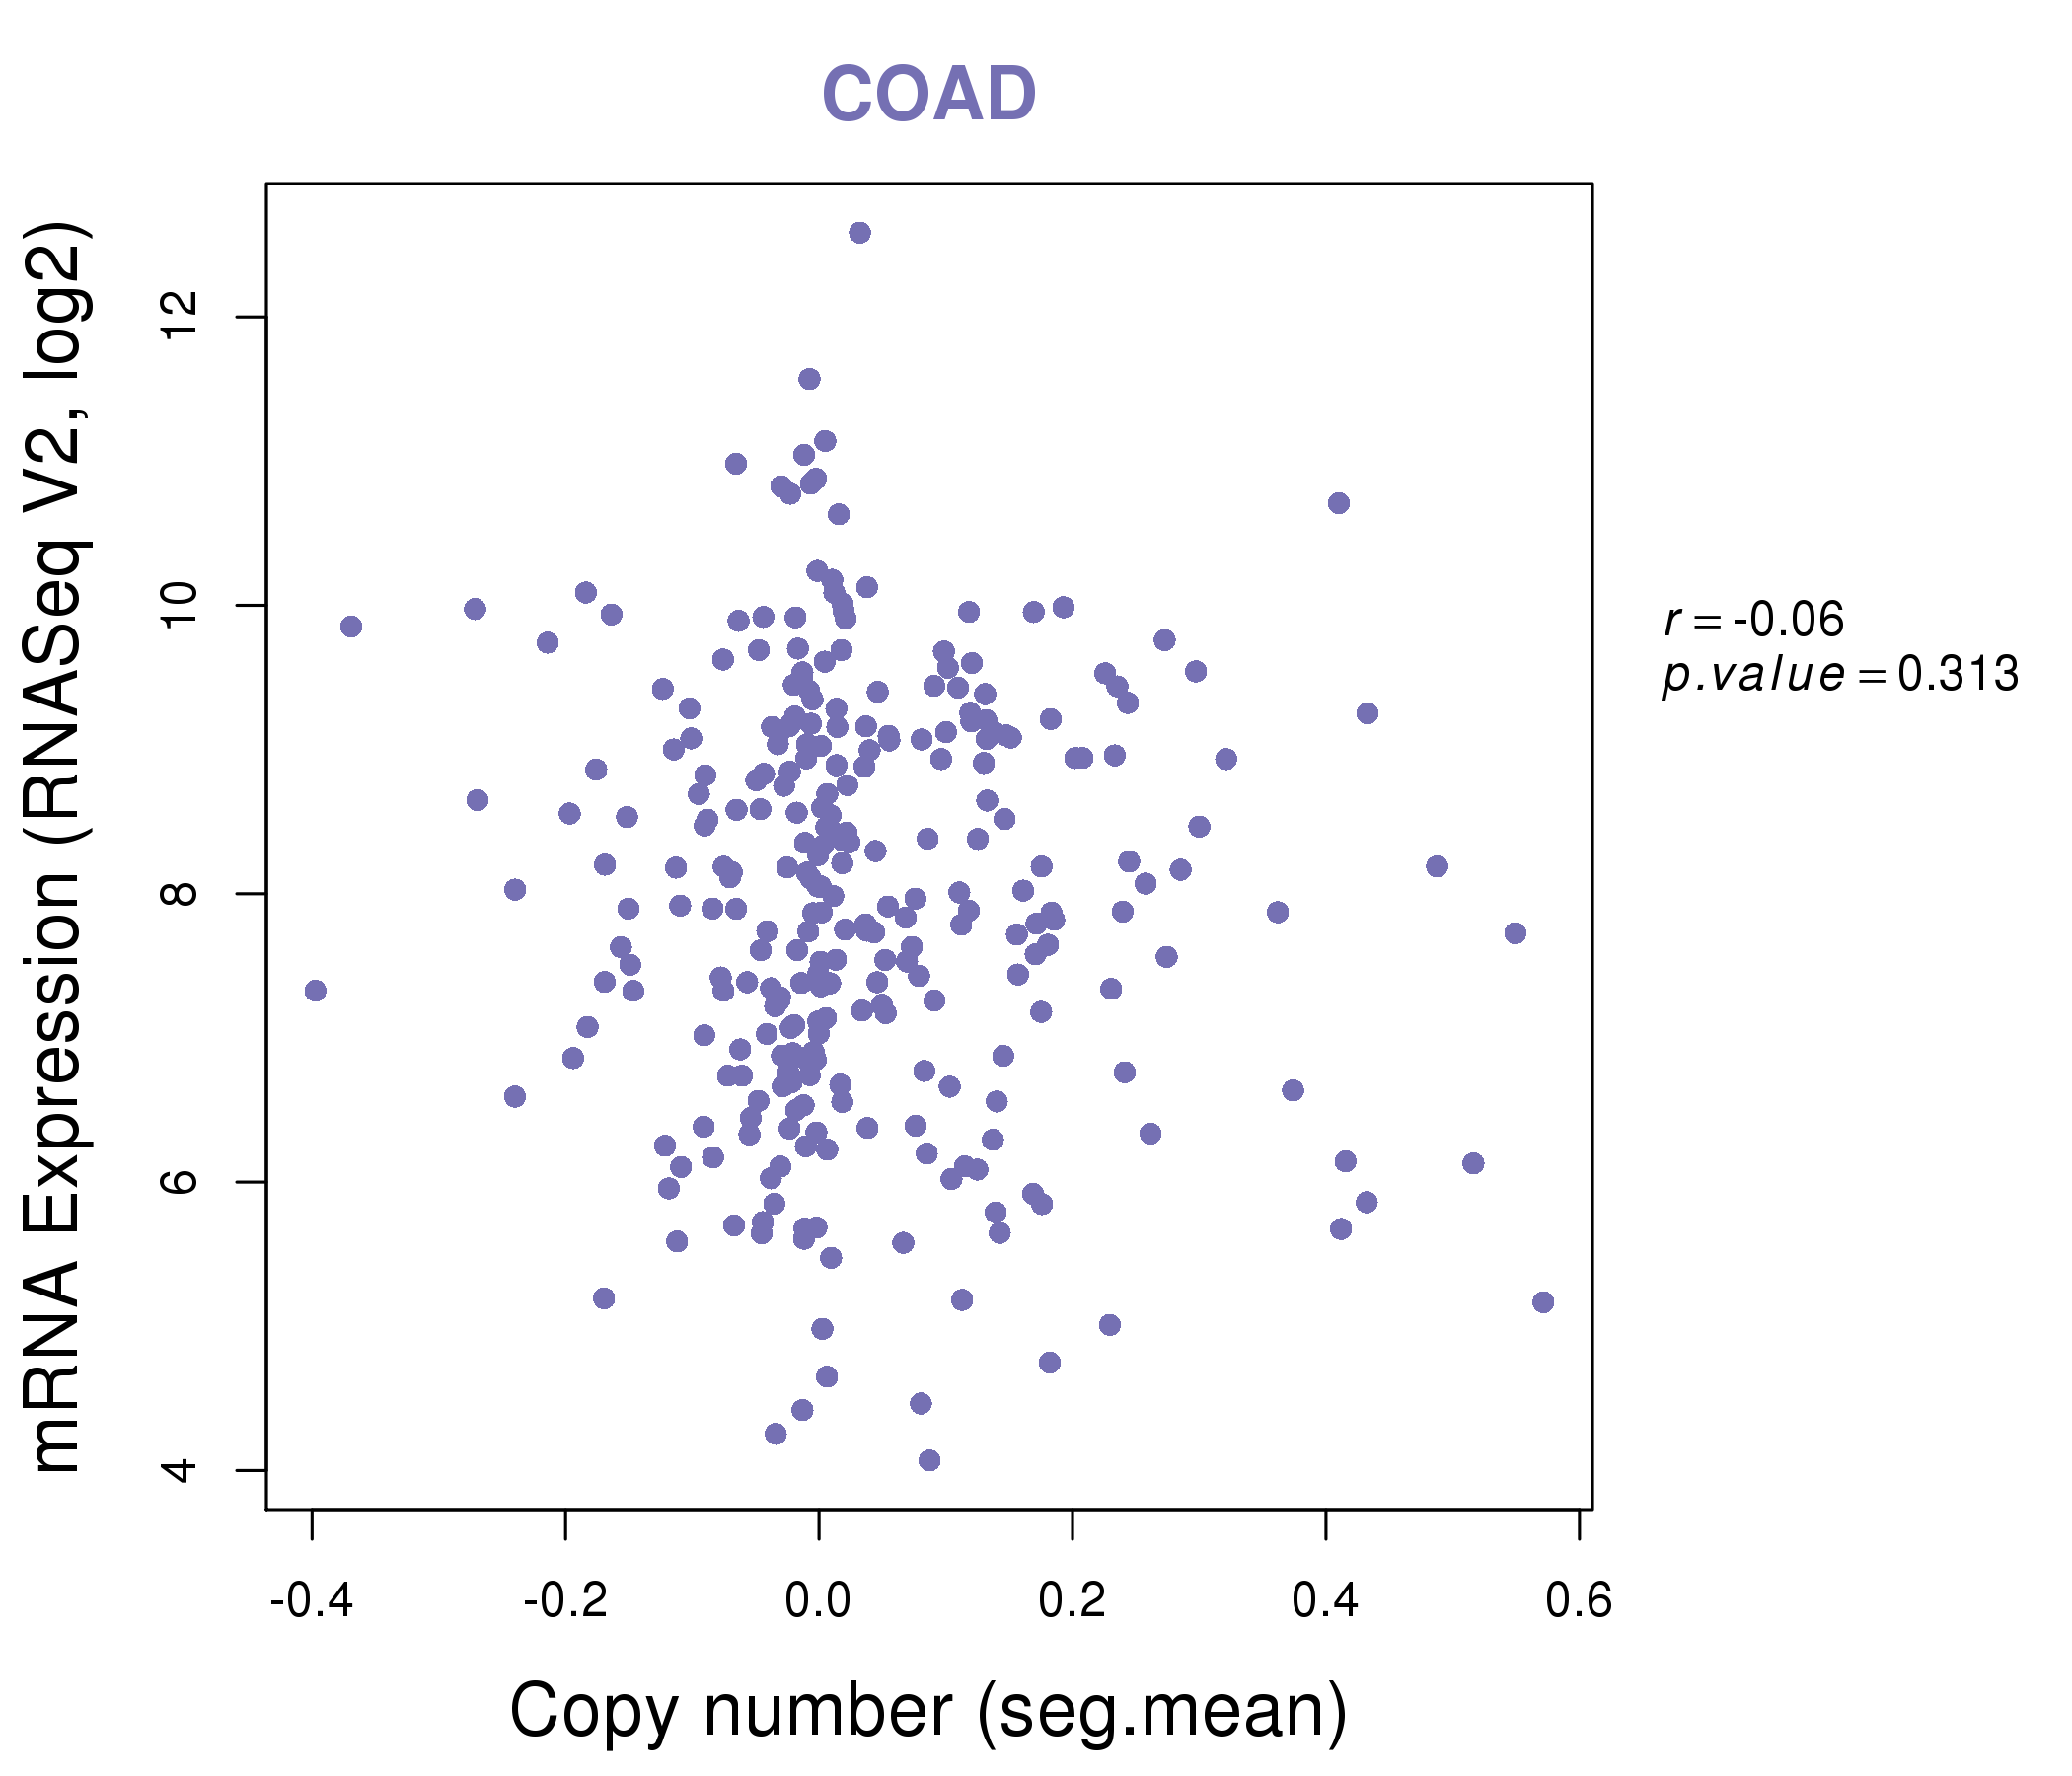
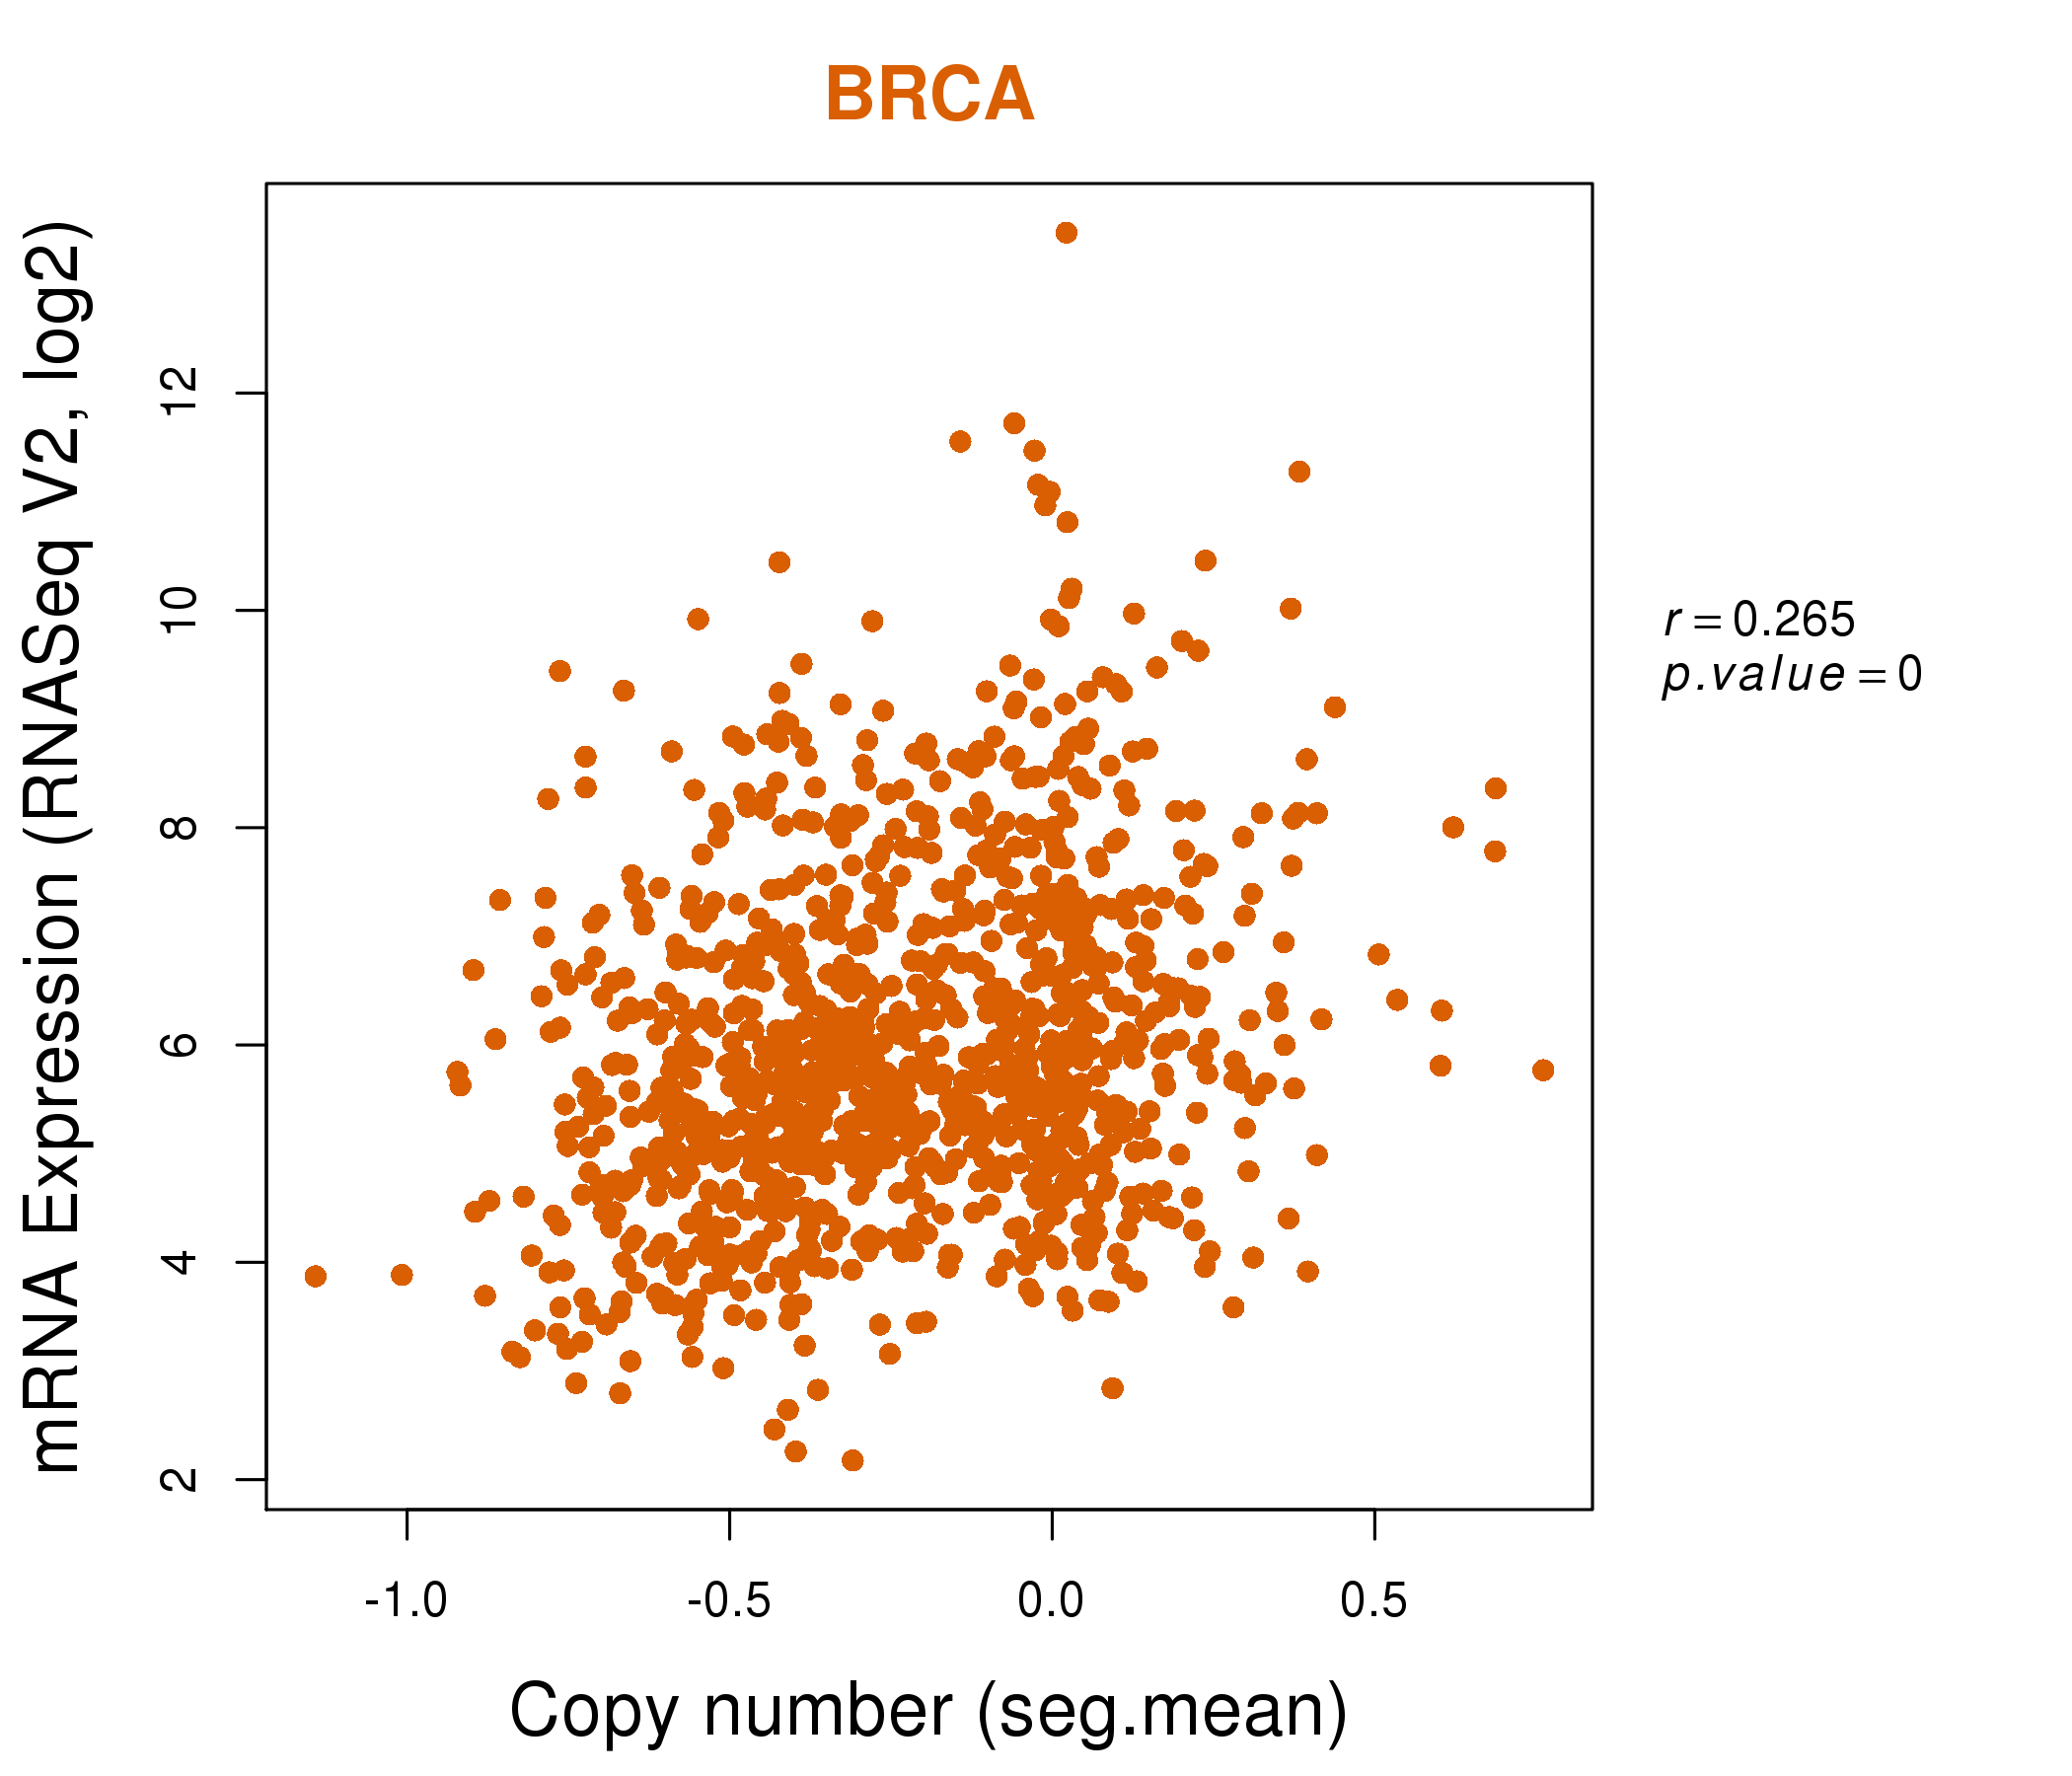
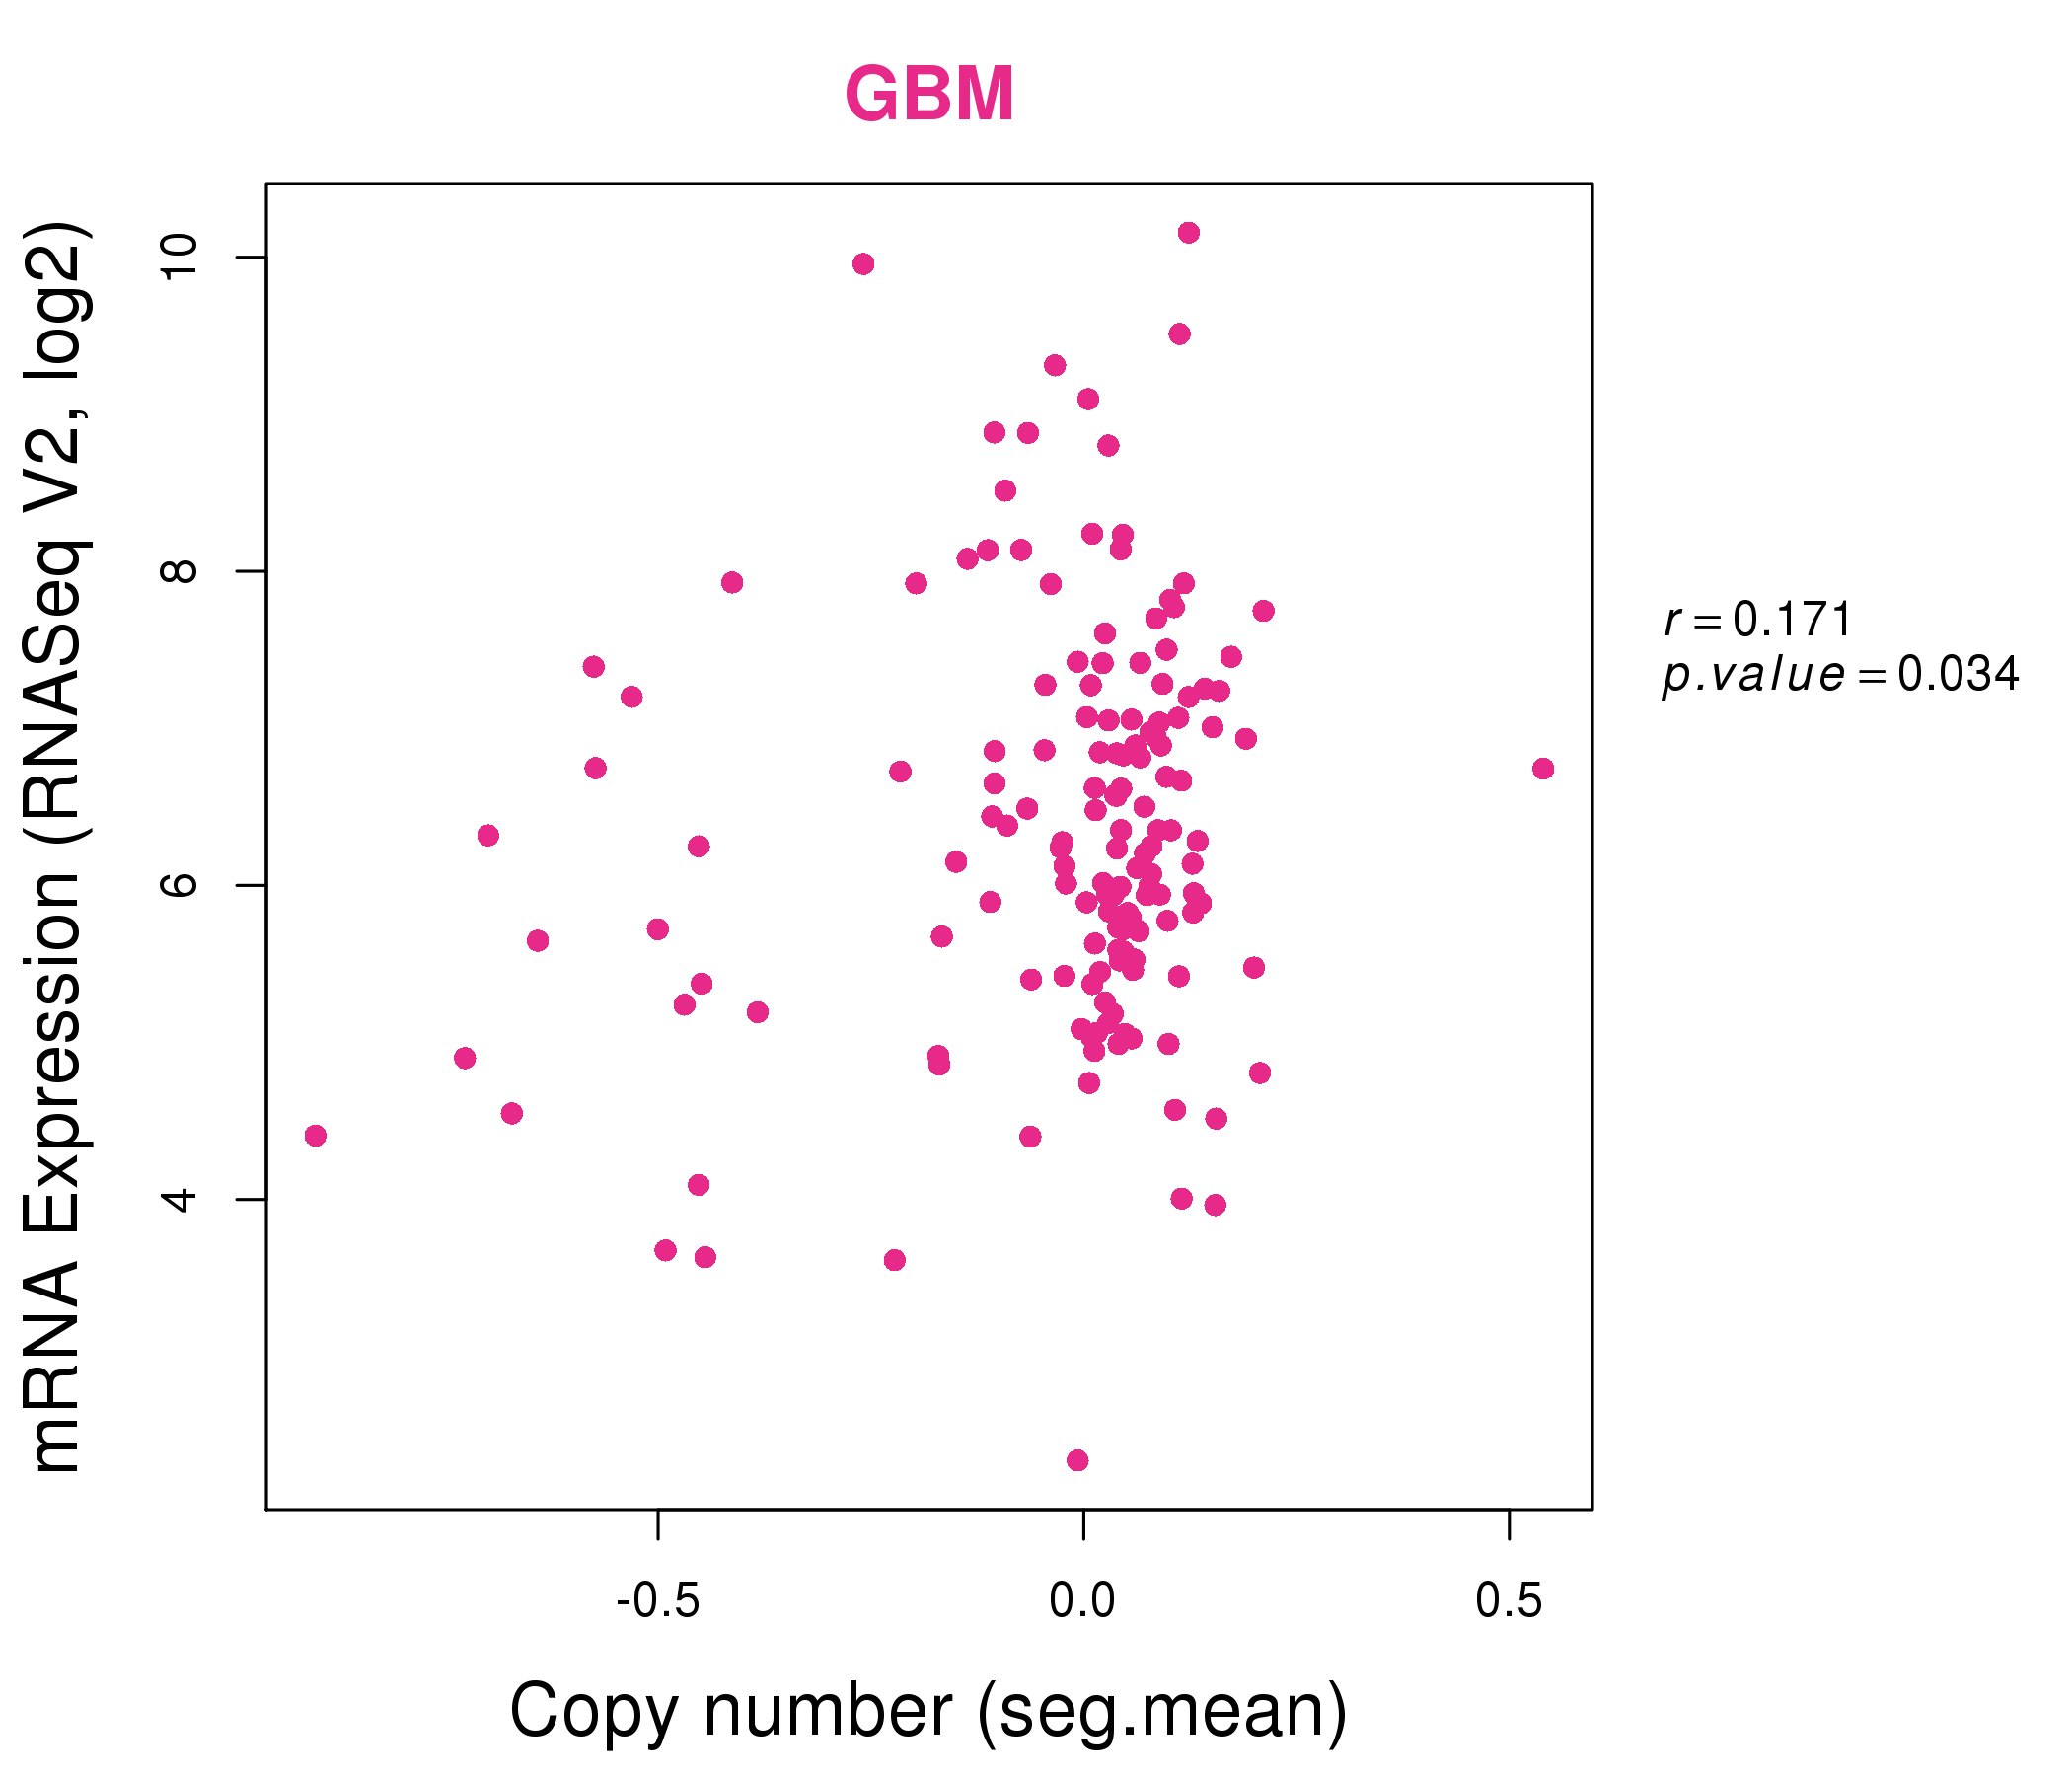
| * This plots show the correlation between CNV and gene expression. |
: Open all plots for all cancer types
 |
|
 |
|
| Top |
| Gene-Gene Network Information |
| * Co-Expression network figures were drawn using R package igraph. Only the top 20 genes with the highest correlations were shown. Red circle: input gene, orange circle: cell metabolism gene, sky circle: other gene |
: Open all plots for all cancer types
 |
|
| BNC1,C11orf87,CDH4,COL17A1,FGFBP1,HAS3,HMGA2, HSD17B3,KRT5,KRT75,LOC150527,MIR31HG,MT4,MYO7B, OR2J3,PADI3,PCSK9,PLEK2,RPSAP52,S100A2,SOX15 | AEN,CD200,CDK2,CLDN1,DYRK3,HAS3,HEY2, HSPA4L,IFFO2,KRT23,KRT9,LAMC2,LIF,NPAS4, PLK3,SRF,STK17A,TES,TUFT1,WEE1,ZNF165 |
 |
|
| CRCT1,CRNN,DEFB103B,HAS3,IL36A,KLK9,KRT14, KRT16,KRT6A,KRT6C,KRT78,LCE3D,LCE3E,LYPD3, SPRR1B,SPRR2A,SPRR2B,SPRR2C,SPRR2D,SPRR2E,TGM1 | ADRA2A,B4GALT1,FABP1,HAS3,HSD17B2,KRT12,LANCL3, LOC25845,MIER3,OSTalpha,PLOD2,PPARD,PPP1R14C,SLC20A1, SLC30A10,SLC4A9,SLC9A3,TGFA,TMEM65,WSCD1,ZNF341 |


| * Co-Expression network figures were drawn using R package igraph. Only the top 20 genes with the highest correlations were shown. Red circle: input gene, orange circle: cell metabolism gene, sky circle: other gene |
: Open all plots for all cancer types
| Top |
: Open all interacting genes' information including KEGG pathway for all interacting genes from DAVID
| Top |
| Pharmacological Information for HAS3 |
| There's no related Drug. |
| Top |
| Cross referenced IDs for HAS3 |
| * We obtained these cross-references from Uniprot database. It covers 150 different DBs, 18 categories. http://www.uniprot.org/help/cross_references_section |
: Open all cross reference information
|
Copyright © 2016-Present - The Univsersity of Texas Health Science Center at Houston @ |