|
||||||||||||||||||||
| |
| Phenotypic Information (metabolism pathway, cancer, disease, phenome) |
| |
| |
| Gene-Gene Network Information: Co-Expression Network, Interacting Genes & KEGG |
| |
|


| Gene Summary for HDC |
| Basic gene info. | Gene symbol | HDC |
| Gene name | histidine decarboxylase | |
| Synonyms | - | |
| Cytomap | UCSC genome browser: 15q21.2 | |
| Genomic location | chr15 :50534145-50558162 | |
| Type of gene | protein-coding | |
| RefGenes | NM_002112.3, | |
| Ensembl id | ENSG00000140287 | |
| Description | - | |
| Modification date | 20141207 | |
| dbXrefs | MIM : 142704 | |
| HGNC : HGNC | ||
| Ensembl : ENSG00000140287 | ||
| HPRD : 00817 | ||
| Vega : OTTHUMG00000131644 | ||
| Protein | UniProt: go to UniProt's Cross Reference DB Table | |
| Expression | CleanEX: HS_HDC | |
| BioGPS: 3067 | ||
| Gene Expression Atlas: ENSG00000140287 | ||
| The Human Protein Atlas: ENSG00000140287 | ||
| Pathway | NCI Pathway Interaction Database: HDC | |
| KEGG: HDC | ||
| REACTOME: HDC | ||
| ConsensusPathDB | ||
| Pathway Commons: HDC | ||
| Metabolism | MetaCyc: HDC | |
| HUMANCyc: HDC | ||
| Regulation | Ensembl's Regulation: ENSG00000140287 | |
| miRBase: chr15 :50,534,145-50,558,162 | ||
| TargetScan: NM_002112 | ||
| cisRED: ENSG00000140287 | ||
| Context | iHOP: HDC | |
| cancer metabolism search in PubMed: HDC | ||
| UCL Cancer Institute: HDC | ||
| Assigned class in ccmGDB | C | |
| Top |
| Phenotypic Information for HDC(metabolism pathway, cancer, disease, phenome) |
| Cancer | CGAP: HDC |
| Familial Cancer Database: HDC | |
| * This gene is included in those cancer gene databases. |
|
|
|
|
|
| . | ||||||||||||||
Oncogene 1 | Significant driver gene in | |||||||||||||||||||
| cf) number; DB name 1 Oncogene; http://nar.oxfordjournals.org/content/35/suppl_1/D721.long, 2 Tumor Suppressor gene; https://bioinfo.uth.edu/TSGene/, 3 Cancer Gene Census; http://www.nature.com/nrc/journal/v4/n3/abs/nrc1299.html, 4 CancerGenes; http://nar.oxfordjournals.org/content/35/suppl_1/D721.long, 5 Network of Cancer Gene; http://ncg.kcl.ac.uk/index.php, 1Therapeutic Vulnerabilities in Cancer; http://cbio.mskcc.org/cancergenomics/statius/ |
| KEGG_HISTIDINE_METABOLISM REACTOME_METABOLISM_OF_AMINO_ACIDS_AND_DERIVATIVES | |
| OMIM | |
| Orphanet | |
| Disease | KEGG Disease: HDC |
| MedGen: HDC (Human Medical Genetics with Condition) | |
| ClinVar: HDC | |
| Phenotype | MGI: HDC (International Mouse Phenotyping Consortium) |
| PhenomicDB: HDC | |
| Mutations for HDC |
| * Under tables are showing count per each tissue to give us broad intuition about tissue specific mutation patterns.You can go to the detailed page for each mutation database's web site. |
| There's no structural variation information in COSMIC data for this gene. |
| * From mRNA Sanger sequences, Chitars2.0 arranged chimeric transcripts. This table shows HDC related fusion information. |
| ID | Head Gene | Tail Gene | Accession | Gene_a | qStart_a | qEnd_a | Chromosome_a | tStart_a | tEnd_a | Gene_a | qStart_a | qEnd_a | Chromosome_a | tStart_a | tEnd_a |
| Top |
| There's no copy number variation information in COSMIC data for this gene. |
| Top |
|
 |
| Top |
| Stat. for Non-Synonymous SNVs (# total SNVs=71) | (# total SNVs=17) |
 |  |
(# total SNVs=0) | (# total SNVs=0) |
| Top |
| * When you move the cursor on each content, you can see more deailed mutation information on the Tooltip. Those are primary_site,primary_histology,mutation(aa),pubmedID. |
| GRCh37 position | Mutation(aa) | Unique sampleID count |
| chr15:50544965-50544965 | p.R265H | 3 |
| chr15:50535170-50535170 | p.E426K | 3 |
| chr15:50534832-50534832 | p.N538N | 2 |
| chr15:50546429-50546429 | p.V206V | 2 |
| chr15:50555448-50555448 | p.R63Q | 2 |
| chr15:50535348-50535348 | p.R412C | 2 |
| chr15:50544942-50544942 | p.D273N | 2 |
| chr15:50534514-50534514 | p.E644D | 2 |
| chr15:50534666-50534666 | p.A594T | 2 |
| chr15:50535044-50535044 | p.R468* | 2 |
| Top |
|
 |
| Point Mutation/ Tissue ID | 1 | 2 | 3 | 4 | 5 | 6 | 7 | 8 | 9 | 10 | 11 | 12 | 13 | 14 | 15 | 16 | 17 | 18 | 19 | 20 |
| # sample | 2 | 1 | 14 | 4 | 2 | 9 | 7 | 2 | 25 | 8 | 9 | |||||||||
| # mutation | 2 | 1 | 17 | 4 | 2 | 10 | 8 | 2 | 27 | 12 | 9 | |||||||||
| nonsynonymous SNV | 2 | 1 | 12 | 3 | 2 | 8 | 6 | 1 | 18 | 9 | 8 | |||||||||
| synonymous SNV | 5 | 1 | 2 | 2 | 1 | 9 | 3 | 1 |
| cf) Tissue ID; Tissue type (1; BLCA[Bladder Urothelial Carcinoma], 2; BRCA[Breast invasive carcinoma], 3; CESC[Cervical squamous cell carcinoma and endocervical adenocarcinoma], 4; COAD[Colon adenocarcinoma], 5; GBM[Glioblastoma multiforme], 6; Glioma Low Grade, 7; HNSC[Head and Neck squamous cell carcinoma], 8; KICH[Kidney Chromophobe], 9; KIRC[Kidney renal clear cell carcinoma], 10; KIRP[Kidney renal papillary cell carcinoma], 11; LAML[Acute Myeloid Leukemia], 12; LUAD[Lung adenocarcinoma], 13; LUSC[Lung squamous cell carcinoma], 14; OV[Ovarian serous cystadenocarcinoma ], 15; PAAD[Pancreatic adenocarcinoma], 16; PRAD[Prostate adenocarcinoma], 17; SKCM[Skin Cutaneous Melanoma], 18:STAD[Stomach adenocarcinoma], 19:THCA[Thyroid carcinoma], 20:UCEC[Uterine Corpus Endometrial Carcinoma]) |
| Top |
| * We represented just top 10 SNVs. When you move the cursor on each content, you can see more deailed mutation information on the Tooltip. Those are primary_site, primary_histology, mutation(aa), pubmedID. |
| Genomic Position | Mutation(aa) | Unique sampleID count |
| chr15:50555448 | p.R63Q | 3 |
| chr15:50534698 | p.D273N | 2 |
| chr15:50534531 | p.R583H | 2 |
| chr15:50535170 | p.V639I | 2 |
| chr15:50544942 | p.E426K | 2 |
| chr15:50534962 | p.F286F | 1 |
| chr15:50544965 | p.S204C | 1 |
| chr15:50555543 | p.N588S | 1 |
| chr15:50534668 | p.Q525H | 1 |
| chr15:50535355 | p.E399K | 1 |
| * Copy number data were extracted from TCGA using R package TCGA-Assembler. The URLs of all public data files on TCGA DCC data server were gathered on Jan-05-2015. Function ProcessCNAData in TCGA-Assembler package was used to obtain gene-level copy number value which is calculated as the average copy number of the genomic region of a gene. |
 |
| cf) Tissue ID[Tissue type]: BLCA[Bladder Urothelial Carcinoma], BRCA[Breast invasive carcinoma], CESC[Cervical squamous cell carcinoma and endocervical adenocarcinoma], COAD[Colon adenocarcinoma], GBM[Glioblastoma multiforme], Glioma Low Grade, HNSC[Head and Neck squamous cell carcinoma], KICH[Kidney Chromophobe], KIRC[Kidney renal clear cell carcinoma], KIRP[Kidney renal papillary cell carcinoma], LAML[Acute Myeloid Leukemia], LUAD[Lung adenocarcinoma], LUSC[Lung squamous cell carcinoma], OV[Ovarian serous cystadenocarcinoma ], PAAD[Pancreatic adenocarcinoma], PRAD[Prostate adenocarcinoma], SKCM[Skin Cutaneous Melanoma], STAD[Stomach adenocarcinoma], THCA[Thyroid carcinoma], UCEC[Uterine Corpus Endometrial Carcinoma] |
| Top |
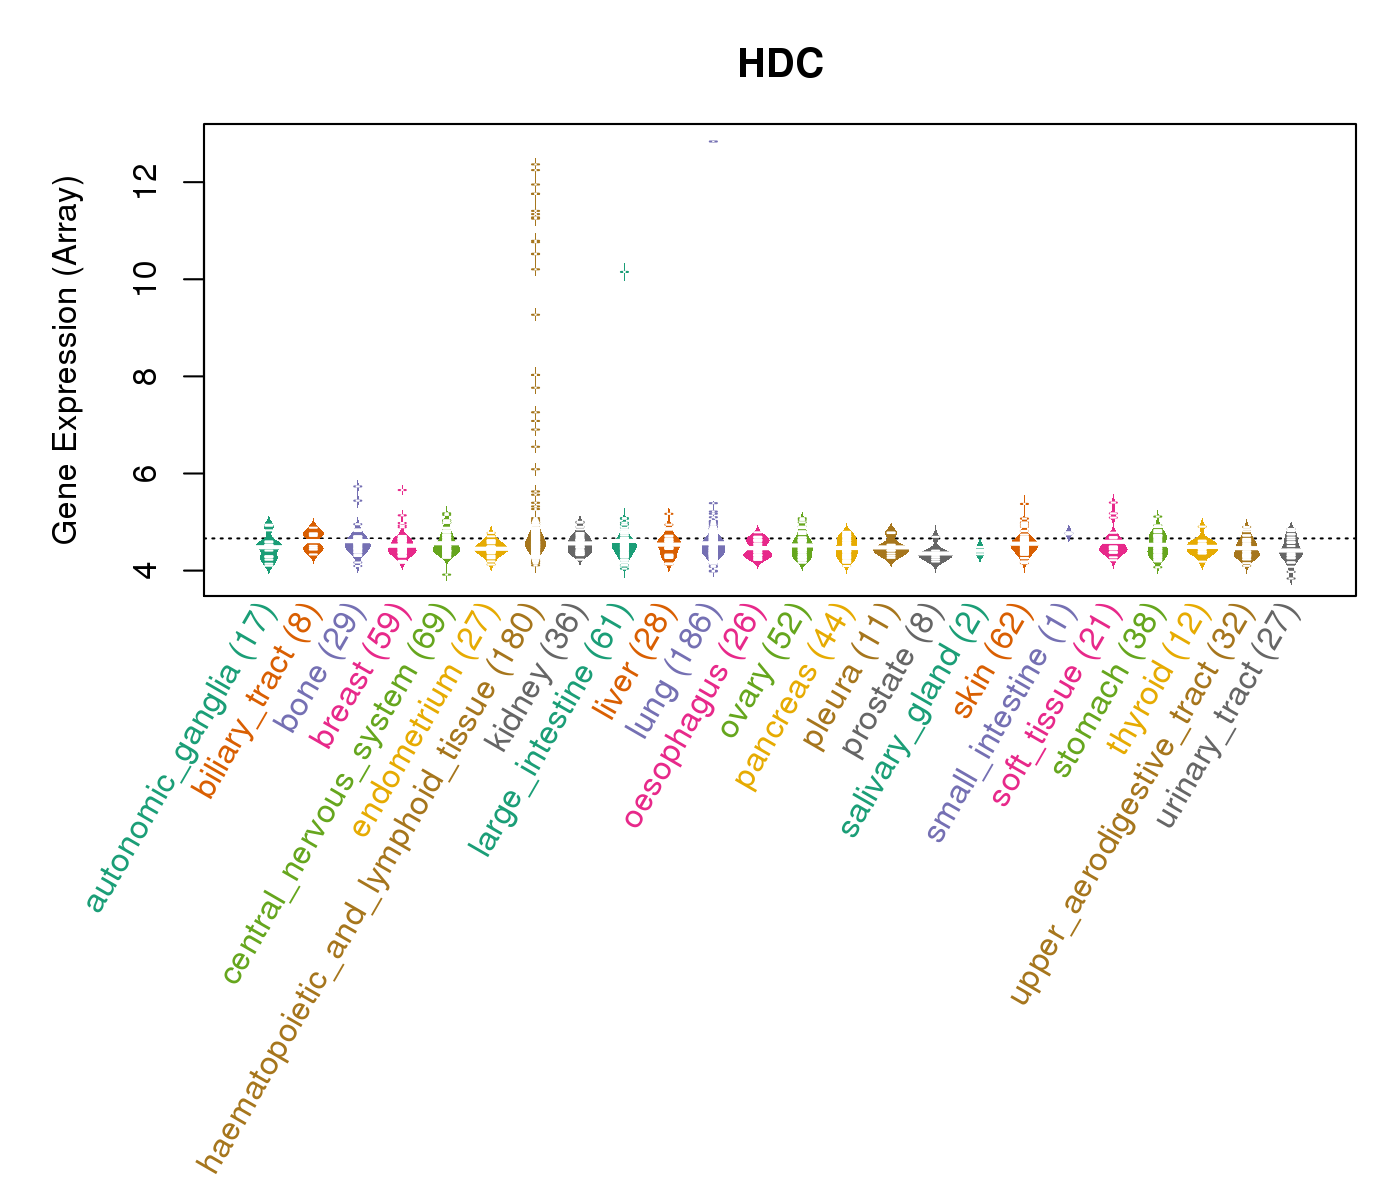
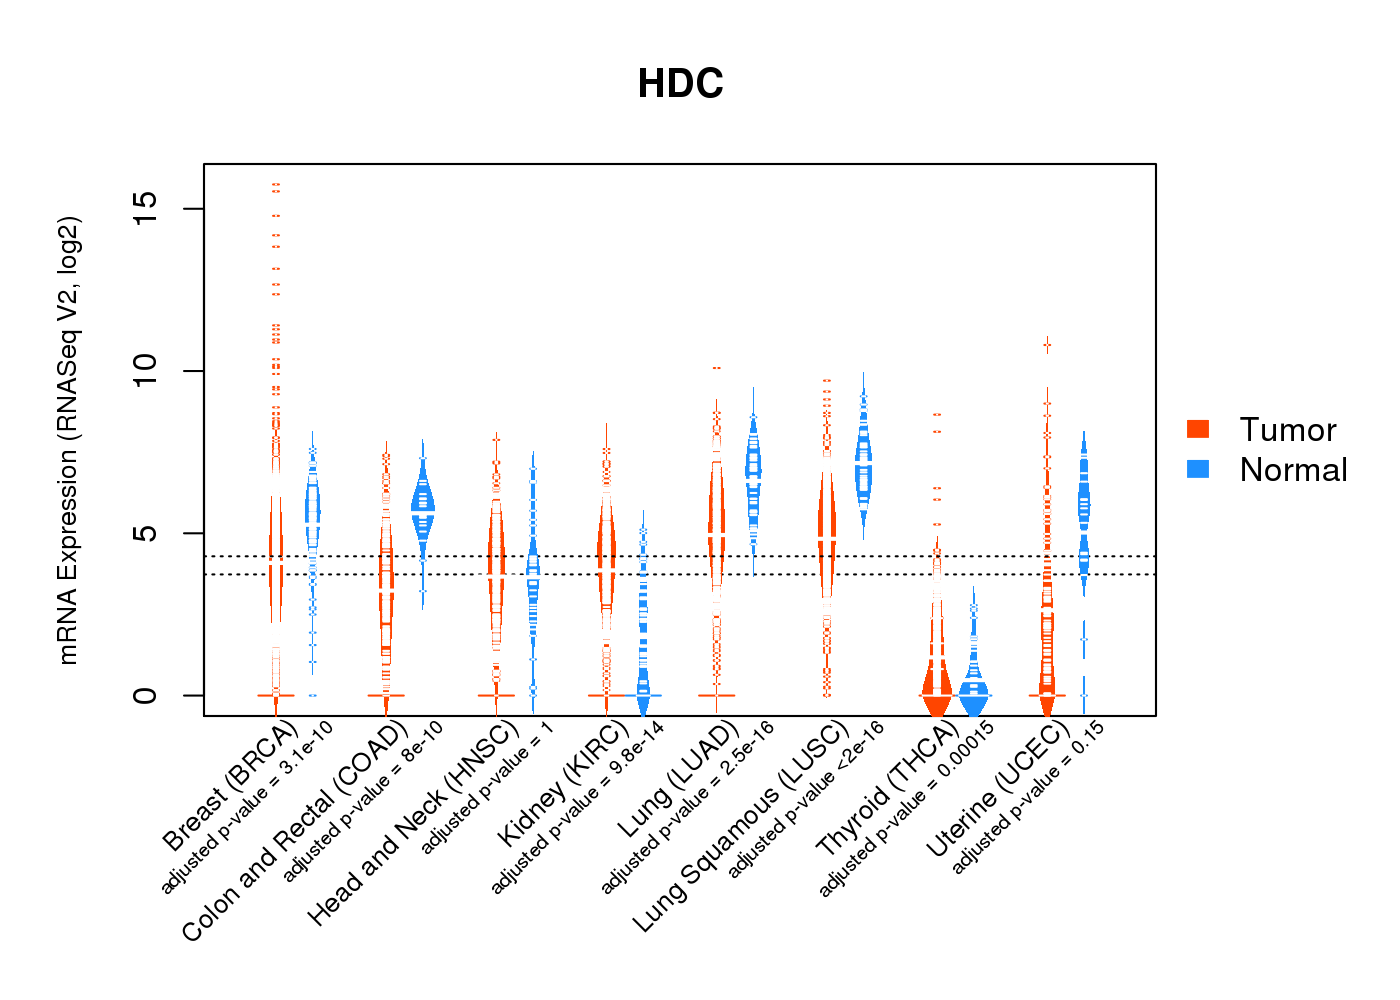
| Gene Expression for HDC |
| * CCLE gene expression data were extracted from CCLE_Expression_Entrez_2012-10-18.res: Gene-centric RMA-normalized mRNA expression data. |
 |
| * Normalized gene expression data of RNASeqV2 was extracted from TCGA using R package TCGA-Assembler. The URLs of all public data files on TCGA DCC data server were gathered at Jan-05-2015. Only eight cancer types have enough normal control samples for differential expression analysis. (t test, adjusted p<0.05 (using Benjamini-Hochberg FDR)) |
 |
| Top |
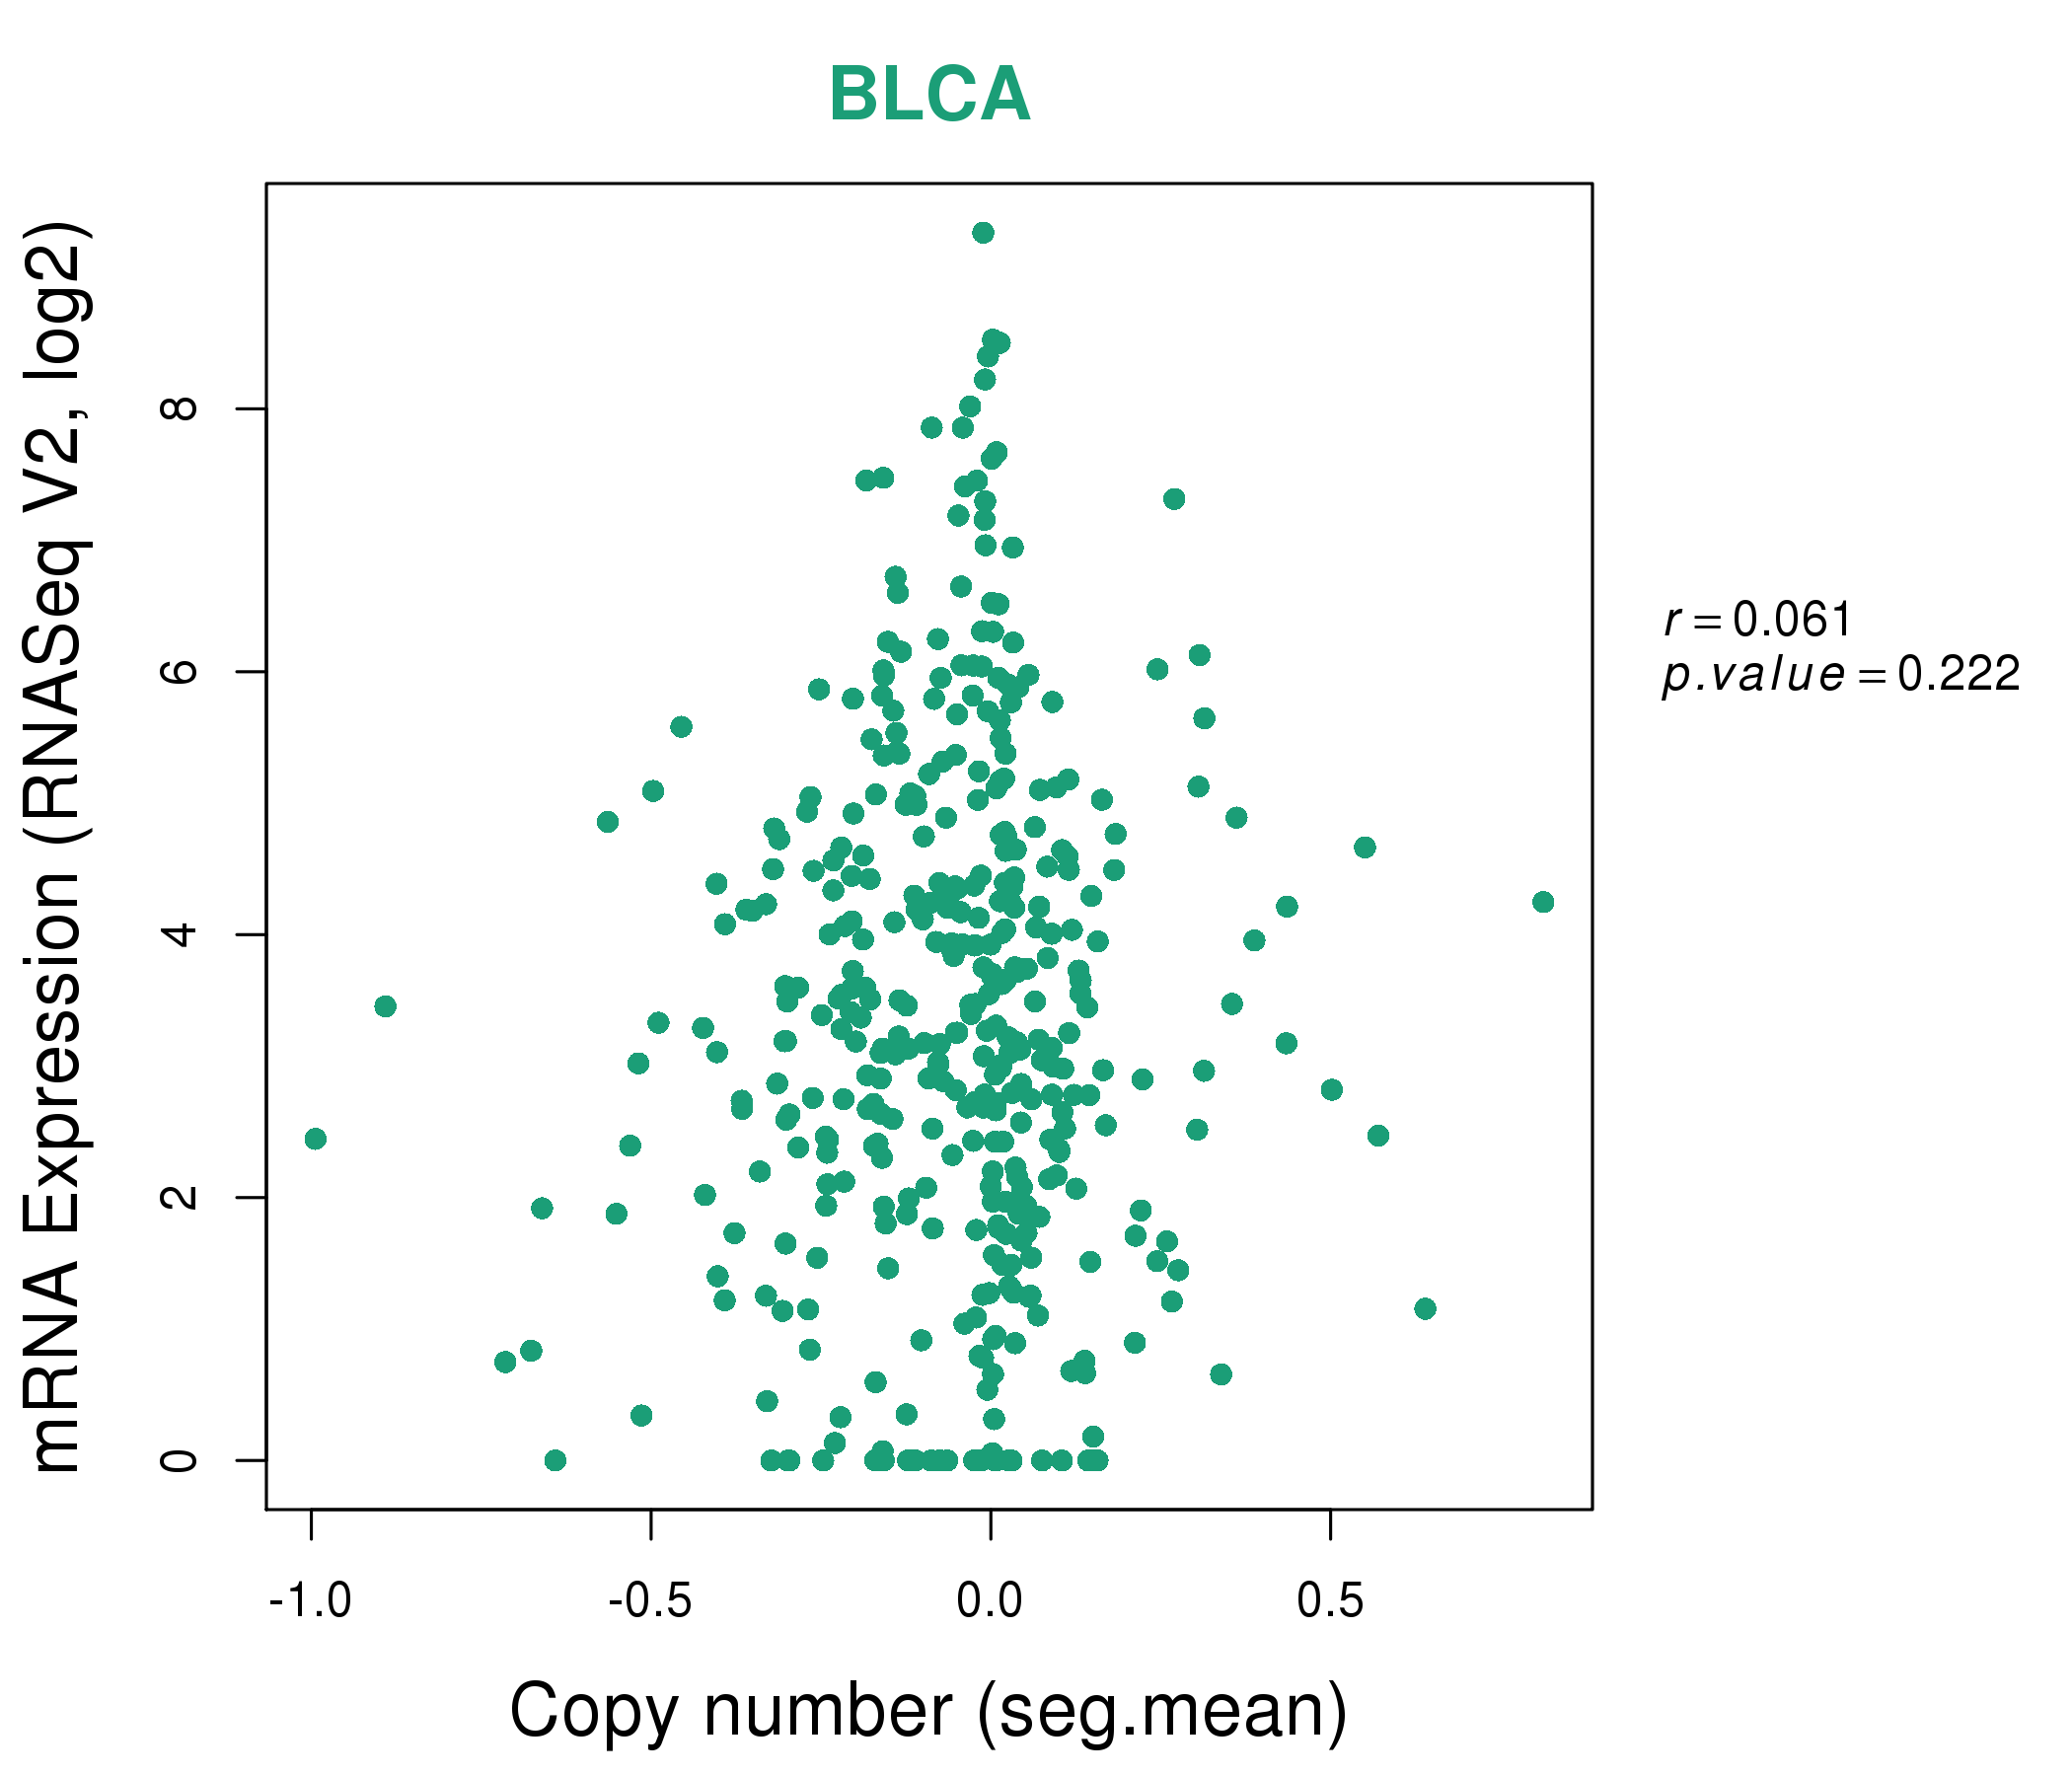
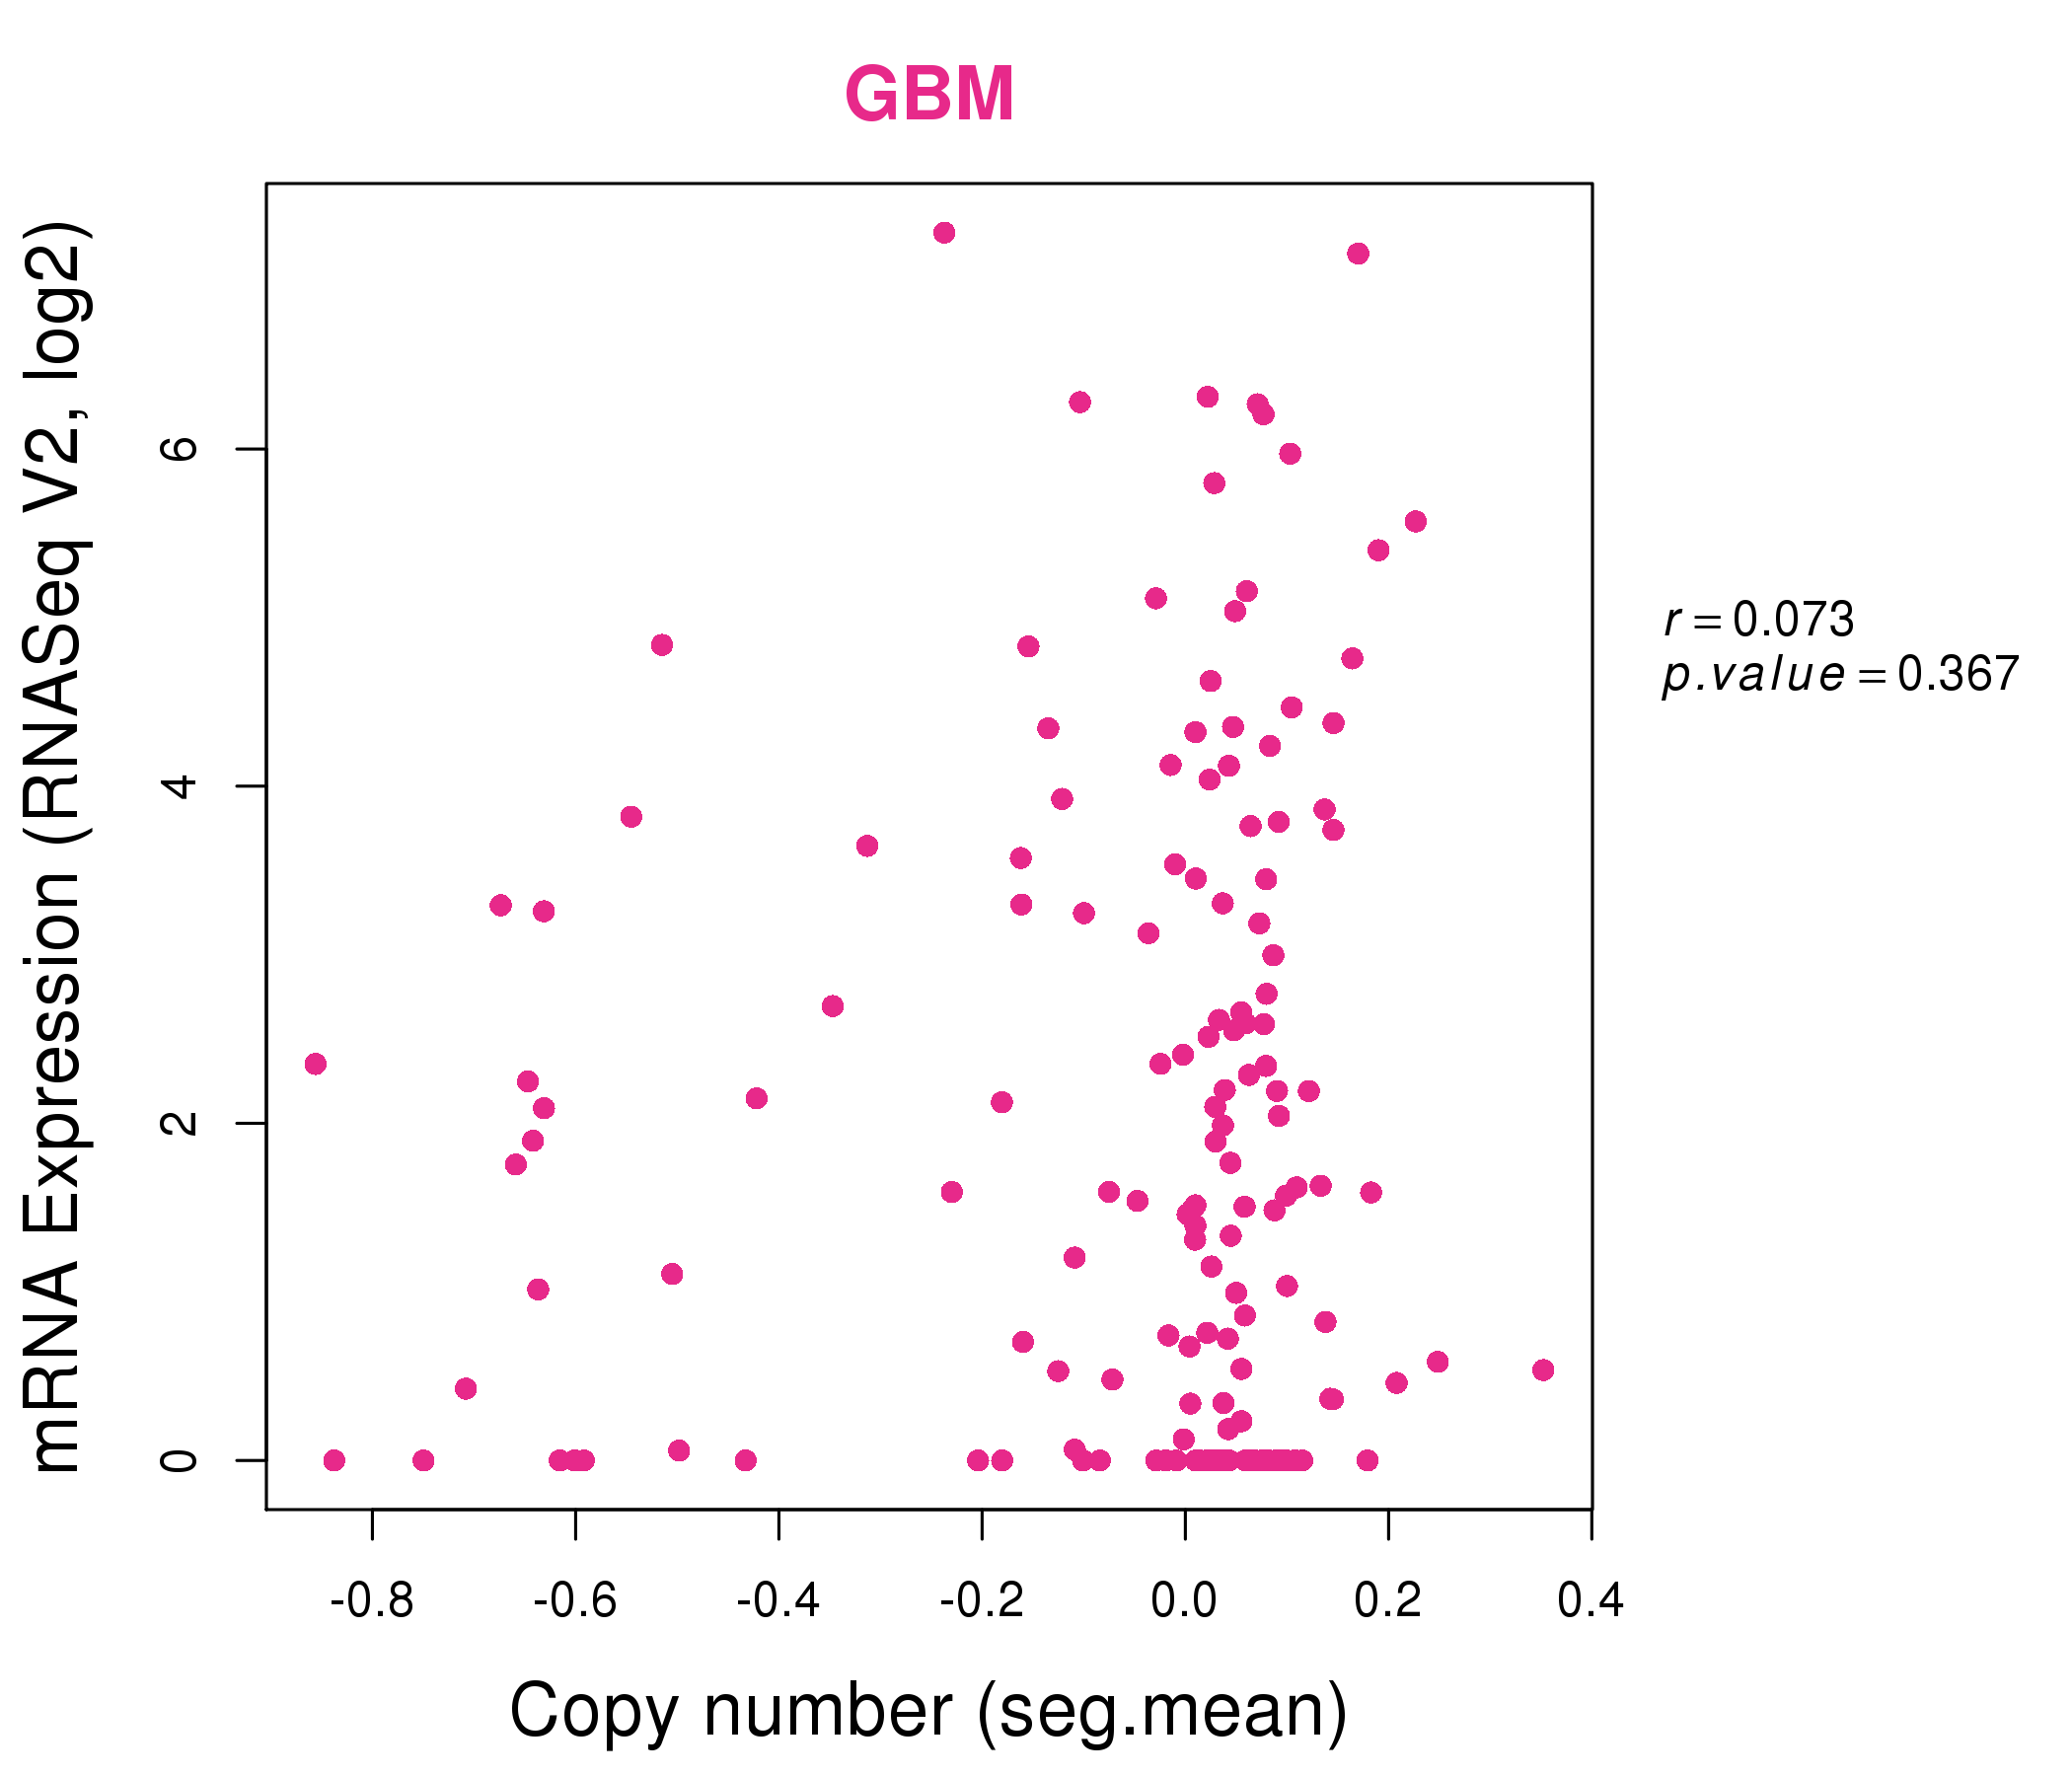
| * This plots show the correlation between CNV and gene expression. |
: Open all plots for all cancer types
 |
|
 |
|

| Top |
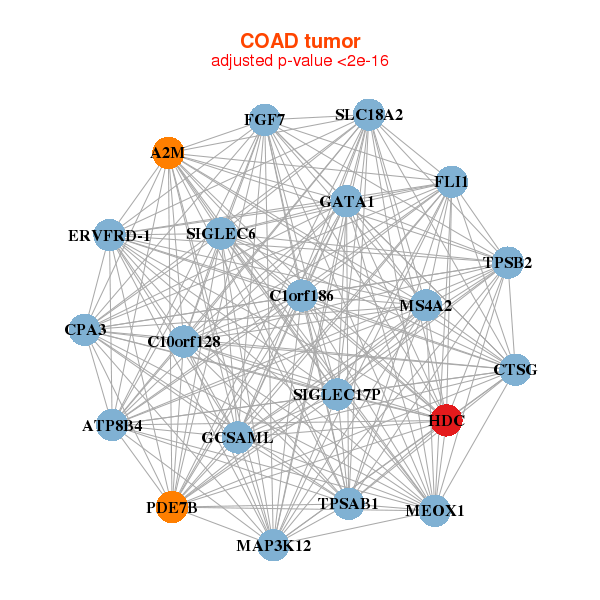
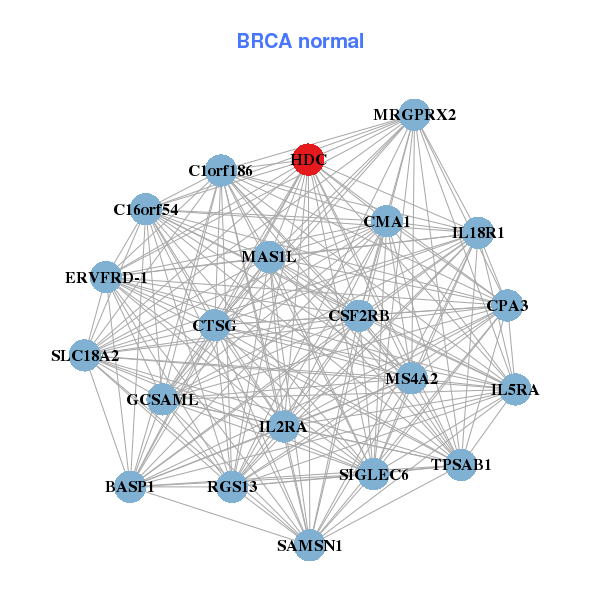
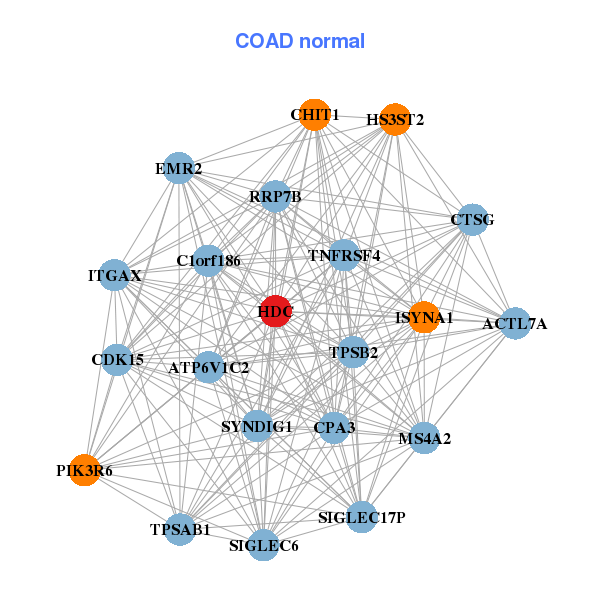
| Gene-Gene Network Information |
| * Co-Expression network figures were drawn using R package igraph. Only the top 20 genes with the highest correlations were shown. Red circle: input gene, orange circle: cell metabolism gene, sky circle: other gene |
: Open all plots for all cancer types
 |
| ||||
| AKR7A2P1,APLP1,C9orf135,CADPS,CRYGC,DKFZP434H168,FAM107B, FGF12,FLJ46111,GRIA1,GRIN1,HAO2,HDC,KIRREL3, NDP,SFXN1,SLC18A2,TAGLN3,TMEM196,TPH2,TWISTNB | BASP1,C16orf54,GCSAML,C1orf186,CMA1,CPA3,CSF2RB, CTSG,ERVFRD-1,HDC,IL18R1,IL2RA,IL5RA,MAS1L, MRGPRX2,MS4A2,RGS13,SAMSN1,SIGLEC6,SLC18A2,TPSAB1 | ||||
 |
| ||||
| A2M,ATP8B4,C10orf128,GCSAML,C1orf186,CPA3,CTSG, ERVFRD-1,FGF7,FLI1,GATA1,HDC,MAP3K12,MEOX1, MS4A2,PDE7B,SIGLEC6,SIGLEC17P,SLC18A2,TPSAB1,TPSB2 | ACTL7A,ATP6V1C2,C1orf186,CDK15,CHIT1,CPA3,CTSG, EMR2,HDC,HS3ST2,ISYNA1,ITGAX,MS4A2,PIK3R6, RRP7B,SIGLEC6,SIGLEC17P,SYNDIG1,TNFRSF4,TPSAB1,TPSB2 |
| * Co-Expression network figures were drawn using R package igraph. Only the top 20 genes with the highest correlations were shown. Red circle: input gene, orange circle: cell metabolism gene, sky circle: other gene |
: Open all plots for all cancer types
| Top |
: Open all interacting genes' information including KEGG pathway for all interacting genes from DAVID
| Top |
| Pharmacological Information for HDC |
| DB Category | DB Name | DB's ID and Url link |
| * Gene Centered Interaction Network. |
 |
| * Drug Centered Interaction Network. |
| DrugBank ID | Target Name | Drug Groups | Generic Name | Drug Centered Network | Drug Structure |
| DB00114 | histidine decarboxylase | nutraceutical | Pyridoxal Phosphate |  |  |
| DB00117 | histidine decarboxylase | approved; nutraceutical | L-Histidine | 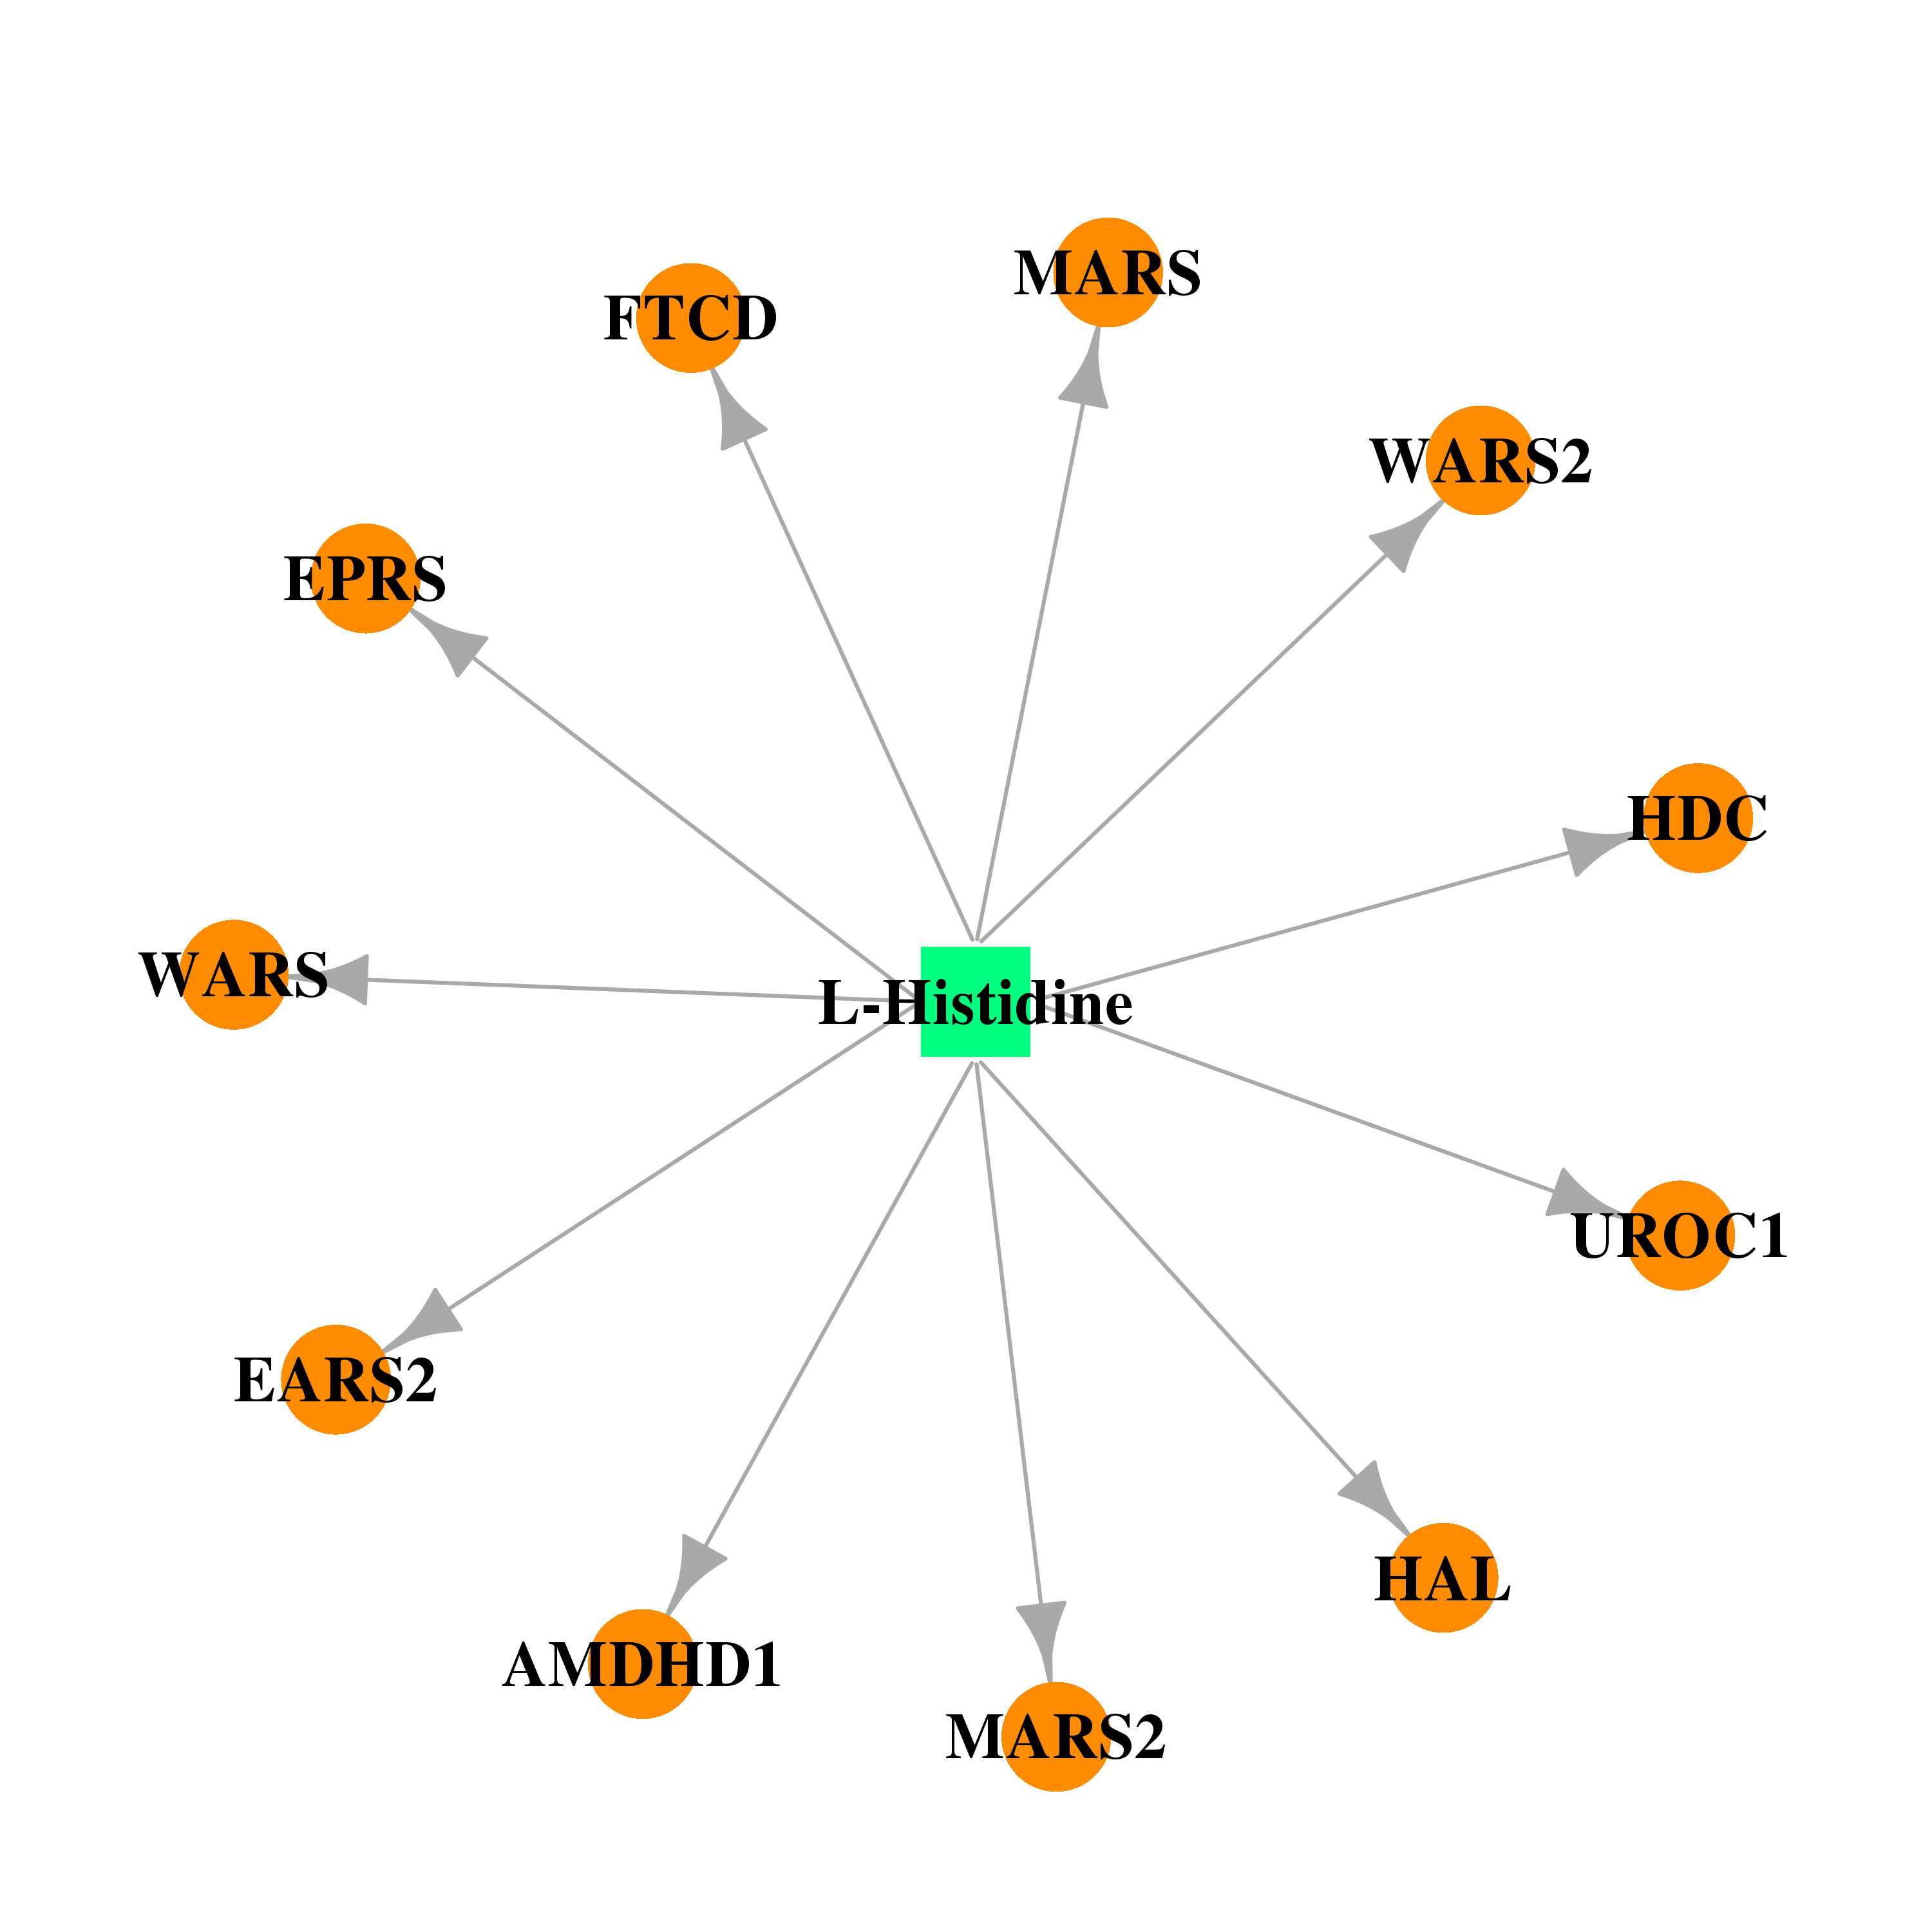 |  |
| DB00667 | histidine decarboxylase | approved | Histamine Phosphate | 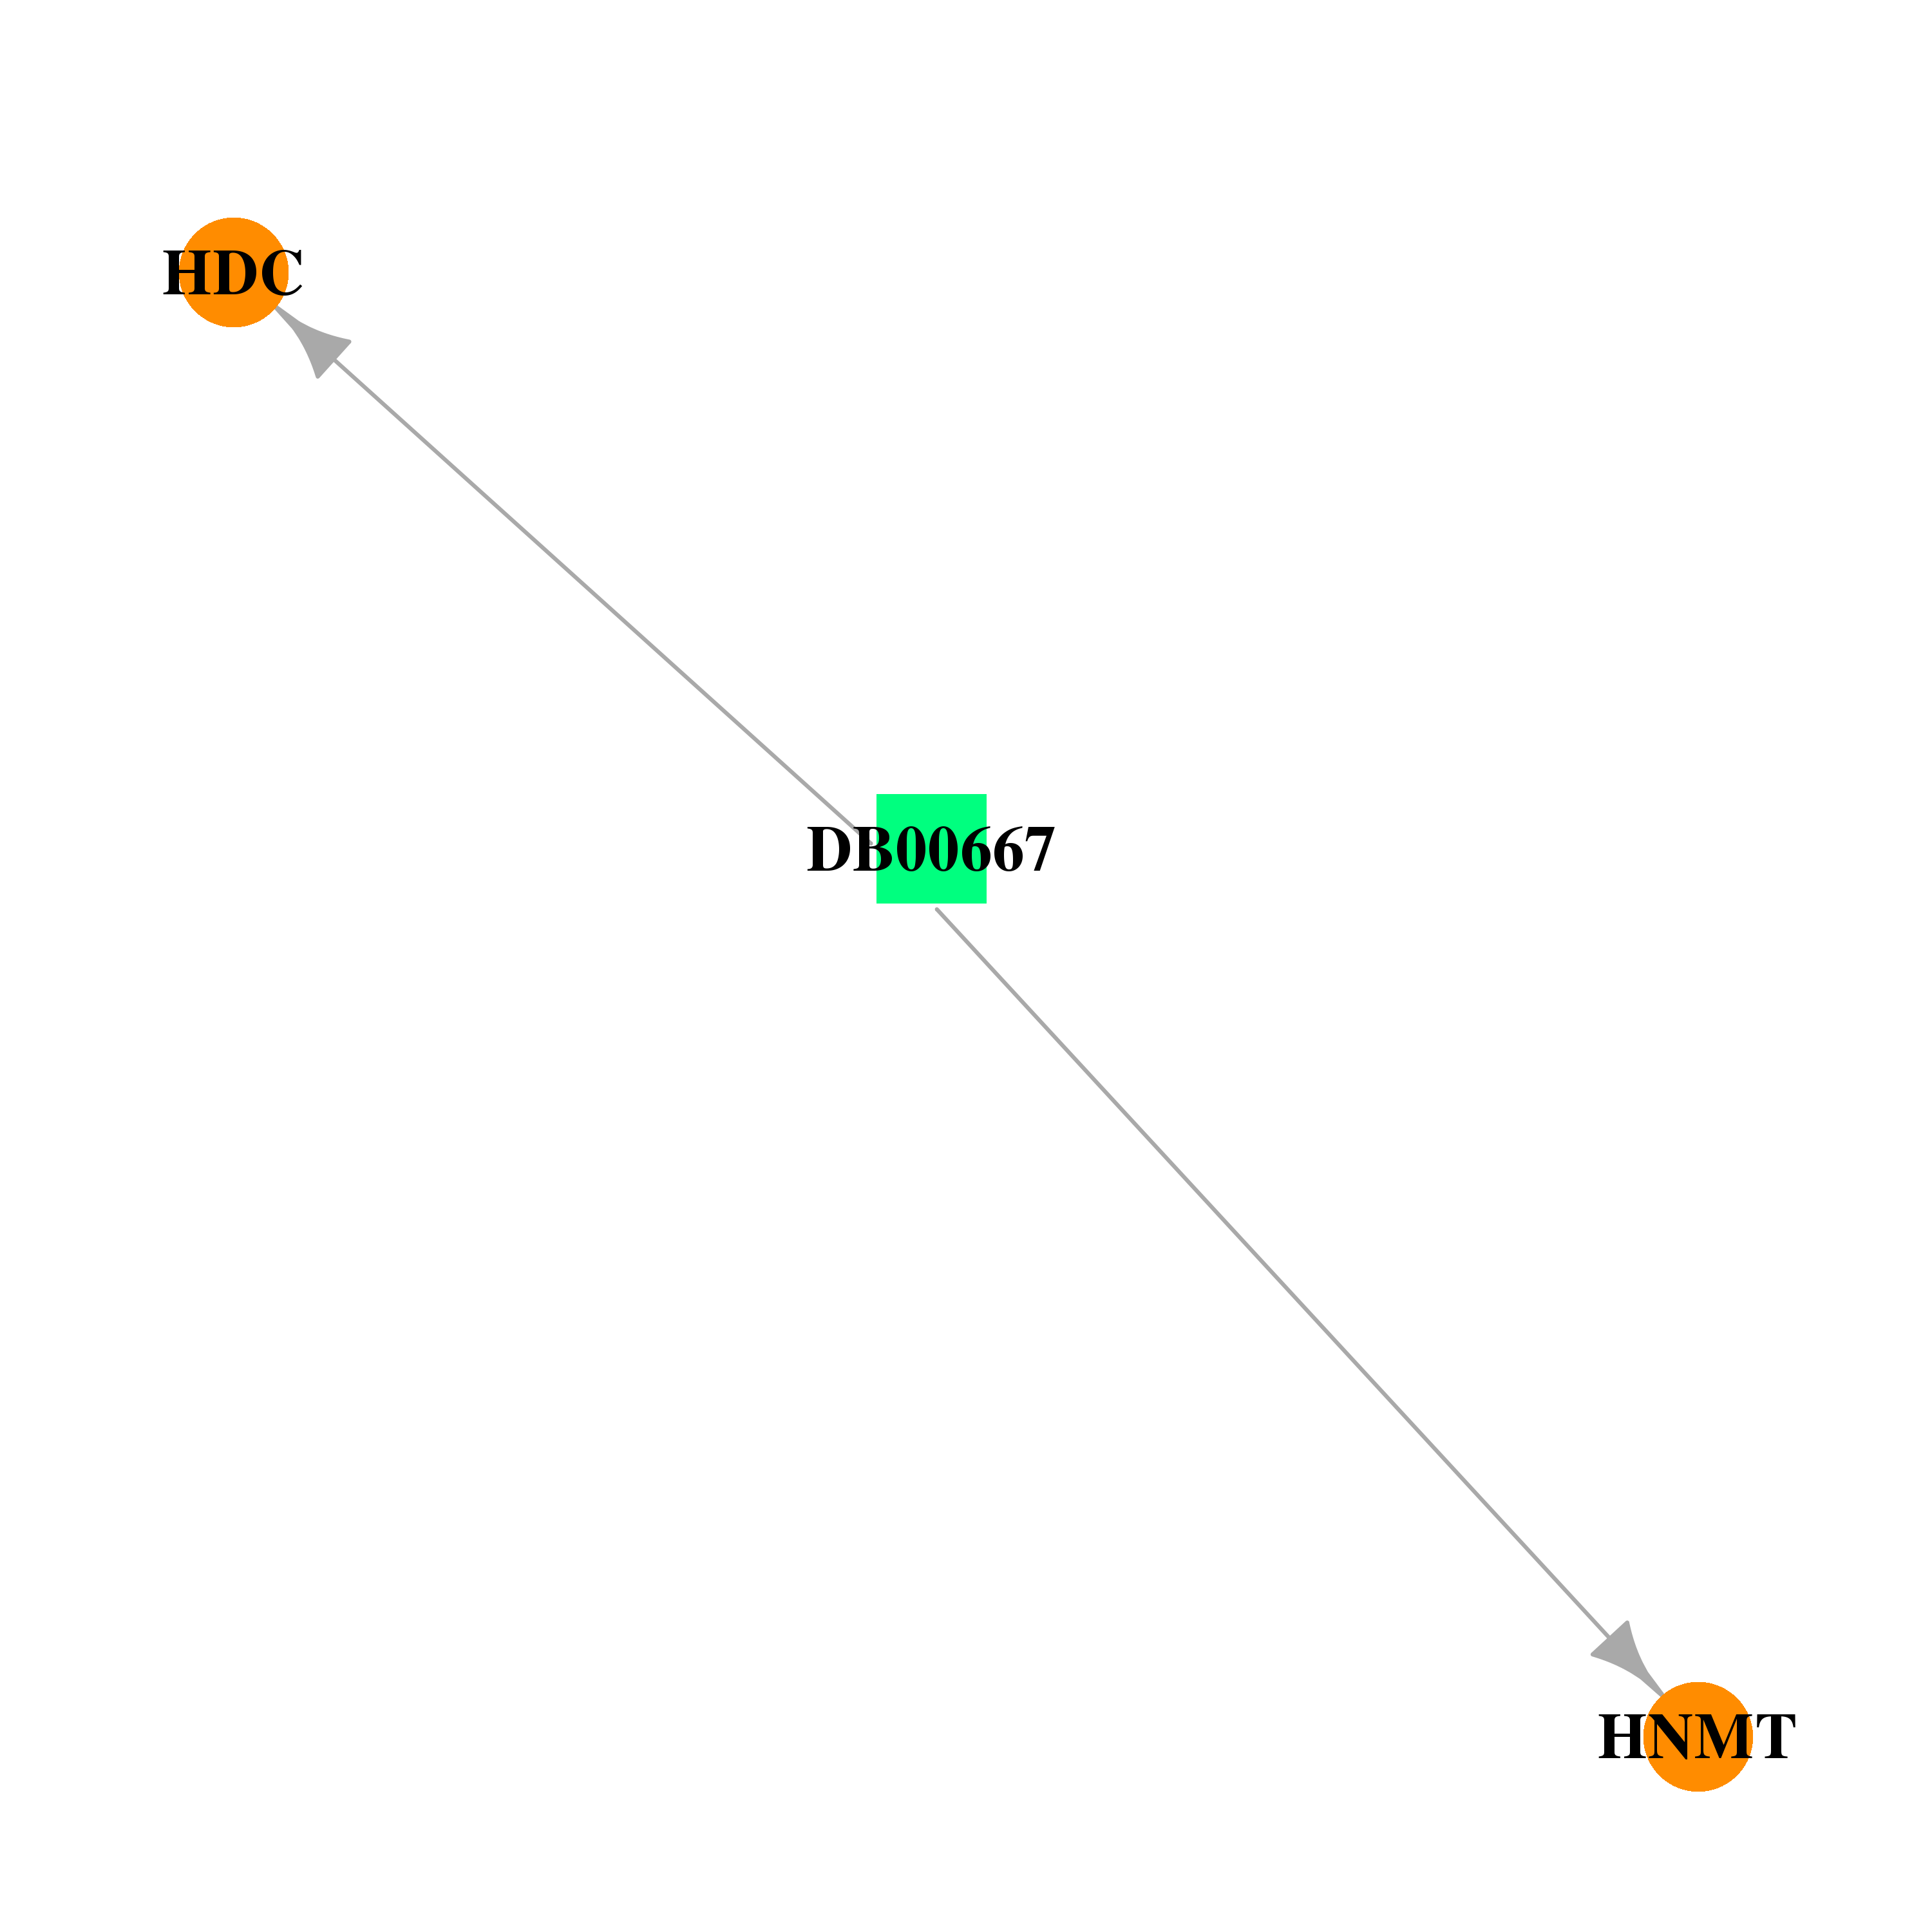 |  |
| Top |
| Cross referenced IDs for HDC |
| * We obtained these cross-references from Uniprot database. It covers 150 different DBs, 18 categories. http://www.uniprot.org/help/cross_references_section |
: Open all cross reference information
|
Copyright © 2016-Present - The Univsersity of Texas Health Science Center at Houston @ |