|
||||||||||||||||||||
| |
| Phenotypic Information (metabolism pathway, cancer, disease, phenome) |
| |
| |
| Gene-Gene Network Information: Co-Expression Network, Interacting Genes & KEGG |
| |
|


| Gene Summary for NT5C |
| Basic gene info. | Gene symbol | NT5C |
| Gene name | 5', 3'-nucleotidase, cytosolic | |
| Synonyms | DNT|DNT1|HEL74|P5N2|PN-I|PN-II|UMPH2|cdN|dNT-1 | |
| Cytomap | UCSC genome browser: 17q25.1 | |
| Genomic location | chr17 :73126319-73127890 | |
| Type of gene | protein-coding | |
| RefGenes | NM_001252377.1, NM_014595.2,NR_045513.1, | |
| Ensembl id | ENSG00000125458 | |
| Description | 5' nucleotidase, deoxy (pyrimidine), cytosolic type C5'(3')-deoxyribonucleotidase, cytosolic typecytosolic 5',3'-pyrimidine nucleotidasedeoxy-5'-nucleotidase 1epididymis luminal protein 74uridine 5'-monophosphate phosphohydrolase 2uridine 5-prime mo | |
| Modification date | 20141207 | |
| dbXrefs | MIM : 191720 | |
| HGNC : HGNC | ||
| Ensembl : ENSG00000125458 | ||
| HPRD : 11833 | ||
| Vega : OTTHUMG00000179346 | ||
| Protein | UniProt: go to UniProt's Cross Reference DB Table | |
| Expression | CleanEX: HS_NT5C | |
| BioGPS: 30833 | ||
| Gene Expression Atlas: ENSG00000125458 | ||
| The Human Protein Atlas: ENSG00000125458 | ||
| Pathway | NCI Pathway Interaction Database: NT5C | |
| KEGG: NT5C | ||
| REACTOME: NT5C | ||
| ConsensusPathDB | ||
| Pathway Commons: NT5C | ||
| Metabolism | MetaCyc: NT5C | |
| HUMANCyc: NT5C | ||
| Regulation | Ensembl's Regulation: ENSG00000125458 | |
| miRBase: chr17 :73,126,319-73,127,890 | ||
| TargetScan: NM_001252377 | ||
| cisRED: ENSG00000125458 | ||
| Context | iHOP: NT5C | |
| cancer metabolism search in PubMed: NT5C | ||
| UCL Cancer Institute: NT5C | ||
| Assigned class in ccmGDB | C | |
| Top |
| Phenotypic Information for NT5C(metabolism pathway, cancer, disease, phenome) |
| Cancer | CGAP: NT5C |
| Familial Cancer Database: NT5C | |
| * This gene is included in those cancer gene databases. |
|
|
|
|
|
| . | ||||||||||||||
Oncogene 1 | Significant driver gene in | |||||||||||||||||||
| cf) number; DB name 1 Oncogene; http://nar.oxfordjournals.org/content/35/suppl_1/D721.long, 2 Tumor Suppressor gene; https://bioinfo.uth.edu/TSGene/, 3 Cancer Gene Census; http://www.nature.com/nrc/journal/v4/n3/abs/nrc1299.html, 4 CancerGenes; http://nar.oxfordjournals.org/content/35/suppl_1/D721.long, 5 Network of Cancer Gene; http://ncg.kcl.ac.uk/index.php, 1Therapeutic Vulnerabilities in Cancer; http://cbio.mskcc.org/cancergenomics/statius/ |
| KEGG_PURINE_METABOLISM KEGG_PYRIMIDINE_METABOLISM KEGG_NICOTINATE_AND_NICOTINAMIDE_METABOLISM REACTOME_METABOLISM_OF_NUCLEOTIDES REACTOME_PURINE_METABOLISM REACTOME_PYRIMIDINE_METABOLISM | |
| OMIM | |
| Orphanet | |
| Disease | KEGG Disease: NT5C |
| MedGen: NT5C (Human Medical Genetics with Condition) | |
| ClinVar: NT5C | |
| Phenotype | MGI: NT5C (International Mouse Phenotyping Consortium) |
| PhenomicDB: NT5C | |
| Mutations for NT5C |
| * Under tables are showing count per each tissue to give us broad intuition about tissue specific mutation patterns.You can go to the detailed page for each mutation database's web site. |
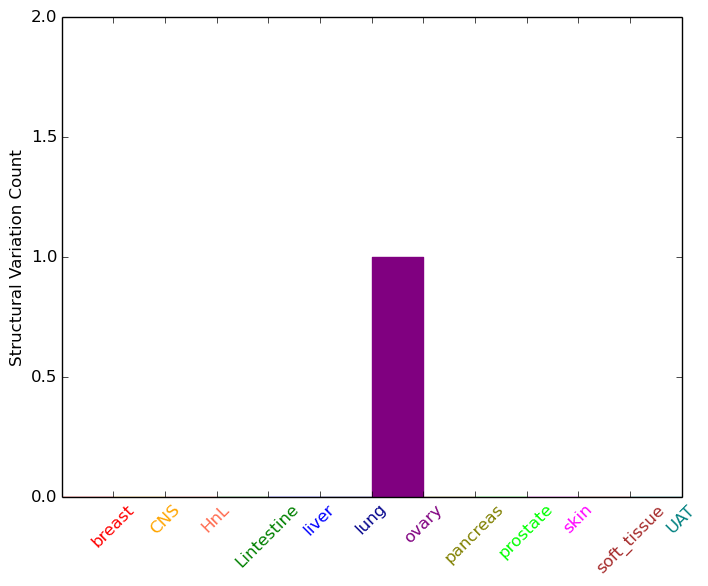
| - Statistics for Tissue and Mutation type | Top |
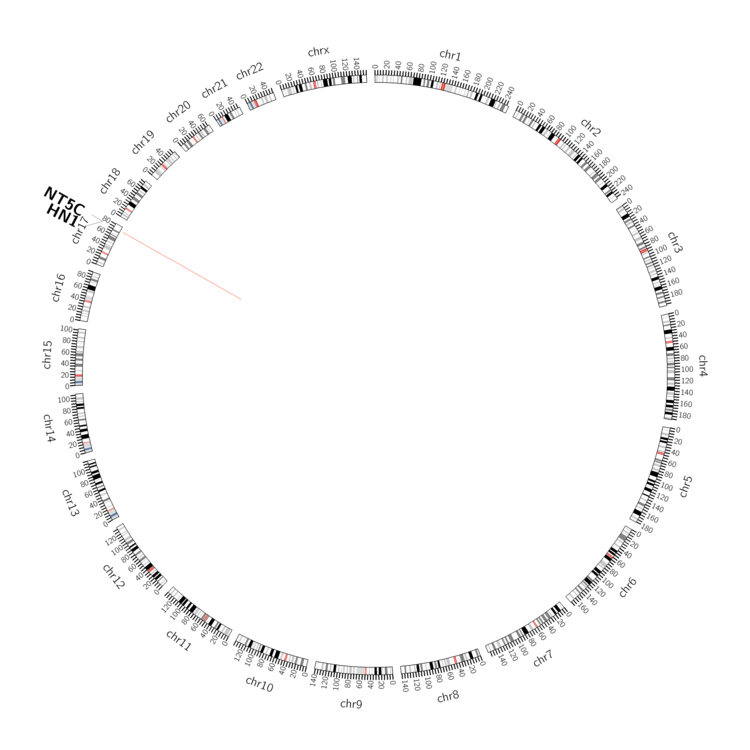 |
| - For Inter-chromosomal Variations |
| There's no inter-chromosomal structural variation. |
| - For Intra-chromosomal Variations |
| * Intra-chromosomal variantions includes 'intrachromosomal amplicon to amplicon', 'intrachromosomal amplicon to non-amplified dna', 'intrachromosomal deletion', 'intrachromosomal fold-back inversion', 'intrachromosomal inversion', 'intrachromosomal tandem duplication', 'Intrachromosomal unknown type', 'intrachromosomal with inverted orientation', 'intrachromosomal with non-inverted orientation'. |
 |
| Sample | Symbol_a | Chr_a | Start_a | End_a | Symbol_b | Chr_b | Start_b | End_b |
| ovary | NT5C | chr17 | 73127112 | 73127132 | HN1 | chr17 | 73135821 | 73135841 |
| cf) Tissue number; Tissue name (1;Breast, 2;Central_nervous_system, 3;Haematopoietic_and_lymphoid_tissue, 4;Large_intestine, 5;Liver, 6;Lung, 7;Ovary, 8;Pancreas, 9;Prostate, 10;Skin, 11;Soft_tissue, 12;Upper_aerodigestive_tract) |
| * From mRNA Sanger sequences, Chitars2.0 arranged chimeric transcripts. This table shows NT5C related fusion information. |
| ID | Head Gene | Tail Gene | Accession | Gene_a | qStart_a | qEnd_a | Chromosome_a | tStart_a | tEnd_a | Gene_a | qStart_a | qEnd_a | Chromosome_a | tStart_a | tEnd_a |
| Top |
| There's no copy number variation information in COSMIC data for this gene. |
| Top |
|
 |
| Top |
| Stat. for Non-Synonymous SNVs (# total SNVs=6) | (# total SNVs=1) |
 |  |
(# total SNVs=0) | (# total SNVs=0) |
| Top |
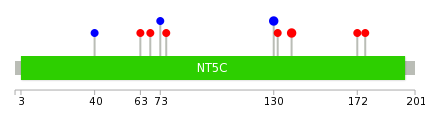
| * When you move the cursor on each content, you can see more deailed mutation information on the Tooltip. Those are primary_site,primary_histology,mutation(aa),pubmedID. |
| GRCh37 position | Mutation(aa) | Unique sampleID count |
| chr17:73126884-73126884 | p.G139W | 2 |
| chr17:73126909-73126909 | p.L130L | 2 |
| chr17:73126663-73126663 | p.T176A | 1 |
| chr17:73126675-73126675 | p.V172F | 1 |
| chr17:73126904-73126904 | p.R132M | 1 |
| chr17:73127325-73127325 | p.P76S | 1 |
| chr17:73127332-73127332 | p.D73D | 1 |
| chr17:73127348-73127348 | p.P68R | 1 |
| chr17:73127364-73127364 | p.S63R | 1 |
| chr17:73127683-73127683 | p.Q40Q | 1 |
| Top |
|
 |
| Point Mutation/ Tissue ID | 1 | 2 | 3 | 4 | 5 | 6 | 7 | 8 | 9 | 10 | 11 | 12 | 13 | 14 | 15 | 16 | 17 | 18 | 19 | 20 |
| # sample | 1 | 1 | 1 | 1 | ||||||||||||||||
| # mutation | 1 | 1 | 1 | 1 | ||||||||||||||||
| nonsynonymous SNV | 1 | 1 | 1 | |||||||||||||||||
| synonymous SNV | 1 |
| cf) Tissue ID; Tissue type (1; BLCA[Bladder Urothelial Carcinoma], 2; BRCA[Breast invasive carcinoma], 3; CESC[Cervical squamous cell carcinoma and endocervical adenocarcinoma], 4; COAD[Colon adenocarcinoma], 5; GBM[Glioblastoma multiforme], 6; Glioma Low Grade, 7; HNSC[Head and Neck squamous cell carcinoma], 8; KICH[Kidney Chromophobe], 9; KIRC[Kidney renal clear cell carcinoma], 10; KIRP[Kidney renal papillary cell carcinoma], 11; LAML[Acute Myeloid Leukemia], 12; LUAD[Lung adenocarcinoma], 13; LUSC[Lung squamous cell carcinoma], 14; OV[Ovarian serous cystadenocarcinoma ], 15; PAAD[Pancreatic adenocarcinoma], 16; PRAD[Prostate adenocarcinoma], 17; SKCM[Skin Cutaneous Melanoma], 18:STAD[Stomach adenocarcinoma], 19:THCA[Thyroid carcinoma], 20:UCEC[Uterine Corpus Endometrial Carcinoma]) |
| Top |
| * We represented just top 10 SNVs. When you move the cursor on each content, you can see more deailed mutation information on the Tooltip. Those are primary_site, primary_histology, mutation(aa), pubmedID. |
| Genomic Position | Mutation(aa) | Unique sampleID count |
| chr17:73126663 | p.T136A,NT5C | 1 |
| chr17:73126675 | p.V132F,NT5C | 1 |
| chr17:73126698 | p.T124N,NT5C | 1 |
| chr17:73126904 | p.R132M | 1 |
| chr17:73127325 | p.P76S,NT5C | 1 |
| chr17:73127368 | p.V61V,NT5C | 1 |
| * Copy number data were extracted from TCGA using R package TCGA-Assembler. The URLs of all public data files on TCGA DCC data server were gathered on Jan-05-2015. Function ProcessCNAData in TCGA-Assembler package was used to obtain gene-level copy number value which is calculated as the average copy number of the genomic region of a gene. |
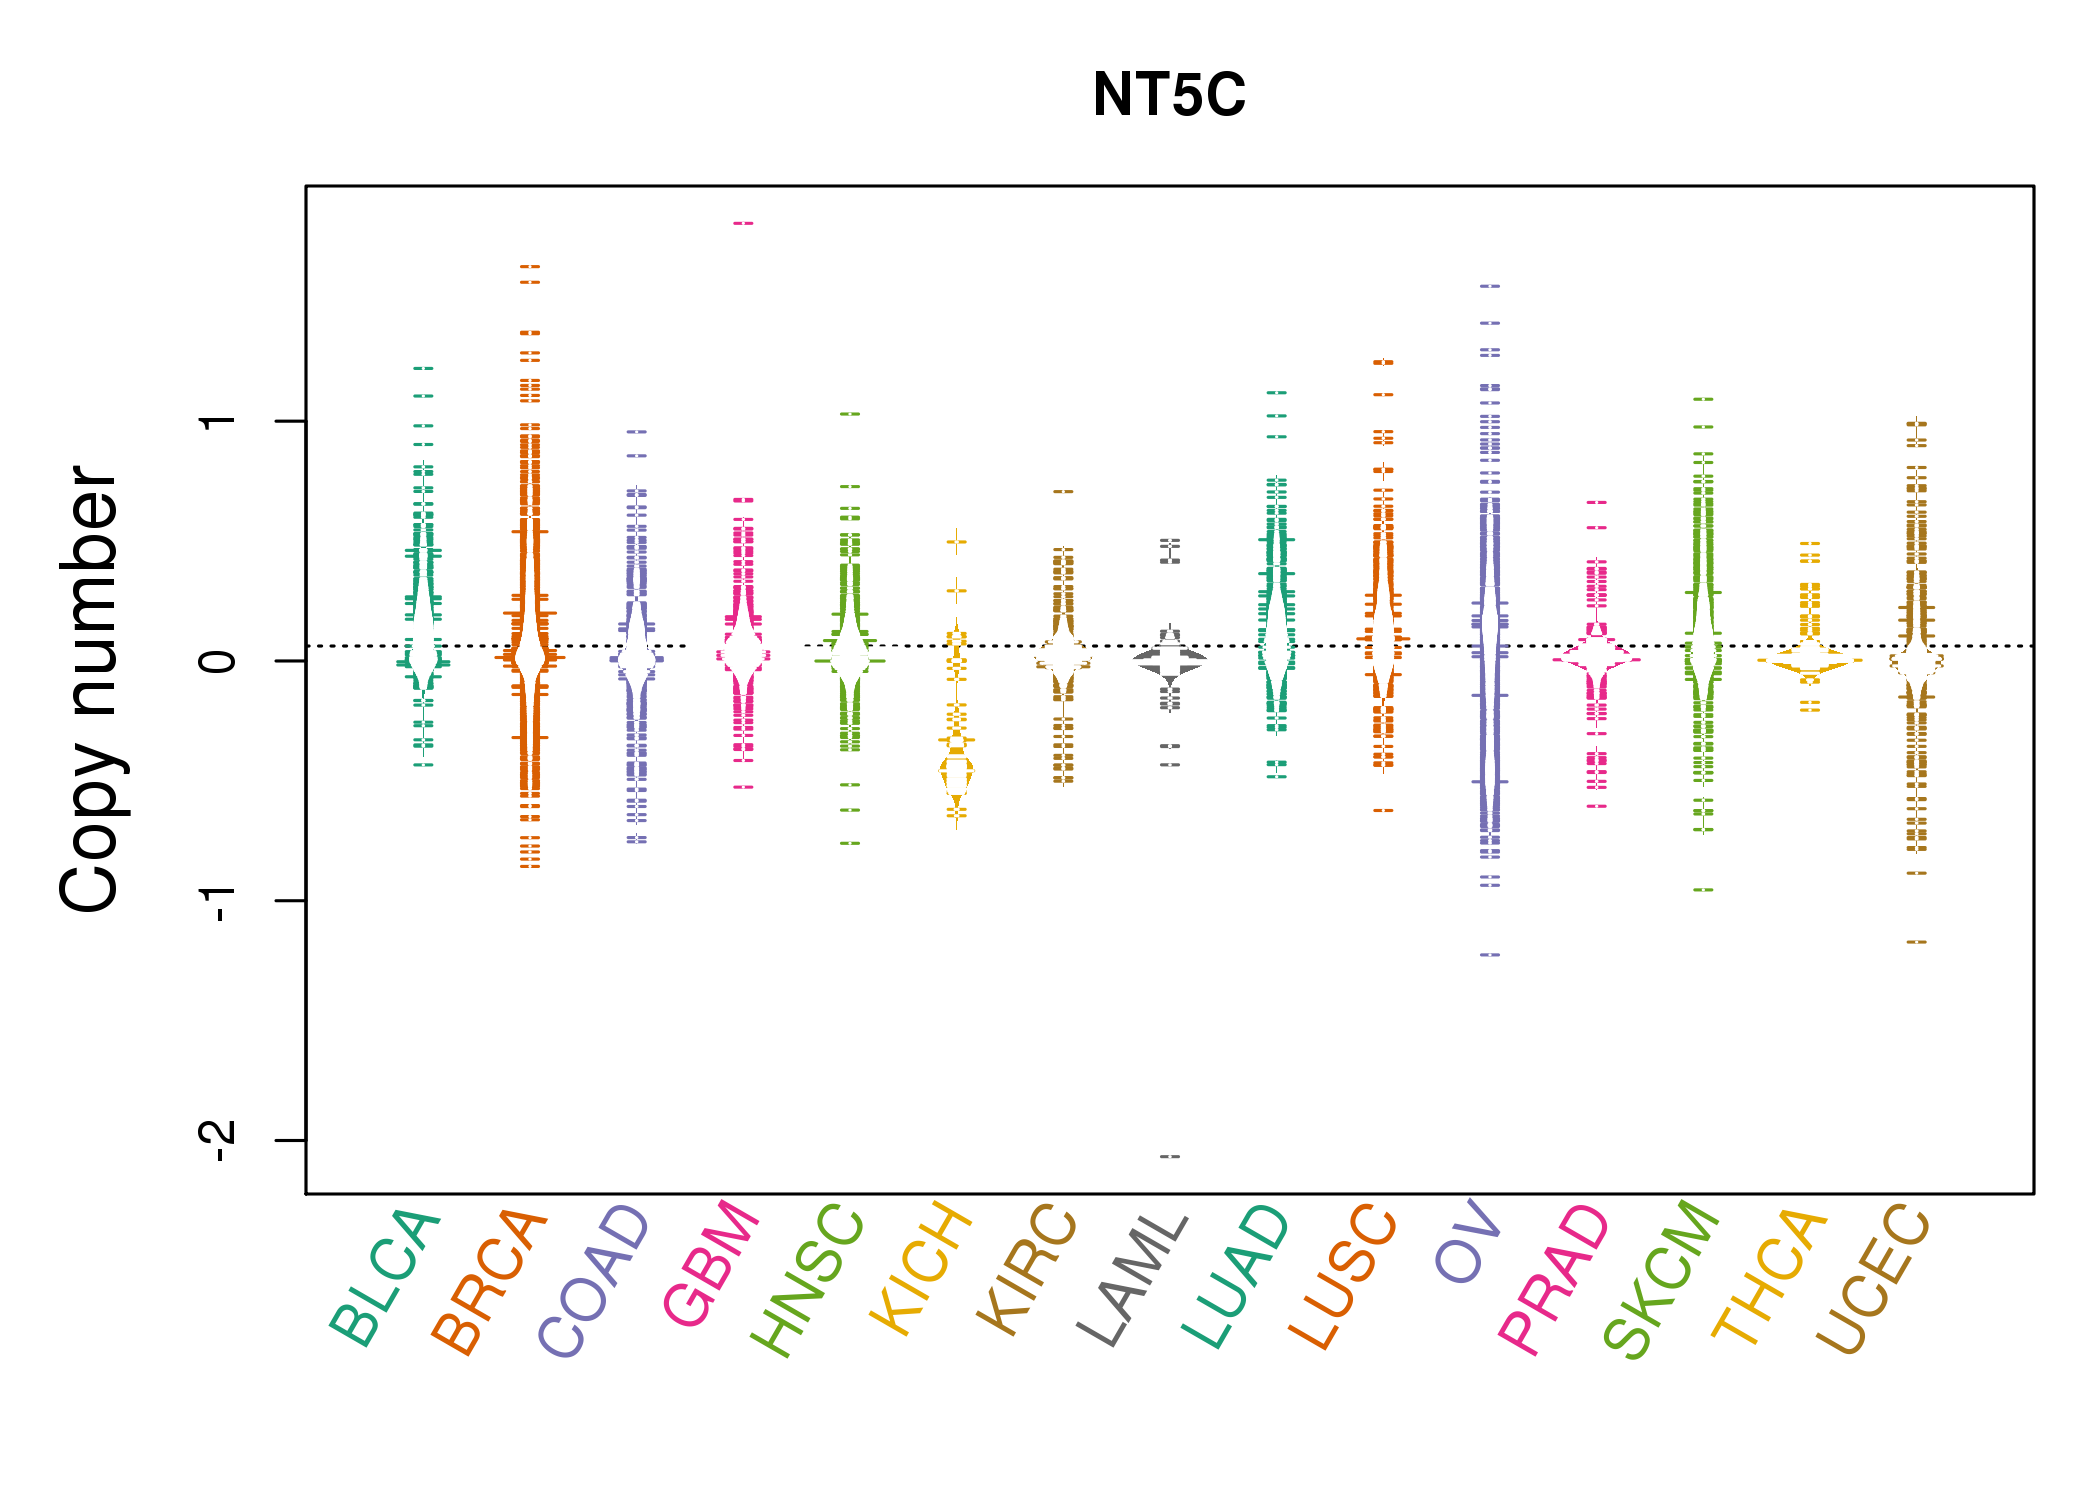 |
| cf) Tissue ID[Tissue type]: BLCA[Bladder Urothelial Carcinoma], BRCA[Breast invasive carcinoma], CESC[Cervical squamous cell carcinoma and endocervical adenocarcinoma], COAD[Colon adenocarcinoma], GBM[Glioblastoma multiforme], Glioma Low Grade, HNSC[Head and Neck squamous cell carcinoma], KICH[Kidney Chromophobe], KIRC[Kidney renal clear cell carcinoma], KIRP[Kidney renal papillary cell carcinoma], LAML[Acute Myeloid Leukemia], LUAD[Lung adenocarcinoma], LUSC[Lung squamous cell carcinoma], OV[Ovarian serous cystadenocarcinoma ], PAAD[Pancreatic adenocarcinoma], PRAD[Prostate adenocarcinoma], SKCM[Skin Cutaneous Melanoma], STAD[Stomach adenocarcinoma], THCA[Thyroid carcinoma], UCEC[Uterine Corpus Endometrial Carcinoma] |
| Top |
| Gene Expression for NT5C |
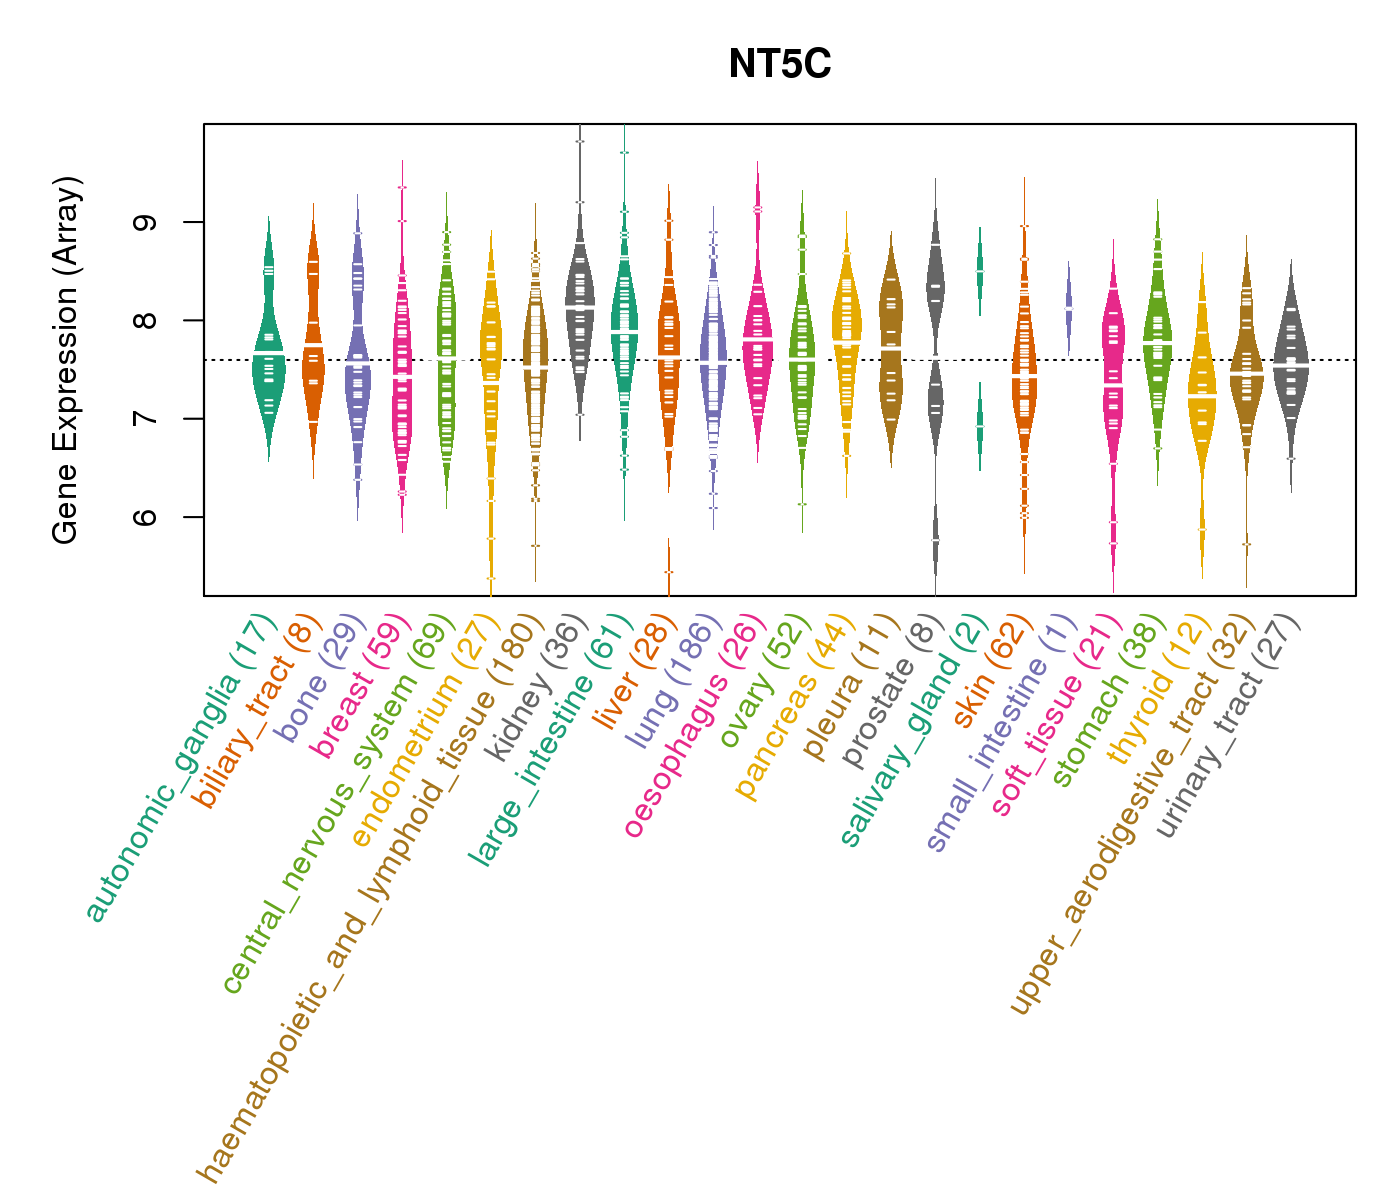
| * CCLE gene expression data were extracted from CCLE_Expression_Entrez_2012-10-18.res: Gene-centric RMA-normalized mRNA expression data. |
 |
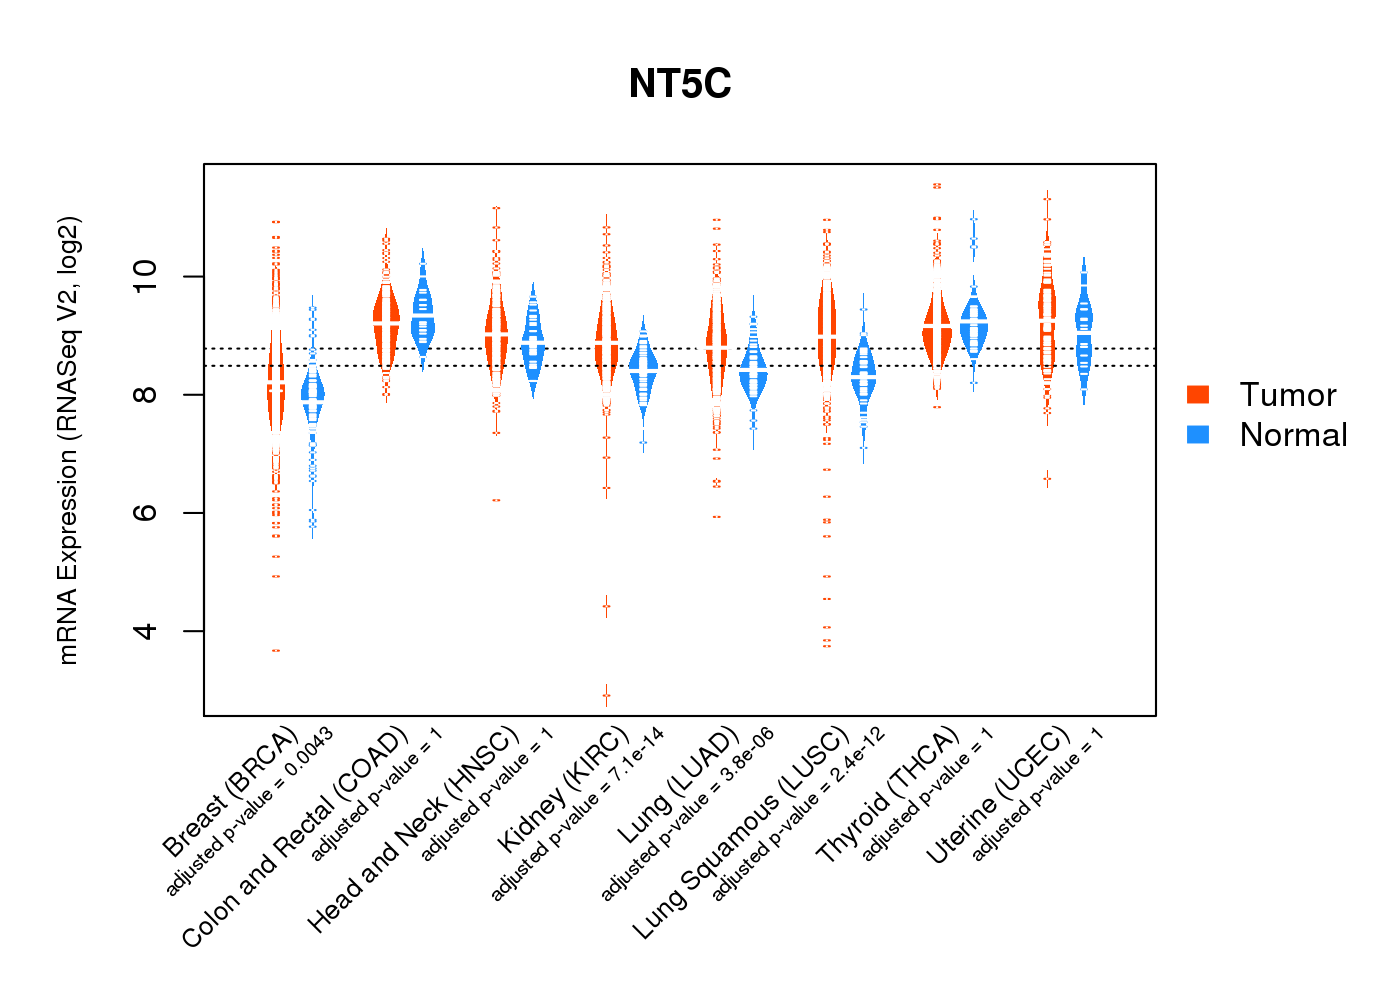
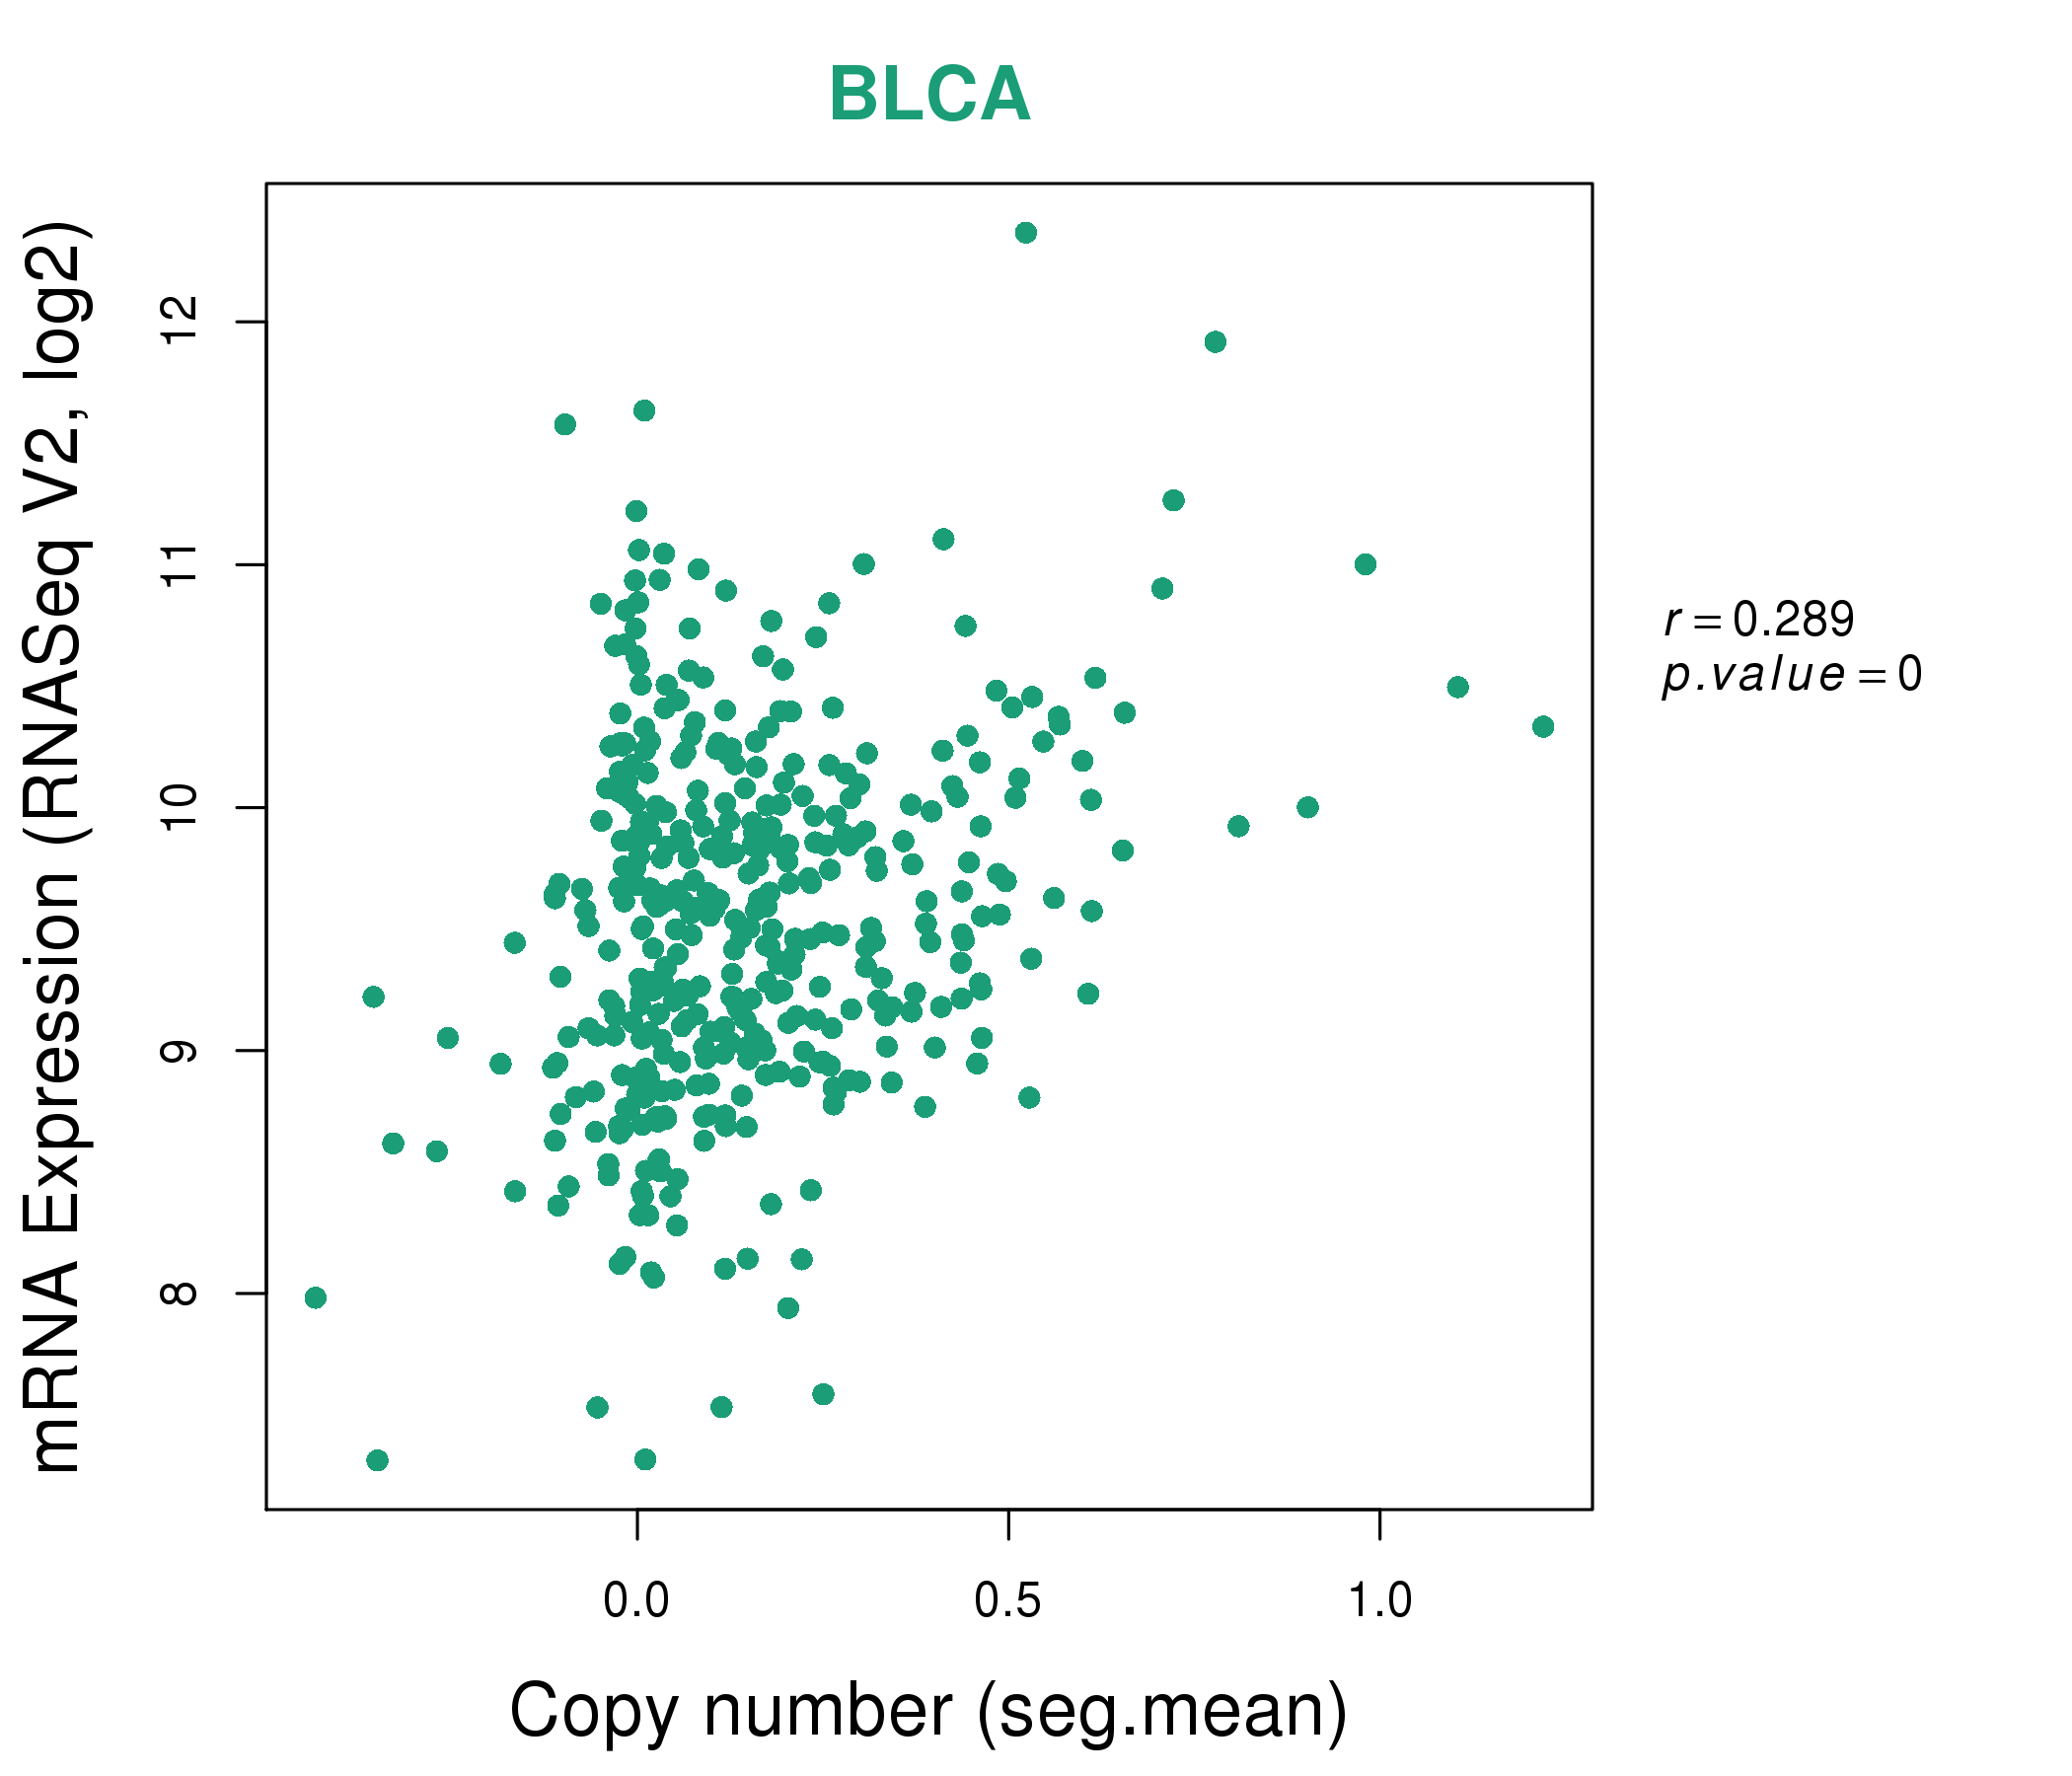
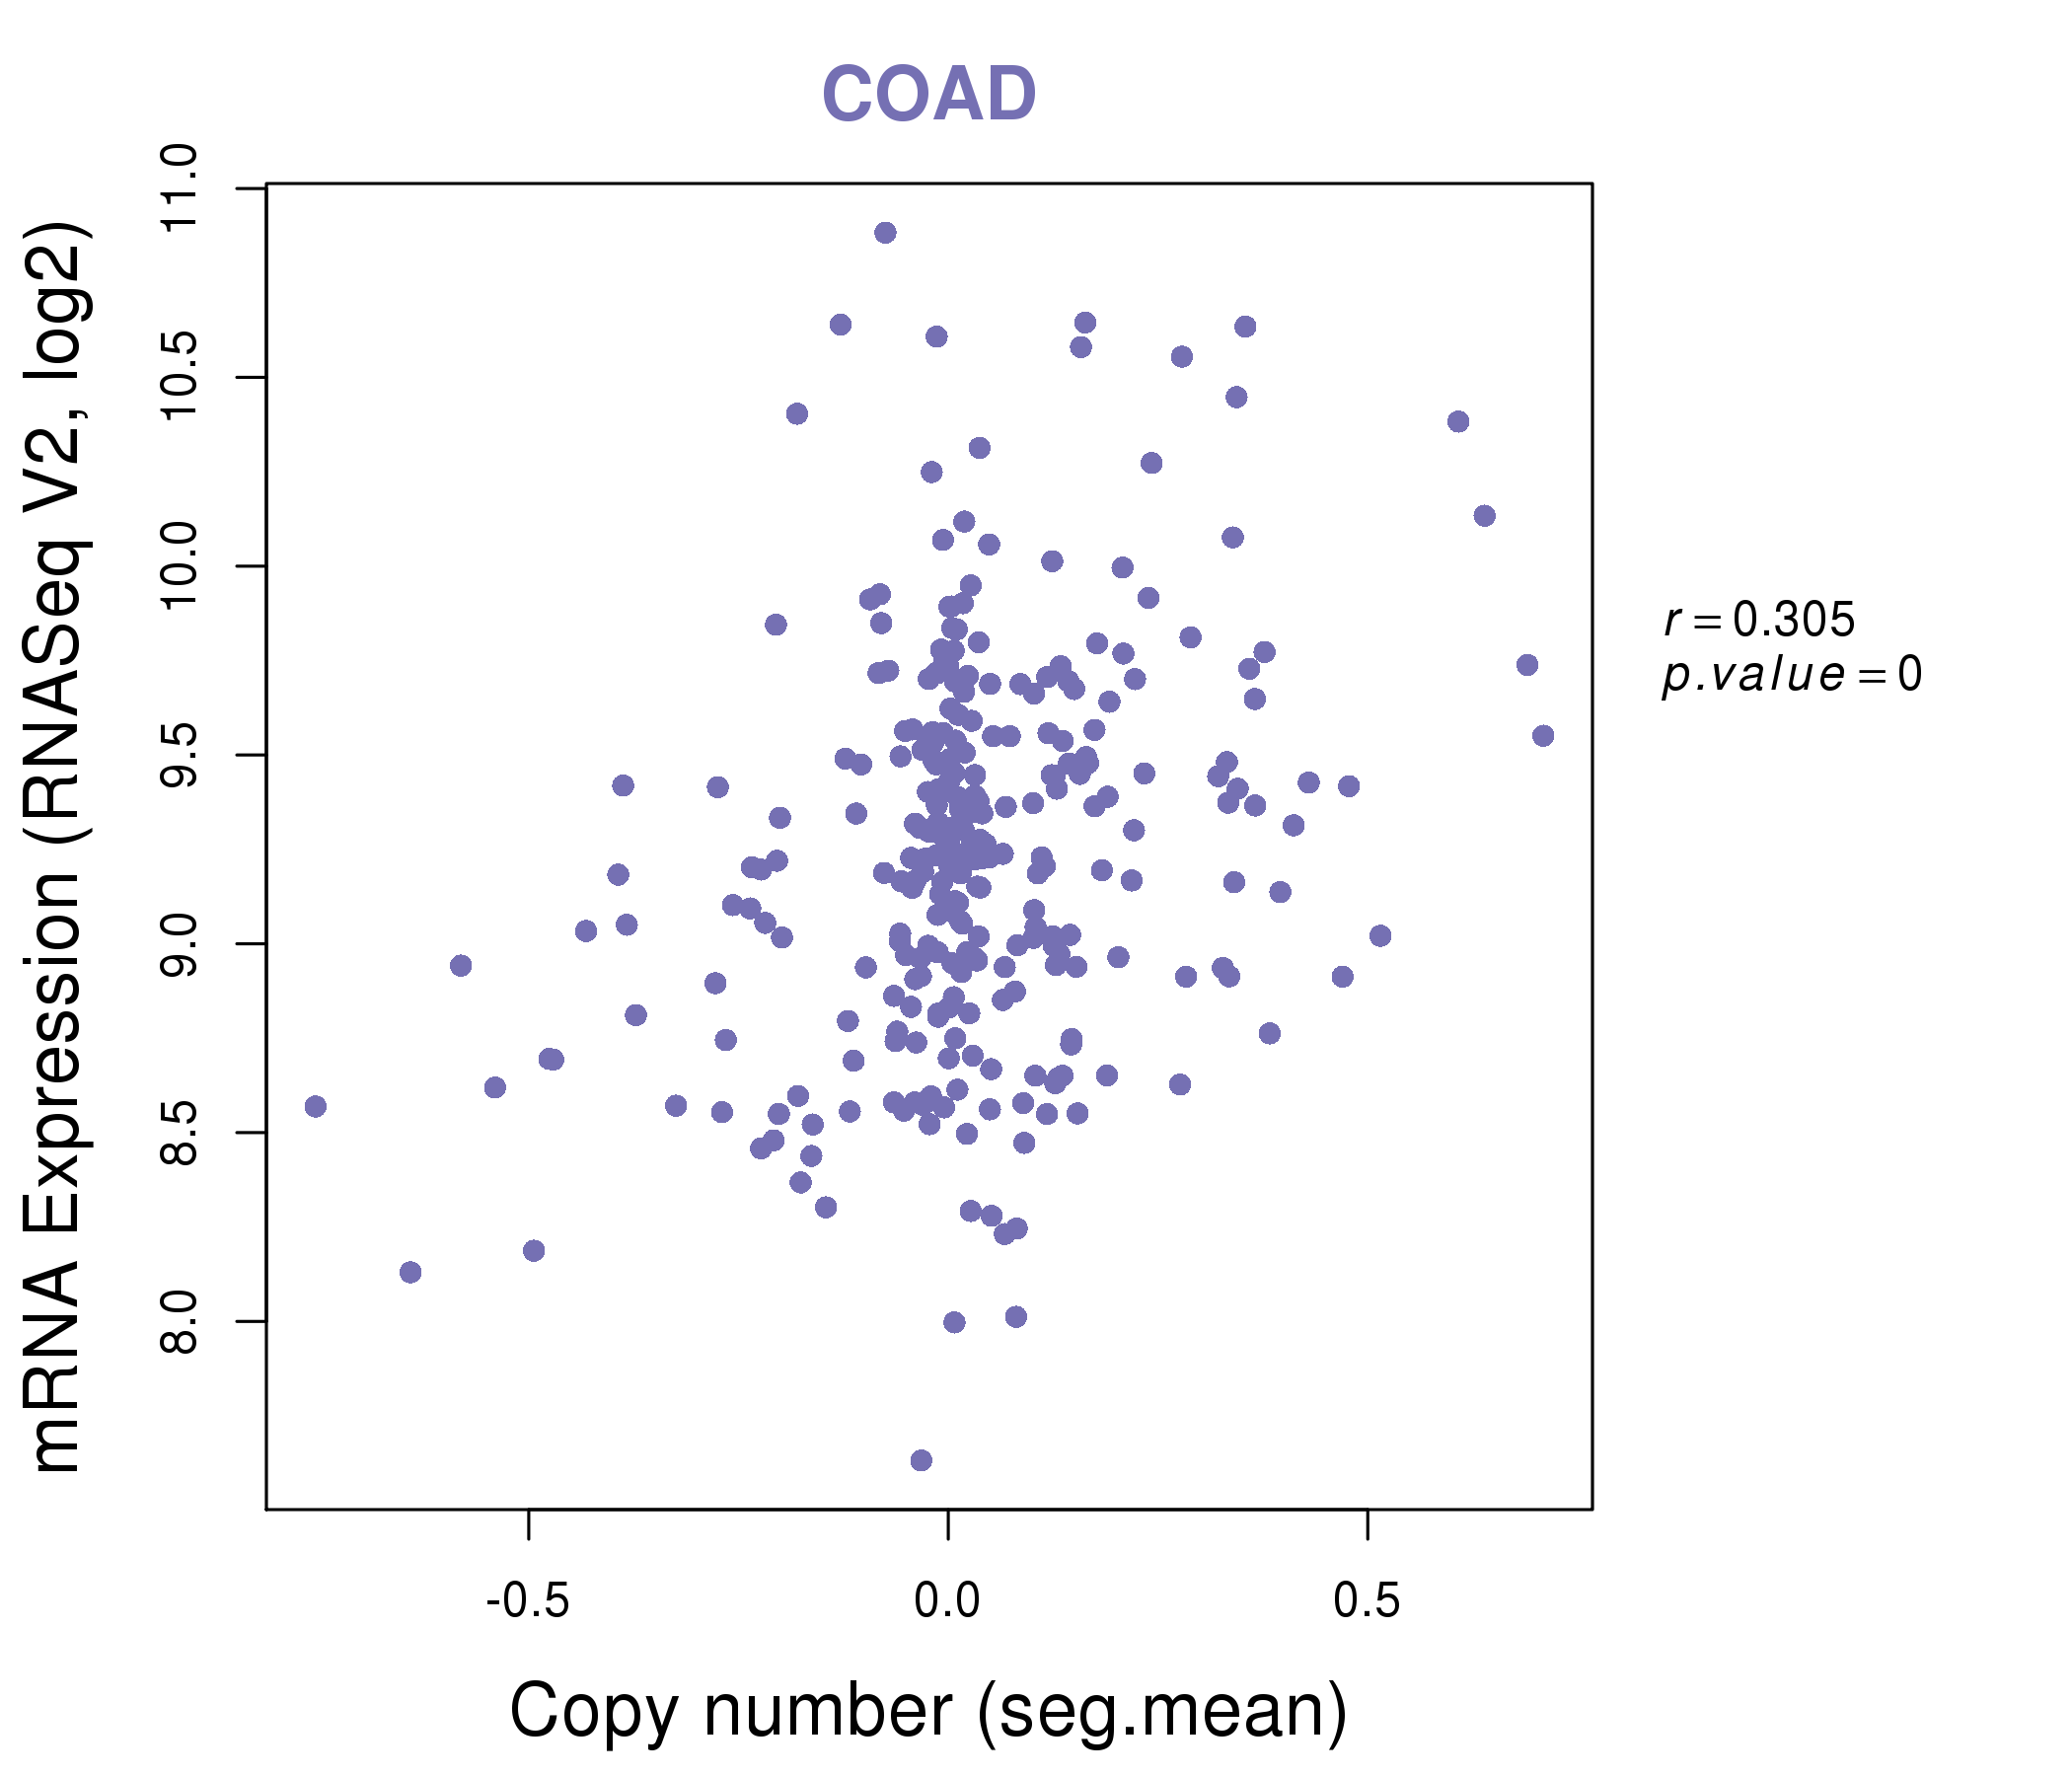
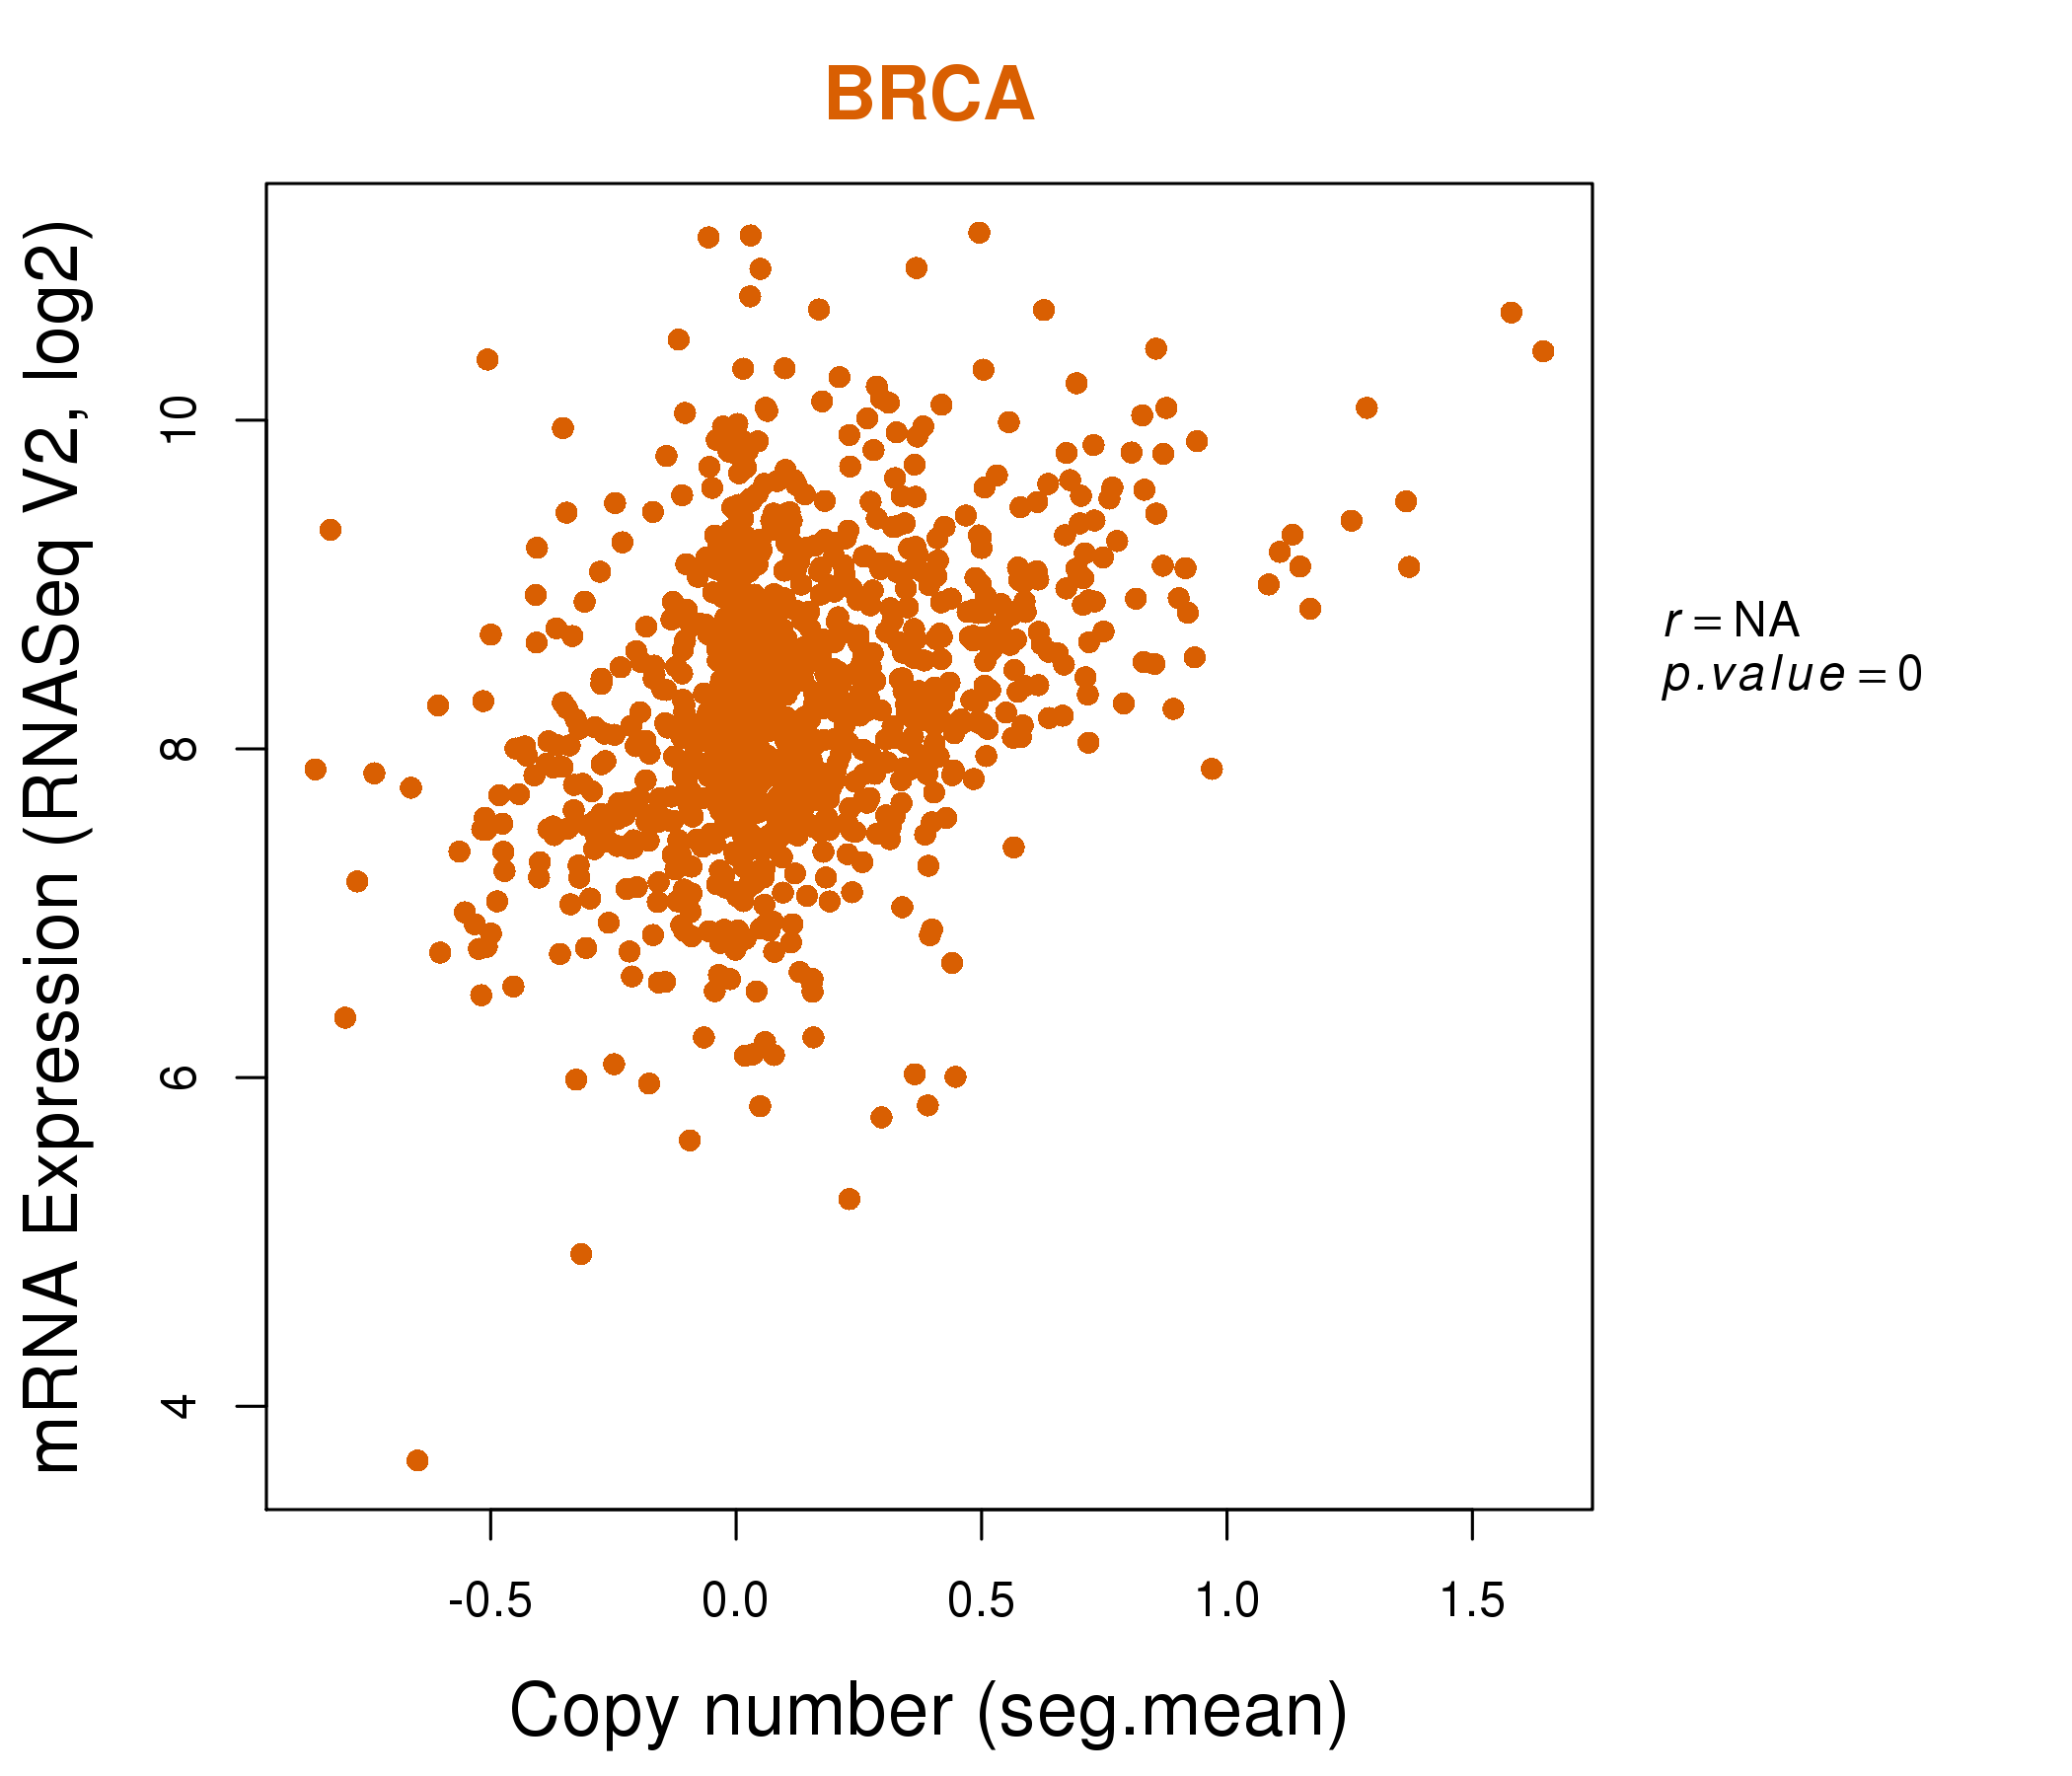
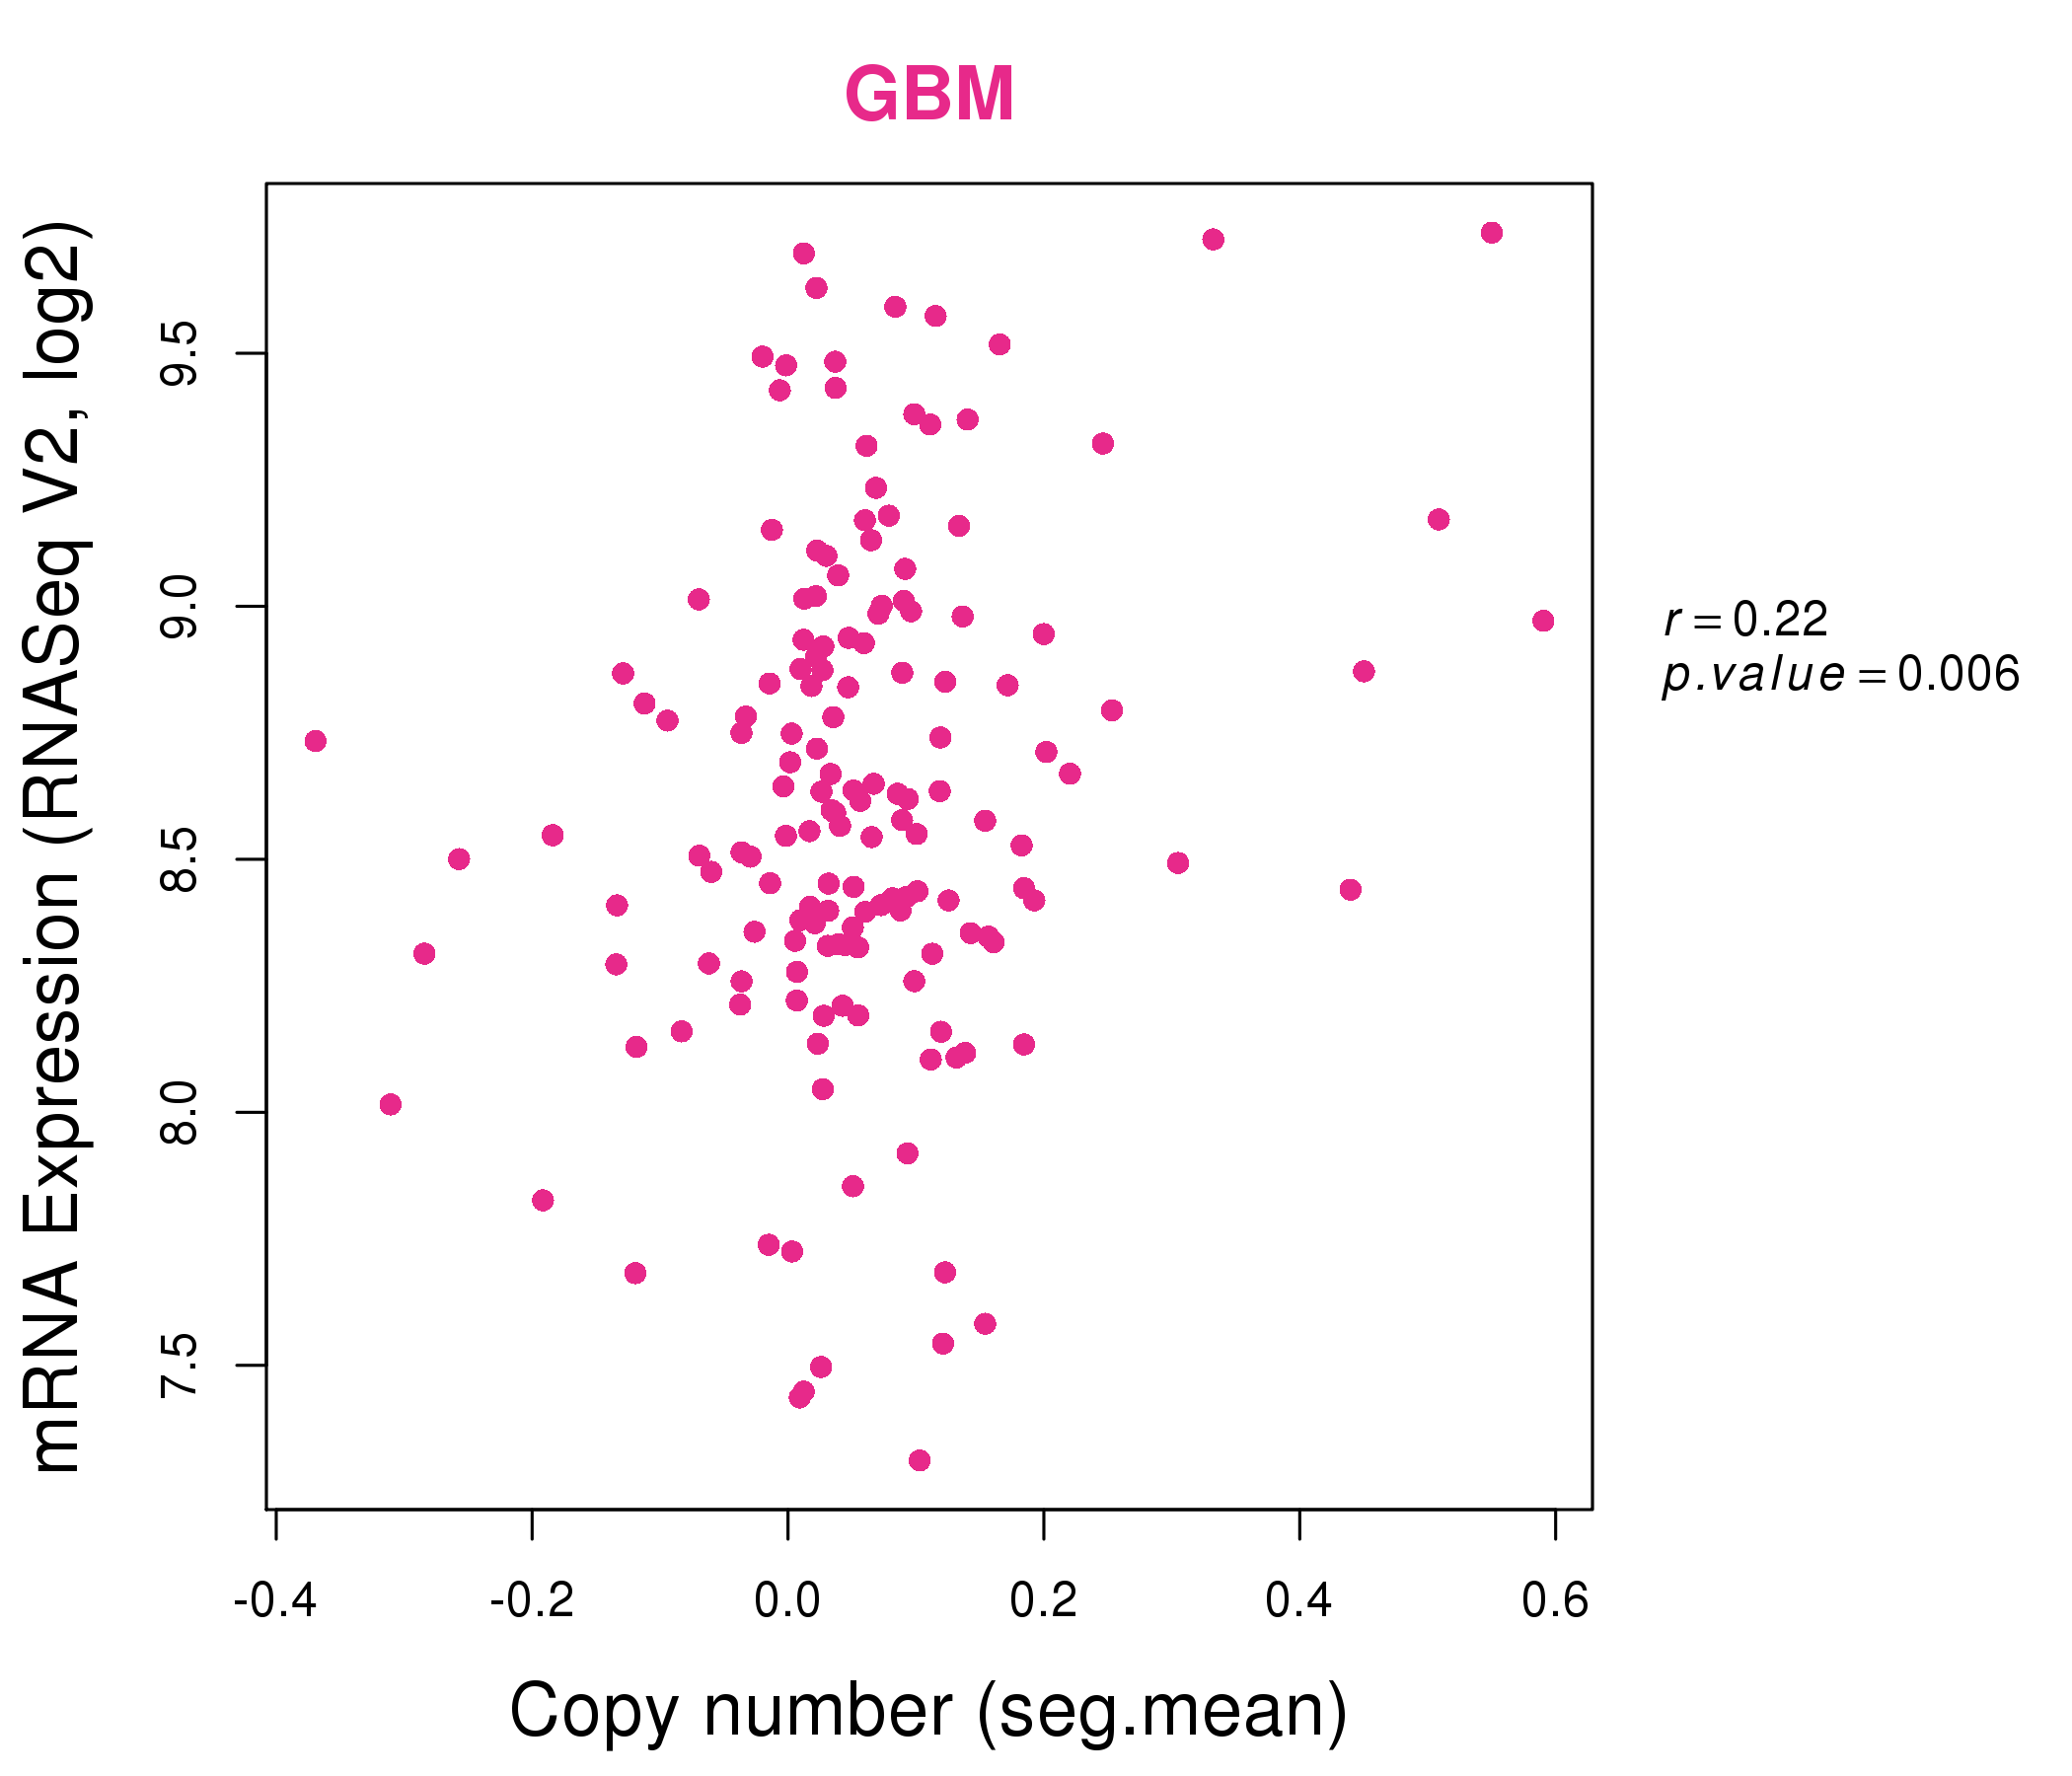
| * Normalized gene expression data of RNASeqV2 was extracted from TCGA using R package TCGA-Assembler. The URLs of all public data files on TCGA DCC data server were gathered at Jan-05-2015. Only eight cancer types have enough normal control samples for differential expression analysis. (t test, adjusted p<0.05 (using Benjamini-Hochberg FDR)) |
 |
| Top |
| * This plots show the correlation between CNV and gene expression. |
: Open all plots for all cancer types
 |
|
 |
|
| Top |
| Gene-Gene Network Information |
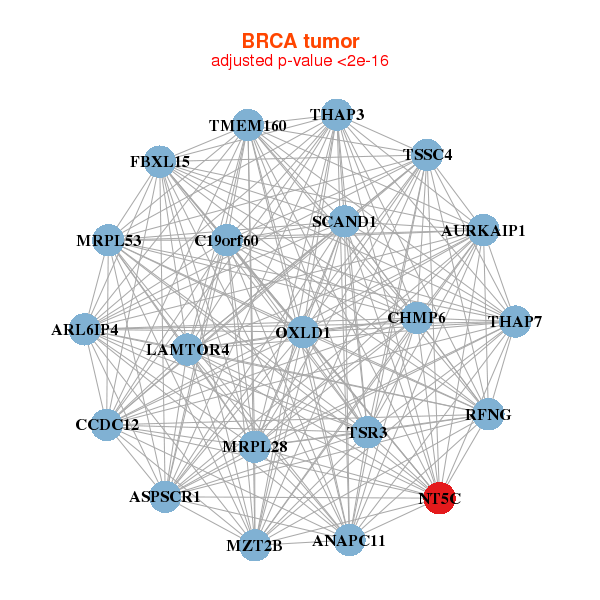
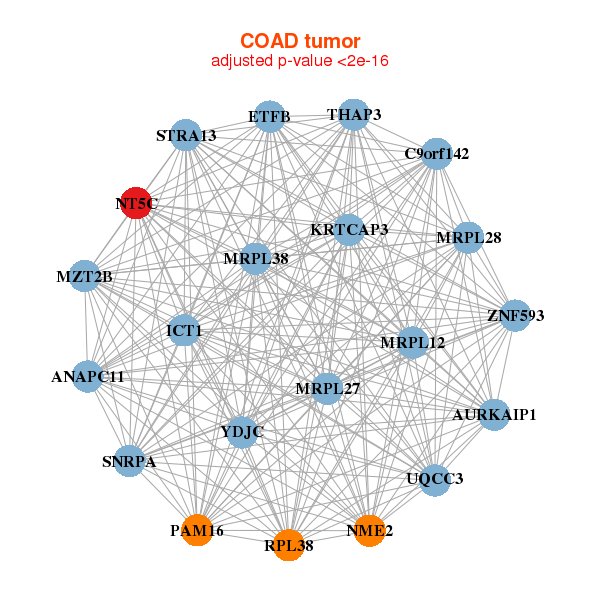
| * Co-Expression network figures were drawn using R package igraph. Only the top 20 genes with the highest correlations were shown. Red circle: input gene, orange circle: cell metabolism gene, sky circle: other gene |
: Open all plots for all cancer types
 |
| ||||
| CBX3,CMPK2,CYCS,DDX58,HESX1,IFI44,IFI44L, IFIH1,IFIT1,IFIT2,IFIT3,IFNB1,MX2,NT5C3A, OAS2,OASL,PARP12,RSAD2,SAMD9L,USP18,XAF1 | BRMS1L,SPRYD7,FAM210A,COX11,E2F6,EIF3J,HSF2, MMADHC,MOB4,NDUFA5,NT5C3A,PPP1CB,PPP1R2,PRKRA, RAB12,RFESD,RWDD4,UBE2B,VBP1,VTA1,YAF2 | ||||
 |
| ||||
| ARL4A,C1GALT1,MALSU1,CBX3,CCT6A,CYCS,GARS, GGCT,GLRX2,HUS1,LSM5,MRPL32,NT5C3A,PRSS3, PSMA2,RAC1,RALA,RP9P,S100A10,SEC61G,TAX1BP1 | ARPC2,CAP1,CASP10,CASP3,CASP7,CASP8,CCDC68, CEACAM1,CEACAM6,CLIC5,HPSE,KRT20,MAPK6,MYD88, NT5C3A,OSTF1,PLAC8,RALB,RNF19B,TDRD7,TPM3 |
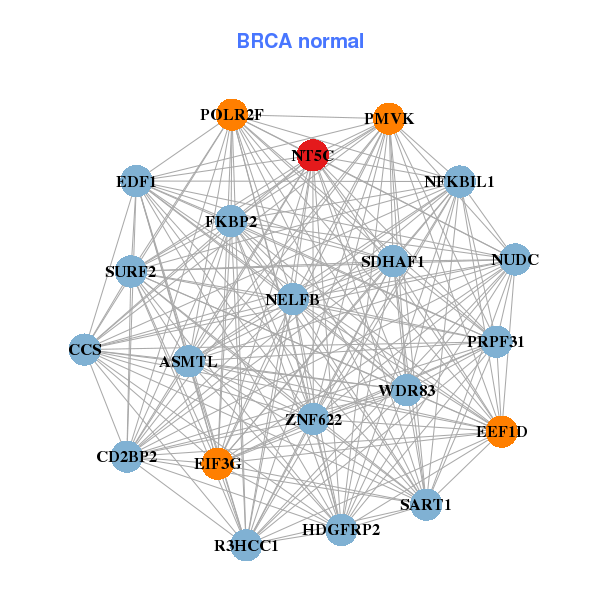
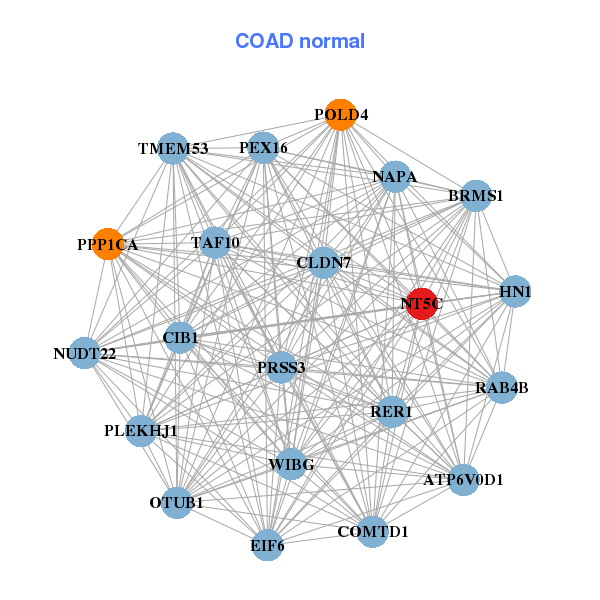
| * Co-Expression network figures were drawn using R package igraph. Only the top 20 genes with the highest correlations were shown. Red circle: input gene, orange circle: cell metabolism gene, sky circle: other gene |
: Open all plots for all cancer types
| Top |
: Open all interacting genes' information including KEGG pathway for all interacting genes from DAVID
| Top |
| Pharmacological Information for NT5C |
| DB Category | DB Name | DB's ID and Url link |
| * Gene Centered Interaction Network. |
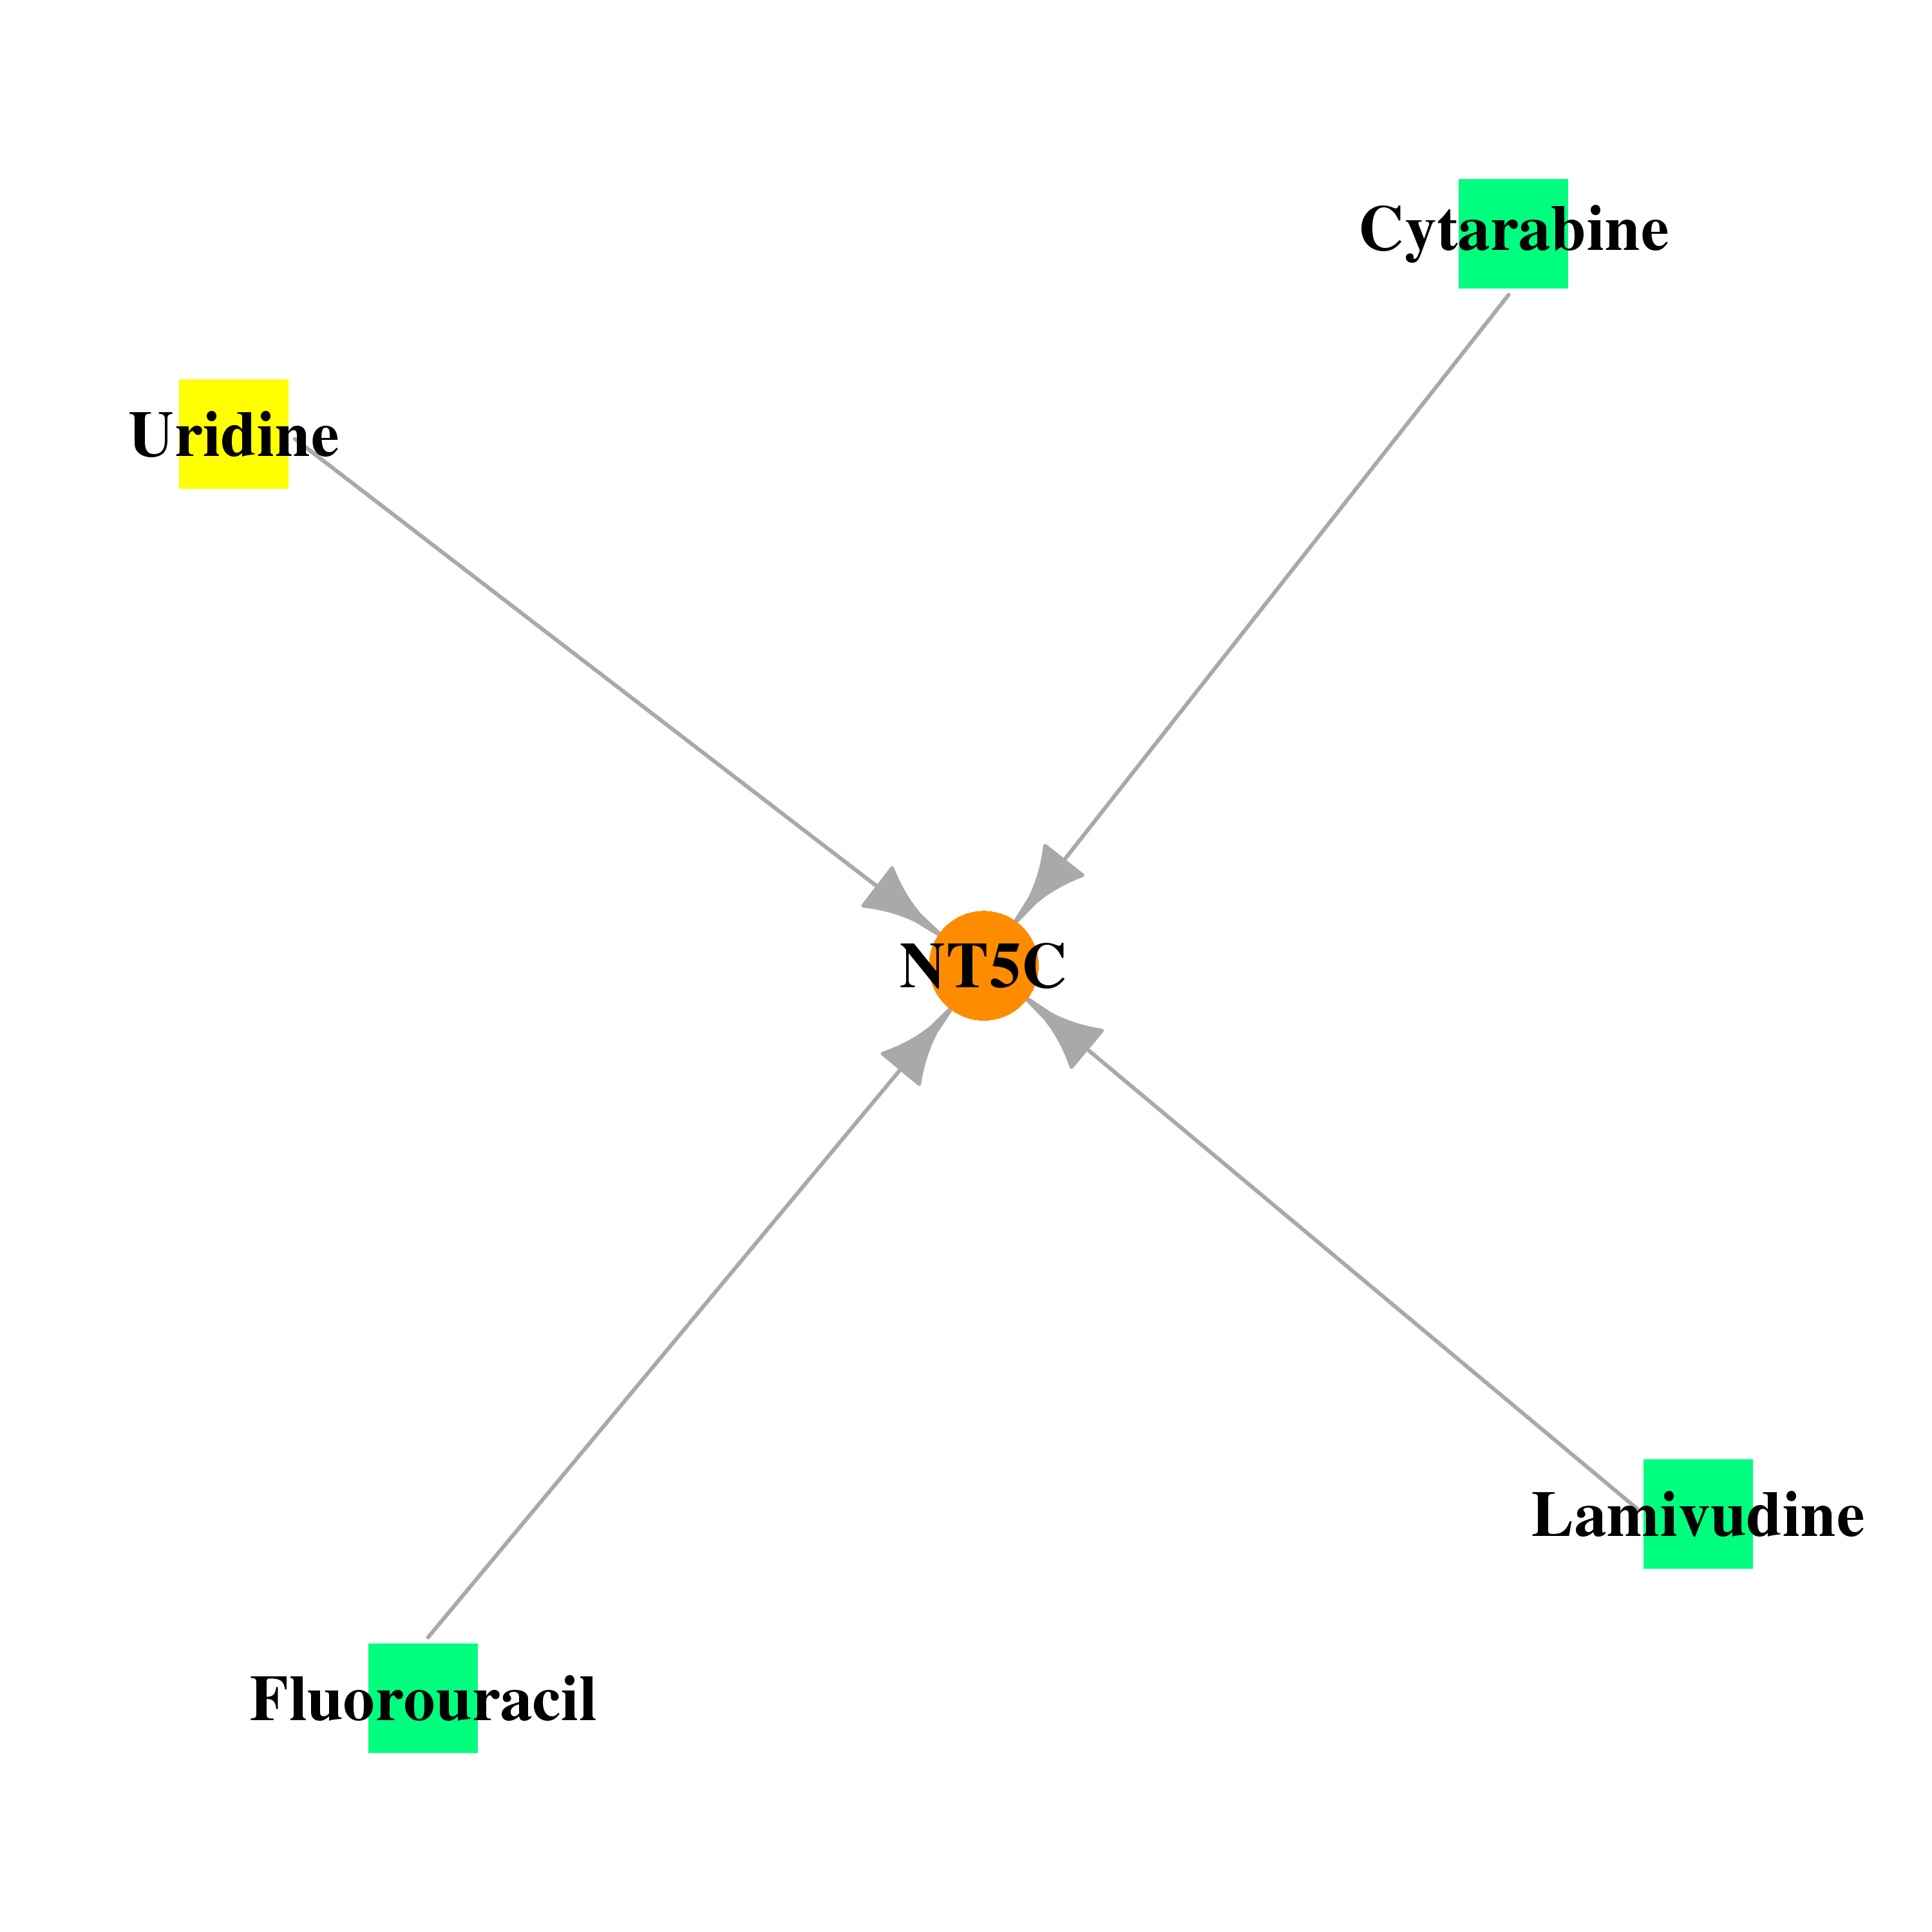 |
| * Drug Centered Interaction Network. |
| DrugBank ID | Target Name | Drug Groups | Generic Name | Drug Centered Network | Drug Structure |
| DB00987 | 5', 3'-nucleotidase, cytosolic | approved; investigational | Cytarabine | 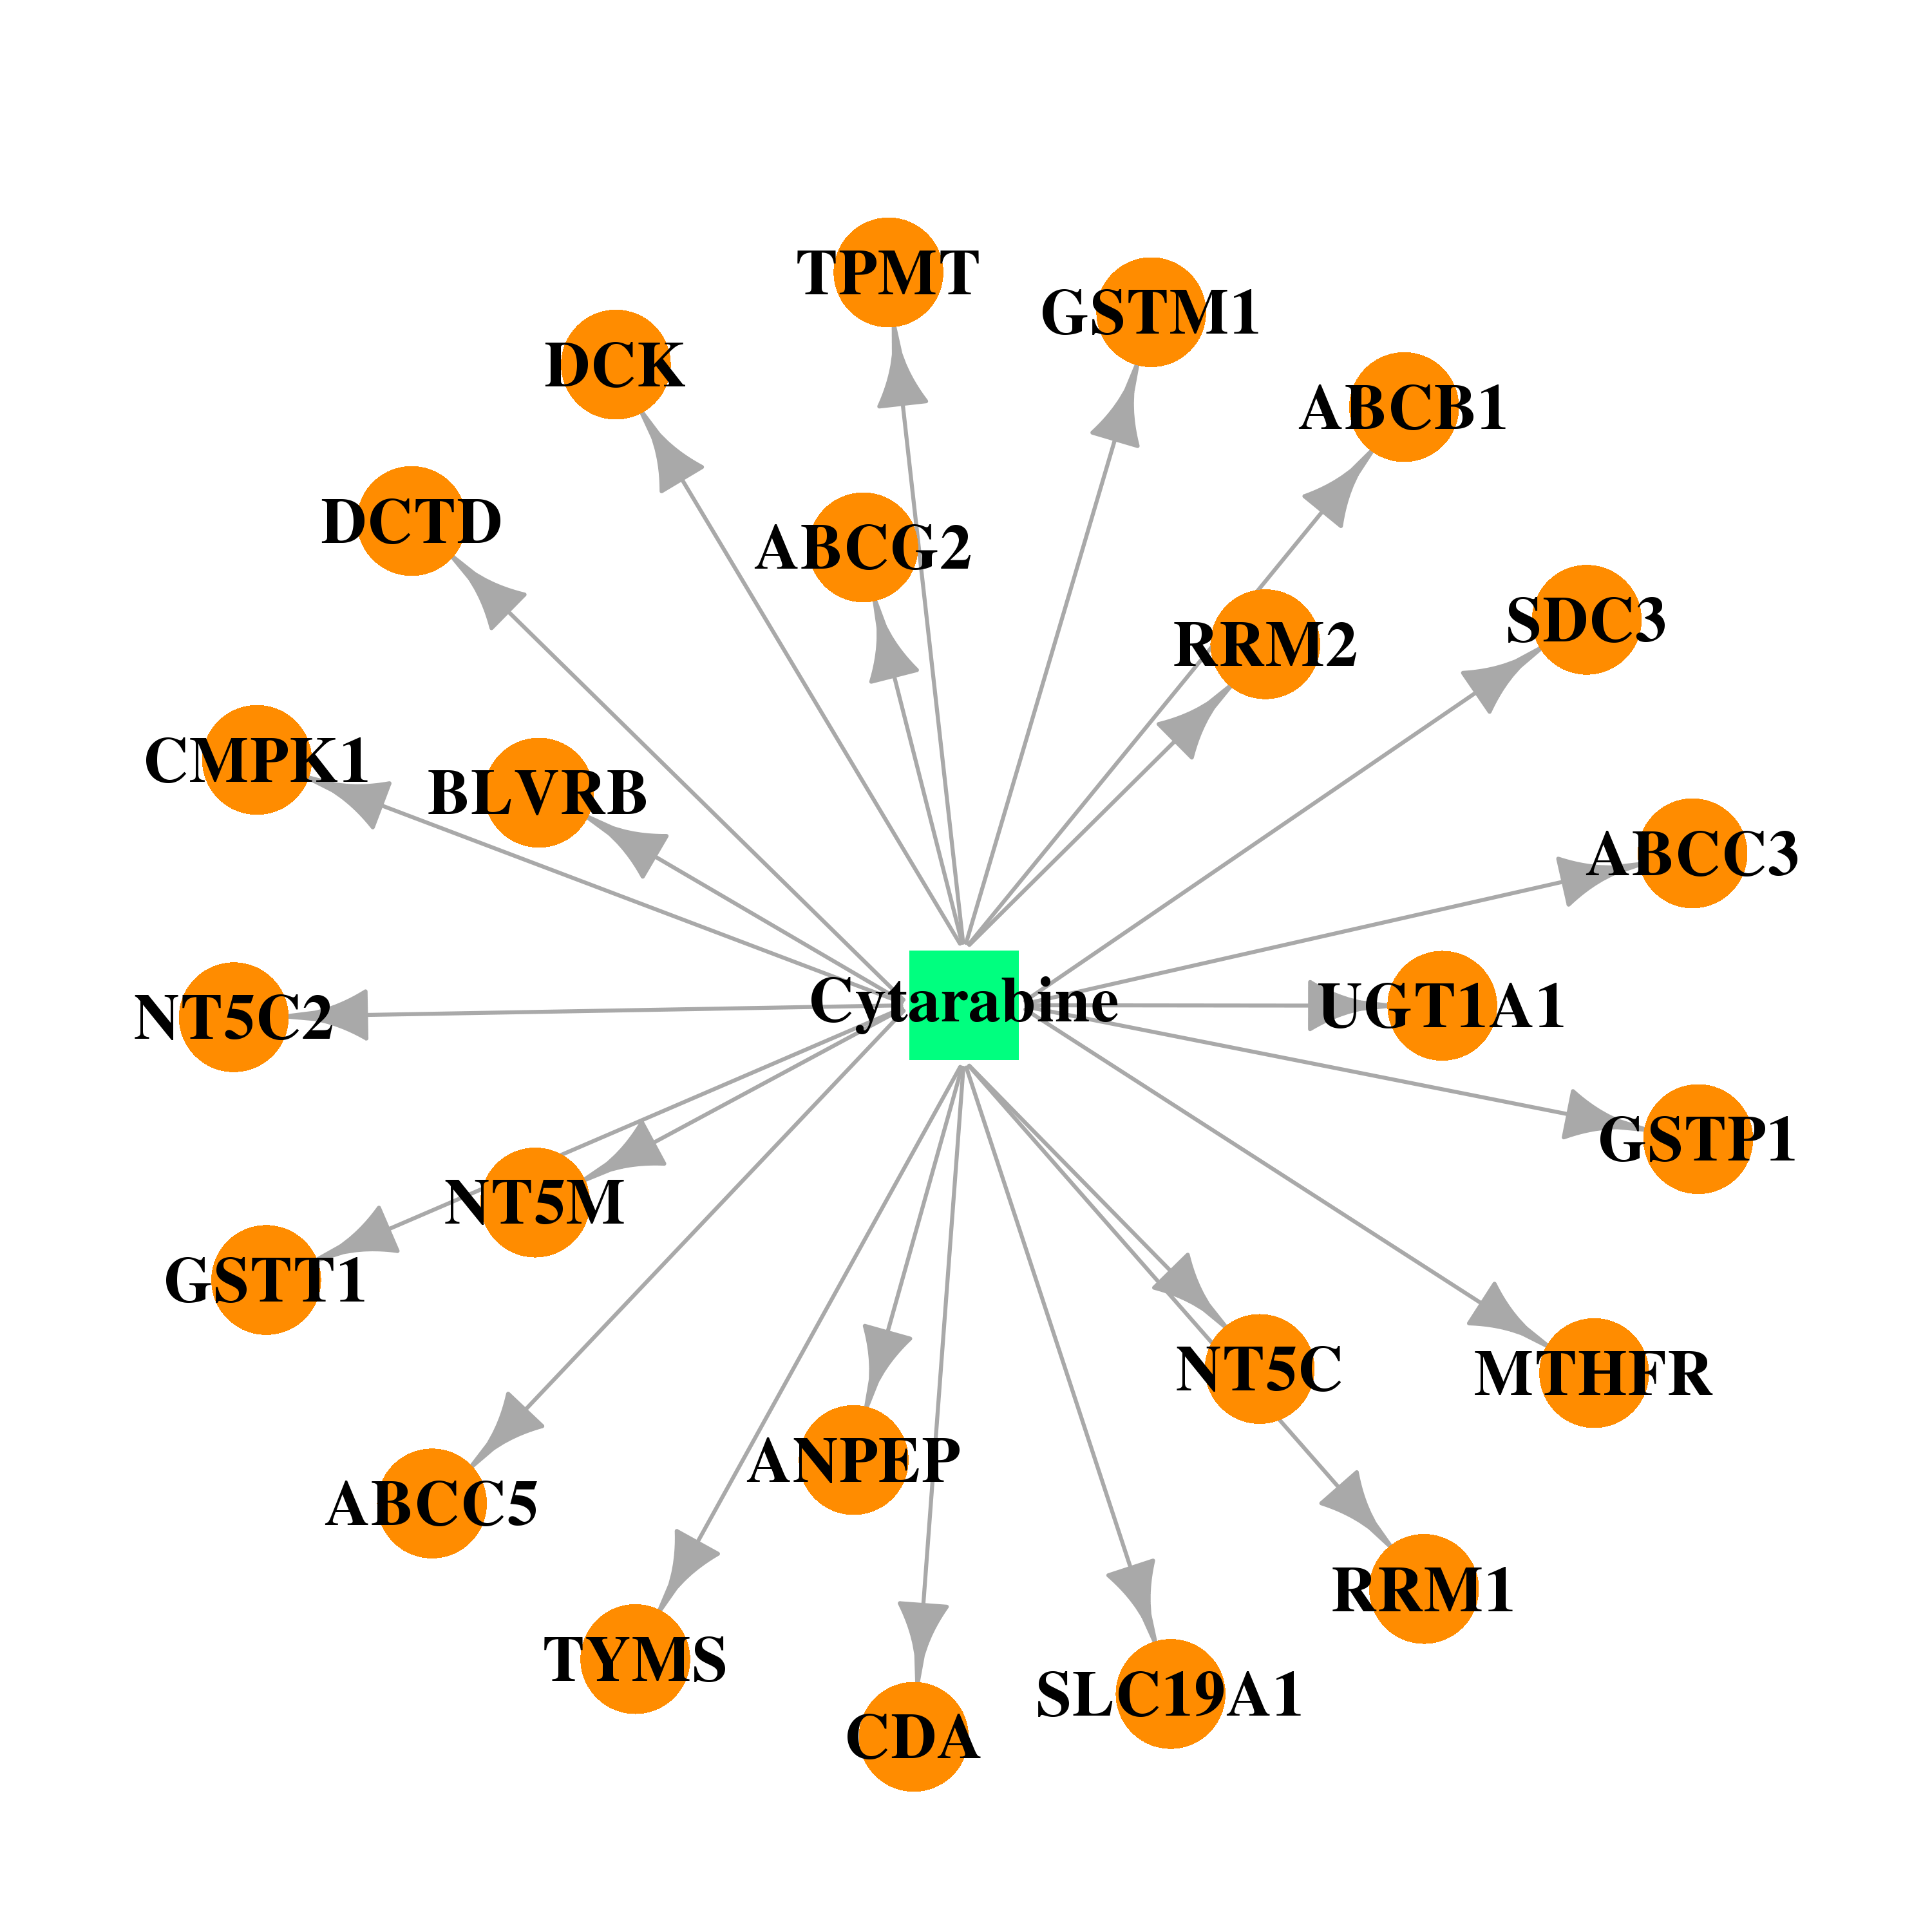 | 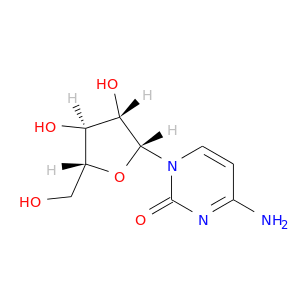 |
| DB00709 | 5', 3'-nucleotidase, cytosolic | approved; investigational | Lamivudine |  | 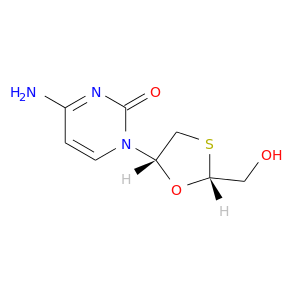 |
| DB02745 | 5', 3'-nucleotidase, cytosolic | experimental | Uridine | 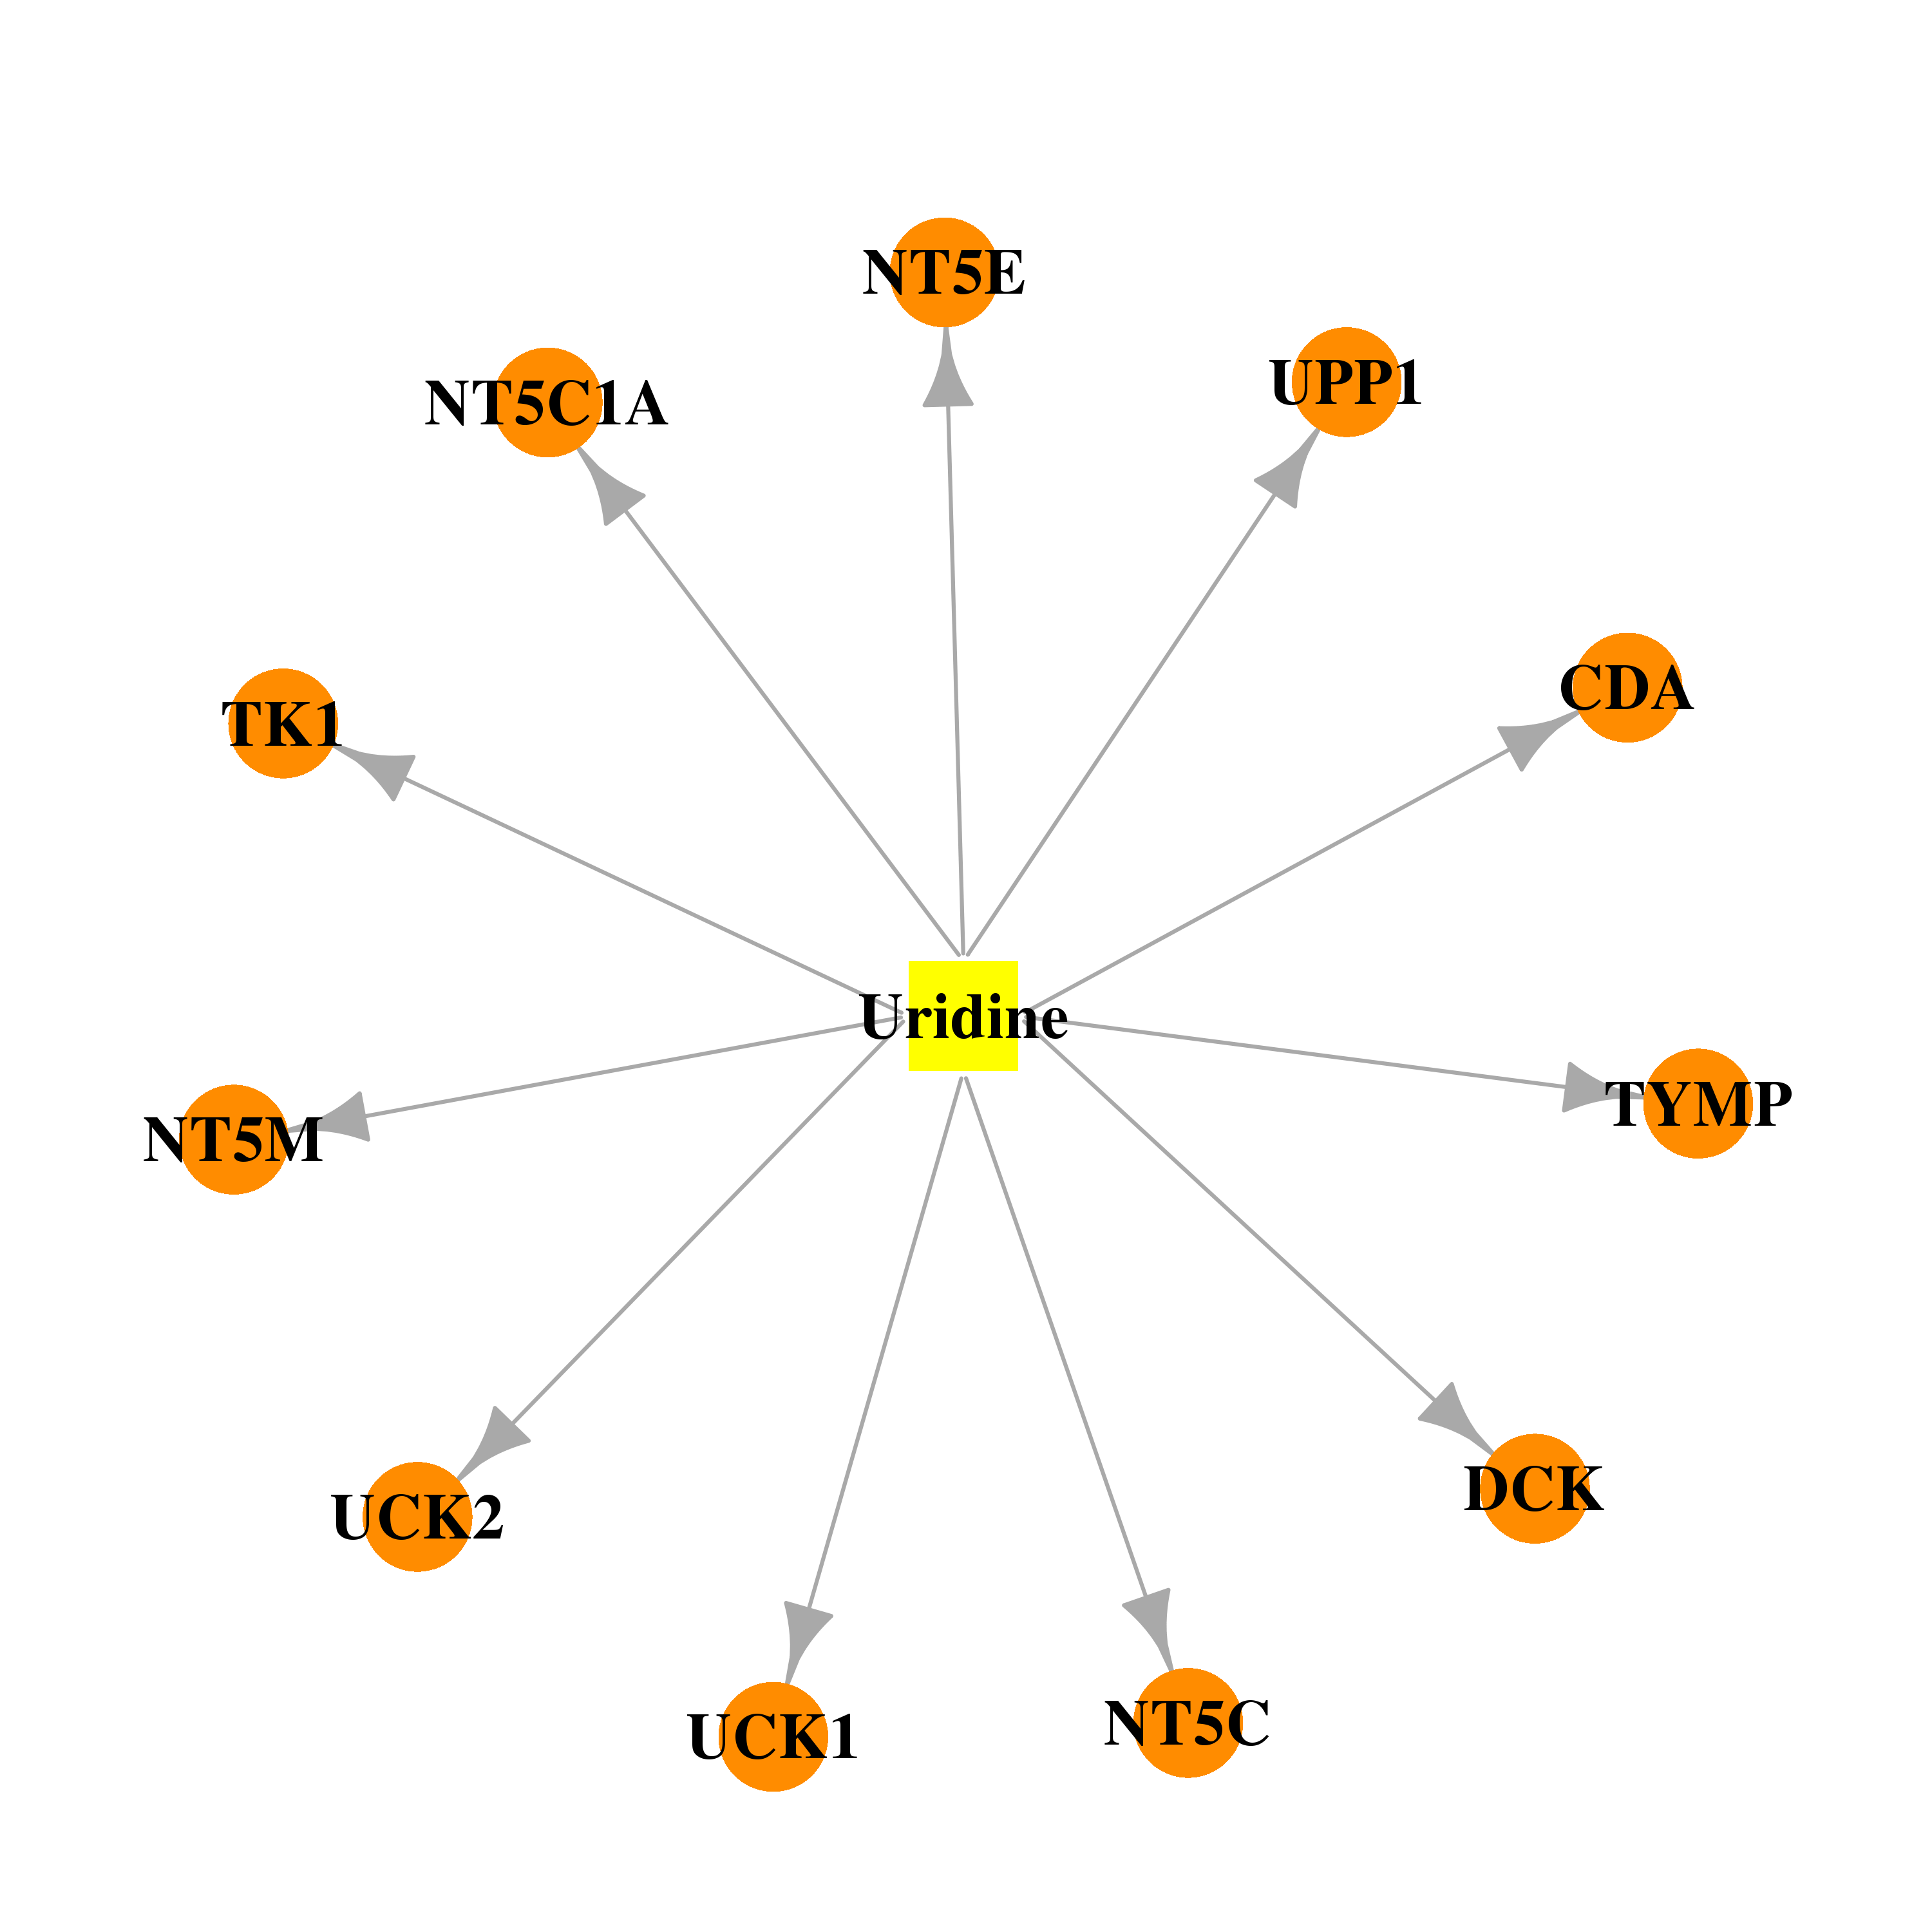 |  |
| DB00544 | 5', 3'-nucleotidase, cytosolic | approved | Fluorouracil |  |  |
| Top |
| Cross referenced IDs for NT5C |
| * We obtained these cross-references from Uniprot database. It covers 150 different DBs, 18 categories. http://www.uniprot.org/help/cross_references_section |
: Open all cross reference information
|
Copyright © 2016-Present - The Univsersity of Texas Health Science Center at Houston @ |