|
||||||||||||||||||||||||||||||||||||||||||||||||||||||||||||||||||||||||||||||||||||||||||||||||||||||||||||||||||||||||||||||||||||||||||||||||||||||||||||||||||||||||||||||||||||||||||||||||||||||||||||||||||||||||||||||||||||||||||||||||||||||||||||||||||||||||||||||||||||||||||||||||||||||||||||||||||||||||||
| |
| Phenotypic Information (metabolism pathway, cancer, disease, phenome) |
| |
| |
| Gene-Gene Network Information: Co-Expression Network, Interacting Genes & KEGG |
| |
|


| Gene Summary for PIK3R4 |
| Basic gene info. | Gene symbol | PIK3R4 |
| Gene name | phosphoinositide-3-kinase, regulatory subunit 4 | |
| Synonyms | VPS15|p150 | |
| Cytomap | UCSC genome browser: 3q22.1 | |
| Genomic location | chr3 :130397777-130465696 | |
| Type of gene | protein-coding | |
| RefGenes | NM_014602.2, | |
| Ensembl id | ENSG00000196455 | |
| Description | PI3-kinase p150 subunitPI3-kinase regulatory subunit 4phosphatidylinositol 3-kinase-associated p150phosphoinositide 3-kinase adaptor proteinphosphoinositide 3-kinase regulatory subunit 4phosphoinositide-3-kinase, regulatory subunit 4, p150 | |
| Modification date | 20141207 | |
| dbXrefs | MIM : 602610 | |
| HGNC : HGNC | ||
| Ensembl : ENSG00000196455 | ||
| HPRD : 04010 | ||
| Vega : OTTHUMG00000159645 | ||
| Protein | UniProt: Q99570 go to UniProt's Cross Reference DB Table | |
| Expression | CleanEX: HS_PIK3R4 | |
| BioGPS: 30849 | ||
| Gene Expression Atlas: ENSG00000196455 | ||
| The Human Protein Atlas: ENSG00000196455 | ||
| Pathway | NCI Pathway Interaction Database: PIK3R4 | |
| KEGG: PIK3R4 | ||
| REACTOME: PIK3R4 | ||
| ConsensusPathDB | ||
| Pathway Commons: PIK3R4 | ||
| Metabolism | MetaCyc: PIK3R4 | |
| HUMANCyc: PIK3R4 | ||
| Regulation | Ensembl's Regulation: ENSG00000196455 | |
| miRBase: chr3 :130,397,777-130,465,696 | ||
| TargetScan: NM_014602 | ||
| cisRED: ENSG00000196455 | ||
| Context | iHOP: PIK3R4 | |
| cancer metabolism search in PubMed: PIK3R4 | ||
| UCL Cancer Institute: PIK3R4 | ||
| Assigned class in ccmGDB | B - This gene belongs to cancer gene. | |
| Top |
| Phenotypic Information for PIK3R4(metabolism pathway, cancer, disease, phenome) |
| Cancer | CGAP: PIK3R4 |
| Familial Cancer Database: PIK3R4 | |
| * This gene is included in those cancer gene databases. |
|
|
|
|
|
|
| ||||||||||||||||||||||||||||||||||||||||||||||||||||||||||||||||||||||||||||||||||||||||||||||||||||||||||||||||||||||||||||||||||||||||||||||||||||||||||||||||||||||||||||||||||||||||||||||||||||||||||||||||||||||||||||||||||||||||||||||||||||||||||||||||||||||||||||||||||||||||||||||||||||||||||||||||||||
Oncogene 1 | Significant driver gene in | |||||||||||||||||||||||||||||||||||||||||||||||||||||||||||||||||||||||||||||||||||||||||||||||||||||||||||||||||||||||||||||||||||||||||||||||||||||||||||||||||||||||||||||||||||||||||||||||||||||||||||||||||||||||||||||||||||||||||||||||||||||||||||||||||||||||||||||||||||||||||||||||||||||||||||||||||||||||||
| cf) number; DB name 1 Oncogene; http://nar.oxfordjournals.org/content/35/suppl_1/D721.long, 2 Tumor Suppressor gene; https://bioinfo.uth.edu/TSGene/, 3 Cancer Gene Census; http://www.nature.com/nrc/journal/v4/n3/abs/nrc1299.html, 4 CancerGenes; http://nar.oxfordjournals.org/content/35/suppl_1/D721.long, 5 Network of Cancer Gene; http://ncg.kcl.ac.uk/index.php, 1Therapeutic Vulnerabilities in Cancer; http://cbio.mskcc.org/cancergenomics/statius/ |
| REACTOME_PHOSPHOLIPID_METABOLISM REACTOME_PI_METABOLISM REACTOME_METABOLISM_OF_LIPIDS_AND_LIPOPROTEINS | |
| OMIM | 602610; gene. |
| Orphanet | |
| Disease | KEGG Disease: PIK3R4 |
| MedGen: PIK3R4 (Human Medical Genetics with Condition) | |
| ClinVar: PIK3R4 | |
| Phenotype | MGI: PIK3R4 (International Mouse Phenotyping Consortium) |
| PhenomicDB: PIK3R4 | |
| Mutations for PIK3R4 |
| * Under tables are showing count per each tissue to give us broad intuition about tissue specific mutation patterns.You can go to the detailed page for each mutation database's web site. |
| - Statistics for Tissue and Mutation type | Top |
 |
| - For Inter-chromosomal Variations |
| * Inter-chromosomal variantions includes 'interchromosomal amplicon to amplicon', 'interchromosomal amplicon to non-amplified dna', 'interchromosomal insertion', 'Interchromosomal unknown type'. |
 |
| - For Intra-chromosomal Variations |
| There's no intra-chromosomal structural variation. |
| Sample | Symbol_a | Chr_a | Start_a | End_a | Symbol_b | Chr_b | Start_b | End_b |
| cf) Tissue number; Tissue name (1;Breast, 2;Central_nervous_system, 3;Haematopoietic_and_lymphoid_tissue, 4;Large_intestine, 5;Liver, 6;Lung, 7;Ovary, 8;Pancreas, 9;Prostate, 10;Skin, 11;Soft_tissue, 12;Upper_aerodigestive_tract) |
| * From mRNA Sanger sequences, Chitars2.0 arranged chimeric transcripts. This table shows PIK3R4 related fusion information. |
| ID | Head Gene | Tail Gene | Accession | Gene_a | qStart_a | qEnd_a | Chromosome_a | tStart_a | tEnd_a | Gene_a | qStart_a | qEnd_a | Chromosome_a | tStart_a | tEnd_a |
| BM987763 | PUS10 | 20 | 114 | 2 | 61167549 | 61167643 | PIK3R4 | 111 | 326 | 3 | 130452782 | 130454735 | |
| AI475213 | PIK3R4 | 1 | 180 | 3 | 130397779 | 130397958 | PIK3R4 | 173 | 272 | 3 | 130397932 | 130398031 | |
| Top |
| Mutation type/ Tissue ID | brca | cns | cerv | endome | haematopo | kidn | Lintest | liver | lung | ns | ovary | pancre | prost | skin | stoma | thyro | urina | |||
| Total # sample | 1 | |||||||||||||||||||
| GAIN (# sample) | 1 | |||||||||||||||||||
| LOSS (# sample) |
| cf) Tissue ID; Tissue type (1; Breast, 2; Central_nervous_system, 3; Cervix, 4; Endometrium, 5; Haematopoietic_and_lymphoid_tissue, 6; Kidney, 7; Large_intestine, 8; Liver, 9; Lung, 10; NS, 11; Ovary, 12; Pancreas, 13; Prostate, 14; Skin, 15; Stomach, 16; Thyroid, 17; Urinary_tract) |
| Top |
|
 |
| Top |
| Stat. for Non-Synonymous SNVs (# total SNVs=121) | (# total SNVs=25) |
 | 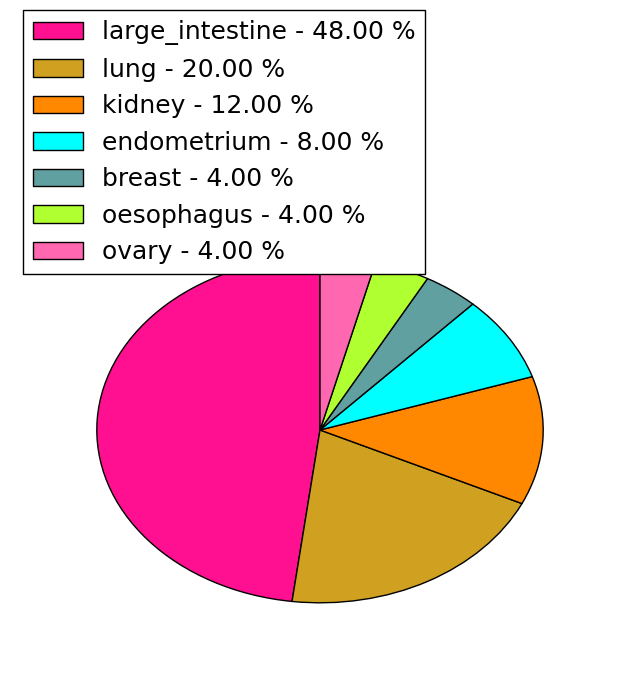 |
(# total SNVs=1) | (# total SNVs=0) |
 |
| Top |
| * When you move the cursor on each content, you can see more deailed mutation information on the Tooltip. Those are primary_site,primary_histology,mutation(aa),pubmedID. |
| GRCh37 position | Mutation(aa) | Unique sampleID count |
| chr3:130424530-130424530 | p.R936Q | 4 |
| chr3:130405249-130405249 | p.E1094A | 3 |
| chr3:130463544-130463544 | p.T173T | 3 |
| chr3:130399913-130399913 | p.? | 3 |
| chr3:130427168-130427168 | p.V834F | 2 |
| chr3:130398275-130398275 | p.P1321S | 2 |
| chr3:130424510-130424510 | p.E943K | 2 |
| chr3:130400418-130400418 | p.E1209K | 2 |
| chr3:130463616-130463616 | p.I149M | 2 |
| chr3:130463671-130463671 | p.Q131L | 2 |
| Top |
|
 |
| Point Mutation/ Tissue ID | 1 | 2 | 3 | 4 | 5 | 6 | 7 | 8 | 9 | 10 | 11 | 12 | 13 | 14 | 15 | 16 | 17 | 18 | 19 | 20 |
| # sample | 3 | 3 | 1 | 26 | 11 | 6 | 15 | 9 | 6 | 1 | 1 | 10 | 12 | 15 | ||||||
| # mutation | 3 | 3 | 1 | 27 | 12 | 6 | 18 | 9 | 6 | 1 | 1 | 10 | 15 | 22 | ||||||
| nonsynonymous SNV | 2 | 3 | 1 | 17 | 7 | 5 | 14 | 8 | 5 | 1 | 1 | 7 | 6 | 20 | ||||||
| synonymous SNV | 1 | 10 | 5 | 1 | 4 | 1 | 1 | 3 | 9 | 2 |
| cf) Tissue ID; Tissue type (1; BLCA[Bladder Urothelial Carcinoma], 2; BRCA[Breast invasive carcinoma], 3; CESC[Cervical squamous cell carcinoma and endocervical adenocarcinoma], 4; COAD[Colon adenocarcinoma], 5; GBM[Glioblastoma multiforme], 6; Glioma Low Grade, 7; HNSC[Head and Neck squamous cell carcinoma], 8; KICH[Kidney Chromophobe], 9; KIRC[Kidney renal clear cell carcinoma], 10; KIRP[Kidney renal papillary cell carcinoma], 11; LAML[Acute Myeloid Leukemia], 12; LUAD[Lung adenocarcinoma], 13; LUSC[Lung squamous cell carcinoma], 14; OV[Ovarian serous cystadenocarcinoma ], 15; PAAD[Pancreatic adenocarcinoma], 16; PRAD[Prostate adenocarcinoma], 17; SKCM[Skin Cutaneous Melanoma], 18:STAD[Stomach adenocarcinoma], 19:THCA[Thyroid carcinoma], 20:UCEC[Uterine Corpus Endometrial Carcinoma]) |
| Top |
| * We represented just top 10 SNVs. When you move the cursor on each content, you can see more deailed mutation information on the Tooltip. Those are primary_site, primary_histology, mutation(aa), pubmedID. |
| Genomic Position | Mutation(aa) | Unique sampleID count |
| chr3:130405249 | p.E1094G | 3 |
| chr3:130425904 | p.N870S | 2 |
| chr3:130452802 | p.R846G | 2 |
| chr3:130463544 | p.R347Q | 2 |
| chr3:130425977 | p.E1209K | 2 |
| chr3:130400418 | p.R1189H | 2 |
| chr3:130403135 | p.T173T | 2 |
| chr3:130447425 | p.V691V | 1 |
| chr3:130452966 | p.K503N | 1 |
| chr3:130398288 | p.V381A | 1 |
| * Copy number data were extracted from TCGA using R package TCGA-Assembler. The URLs of all public data files on TCGA DCC data server were gathered on Jan-05-2015. Function ProcessCNAData in TCGA-Assembler package was used to obtain gene-level copy number value which is calculated as the average copy number of the genomic region of a gene. |
 |
| cf) Tissue ID[Tissue type]: BLCA[Bladder Urothelial Carcinoma], BRCA[Breast invasive carcinoma], CESC[Cervical squamous cell carcinoma and endocervical adenocarcinoma], COAD[Colon adenocarcinoma], GBM[Glioblastoma multiforme], Glioma Low Grade, HNSC[Head and Neck squamous cell carcinoma], KICH[Kidney Chromophobe], KIRC[Kidney renal clear cell carcinoma], KIRP[Kidney renal papillary cell carcinoma], LAML[Acute Myeloid Leukemia], LUAD[Lung adenocarcinoma], LUSC[Lung squamous cell carcinoma], OV[Ovarian serous cystadenocarcinoma ], PAAD[Pancreatic adenocarcinoma], PRAD[Prostate adenocarcinoma], SKCM[Skin Cutaneous Melanoma], STAD[Stomach adenocarcinoma], THCA[Thyroid carcinoma], UCEC[Uterine Corpus Endometrial Carcinoma] |
| Top |
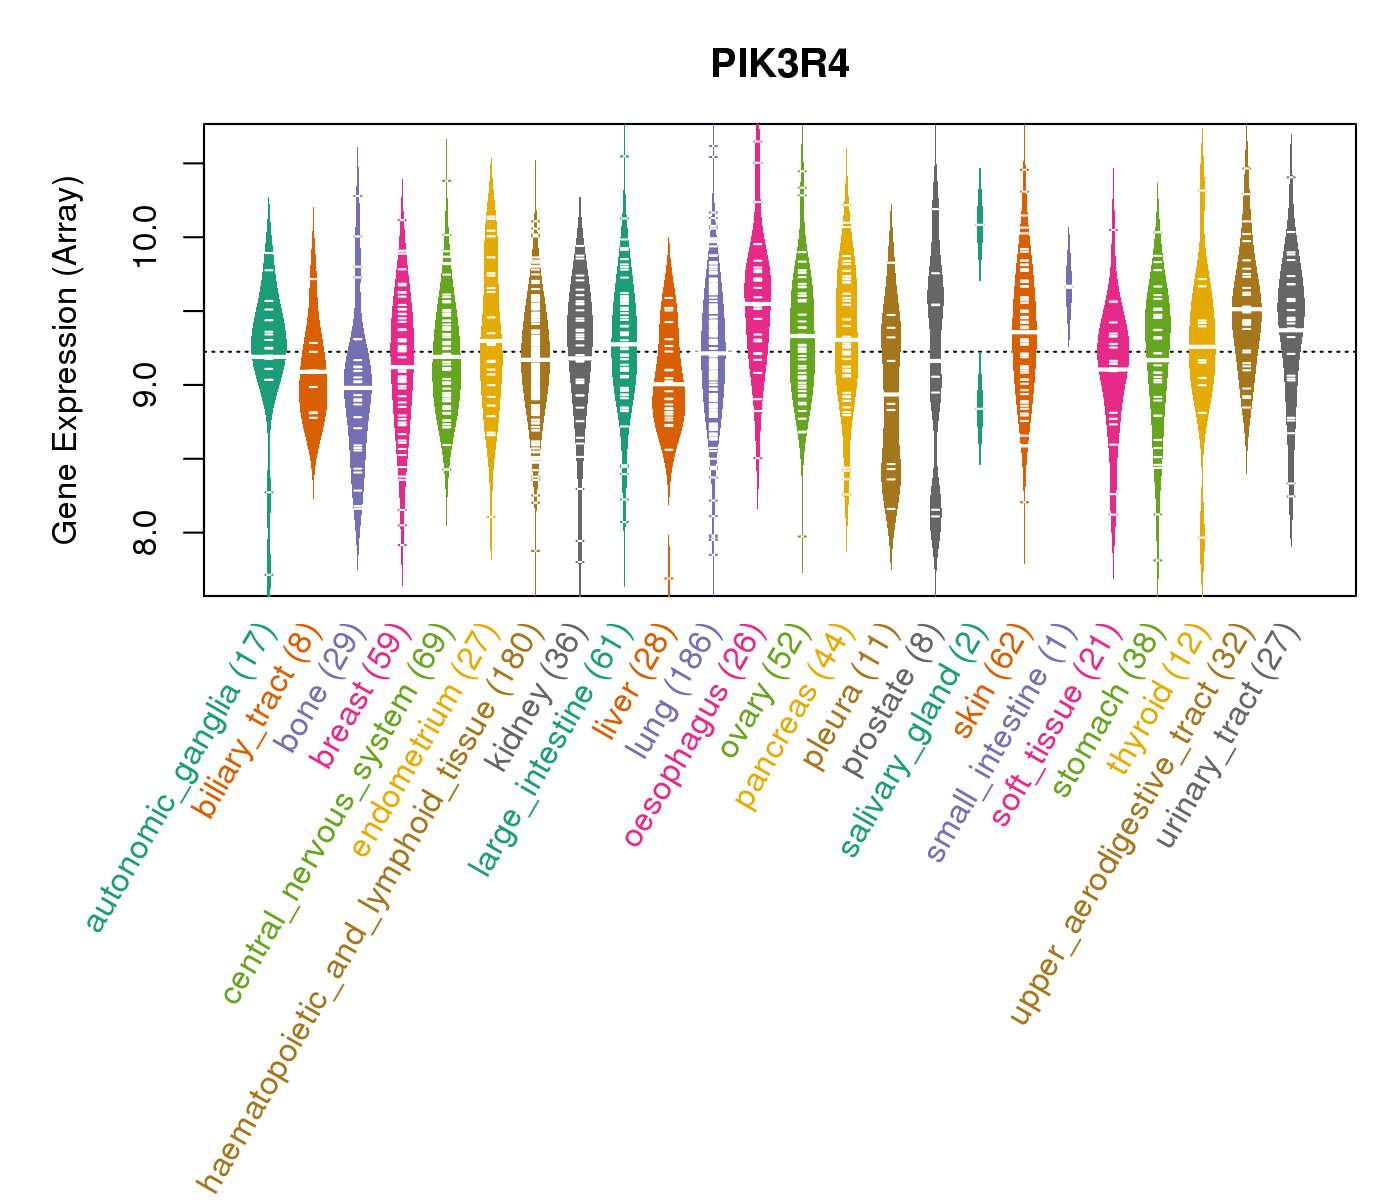
| Gene Expression for PIK3R4 |
| * CCLE gene expression data were extracted from CCLE_Expression_Entrez_2012-10-18.res: Gene-centric RMA-normalized mRNA expression data. |
 |
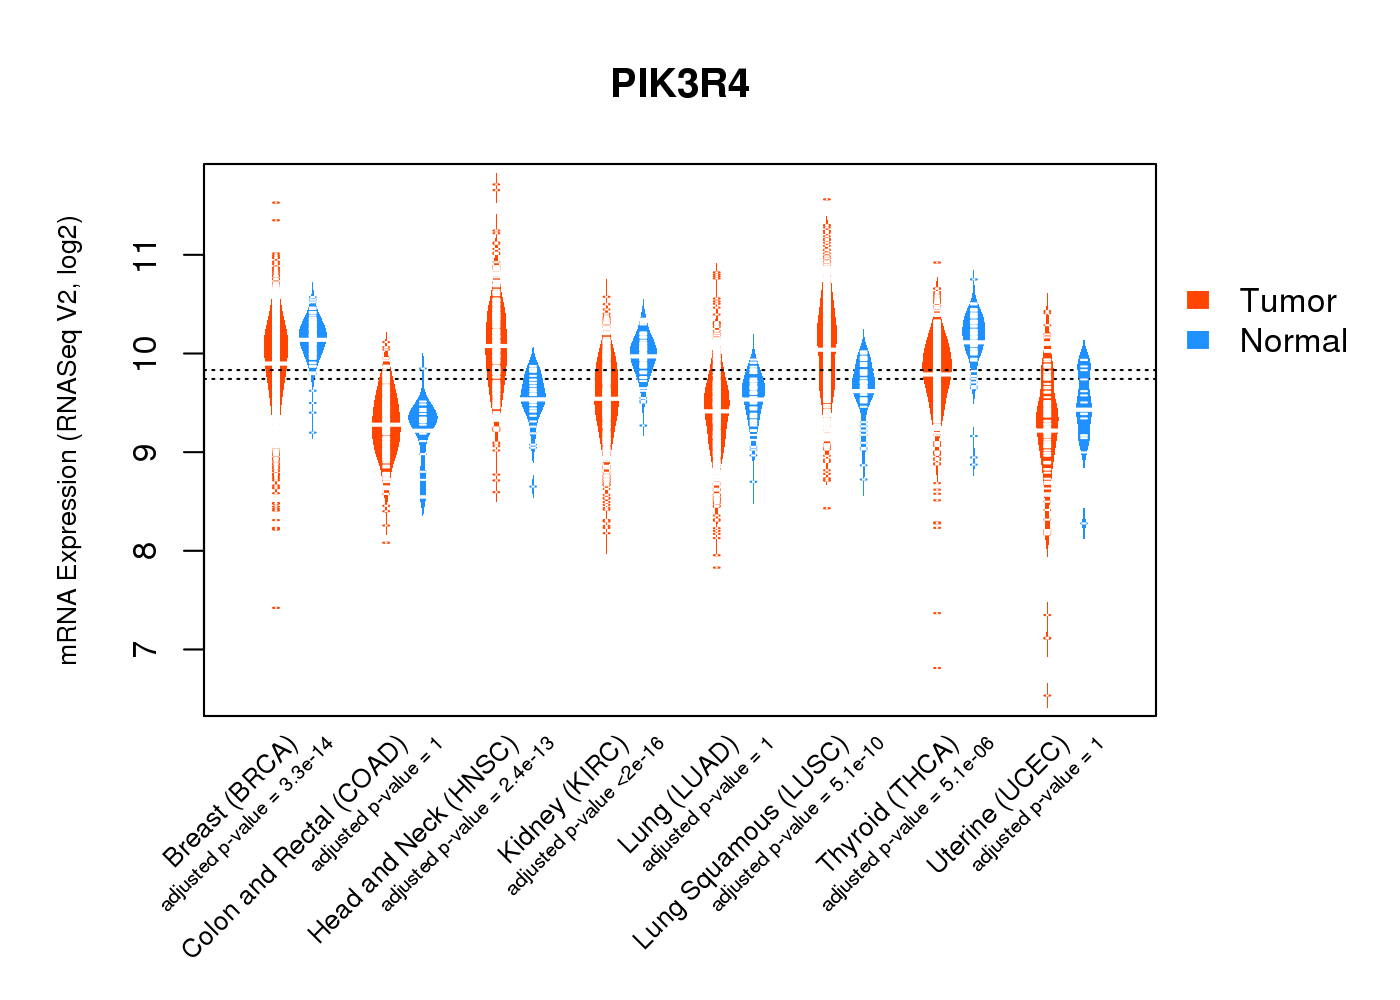
| * Normalized gene expression data of RNASeqV2 was extracted from TCGA using R package TCGA-Assembler. The URLs of all public data files on TCGA DCC data server were gathered at Jan-05-2015. Only eight cancer types have enough normal control samples for differential expression analysis. (t test, adjusted p<0.05 (using Benjamini-Hochberg FDR)) |
 |
| Top |
| * This plots show the correlation between CNV and gene expression. |
: Open all plots for all cancer types
 |
|
 |
|


| Top |
| Gene-Gene Network Information |
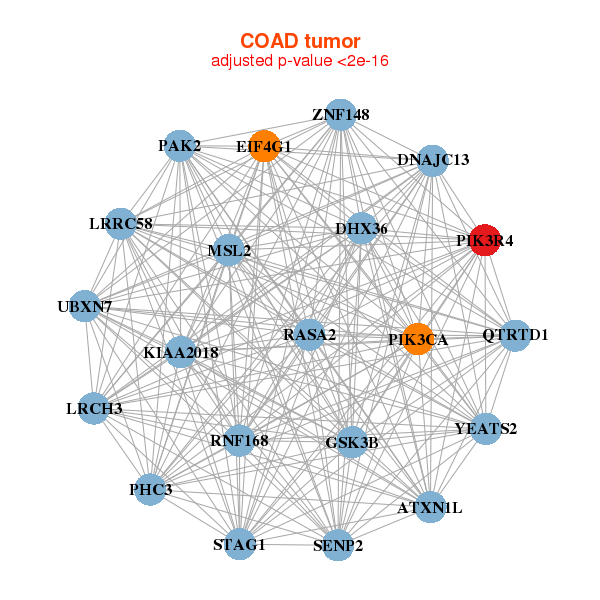
| * Co-Expression network figures were drawn using R package igraph. Only the top 20 genes with the highest correlations were shown. Red circle: input gene, orange circle: cell metabolism gene, sky circle: other gene |
: Open all plots for all cancer types
 |
|
| ARMC8,ASXL2,ATR,CEP97,DNAJC13,DPP8,GOLGB1, GSK3B,KIAA2018,KPNA1,LRRC58,MSL2,PIK3R4,PPP4R2, SCAF11,SON,STAG1,TOR1AIP2,ZBTB11,ZNF148,ZNF81 | AQR,ARHGEF12,ATRX,FAM208A,DENND4C,KIAA2026,KIDINS220, LATS1,KMT2E,MON2,PDCD6IP,PIAS1,PIK3R4,RANBP2, SCAF11,SLK,SON,TCF12,UTP14C,ZBTB38,ZNF611 |
 |
|
| ATXN1L,DHX36,DNAJC13,EIF4G1,GSK3B,KIAA2018,LRCH3, LRRC58,MSL2,PAK2,PHC3,PIK3CA,PIK3R4,QTRTD1, RASA2,RNF168,SENP2,STAG1,UBXN7,YEATS2,ZNF148 | ALMS1,CDC42BPA,CHD8,DAG1,DOCK7,GIGYF2,GLG1, HECTD1,HUWE1,KIDINS220,KAT6A,PIK3R4,PRPF8,SMARCA2, SON,TPR,UBR1,UBR3,UBR5,VPS13B,WDR7 |
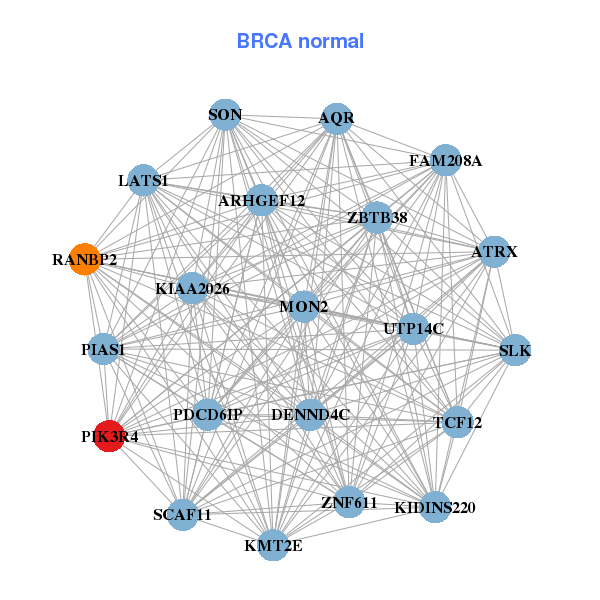

| * Co-Expression network figures were drawn using R package igraph. Only the top 20 genes with the highest correlations were shown. Red circle: input gene, orange circle: cell metabolism gene, sky circle: other gene |
: Open all plots for all cancer types
| Top |
: Open all interacting genes' information including KEGG pathway for all interacting genes from DAVID
| Top |
| Pharmacological Information for PIK3R4 |
| There's no related Drug. |
| Top |
| Cross referenced IDs for PIK3R4 |
| * We obtained these cross-references from Uniprot database. It covers 150 different DBs, 18 categories. http://www.uniprot.org/help/cross_references_section |
: Open all cross reference information
|
Copyright © 2016-Present - The Univsersity of Texas Health Science Center at Houston @ |