|
|||||||||||||||||||||||||||||||||||||||||||||||||||||||||||||||||||||||||||||||||||||||||||||||||||||||||||||||||||||||||||||||||||||||||||||||||||||||||||||||||||||||||||||||||||||||||||||||||||||||||||||||||||||||||||||||||||||||||||||||||||||||||||||||||||||||||||||||||||||||||||||||||||||||||||||||||||||||||||||||||||||||||||||||||||||||||||||||
| |
| Phenotypic Information (metabolism pathway, cancer, disease, phenome) |
| |
| |
| Gene-Gene Network Information: Co-Expression Network, Interacting Genes & KEGG |
| |
|


| Gene Summary for HK1 |
| Top |
| Phenotypic Information for HK1(metabolism pathway, cancer, disease, phenome) |
| Cancer | CGAP: HK1 |
| Familial Cancer Database: HK1 | |
| * This gene is included in those cancer gene databases. |
|
|
|
|
|
|
| |||||||||||||||||||||||||||||||||||||||||||||||||||||||||||||||||||||||||||||||||||||||||||||||||||||||||||||||||||||||||||||||||||||||||||||||||||||||||||||||||||||||||||||||||||||||||||||||||||||||||||||||||||||||||||||||||||||||||||||||||||||||||||||||||||||||||||||||||||||||||||||||||||||||||||||||||||||||||||||||||||||||||||||||||||||||||
Oncogene 1 | Significant driver gene in | ||||||||||||||||||||||||||||||||||||||||||||||||||||||||||||||||||||||||||||||||||||||||||||||||||||||||||||||||||||||||||||||||||||||||||||||||||||||||||||||||||||||||||||||||||||||||||||||||||||||||||||||||||||||||||||||||||||||||||||||||||||||||||||||||||||||||||||||||||||||||||||||||||||||||||||||||||||||||||||||||||||||||||||||||||||||||||||||
| cf) number; DB name 1 Oncogene; http://nar.oxfordjournals.org/content/35/suppl_1/D721.long, 2 Tumor Suppressor gene; https://bioinfo.uth.edu/TSGene/, 3 Cancer Gene Census; http://www.nature.com/nrc/journal/v4/n3/abs/nrc1299.html, 4 CancerGenes; http://nar.oxfordjournals.org/content/35/suppl_1/D721.long, 5 Network of Cancer Gene; http://ncg.kcl.ac.uk/index.php, 1Therapeutic Vulnerabilities in Cancer; http://cbio.mskcc.org/cancergenomics/statius/ |
| KEGG_GLYCOLYSIS_GLUCONEOGENESIS KEGG_FRUCTOSE_AND_MANNOSE_METABOLISM KEGG_GALACTOSE_METABOLISM KEGG_STARCH_AND_SUCROSE_METABOLISM KEGG_AMINO_SUGAR_AND_NUCLEOTIDE_SUGAR_METABOLISM BIOCARTA_GLYCOLYSIS_PATHWAY REACTOME_METABOLISM_OF_CARBOHYDRATES | |
| OMIM | |
| Orphanet | |
| Disease | KEGG Disease: HK1 |
| MedGen: HK1 (Human Medical Genetics with Condition) | |
| ClinVar: HK1 | |
| Phenotype | MGI: HK1 (International Mouse Phenotyping Consortium) |
| PhenomicDB: HK1 | |
| Mutations for HK1 |
| * Under tables are showing count per each tissue to give us broad intuition about tissue specific mutation patterns.You can go to the detailed page for each mutation database's web site. |
| - Statistics for Tissue and Mutation type | Top |
 |
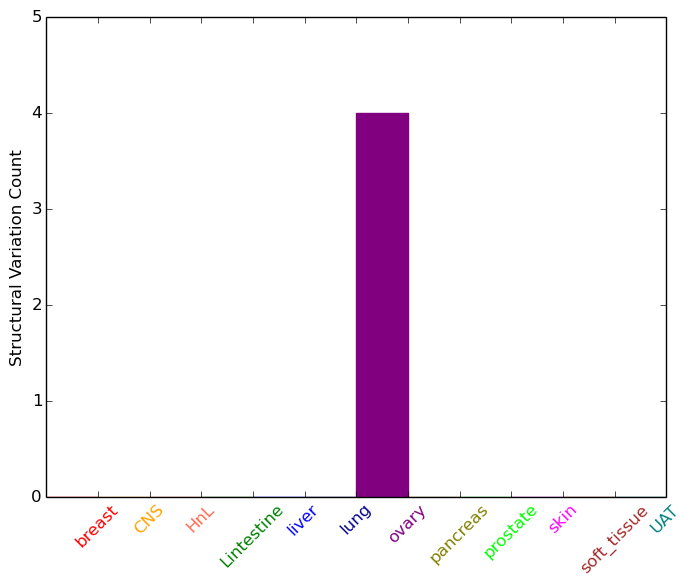
| - For Inter-chromosomal Variations |
| There's no inter-chromosomal structural variation. |
| - For Intra-chromosomal Variations |
| * Intra-chromosomal variantions includes 'intrachromosomal amplicon to amplicon', 'intrachromosomal amplicon to non-amplified dna', 'intrachromosomal deletion', 'intrachromosomal fold-back inversion', 'intrachromosomal inversion', 'intrachromosomal tandem duplication', 'Intrachromosomal unknown type', 'intrachromosomal with inverted orientation', 'intrachromosomal with non-inverted orientation'. |
 |
| Sample | Symbol_a | Chr_a | Start_a | End_a | Symbol_b | Chr_b | Start_b | End_b |
| ovary | HK1 | chr10 | 71109943 | 71109963 | HK1 | chr10 | 71105433 | 71105453 |
| cf) Tissue number; Tissue name (1;Breast, 2;Central_nervous_system, 3;Haematopoietic_and_lymphoid_tissue, 4;Large_intestine, 5;Liver, 6;Lung, 7;Ovary, 8;Pancreas, 9;Prostate, 10;Skin, 11;Soft_tissue, 12;Upper_aerodigestive_tract) |
| * From mRNA Sanger sequences, Chitars2.0 arranged chimeric transcripts. This table shows HK1 related fusion information. |
| ID | Head Gene | Tail Gene | Accession | Gene_a | qStart_a | qEnd_a | Chromosome_a | tStart_a | tEnd_a | Gene_a | qStart_a | qEnd_a | Chromosome_a | tStart_a | tEnd_a |
| AW841510 | HK1 | 1 | 108 | 10 | 71161498 | 71161605 | HK1 | 103 | 327 | 10 | 71161318 | 71161542 | |
| BE149450 | HK1 | 29 | 161 | 10 | 71139645 | 71139779 | MTOR | 149 | 404 | 1 | 11167074 | 11167330 | |
| AW903811 | HK1 | 7 | 170 | 10 | 71151936 | 71154745 | HK1 | 161 | 313 | 10 | 71161134 | 71161286 | |
| BE162082 | HK1 | 34 | 331 | 10 | 71050599 | 71050896 | HK1 | 330 | 484 | 10 | 71050898 | 71051052 | |
| BI055002 | HK1 | 1 | 97 | 10 | 71161395 | 71161491 | EPN2 | 93 | 341 | 17 | 19225736 | 19225983 | |
| W28999 | HK1 | 48 | 304 | 10 | 71142439 | 71144237 | HK1 | 299 | 584 | 10 | 71144584 | 71149049 | |
| BI003573 | CYB561 | 14 | 171 | 17 | 61510161 | 61510318 | HK1 | 157 | 477 | 10 | 71158546 | 71161028 | |
| BC048213 | HK1 | 634 | 1535 | 10 | 71160769 | 71161765 | GNL1 | 1534 | 2914 | 6 | 1846018 | 1854676 | |
| Top |
| Mutation type/ Tissue ID | brca | cns | cerv | endome | haematopo | kidn | Lintest | liver | lung | ns | ovary | pancre | prost | skin | stoma | thyro | urina | |||
| Total # sample | 1 | 1 | ||||||||||||||||||
| GAIN (# sample) | ||||||||||||||||||||
| LOSS (# sample) | 1 | 1 |
| cf) Tissue ID; Tissue type (1; Breast, 2; Central_nervous_system, 3; Cervix, 4; Endometrium, 5; Haematopoietic_and_lymphoid_tissue, 6; Kidney, 7; Large_intestine, 8; Liver, 9; Lung, 10; NS, 11; Ovary, 12; Pancreas, 13; Prostate, 14; Skin, 15; Stomach, 16; Thyroid, 17; Urinary_tract) |
| Top |
|
 |
| Top |
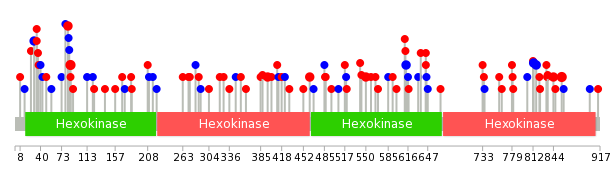
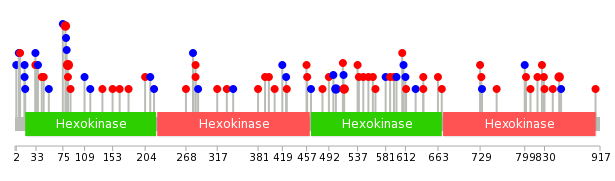
| Stat. for Non-Synonymous SNVs (# total SNVs=65) | (# total SNVs=28) |
 |  |
(# total SNVs=0) | (# total SNVs=1) |
 |
| Top |
| * When you move the cursor on each content, you can see more deailed mutation information on the Tooltip. Those are primary_site,primary_histology,mutation(aa),pubmedID. |
| GRCh37 position | Mutation(aa) | Unique sampleID count |
| chr10:71119674-71119674 | p.L87P | 3 |
| chr10:71128288-71128288 | p.? | 3 |
| chr10:71158533-71158533 | p.R857H | 3 |
| chr10:71144659-71144659 | p.T613T | 2 |
| chr10:71142350-71142350 | p.A462V | 2 |
| chr10:71158402-71158402 | p.L813L | 2 |
| chr10:71158414-71158414 | p.C817C | 2 |
| chr10:71144154-71144154 | p.R550C | 2 |
| chr10:71139760-71139760 | p.A396T | 2 |
| chr10:71103597-71103597 | p.L30L | 2 |
| Top |
|
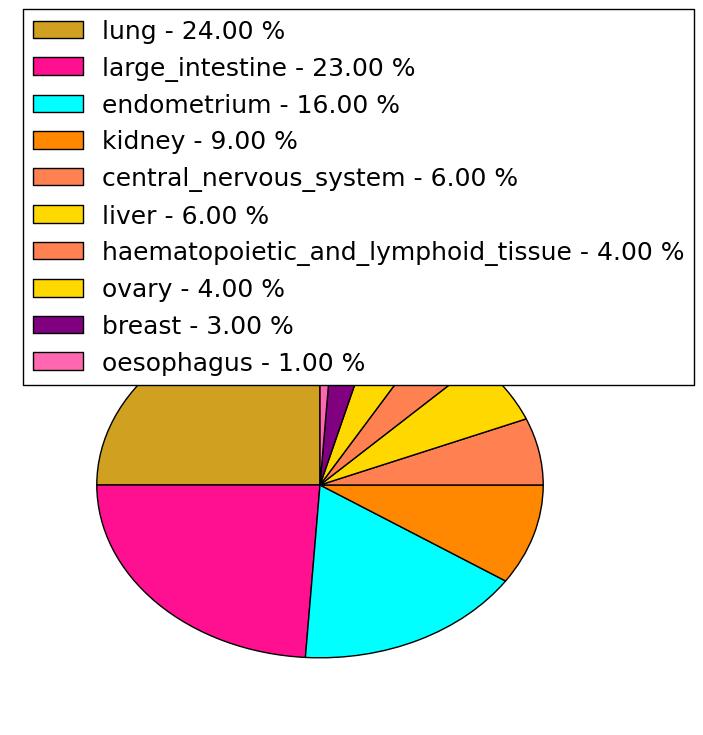
 |
| Point Mutation/ Tissue ID | 1 | 2 | 3 | 4 | 5 | 6 | 7 | 8 | 9 | 10 | 11 | 12 | 13 | 14 | 15 | 16 | 17 | 18 | 19 | 20 |
| # sample | 5 | 1 | 14 | 3 | 3 | 1 | 15 | 5 | 1 | 8 | 12 | 11 | ||||||||
| # mutation | 5 | 1 | 13 | 3 | 4 | 1 | 18 | 5 | 1 | 8 | 14 | 16 | ||||||||
| nonsynonymous SNV | 3 | 9 | 3 | 3 | 1 | 8 | 4 | 1 | 3 | 11 | 10 | |||||||||
| synonymous SNV | 2 | 1 | 4 | 1 | 10 | 1 | 5 | 3 | 6 |
| cf) Tissue ID; Tissue type (1; BLCA[Bladder Urothelial Carcinoma], 2; BRCA[Breast invasive carcinoma], 3; CESC[Cervical squamous cell carcinoma and endocervical adenocarcinoma], 4; COAD[Colon adenocarcinoma], 5; GBM[Glioblastoma multiforme], 6; Glioma Low Grade, 7; HNSC[Head and Neck squamous cell carcinoma], 8; KICH[Kidney Chromophobe], 9; KIRC[Kidney renal clear cell carcinoma], 10; KIRP[Kidney renal papillary cell carcinoma], 11; LAML[Acute Myeloid Leukemia], 12; LUAD[Lung adenocarcinoma], 13; LUSC[Lung squamous cell carcinoma], 14; OV[Ovarian serous cystadenocarcinoma ], 15; PAAD[Pancreatic adenocarcinoma], 16; PRAD[Prostate adenocarcinoma], 17; SKCM[Skin Cutaneous Melanoma], 18:STAD[Stomach adenocarcinoma], 19:THCA[Thyroid carcinoma], 20:UCEC[Uterine Corpus Endometrial Carcinoma]) |
| Top |
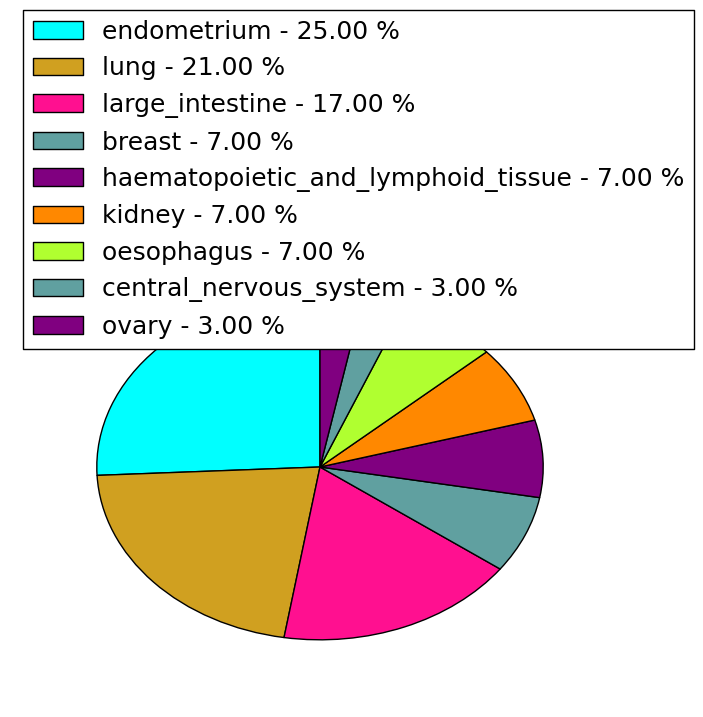
| * We represented just top 10 SNVs. When you move the cursor on each content, you can see more deailed mutation information on the Tooltip. Those are primary_site, primary_histology, mutation(aa), pubmedID. |
| Genomic Position | Mutation(aa) | Unique sampleID count |
| chr10:71119674 | p.L83P,HK1 | 3 |
| chr10:71142486 | p.D79N,HK1 | 2 |
| chr10:71158533 | p.T503T,HK1 | 2 |
| chr10:71142523 | p.V516I,HK1 | 2 |
| chr10:71119661 | p.R853H,HK1 | 2 |
| chr10:71158462 | p.E554D,HK1 | 1 |
| chr10:71129308 | p.V729L,HK1 | 1 |
| chr10:71144595 | p.L36L,HK1 | 1 |
| chr10:71103616 | p.S178G,HK1 | 1 |
| chr10:71139806 | p.T419T,HK1 | 1 |
| * Copy number data were extracted from TCGA using R package TCGA-Assembler. The URLs of all public data files on TCGA DCC data server were gathered on Jan-05-2015. Function ProcessCNAData in TCGA-Assembler package was used to obtain gene-level copy number value which is calculated as the average copy number of the genomic region of a gene. |
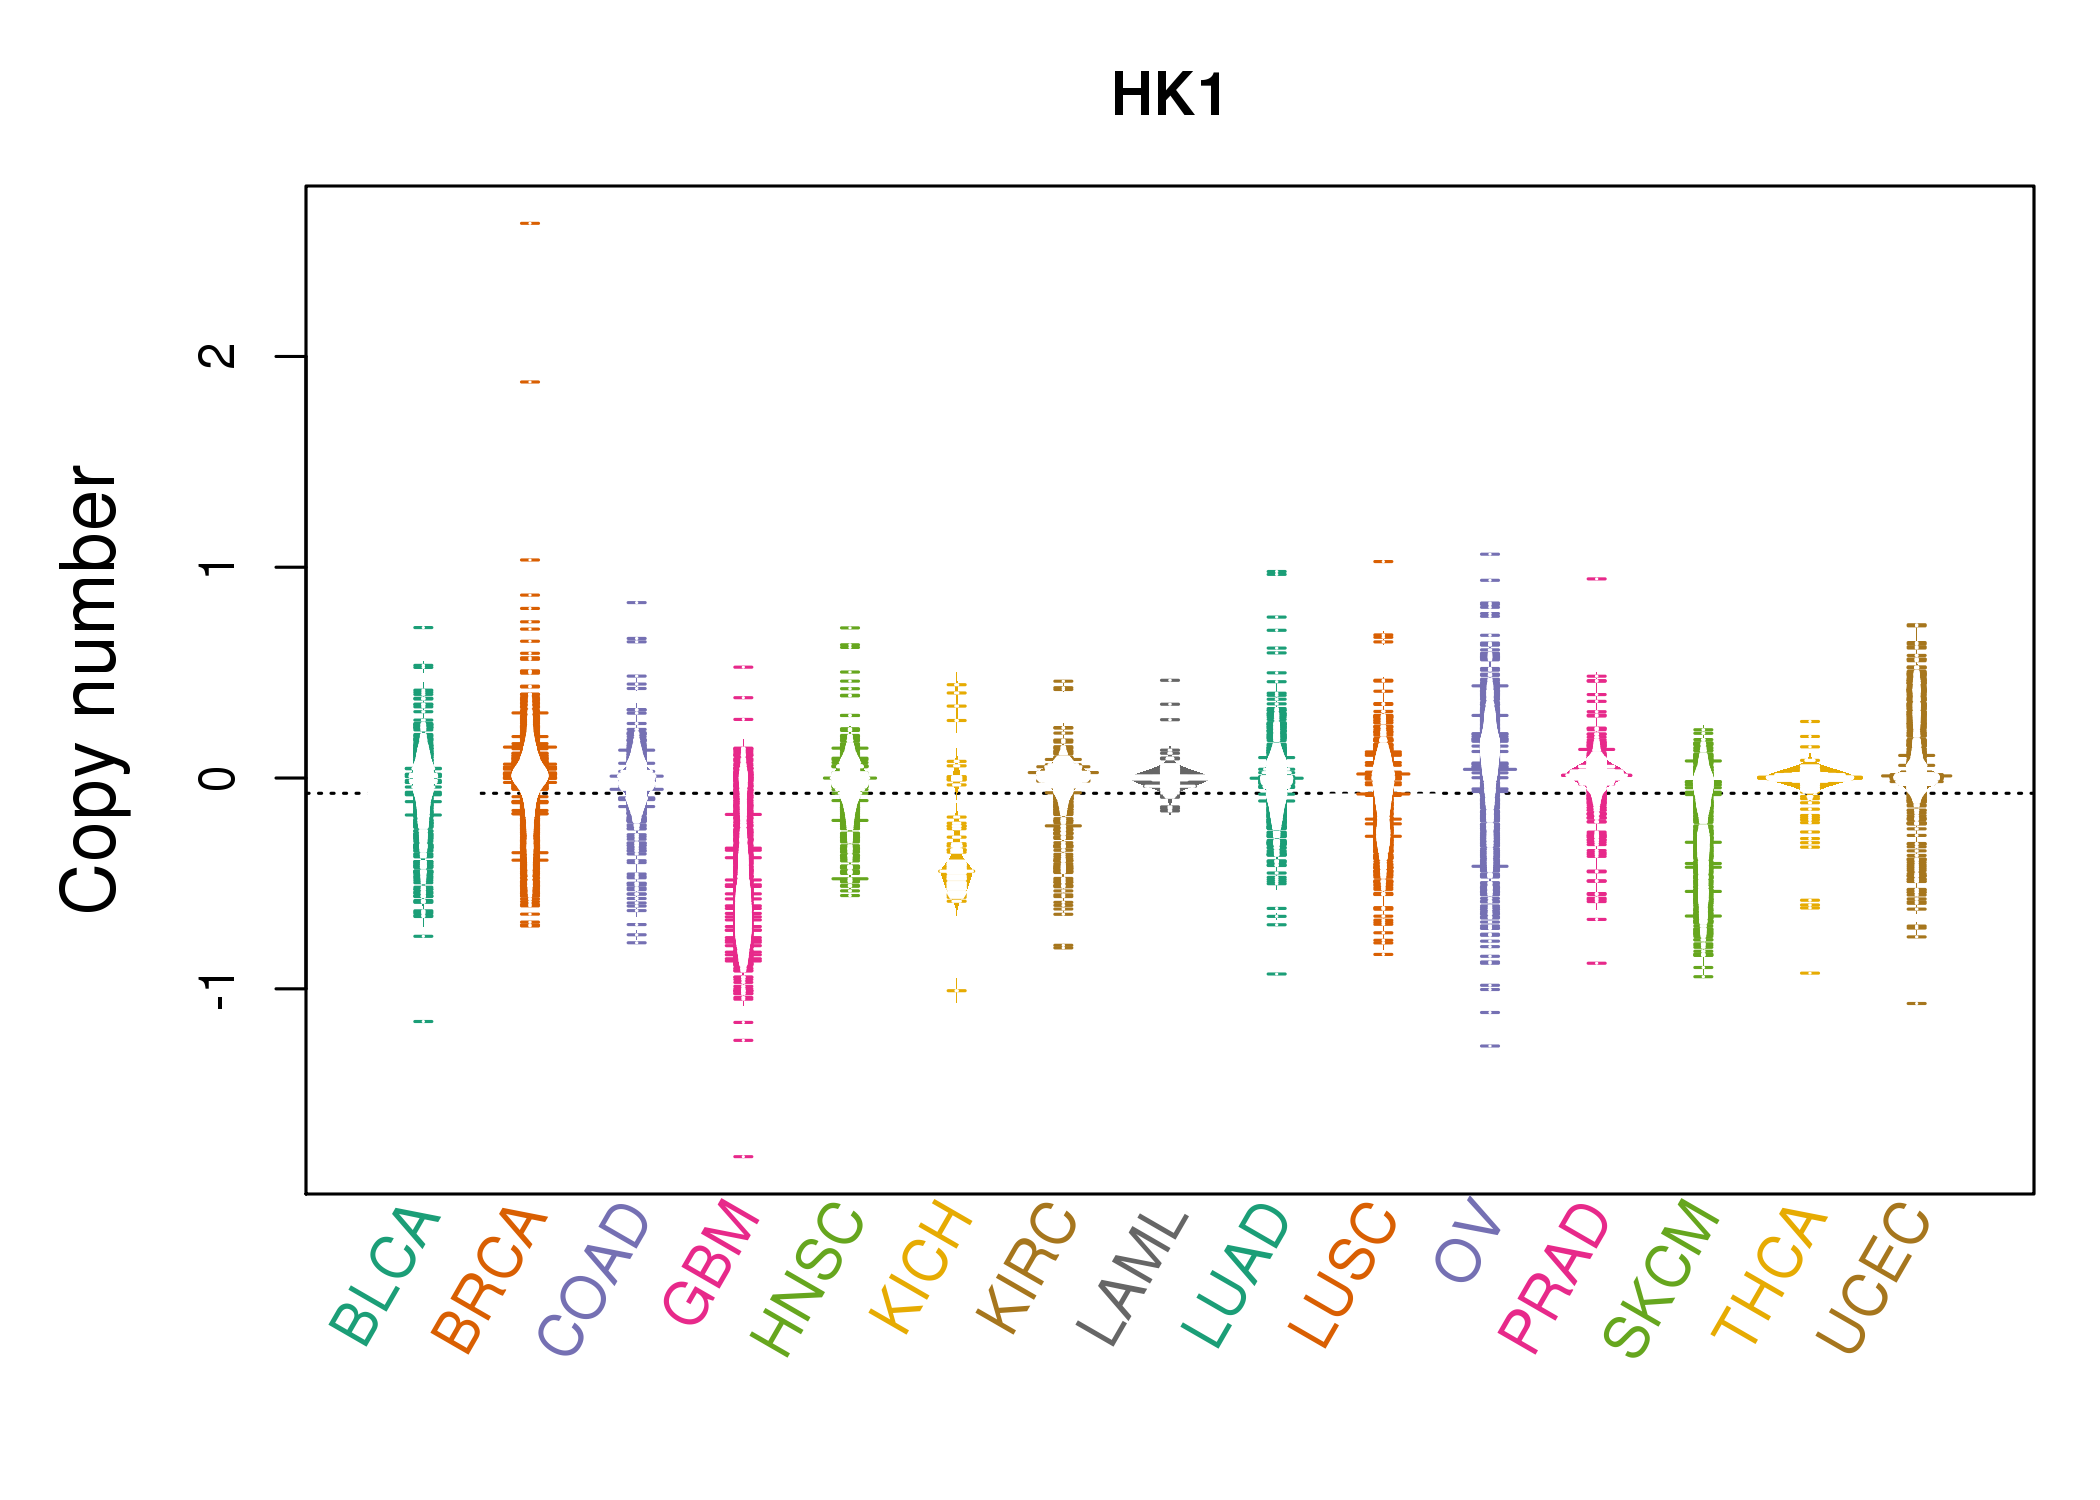 |
| cf) Tissue ID[Tissue type]: BLCA[Bladder Urothelial Carcinoma], BRCA[Breast invasive carcinoma], CESC[Cervical squamous cell carcinoma and endocervical adenocarcinoma], COAD[Colon adenocarcinoma], GBM[Glioblastoma multiforme], Glioma Low Grade, HNSC[Head and Neck squamous cell carcinoma], KICH[Kidney Chromophobe], KIRC[Kidney renal clear cell carcinoma], KIRP[Kidney renal papillary cell carcinoma], LAML[Acute Myeloid Leukemia], LUAD[Lung adenocarcinoma], LUSC[Lung squamous cell carcinoma], OV[Ovarian serous cystadenocarcinoma ], PAAD[Pancreatic adenocarcinoma], PRAD[Prostate adenocarcinoma], SKCM[Skin Cutaneous Melanoma], STAD[Stomach adenocarcinoma], THCA[Thyroid carcinoma], UCEC[Uterine Corpus Endometrial Carcinoma] |
| Top |
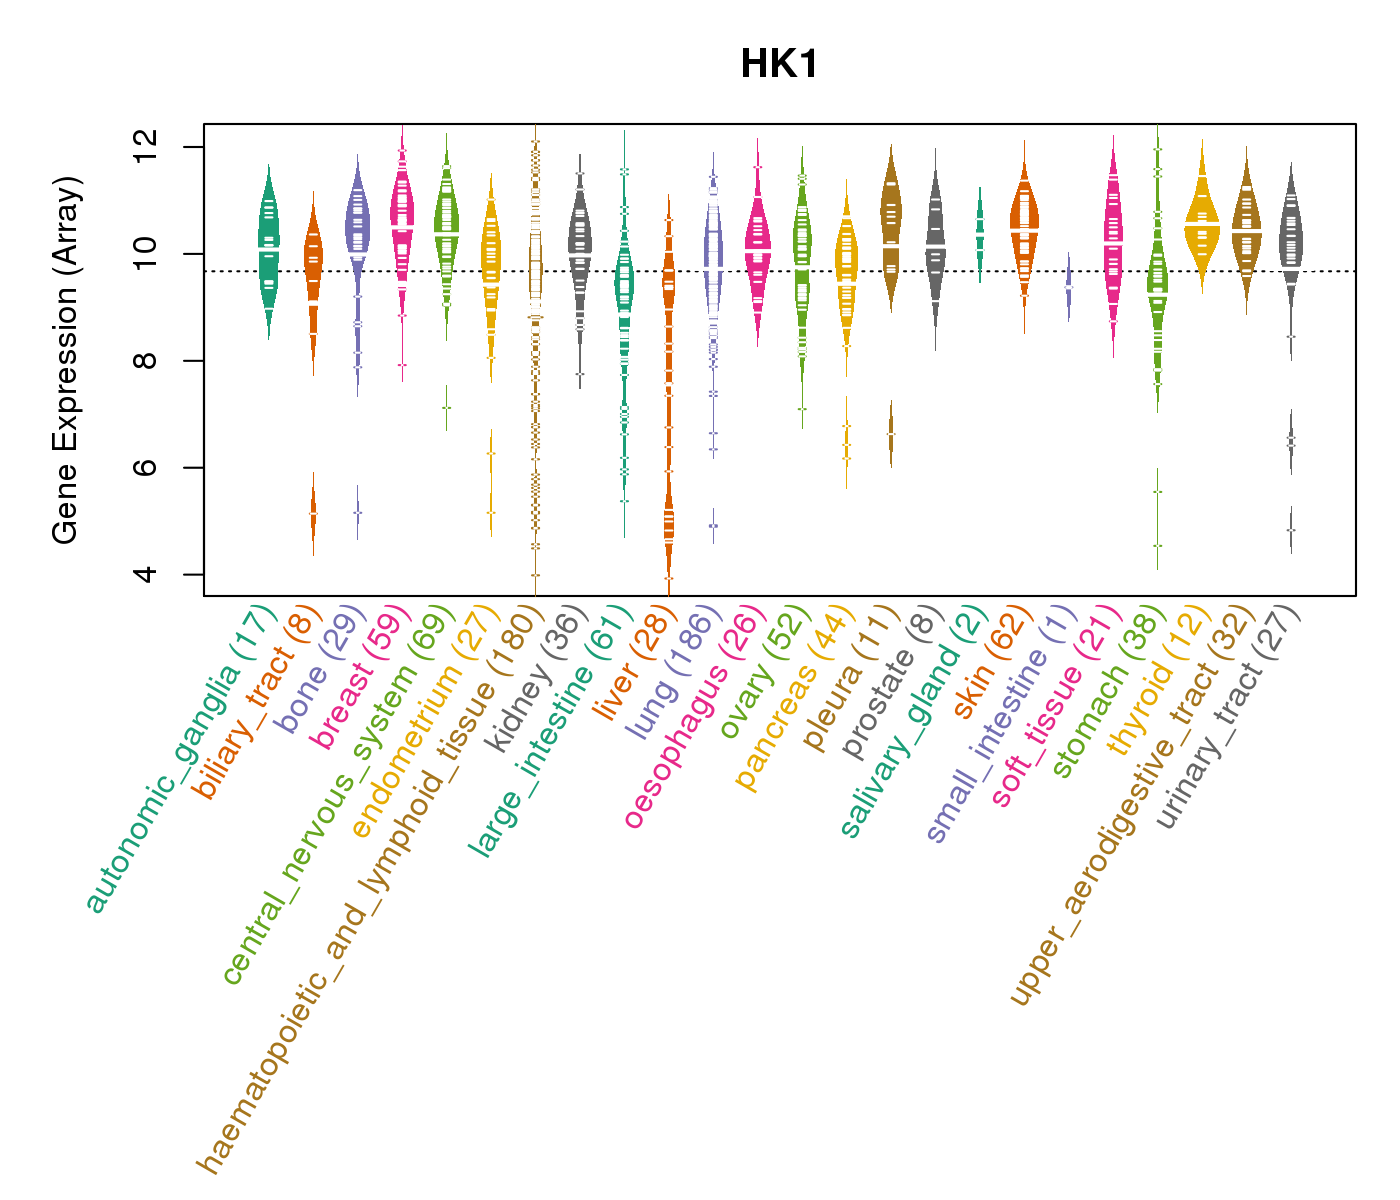
| Gene Expression for HK1 |
| * CCLE gene expression data were extracted from CCLE_Expression_Entrez_2012-10-18.res: Gene-centric RMA-normalized mRNA expression data. |
 |
| * Normalized gene expression data of RNASeqV2 was extracted from TCGA using R package TCGA-Assembler. The URLs of all public data files on TCGA DCC data server were gathered at Jan-05-2015. Only eight cancer types have enough normal control samples for differential expression analysis. (t test, adjusted p<0.05 (using Benjamini-Hochberg FDR)) |
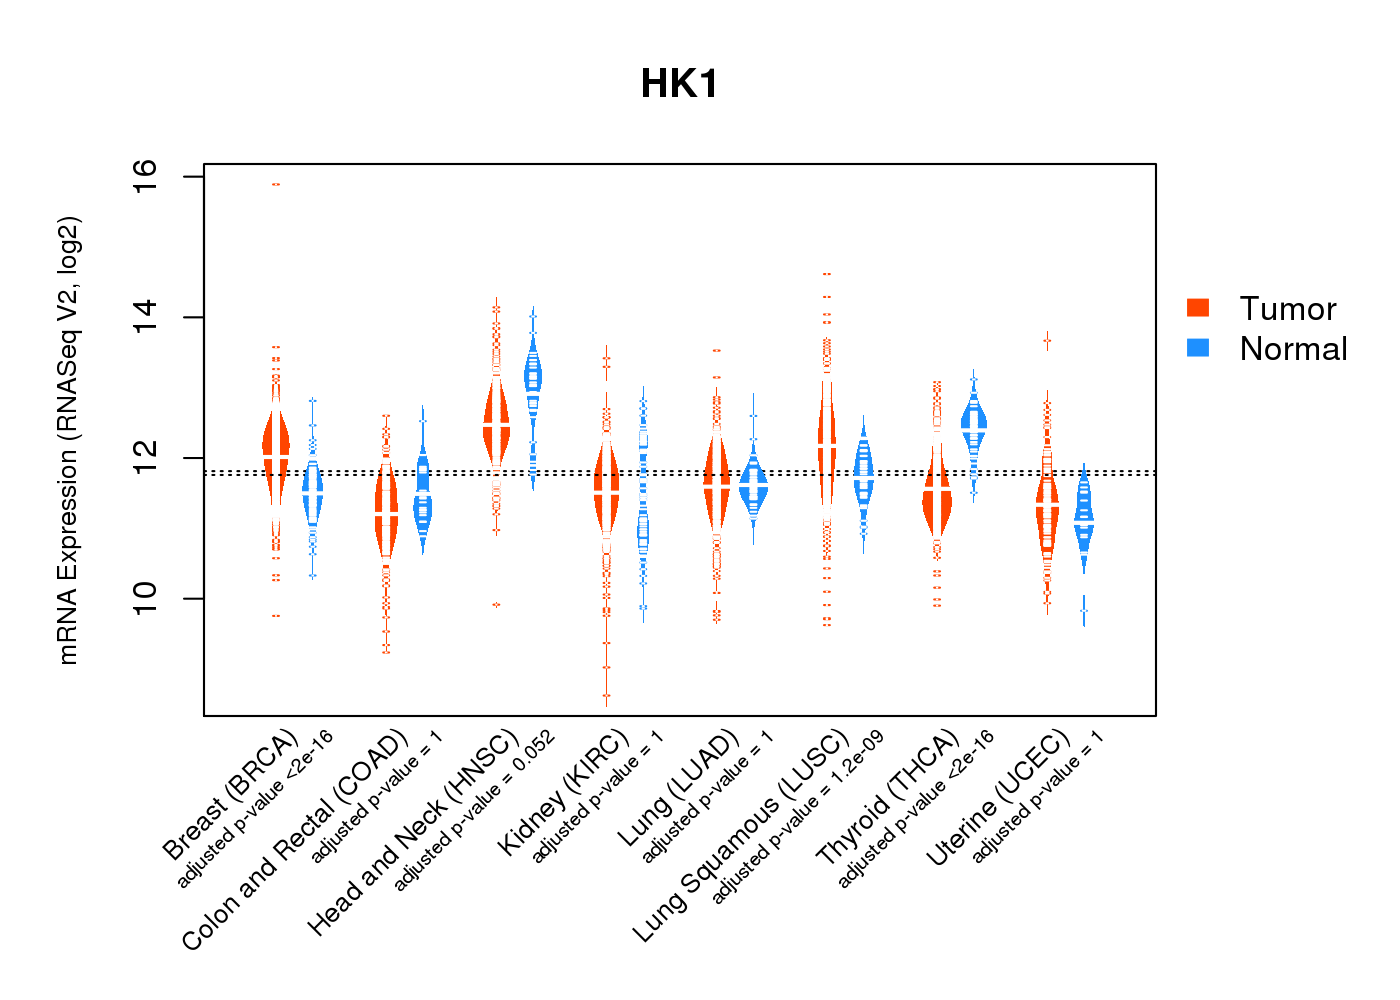 |
| Top |
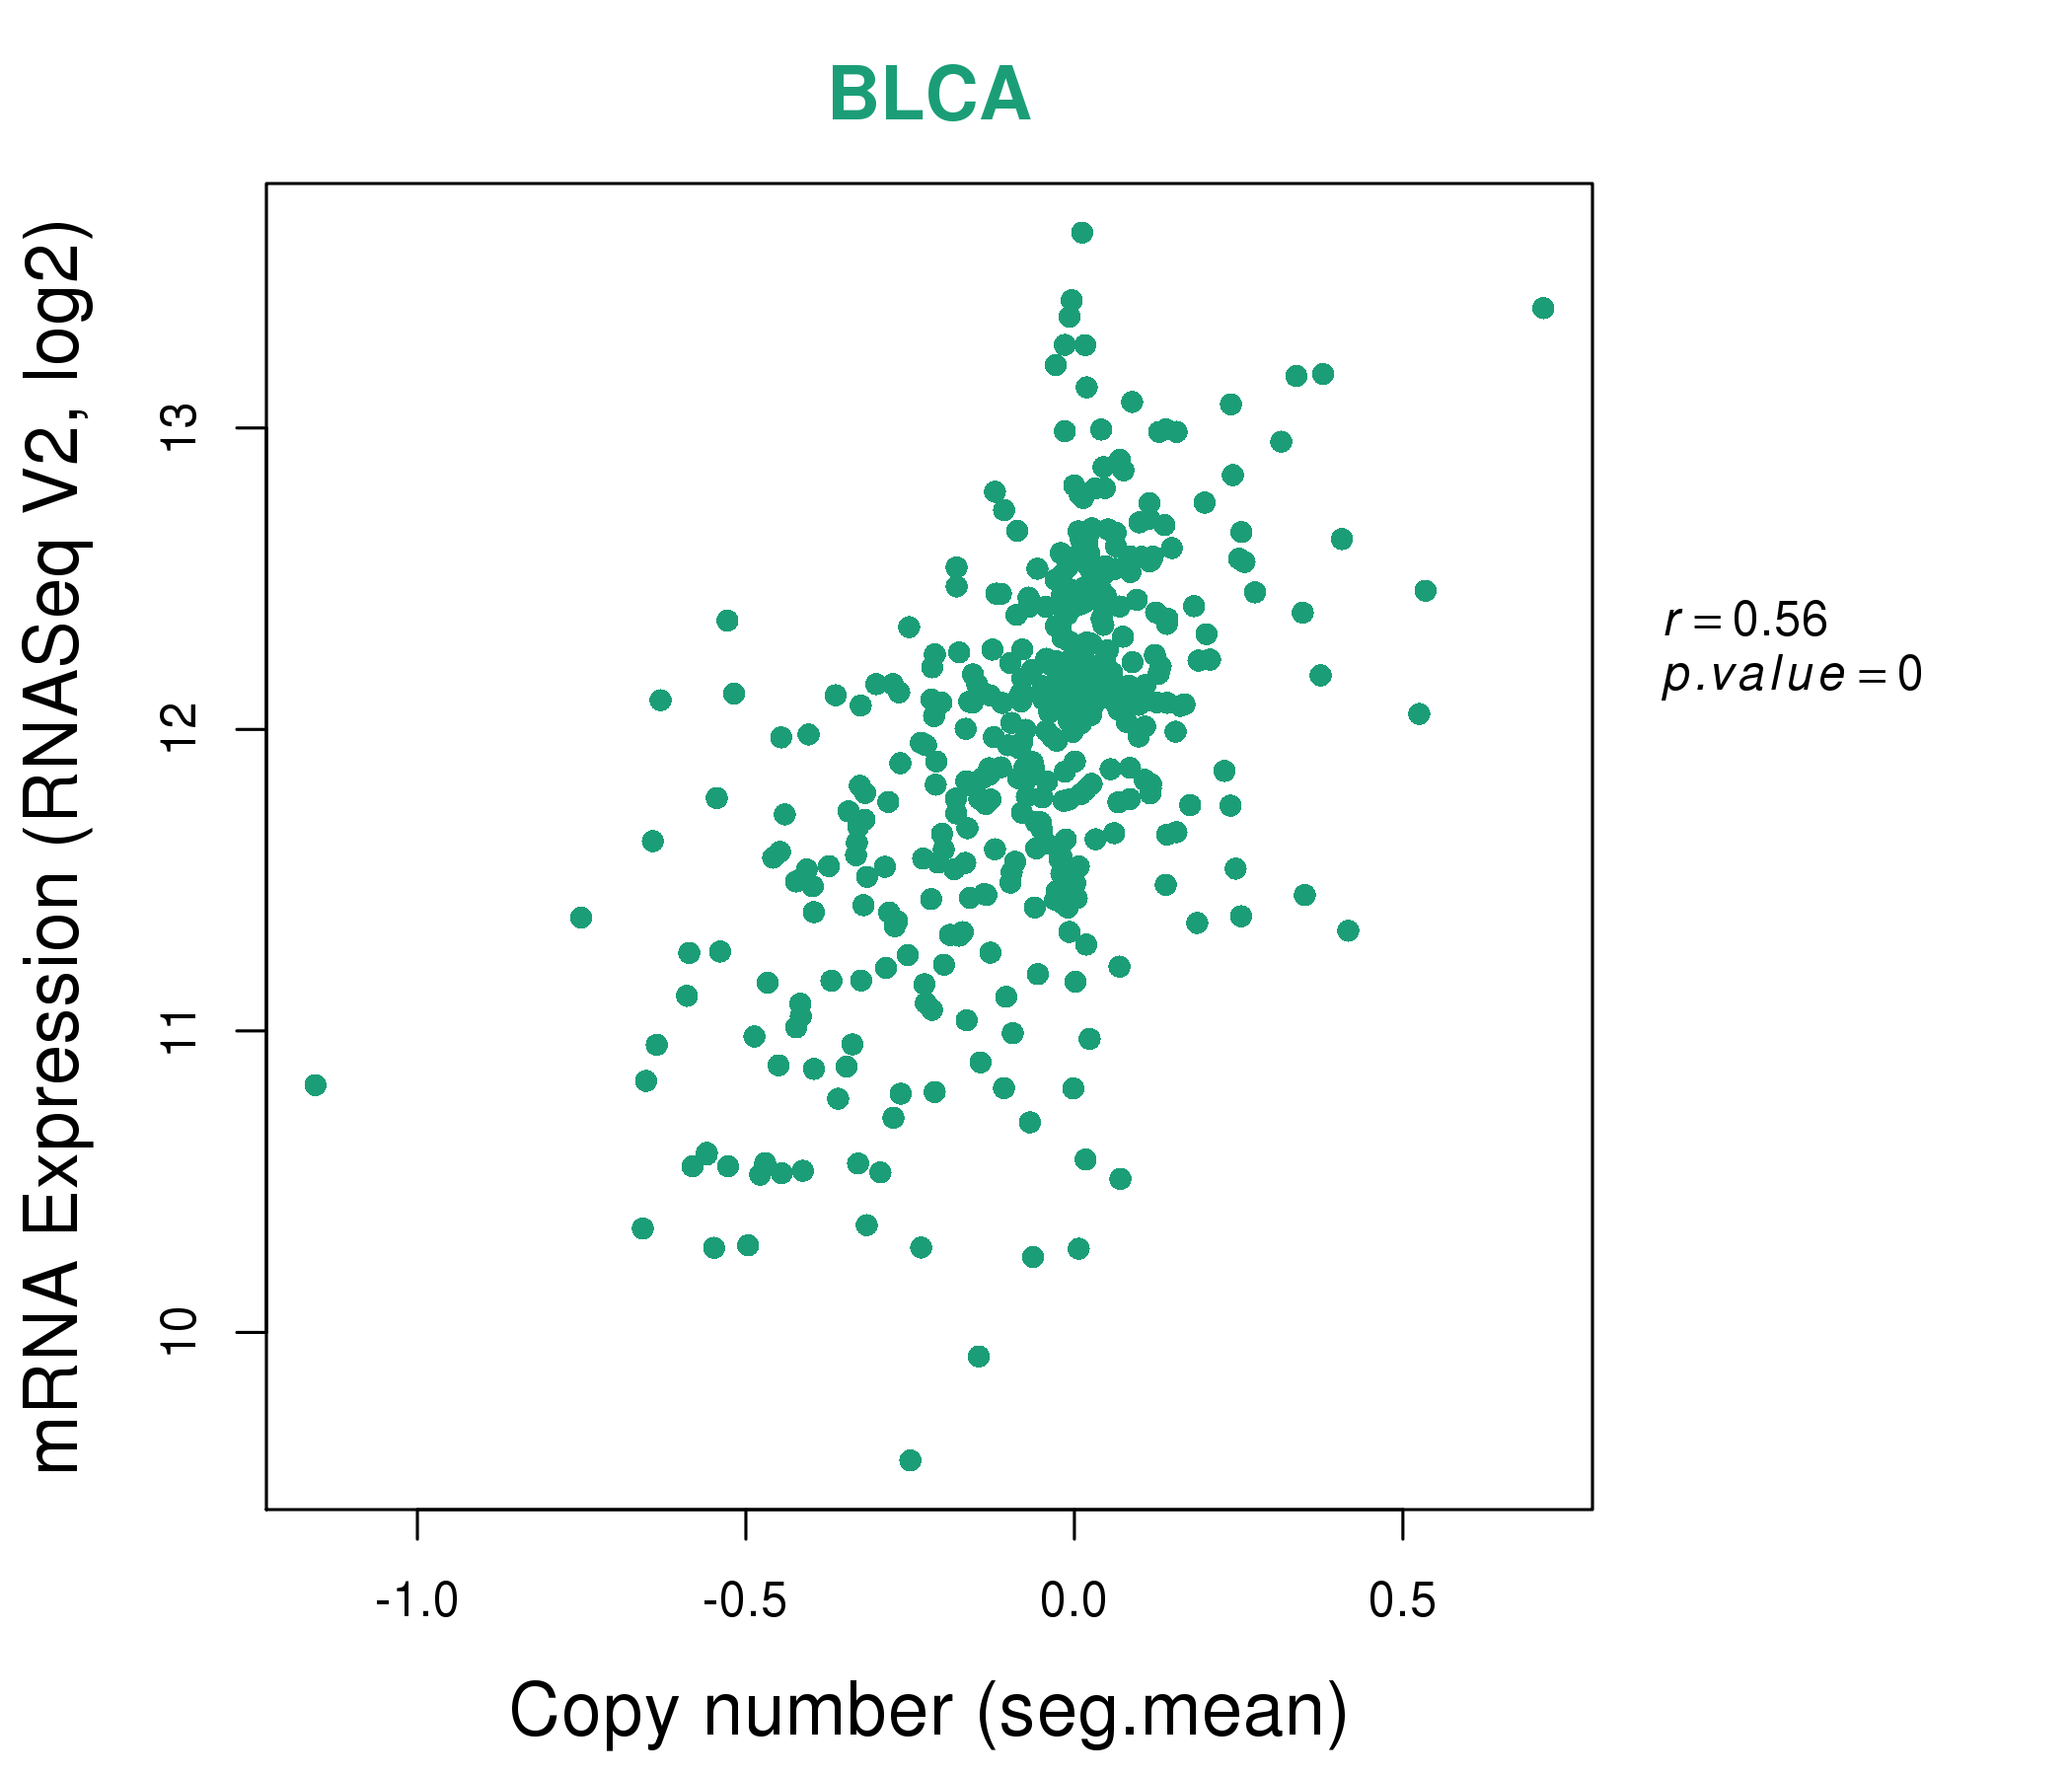
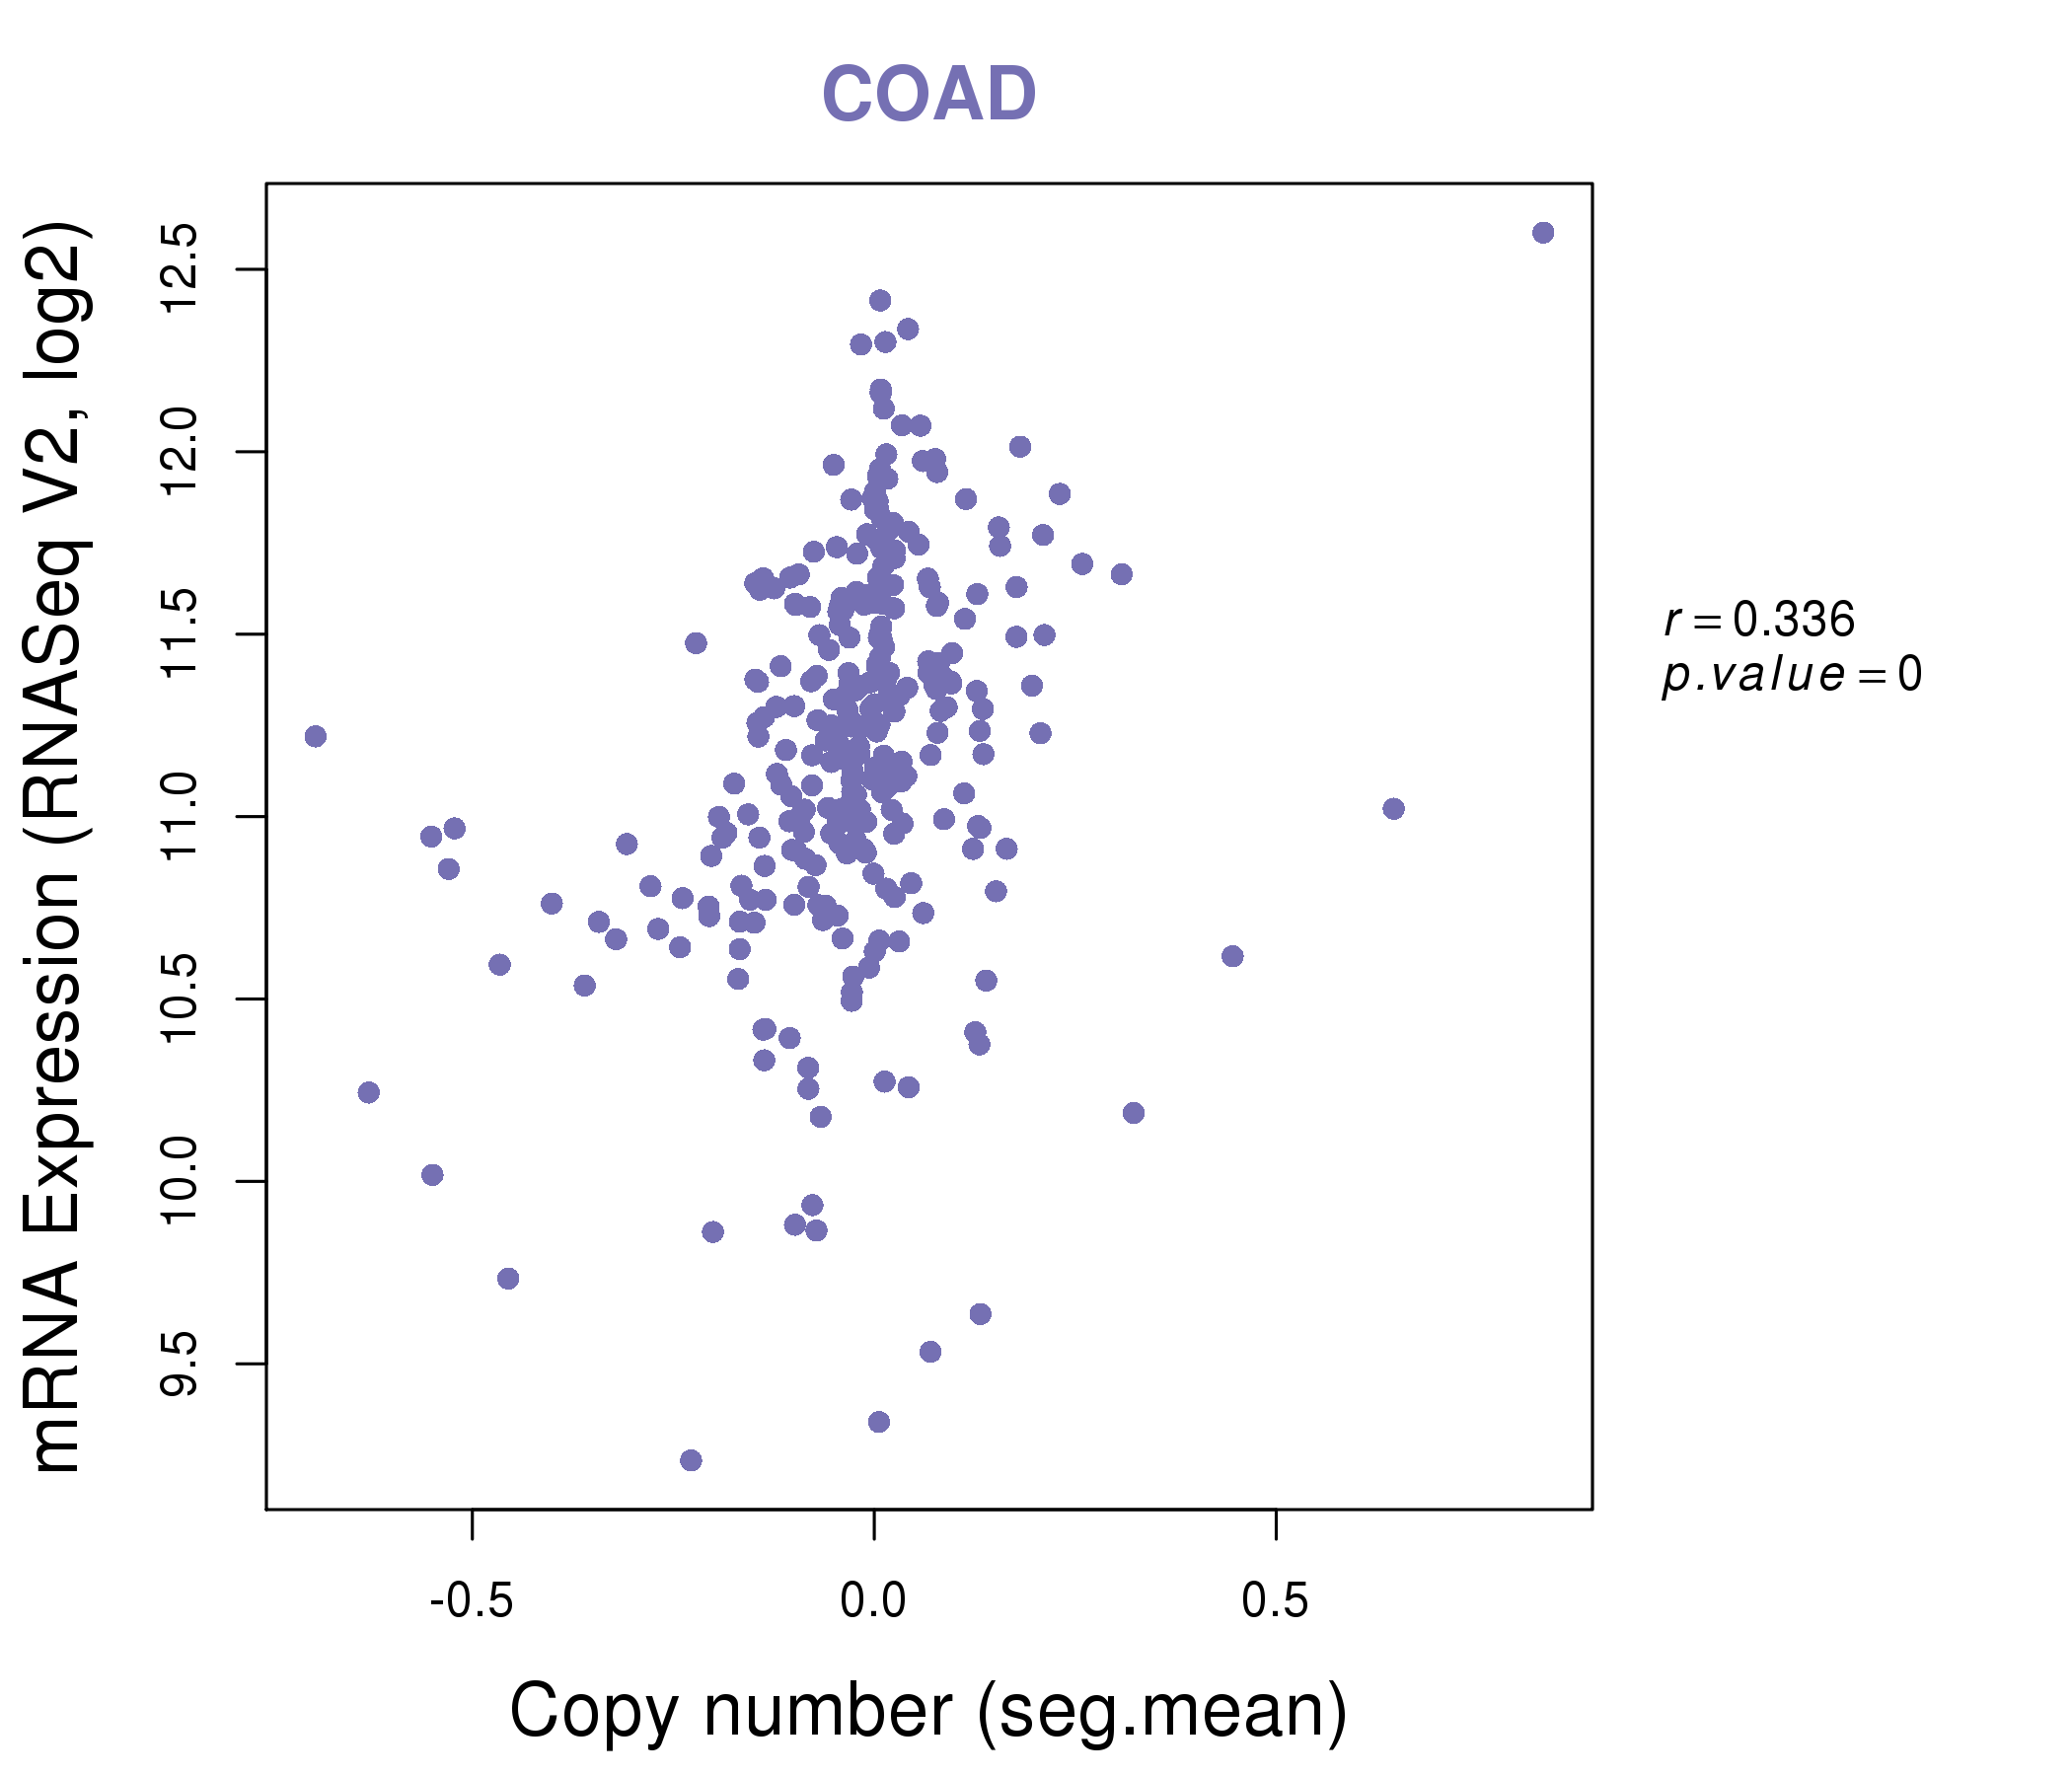
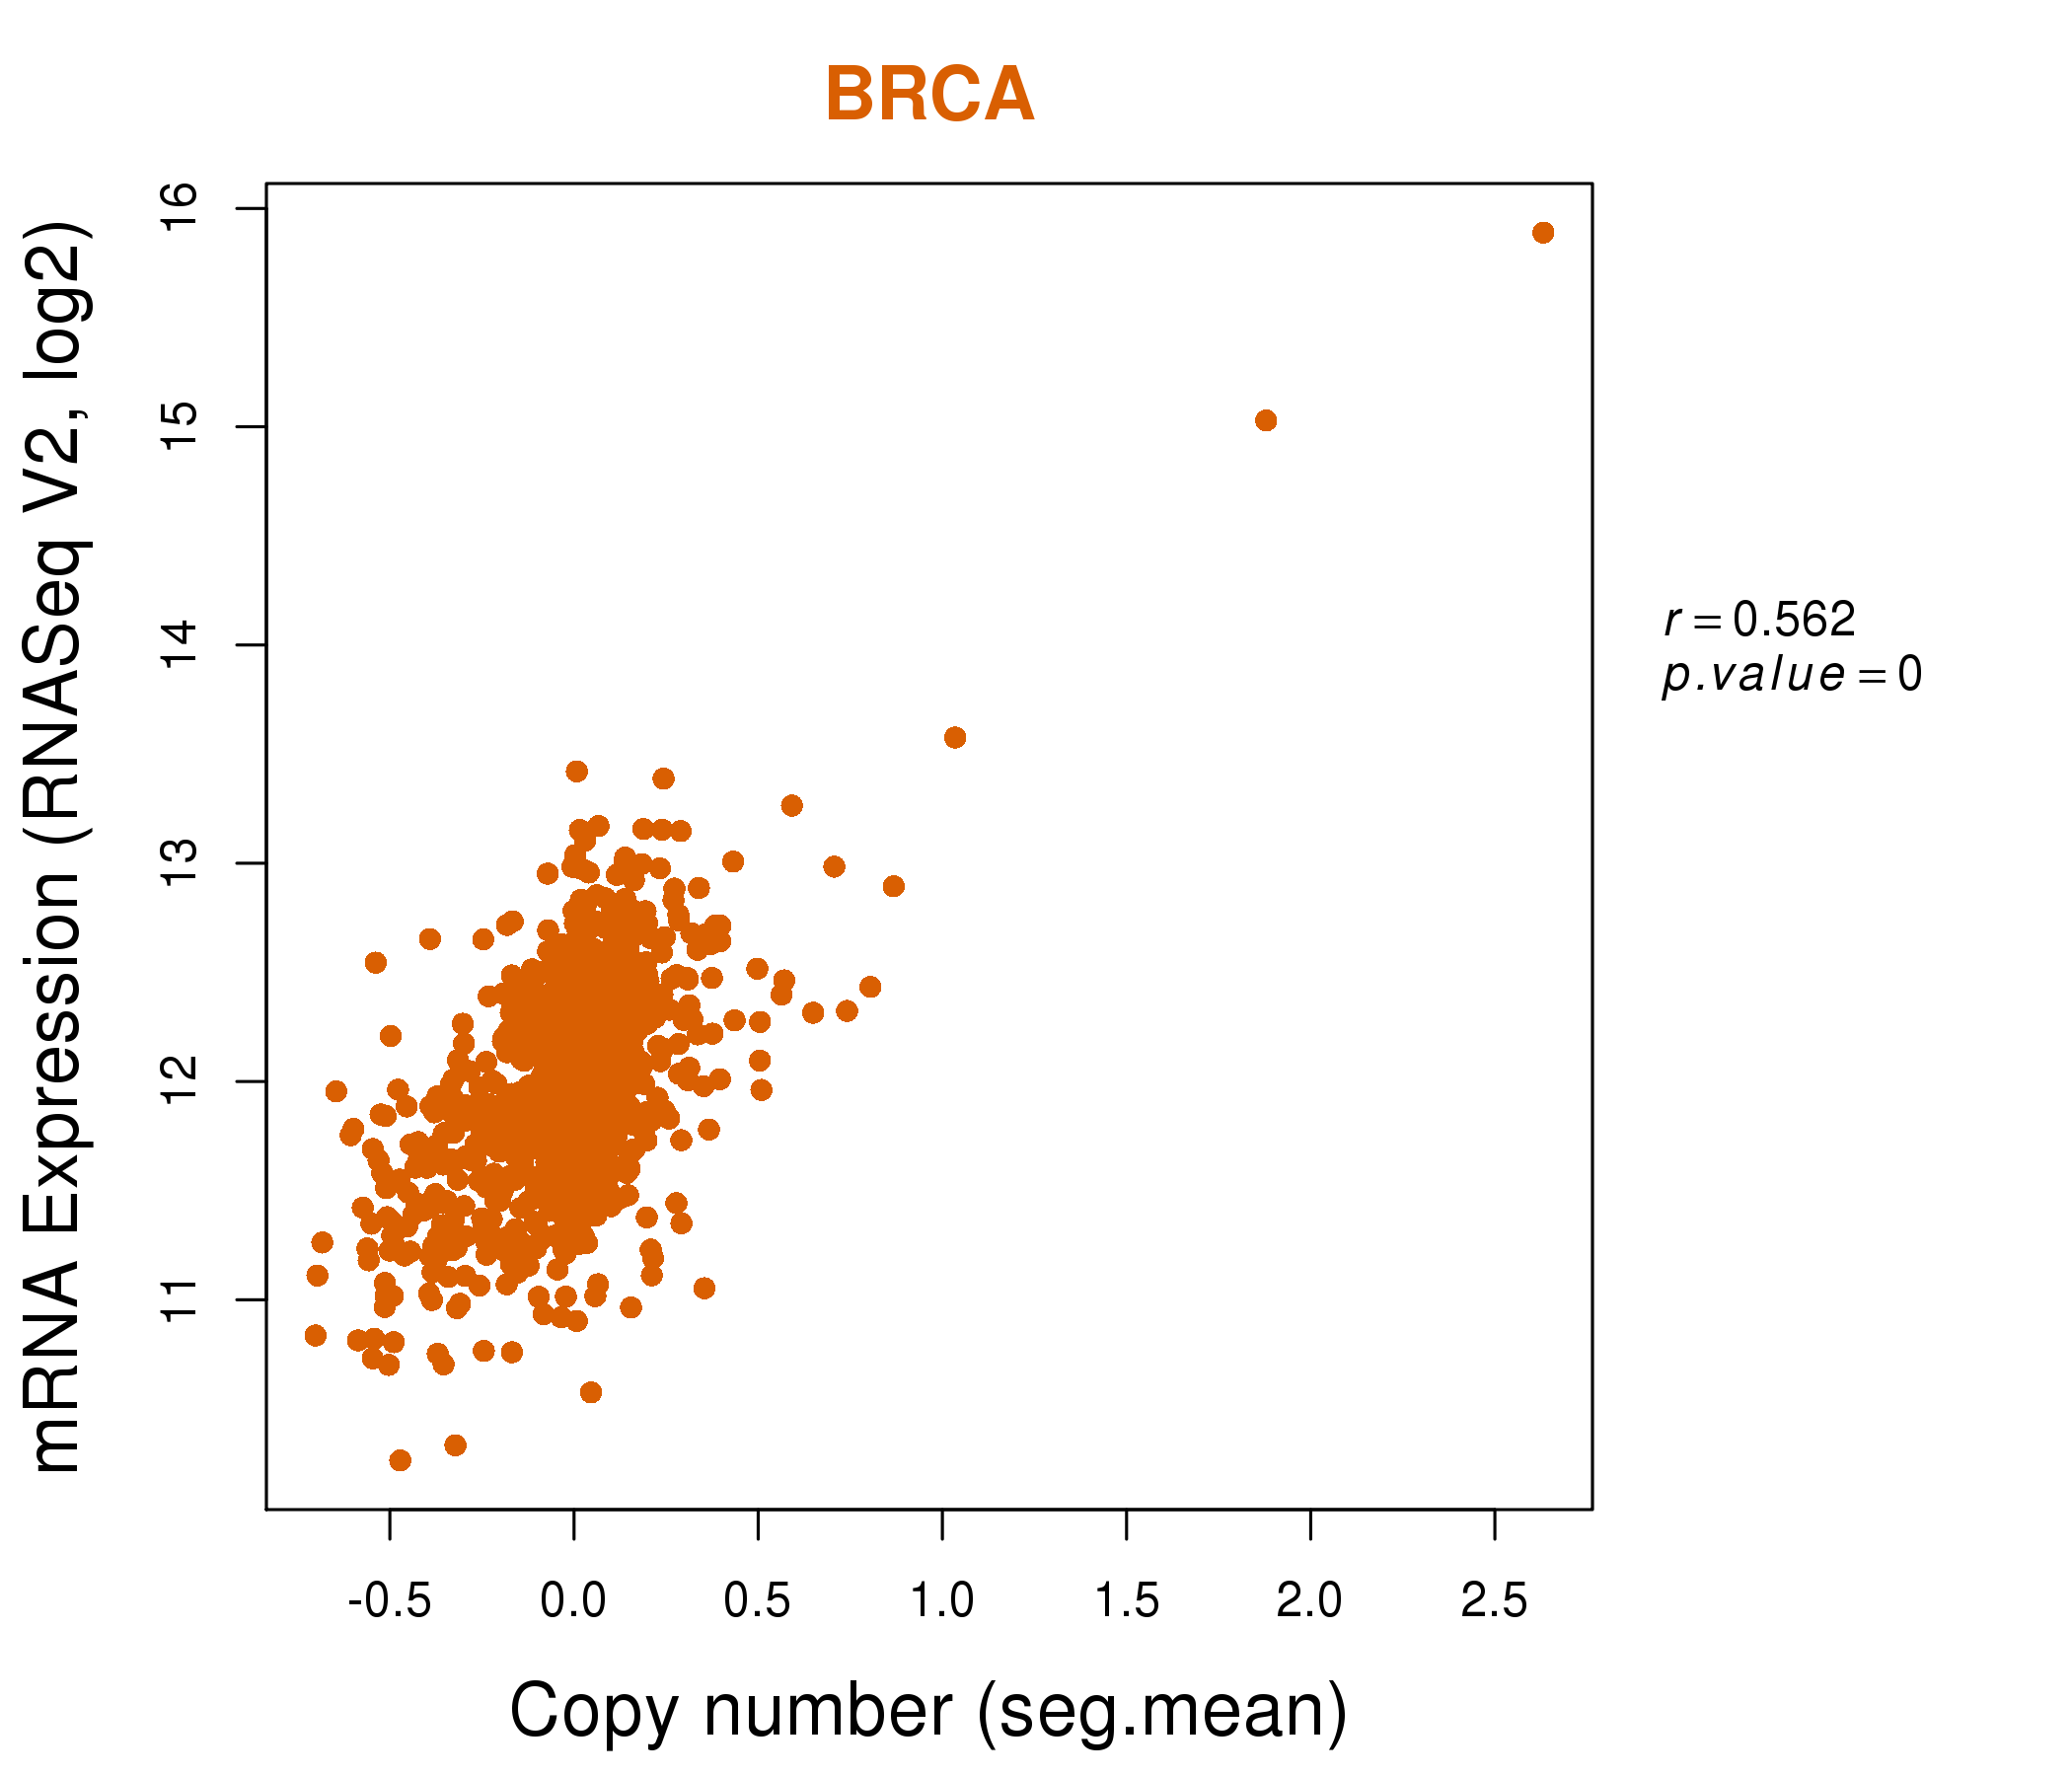
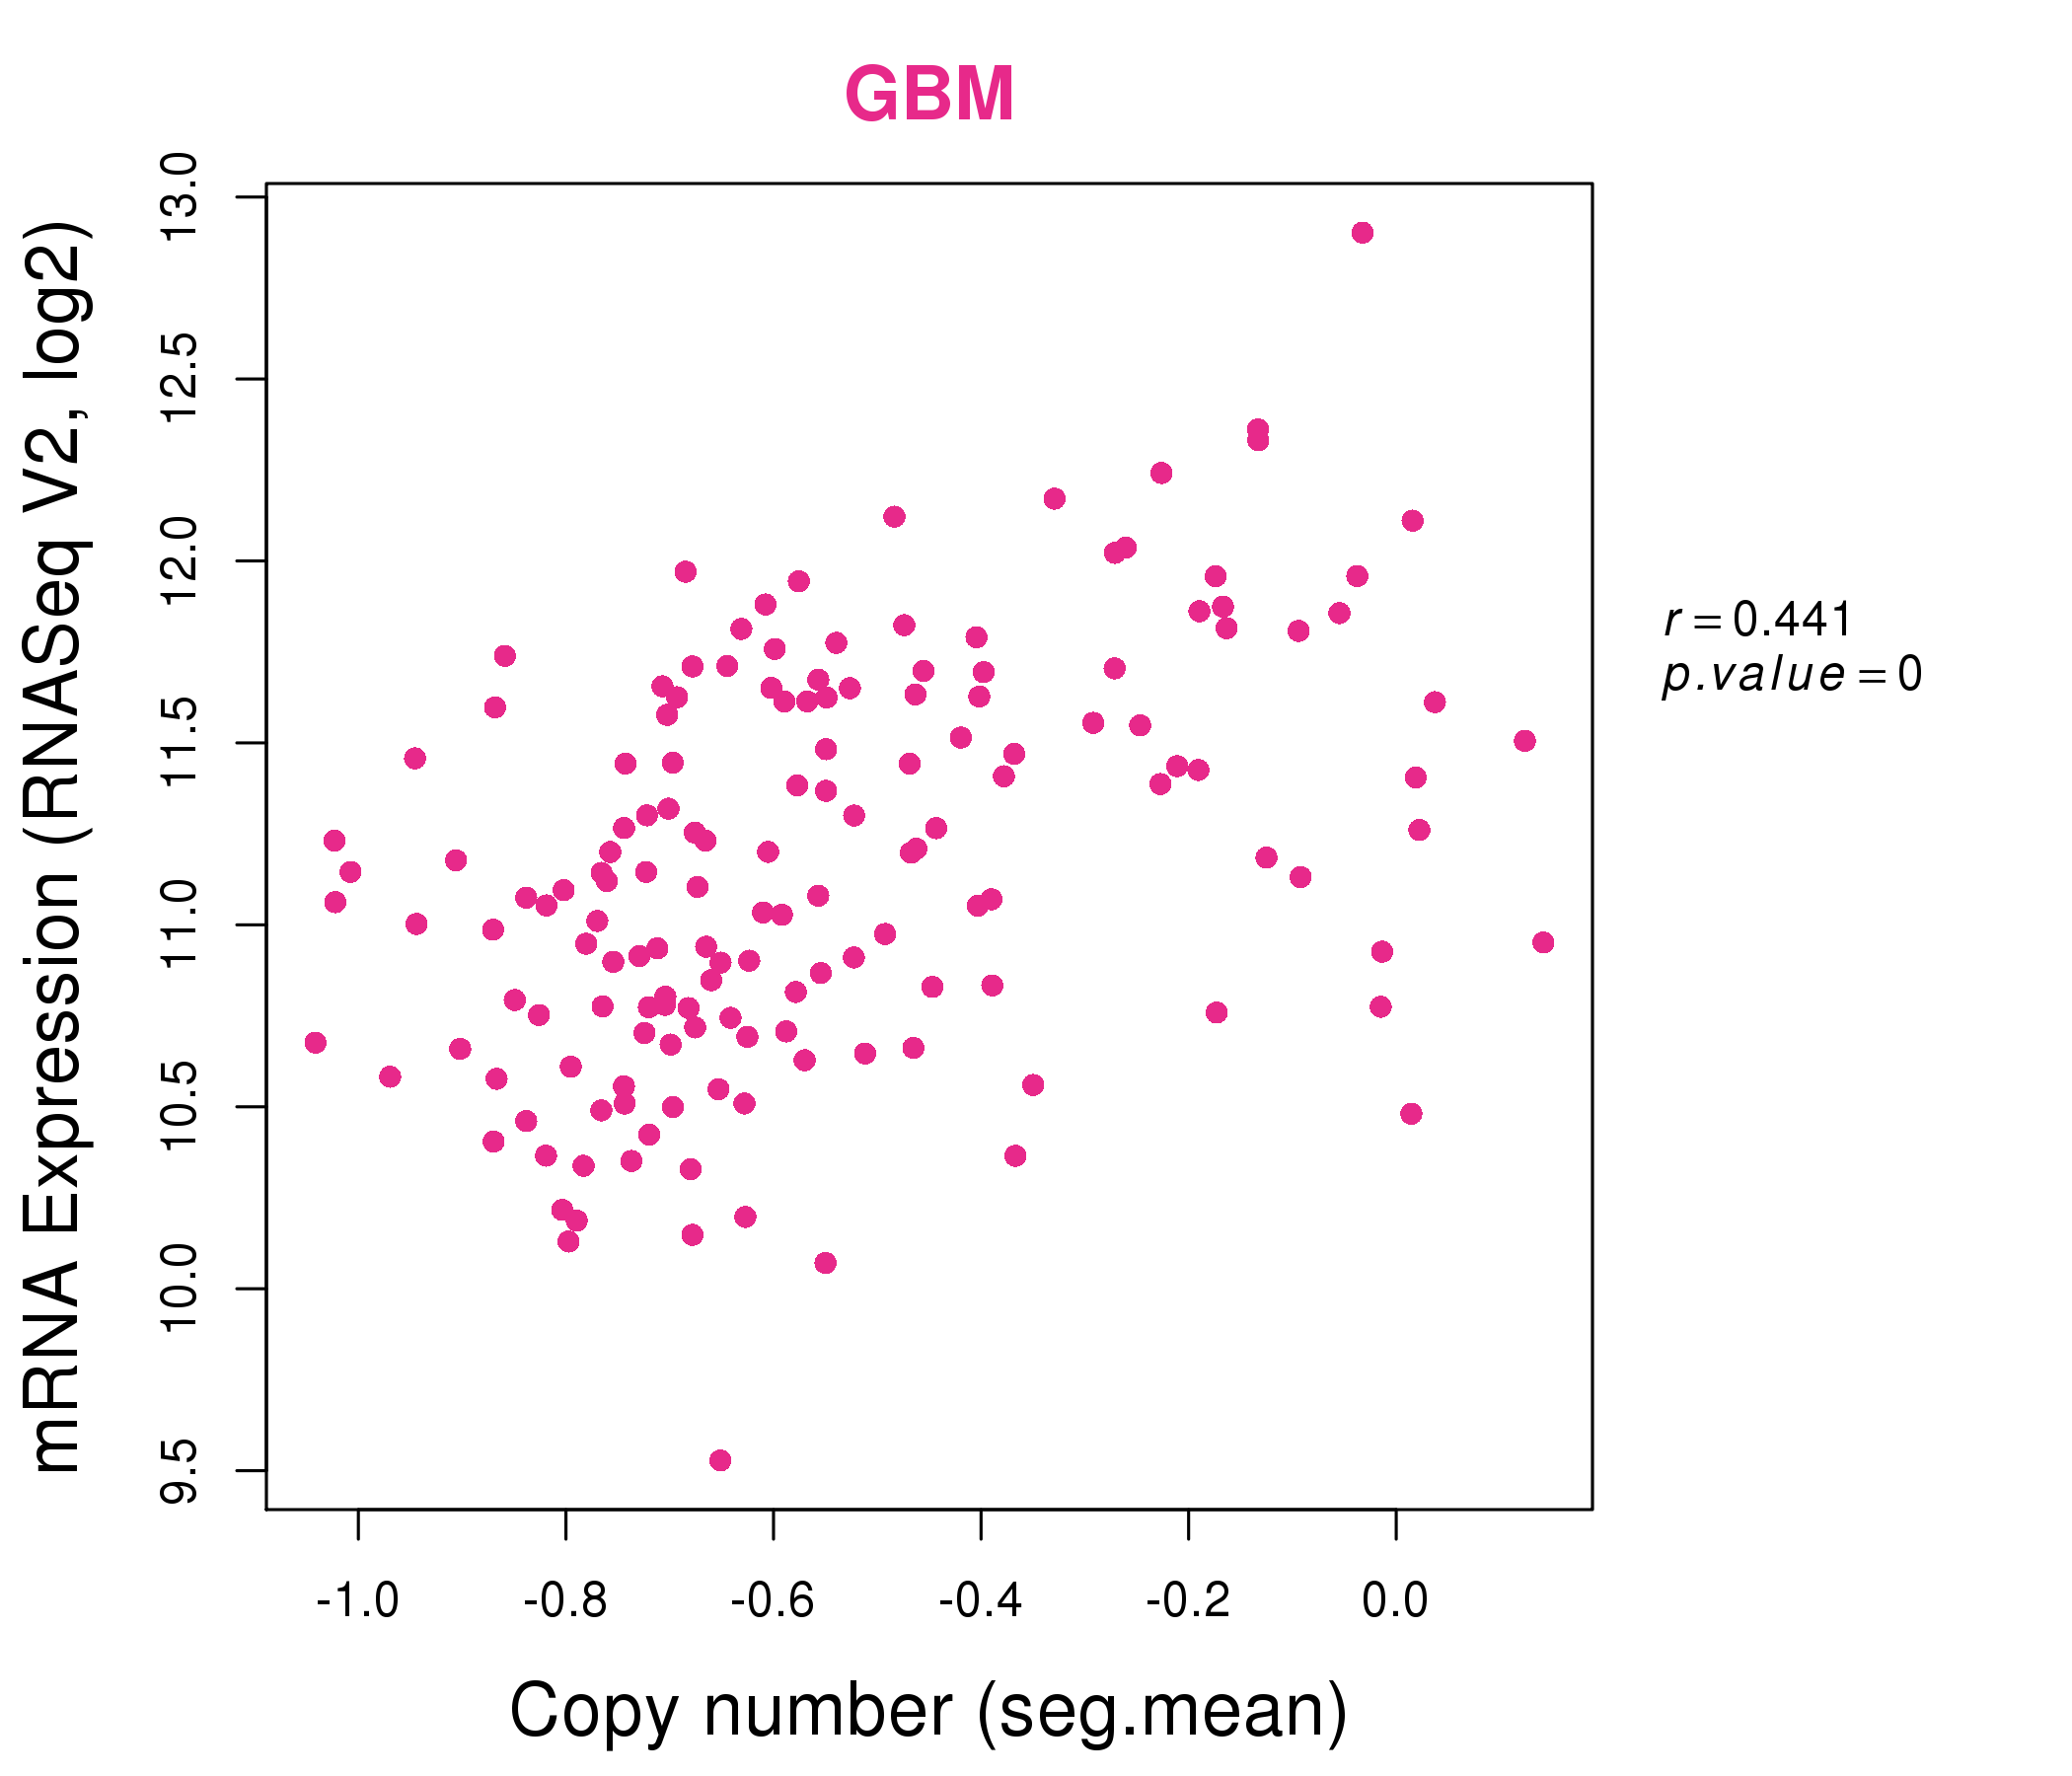
| * This plots show the correlation between CNV and gene expression. |
: Open all plots for all cancer types
 |
|
 |
|
| Top |
| Gene-Gene Network Information |
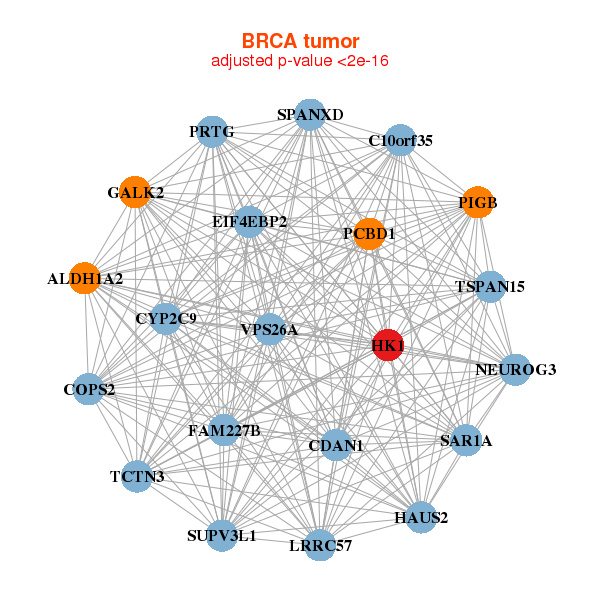
| * Co-Expression network figures were drawn using R package igraph. Only the top 20 genes with the highest correlations were shown. Red circle: input gene, orange circle: cell metabolism gene, sky circle: other gene |
: Open all plots for all cancer types
 |
| ||||
| ALDH1A2,C10orf35,FAM227B,CDAN1,COPS2,CYP2C9,EIF4EBP2, GALK2,HAUS2,HK1,LRRC57,NEUROG3,PCBD1,PIGB, PRTG,SAR1A,SPANXD,SUPV3L1,TCTN3,TSPAN15,VPS26A | ABCF2,ABCF3,APEH,ATPAF2,ATPIF1,DCAF11,GPRC5C, HK1,KCNJ11,KLC2,MARK4,PKM,PLIN3,PPP2R4, PPP5C,PSMD3,PTGES2,REPIN1,STIP1,UBA1,USP5 | ||||
 |
| ||||
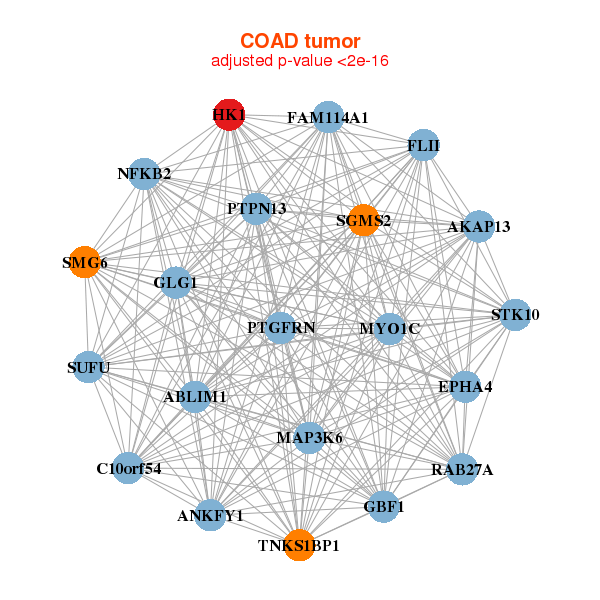
| ABLIM1,AKAP13,ANKFY1,C10orf54,EPHA4,FAM114A1,FLII, GBF1,GLG1,HK1,MAP3K6,MYO1C,NFKB2,PTGFRN, PTPN13,RAB27A,SGMS2,SMG6,STK10,SUFU,TNKS1BP1 | AARS,ACTB,AGPAT4,LINC00346,CDC27,EHBP1L1,GALNT2, HK1,KPNB1,MSN,PHTF1,PPP2R4,RAB3GAP1,RHBDD1, RNGTT,SRP68,STAT5A,TMEM110,TUBB,VCP,WDR82 |
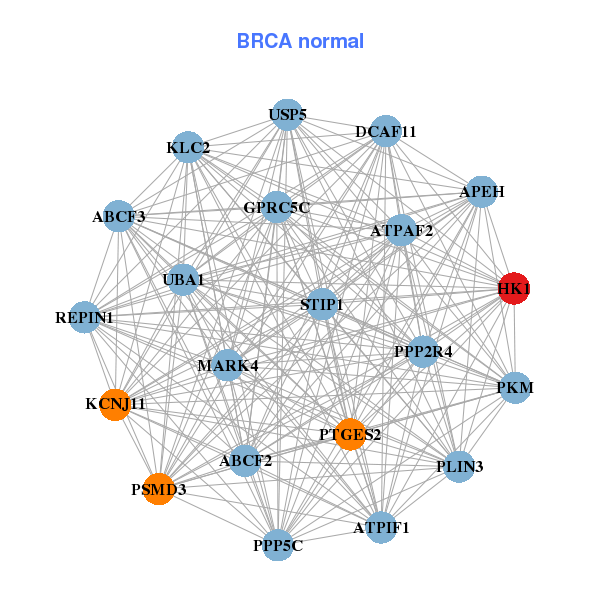
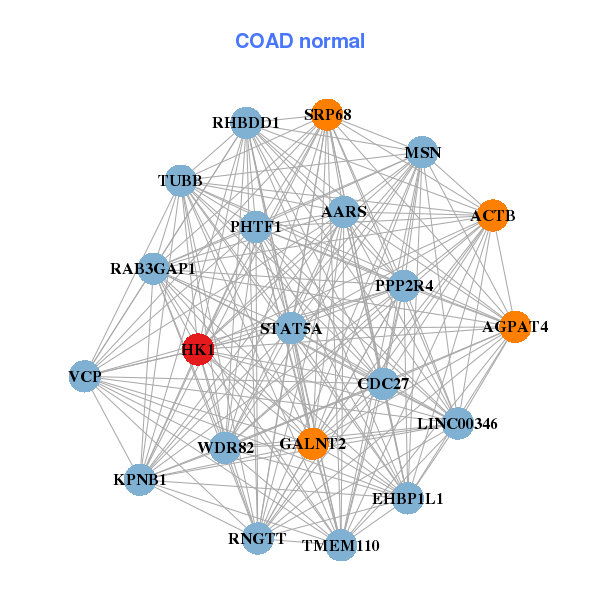
| * Co-Expression network figures were drawn using R package igraph. Only the top 20 genes with the highest correlations were shown. Red circle: input gene, orange circle: cell metabolism gene, sky circle: other gene |
: Open all plots for all cancer types
| Top |
: Open all interacting genes' information including KEGG pathway for all interacting genes from DAVID
| Top |
| Pharmacological Information for HK1 |
| DB Category | DB Name | DB's ID and Url link |
| * Gene Centered Interaction Network. |
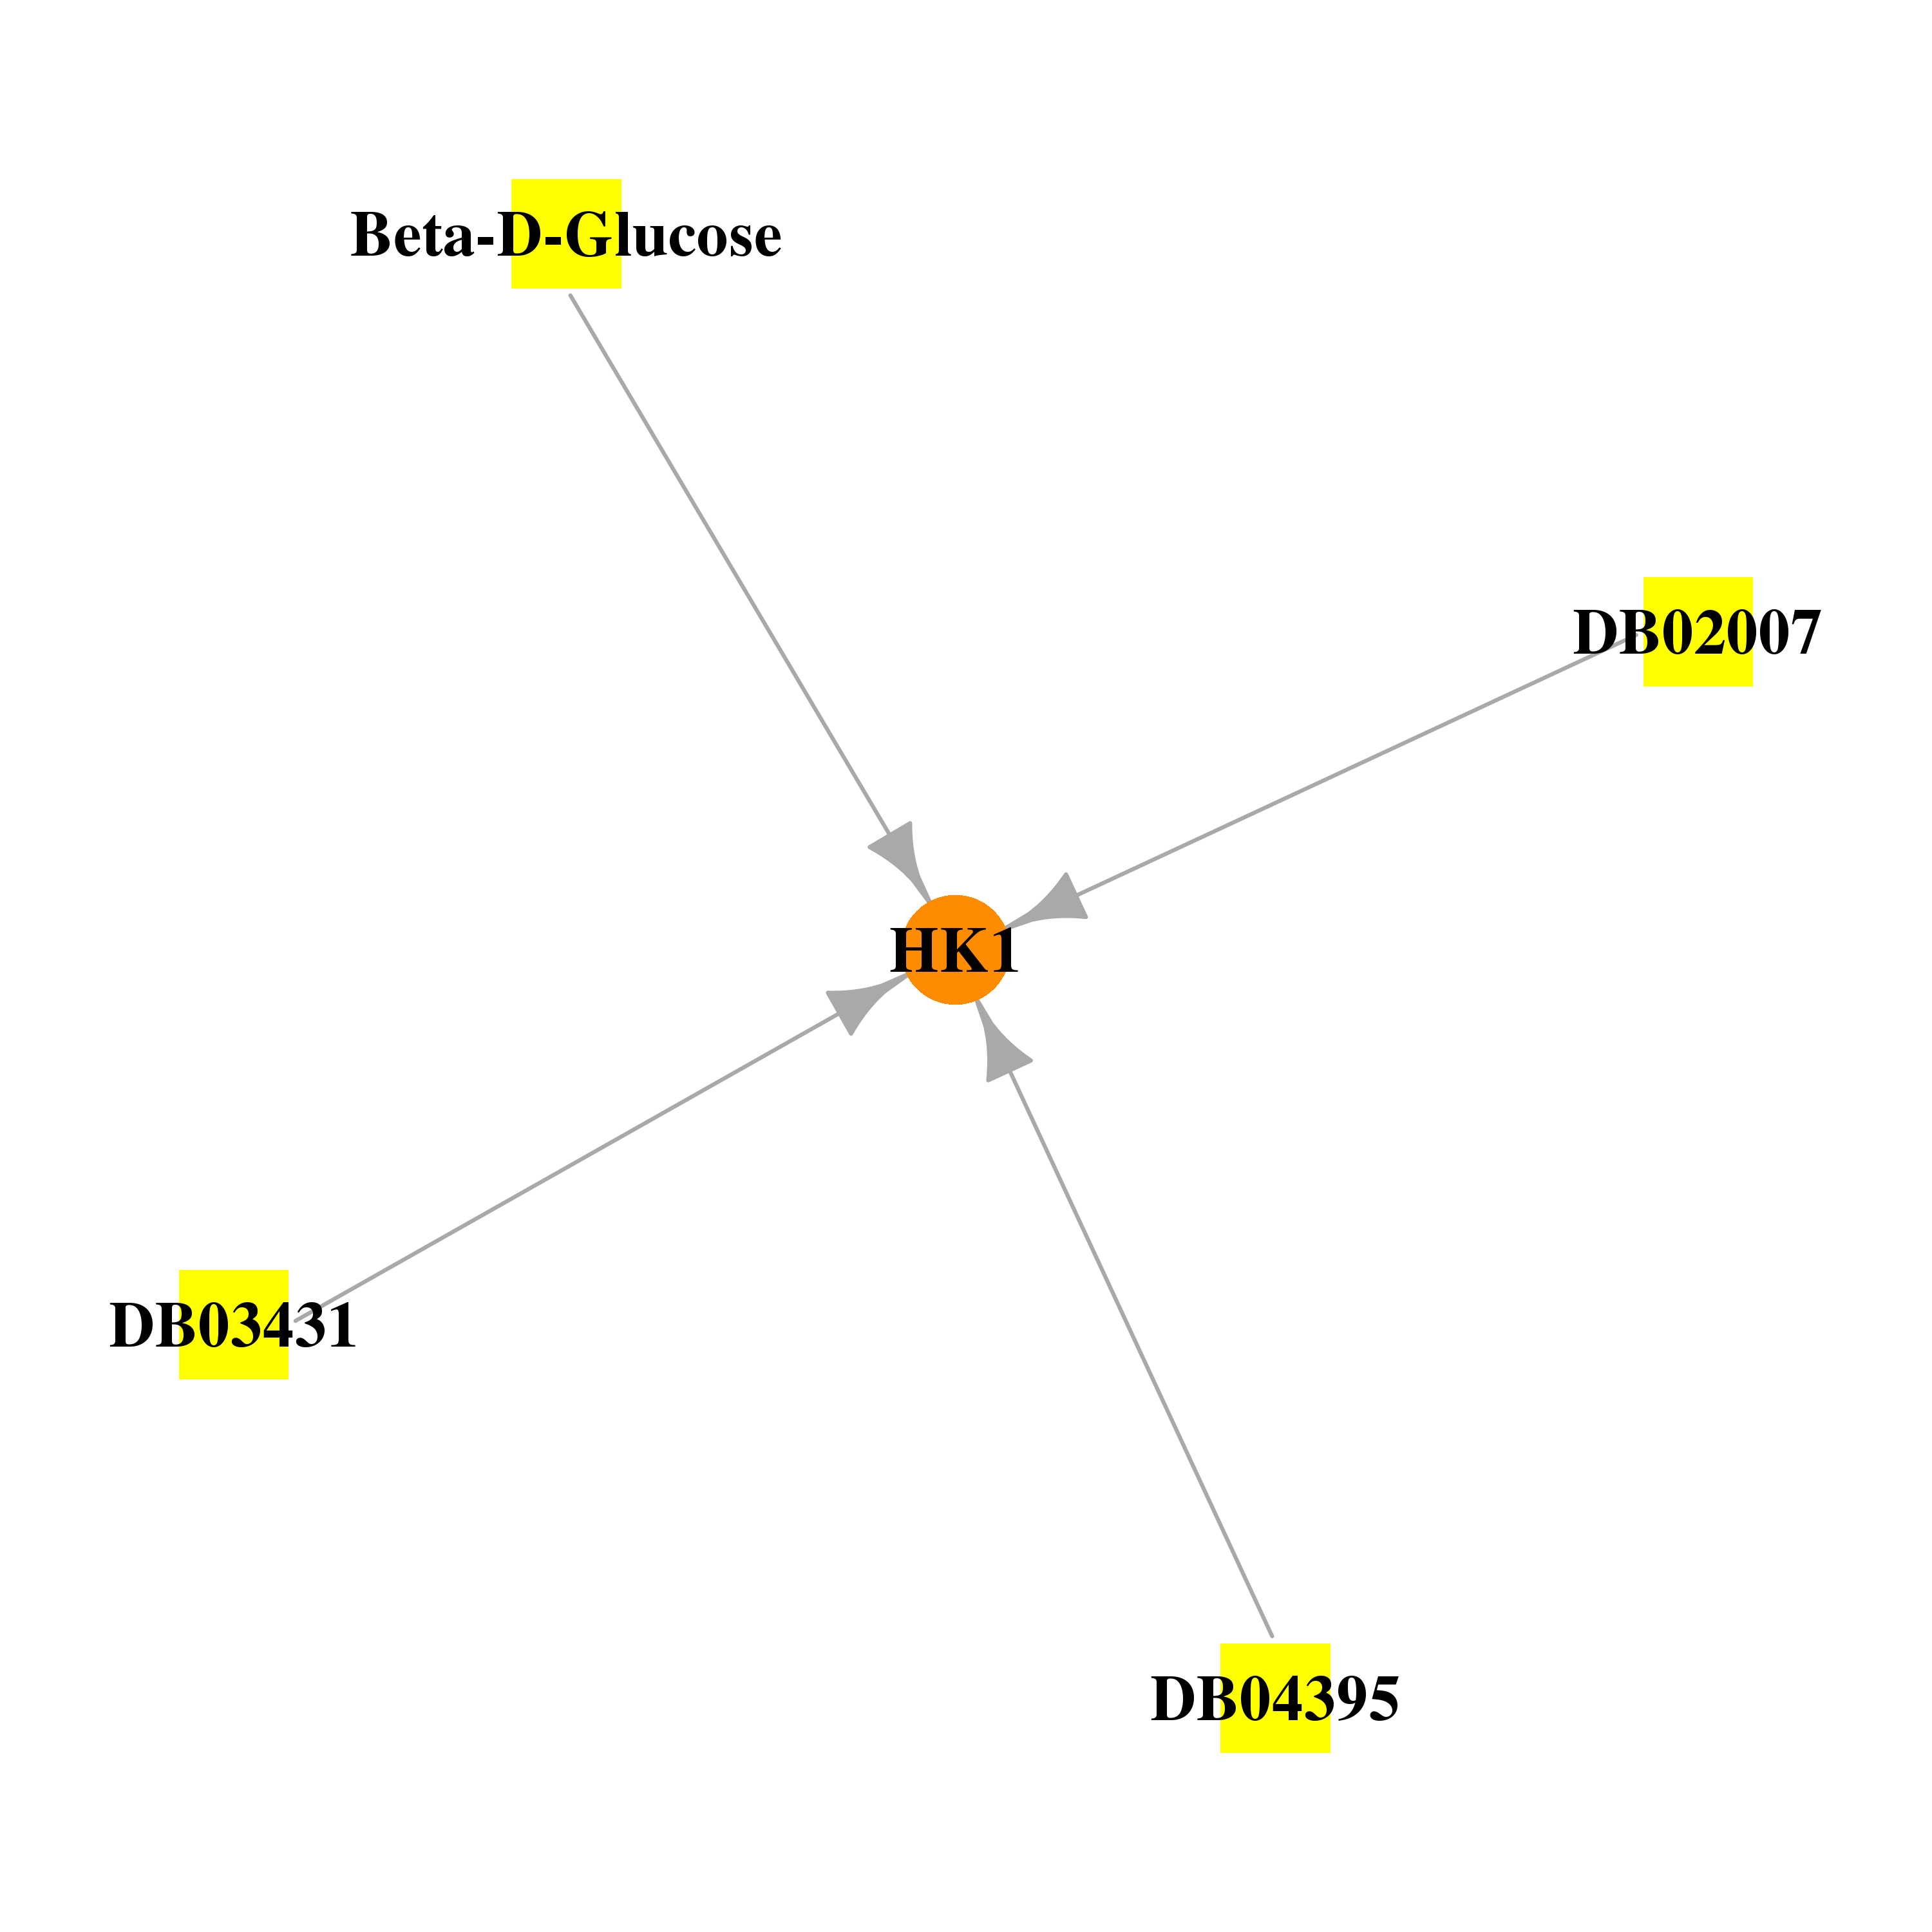 |
| * Drug Centered Interaction Network. |
| DrugBank ID | Target Name | Drug Groups | Generic Name | Drug Centered Network | Drug Structure |
| DB02007 | hexokinase 1 | experimental | Alpha-D-Glucose-6-Phosphate |  | 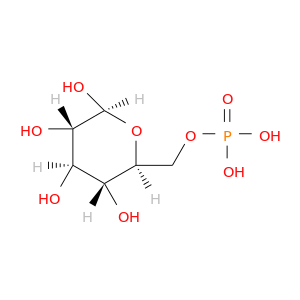 |
| DB02379 | hexokinase 1 | experimental | Beta-D-Glucose | 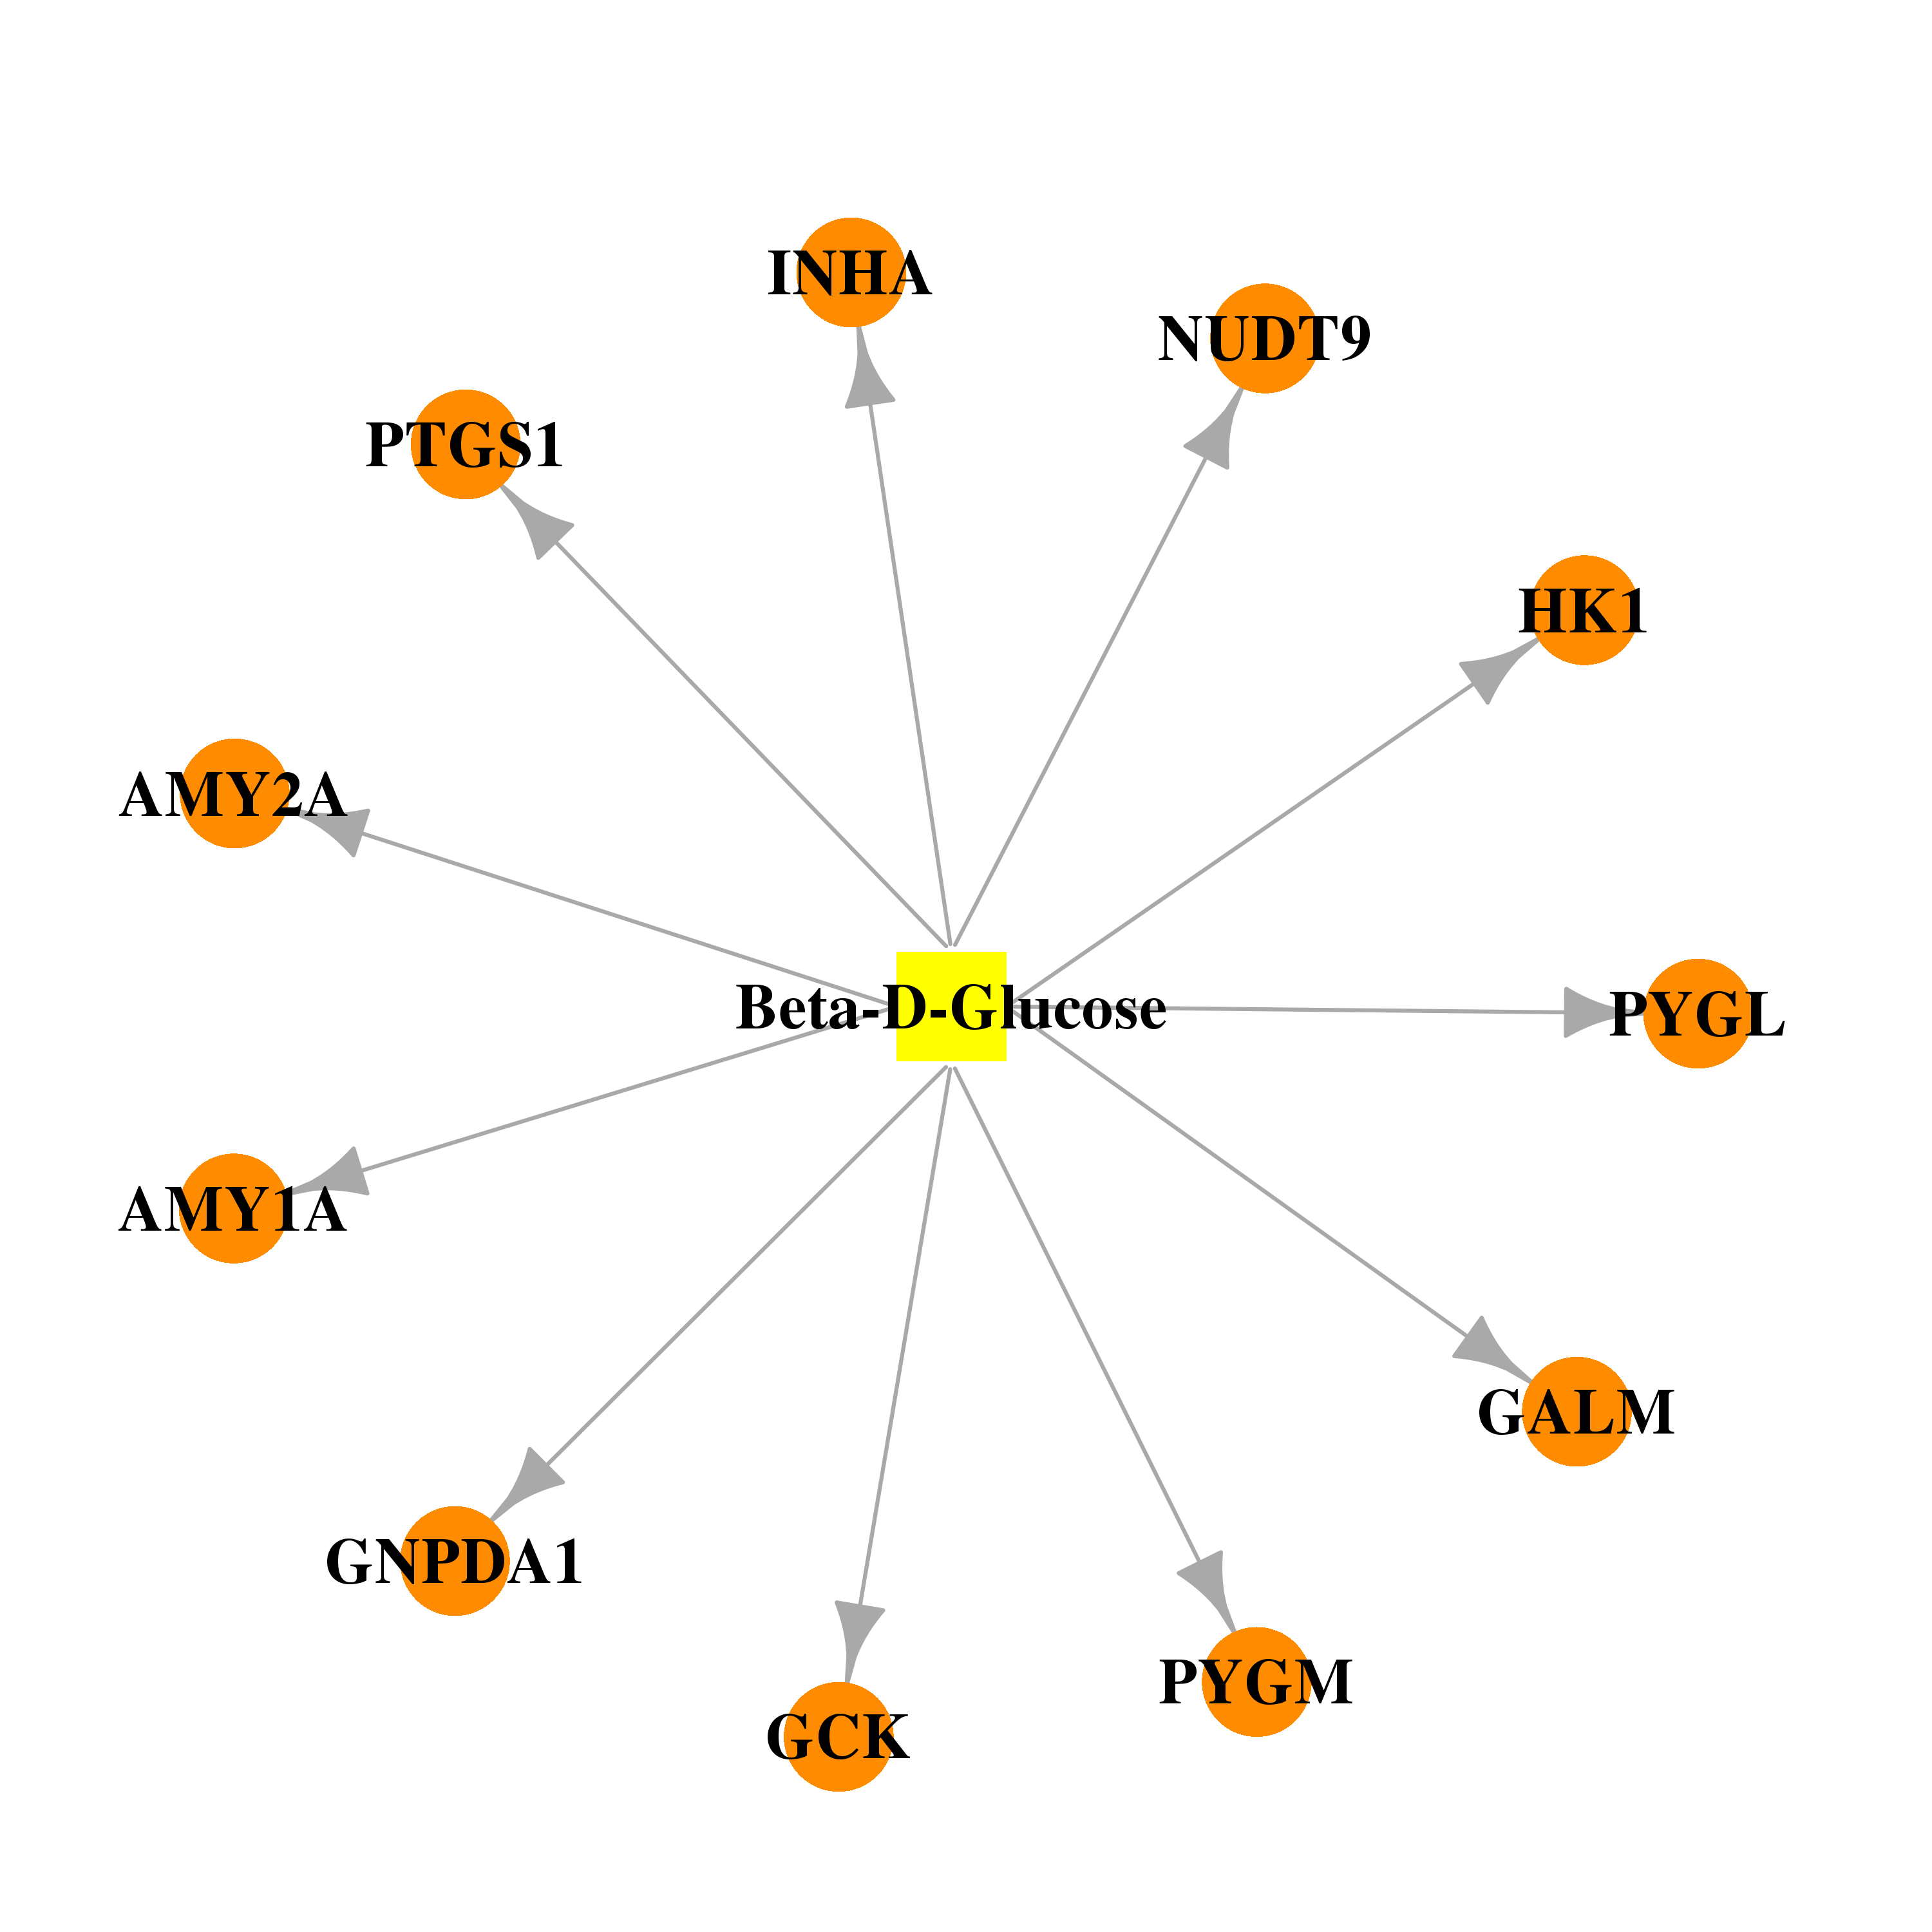 | 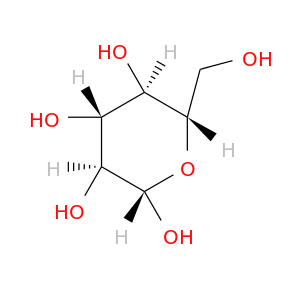 |
| DB03431 | hexokinase 1 | experimental | Adenosine-5'-Diphosphate | 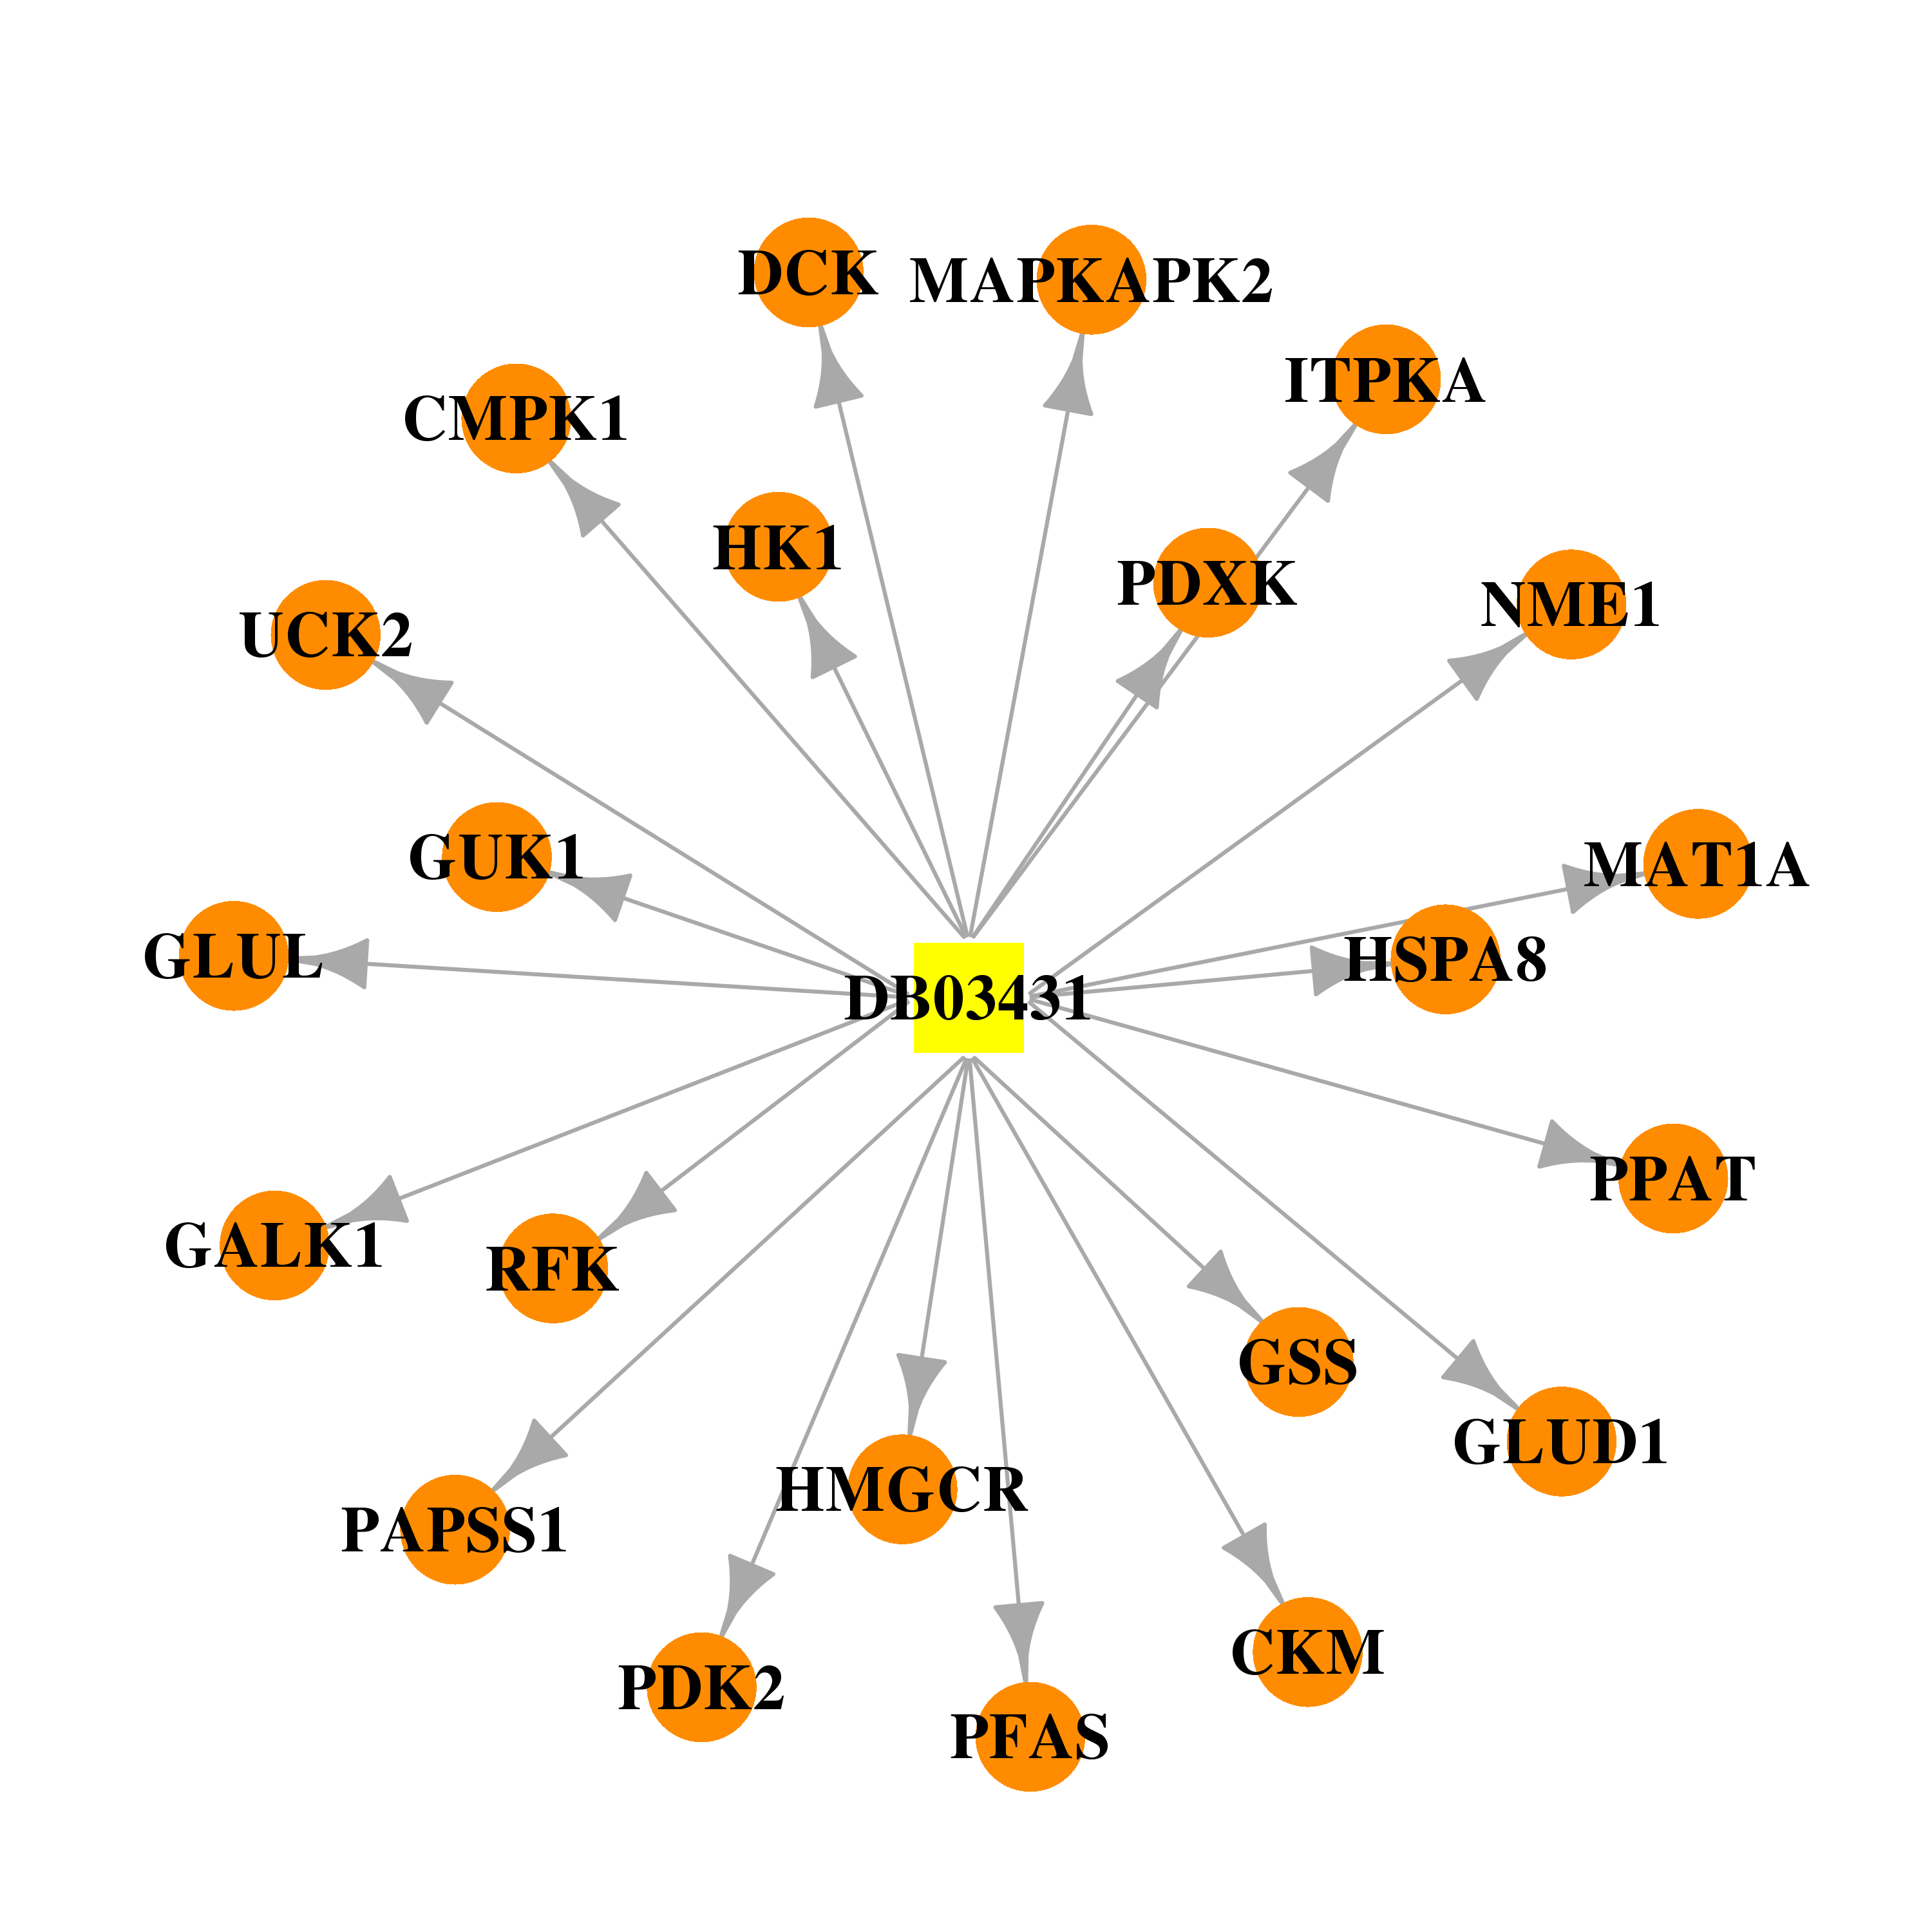 | 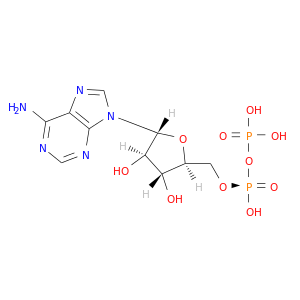 |
| DB04395 | hexokinase 1 | experimental | Phosphoaminophosphonic Acid-Adenylate Ester | 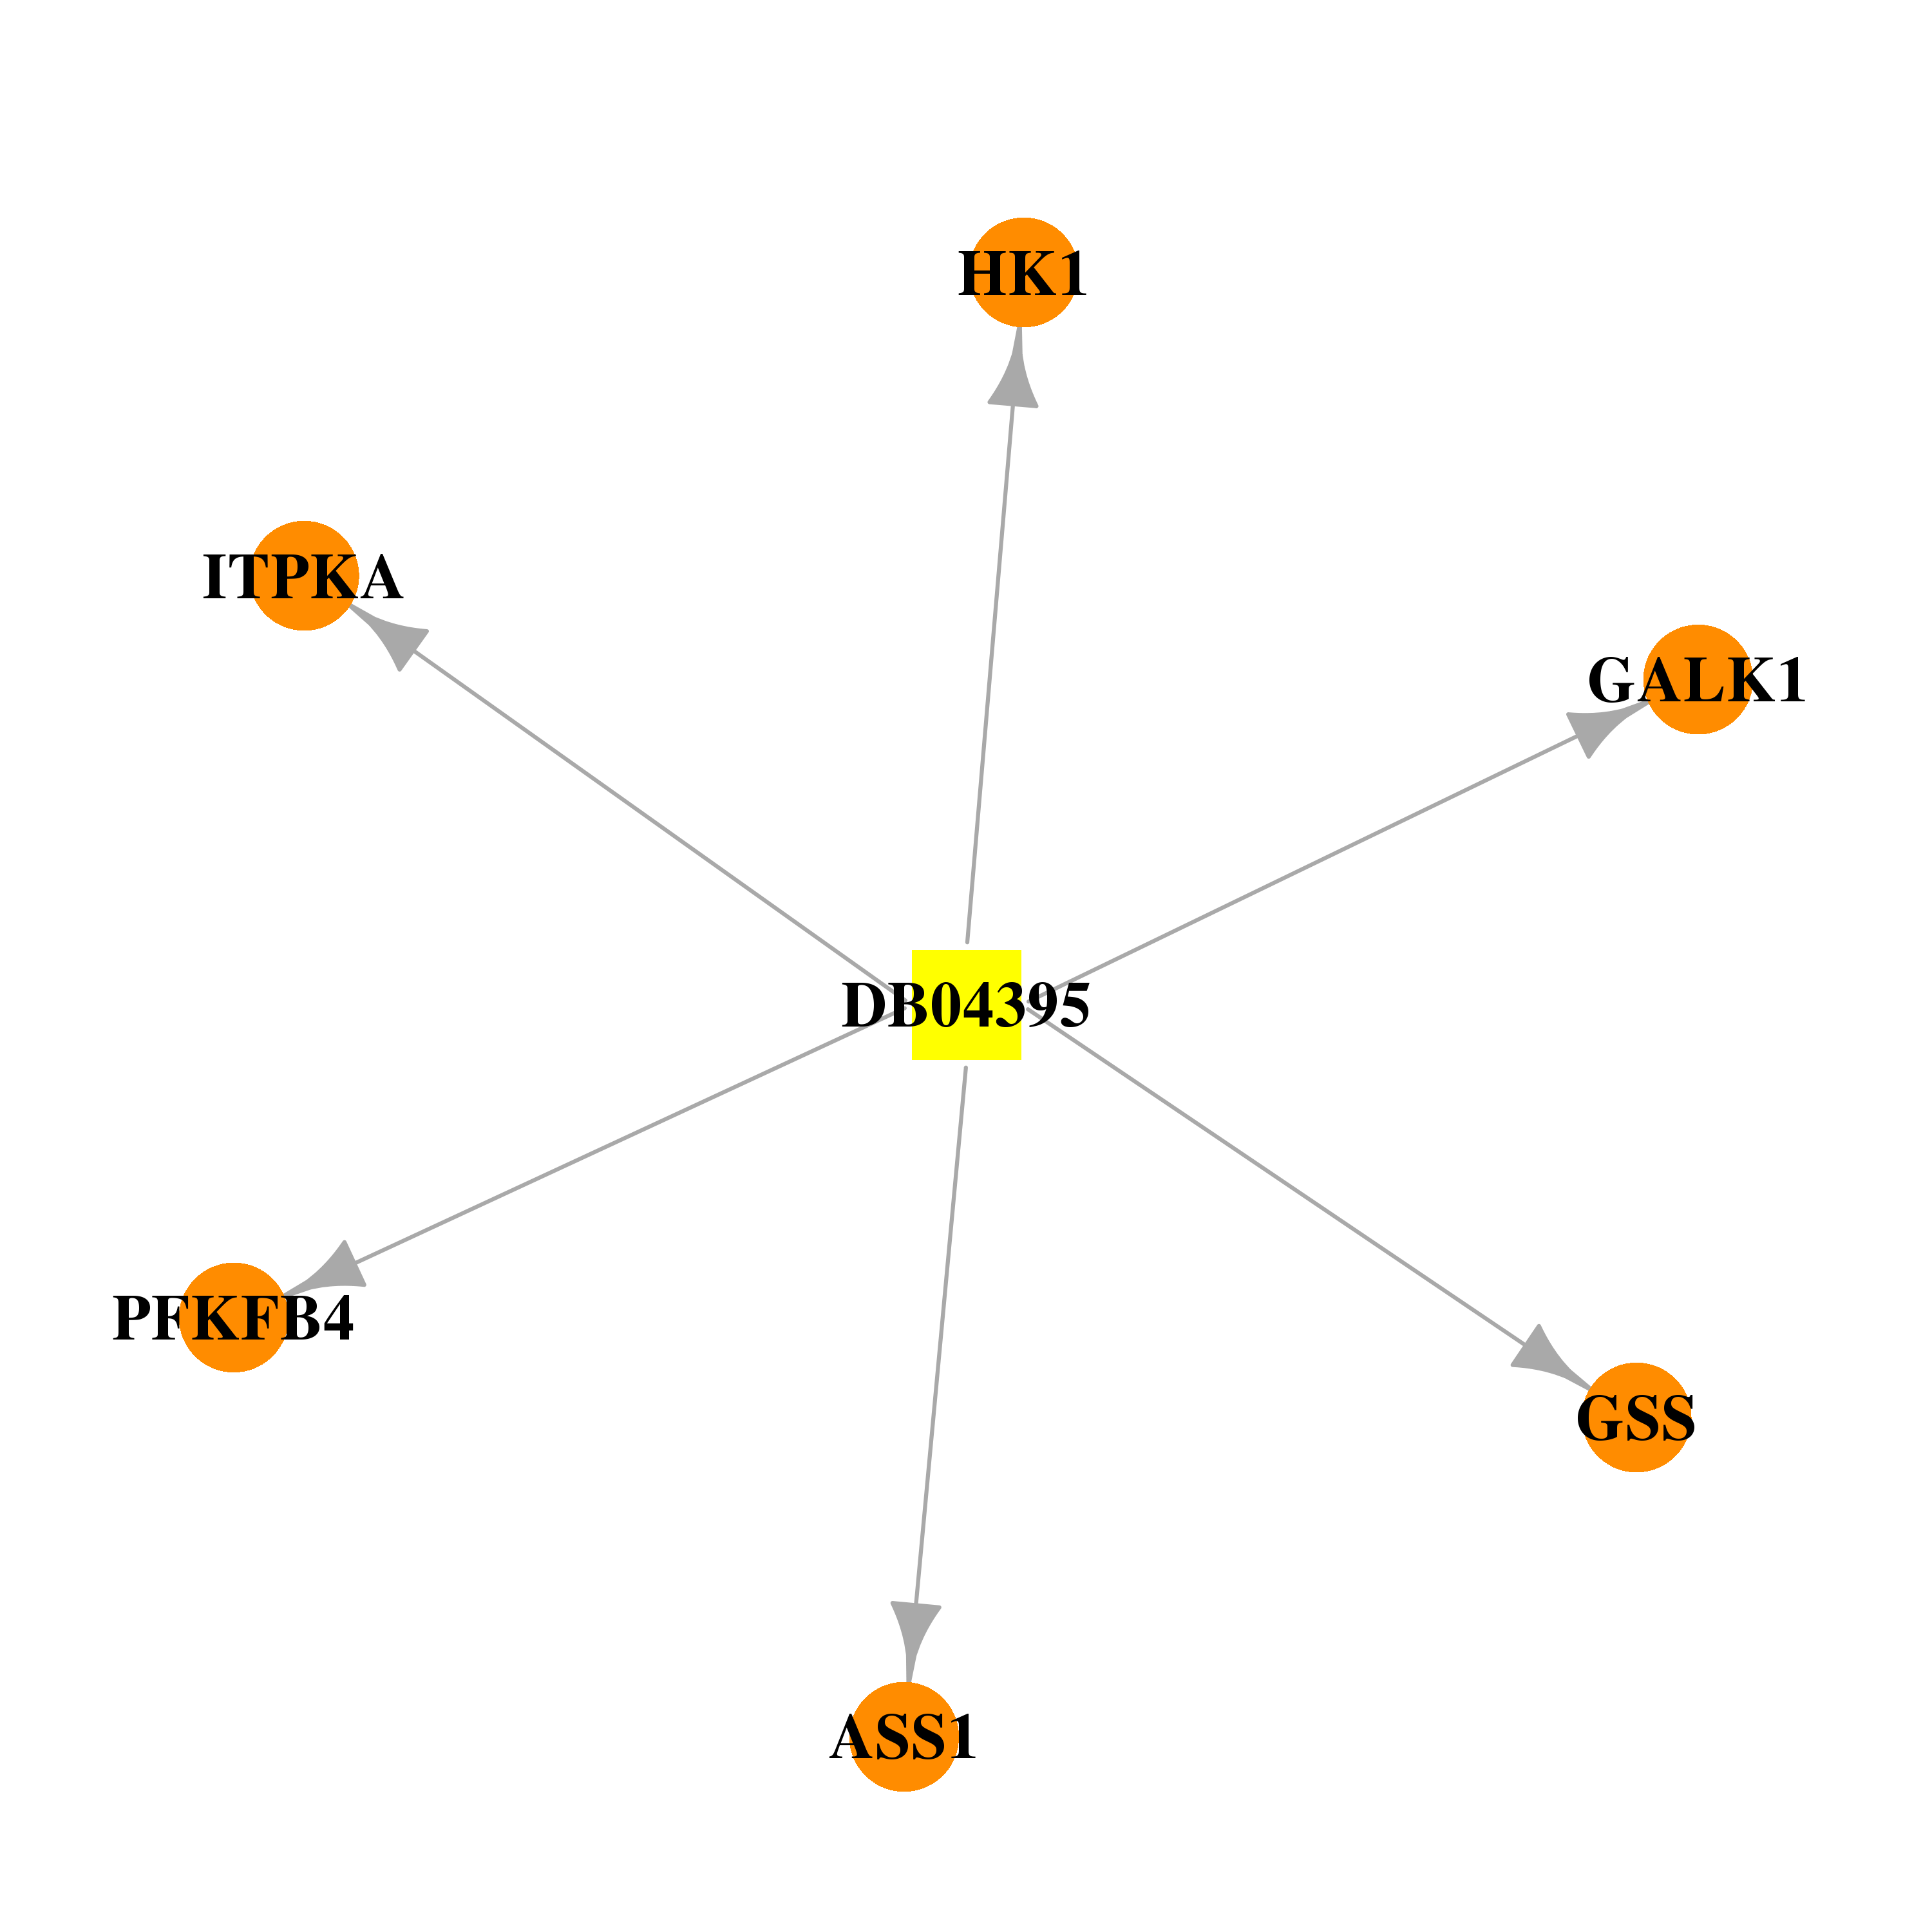 | 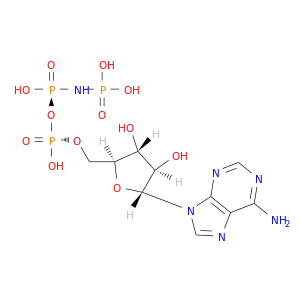 |
| Top |
| Cross referenced IDs for HK1 |
| * We obtained these cross-references from Uniprot database. It covers 150 different DBs, 18 categories. http://www.uniprot.org/help/cross_references_section |
: Open all cross reference information
|
Copyright © 2016-Present - The Univsersity of Texas Health Science Center at Houston @ |