|
||||||||||||||||||||||||||||||||||||||||||||||||||||||||||||||||||||||||||||||||||||||||||||||||||||||||||||||||||||||||||||||||||||||||||||||||||||||||||||||||||||||||||||||||||||||||||||||||||||||||||||||||||||||||||||||||||||||||||||||||||||||||||||||||||||||||||||||||||||||||||||||||||||||||||||||||||||||||||
| |
| Phenotypic Information (metabolism pathway, cancer, disease, phenome) |
| |
| |
| Gene-Gene Network Information: Co-Expression Network, Interacting Genes & KEGG |
| |
|


| Gene Summary for HK2 |
| Basic gene info. | Gene symbol | HK2 |
| Gene name | hexokinase 2 | |
| Synonyms | HKII|HXK2 | |
| Cytomap | UCSC genome browser: 2p13 | |
| Genomic location | chr2 :75059781-75120481 | |
| Type of gene | protein-coding | |
| RefGenes | NM_000189.4, | |
| Ensembl id | ENSG00000159399 | |
| Description | HK IIhexokinase type IIhexokinase-2hexokinase-2, musclemuscle form hexokinase | |
| Modification date | 20141207 | |
| dbXrefs | MIM : 601125 | |
| HGNC : HGNC | ||
| Ensembl : ENSG00000159399 | ||
| HPRD : 03080 | ||
| Vega : OTTHUMG00000129972 | ||
| Protein | UniProt: go to UniProt's Cross Reference DB Table | |
| Expression | CleanEX: HS_HK2 | |
| BioGPS: 3099 | ||
| Gene Expression Atlas: ENSG00000159399 | ||
| The Human Protein Atlas: ENSG00000159399 | ||
| Pathway | NCI Pathway Interaction Database: HK2 | |
| KEGG: HK2 | ||
| REACTOME: HK2 | ||
| ConsensusPathDB | ||
| Pathway Commons: HK2 | ||
| Metabolism | MetaCyc: HK2 | |
| HUMANCyc: HK2 | ||
| Regulation | Ensembl's Regulation: ENSG00000159399 | |
| miRBase: chr2 :75,059,781-75,120,481 | ||
| TargetScan: NM_000189 | ||
| cisRED: ENSG00000159399 | ||
| Context | iHOP: HK2 | |
| cancer metabolism search in PubMed: HK2 | ||
| UCL Cancer Institute: HK2 | ||
| Assigned class in ccmGDB | A - This gene has a literature evidence and it belongs to cancer gene. | |
| References showing role of HK2 in cancer cell metabolism | 1. Kim H, Jang H, Kim TW, Kang BH, Lee SE, et al. (2015) Core Pluripotency Factors Directly Regulate Metabolism in Embryonic Stem Cell to Maintain Pluripotency. Stem Cells. doi: 10.1002/stem.2073. go to article 2. Zhuo B, Li Y, Li Z, Qin H, Sun Q, et al. (2015) PI3K/Akt signaling mediated Hexokinase-2 expression inhibits cell apoptosis and promotes tumor growth in pediatric osteosarcoma. Biochem Biophys Res Commun. doi: 10.1016/j.bbrc.2015.06.092 go to article 3. Guo W, Qiu Z, Wang Z, Wang Q, Tan N, et al. (2015) MiR-199a-5p is negatively associated with malignancies and regulates glycolysis and lactate production by targeting hexokinase 2 in liver cancer. Hepatology. doi: 10.1002/hep.27929. go to article 4. Alvarez JV, Belka GK, Pan TC, Chen CC, Blankemeyer E, et al. (2014) Oncogene pathway activation in mammary tumors dictates FDG-PET uptake. Cancer Res 74: 7583-7598. doi: 10.1158/0008-5472.CAN-14-1235. pmid: 4342047. go to article | |
| Top |
| Phenotypic Information for HK2(metabolism pathway, cancer, disease, phenome) |
| Cancer | CGAP: HK2 |
| Familial Cancer Database: HK2 | |
| * This gene is included in those cancer gene databases. |
|
|
|
|
|
|
| ||||||||||||||||||||||||||||||||||||||||||||||||||||||||||||||||||||||||||||||||||||||||||||||||||||||||||||||||||||||||||||||||||||||||||||||||||||||||||||||||||||||||||||||||||||||||||||||||||||||||||||||||||||||||||||||||||||||||||||||||||||||||||||||||||||||||||||||||||||||||||||||||||||||||||||||||||||
Oncogene 1 | Significant driver gene in | |||||||||||||||||||||||||||||||||||||||||||||||||||||||||||||||||||||||||||||||||||||||||||||||||||||||||||||||||||||||||||||||||||||||||||||||||||||||||||||||||||||||||||||||||||||||||||||||||||||||||||||||||||||||||||||||||||||||||||||||||||||||||||||||||||||||||||||||||||||||||||||||||||||||||||||||||||||||||
| cf) number; DB name 1 Oncogene; http://nar.oxfordjournals.org/content/35/suppl_1/D721.long, 2 Tumor Suppressor gene; https://bioinfo.uth.edu/TSGene/, 3 Cancer Gene Census; http://www.nature.com/nrc/journal/v4/n3/abs/nrc1299.html, 4 CancerGenes; http://nar.oxfordjournals.org/content/35/suppl_1/D721.long, 5 Network of Cancer Gene; http://ncg.kcl.ac.uk/index.php, 1Therapeutic Vulnerabilities in Cancer; http://cbio.mskcc.org/cancergenomics/statius/ |
| KEGG_GLYCOLYSIS_GLUCONEOGENESIS KEGG_FRUCTOSE_AND_MANNOSE_METABOLISM KEGG_GALACTOSE_METABOLISM KEGG_STARCH_AND_SUCROSE_METABOLISM KEGG_AMINO_SUGAR_AND_NUCLEOTIDE_SUGAR_METABOLISM REACTOME_METABOLISM_OF_CARBOHYDRATES | |
| OMIM | |
| Orphanet | |
| Disease | KEGG Disease: HK2 |
| MedGen: HK2 (Human Medical Genetics with Condition) | |
| ClinVar: HK2 | |
| Phenotype | MGI: HK2 (International Mouse Phenotyping Consortium) |
| PhenomicDB: HK2 | |
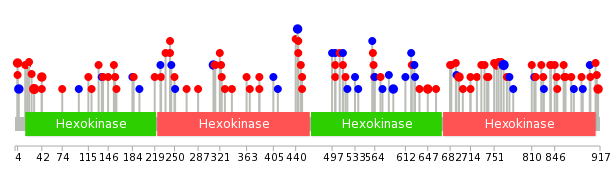
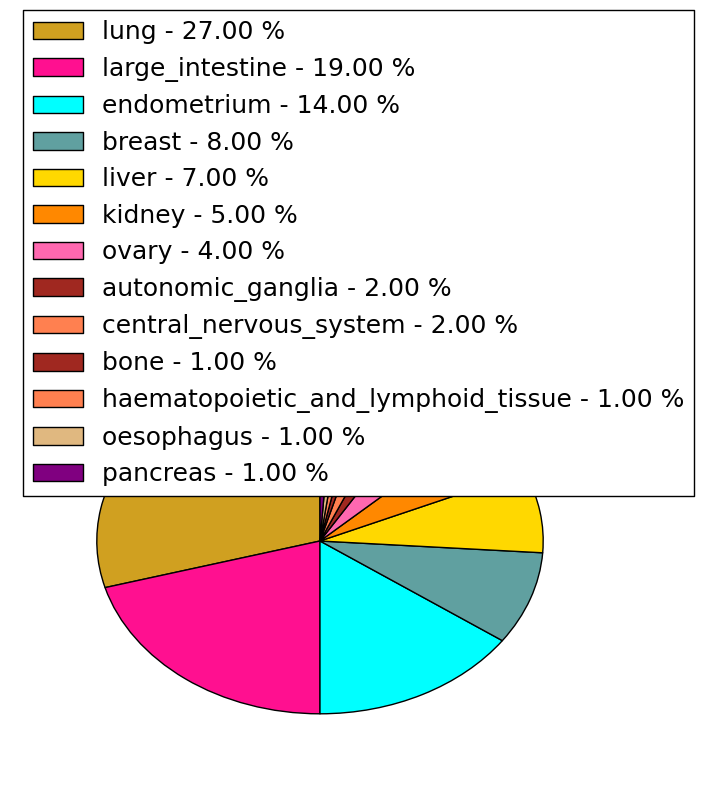
| Mutations for HK2 |
| * Under tables are showing count per each tissue to give us broad intuition about tissue specific mutation patterns.You can go to the detailed page for each mutation database's web site. |
| There's no structural variation information in COSMIC data for this gene. |
| * From mRNA Sanger sequences, Chitars2.0 arranged chimeric transcripts. This table shows HK2 related fusion information. |
| ID | Head Gene | Tail Gene | Accession | Gene_a | qStart_a | qEnd_a | Chromosome_a | tStart_a | tEnd_a | Gene_a | qStart_a | qEnd_a | Chromosome_a | tStart_a | tEnd_a |
| Z46376 | FAM50A | 1 | 1069 | X | 153674037 | 153678996 | HK2 | 1067 | 5289 | 2 | 75061284 | 75119113 | |
| Top |
| Mutation type/ Tissue ID | brca | cns | cerv | endome | haematopo | kidn | Lintest | liver | lung | ns | ovary | pancre | prost | skin | stoma | thyro | urina | |||
| Total # sample | 1 | 1 | ||||||||||||||||||
| GAIN (# sample) | 1 | |||||||||||||||||||
| LOSS (# sample) | 1 |
| cf) Tissue ID; Tissue type (1; Breast, 2; Central_nervous_system, 3; Cervix, 4; Endometrium, 5; Haematopoietic_and_lymphoid_tissue, 6; Kidney, 7; Large_intestine, 8; Liver, 9; Lung, 10; NS, 11; Ovary, 12; Pancreas, 13; Prostate, 14; Skin, 15; Stomach, 16; Thyroid, 17; Urinary_tract) |
| Top |
|
 |
| Top |
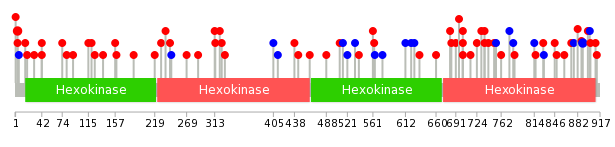
| Stat. for Non-Synonymous SNVs (# total SNVs=68) | (# total SNVs=27) |
 |  |
(# total SNVs=2) | (# total SNVs=0) |
 |
| Top |
| * When you move the cursor on each content, you can see more deailed mutation information on the Tooltip. Those are primary_site,primary_histology,mutation(aa),pubmedID. |
| GRCh37 position | Mutation(aa) | Unique sampleID count |
| chr2:75081444-75081444 | p.R30C | 3 |
| chr2:75115108-75115108 | p.L766L | 3 |
| chr2:75061718-75061718 | p.S4L | 3 |
| chr2:75104350-75104350 | p.V311V | 2 |
| chr2:75113668-75113668 | p.V696E | 2 |
| chr2:75115074-75115074 | p.R755H | 2 |
| chr2:75107455-75107455 | p.L443L | 2 |
| chr2:75081481-75081481 | p.R42Q | 2 |
| chr2:75113426-75113426 | p.F647L | 2 |
| chr2:75109306-75109306 | p.G593G | 2 |
| Top |
|
 |
| Point Mutation/ Tissue ID | 1 | 2 | 3 | 4 | 5 | 6 | 7 | 8 | 9 | 10 | 11 | 12 | 13 | 14 | 15 | 16 | 17 | 18 | 19 | 20 |
| # sample | 2 | 2 | 8 | 2 | 4 | 2 | 11 | 6 | 2 | 14 | 10 | 2 | 14 | |||||||
| # mutation | 2 | 2 | 9 | 2 | 4 | 2 | 13 | 6 | 2 | 15 | 13 | 2 | 14 | |||||||
| nonsynonymous SNV | 2 | 2 | 6 | 2 | 4 | 11 | 6 | 2 | 10 | 10 | 2 | 9 | ||||||||
| synonymous SNV | 3 | 2 | 2 | 5 | 3 | 5 |
| cf) Tissue ID; Tissue type (1; BLCA[Bladder Urothelial Carcinoma], 2; BRCA[Breast invasive carcinoma], 3; CESC[Cervical squamous cell carcinoma and endocervical adenocarcinoma], 4; COAD[Colon adenocarcinoma], 5; GBM[Glioblastoma multiforme], 6; Glioma Low Grade, 7; HNSC[Head and Neck squamous cell carcinoma], 8; KICH[Kidney Chromophobe], 9; KIRC[Kidney renal clear cell carcinoma], 10; KIRP[Kidney renal papillary cell carcinoma], 11; LAML[Acute Myeloid Leukemia], 12; LUAD[Lung adenocarcinoma], 13; LUSC[Lung squamous cell carcinoma], 14; OV[Ovarian serous cystadenocarcinoma ], 15; PAAD[Pancreatic adenocarcinoma], 16; PRAD[Prostate adenocarcinoma], 17; SKCM[Skin Cutaneous Melanoma], 18:STAD[Stomach adenocarcinoma], 19:THCA[Thyroid carcinoma], 20:UCEC[Uterine Corpus Endometrial Carcinoma]) |
| Top |
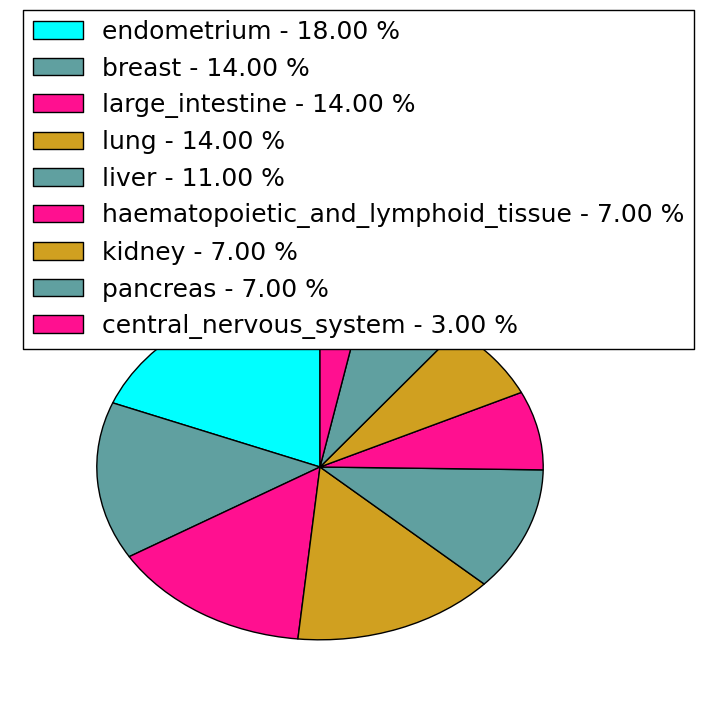
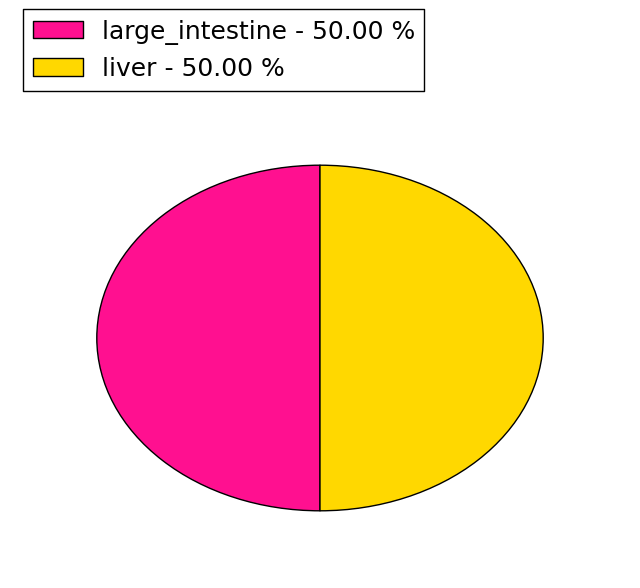
| * We represented just top 10 SNVs. When you move the cursor on each content, you can see more deailed mutation information on the Tooltip. Those are primary_site, primary_histology, mutation(aa), pubmedID. |
| Genomic Position | Mutation(aa) | Unique sampleID count |
| chr2:75061718 | p.S4W | 3 |
| chr2:75117984 | p.R702Q | 2 |
| chr2:75113788 | p.P736H | 2 |
| chr2:75113686 | p.F890F | 2 |
| chr2:75101560 | p.V19M | 1 |
| chr2:75113722 | p.A236T | 1 |
| chr2:75107589 | p.V509I | 1 |
| chr2:75116438 | p.R691H | 1 |
| chr2:75061754 | p.S816N | 1 |
| chr2:75099464 | p.R30C | 1 |
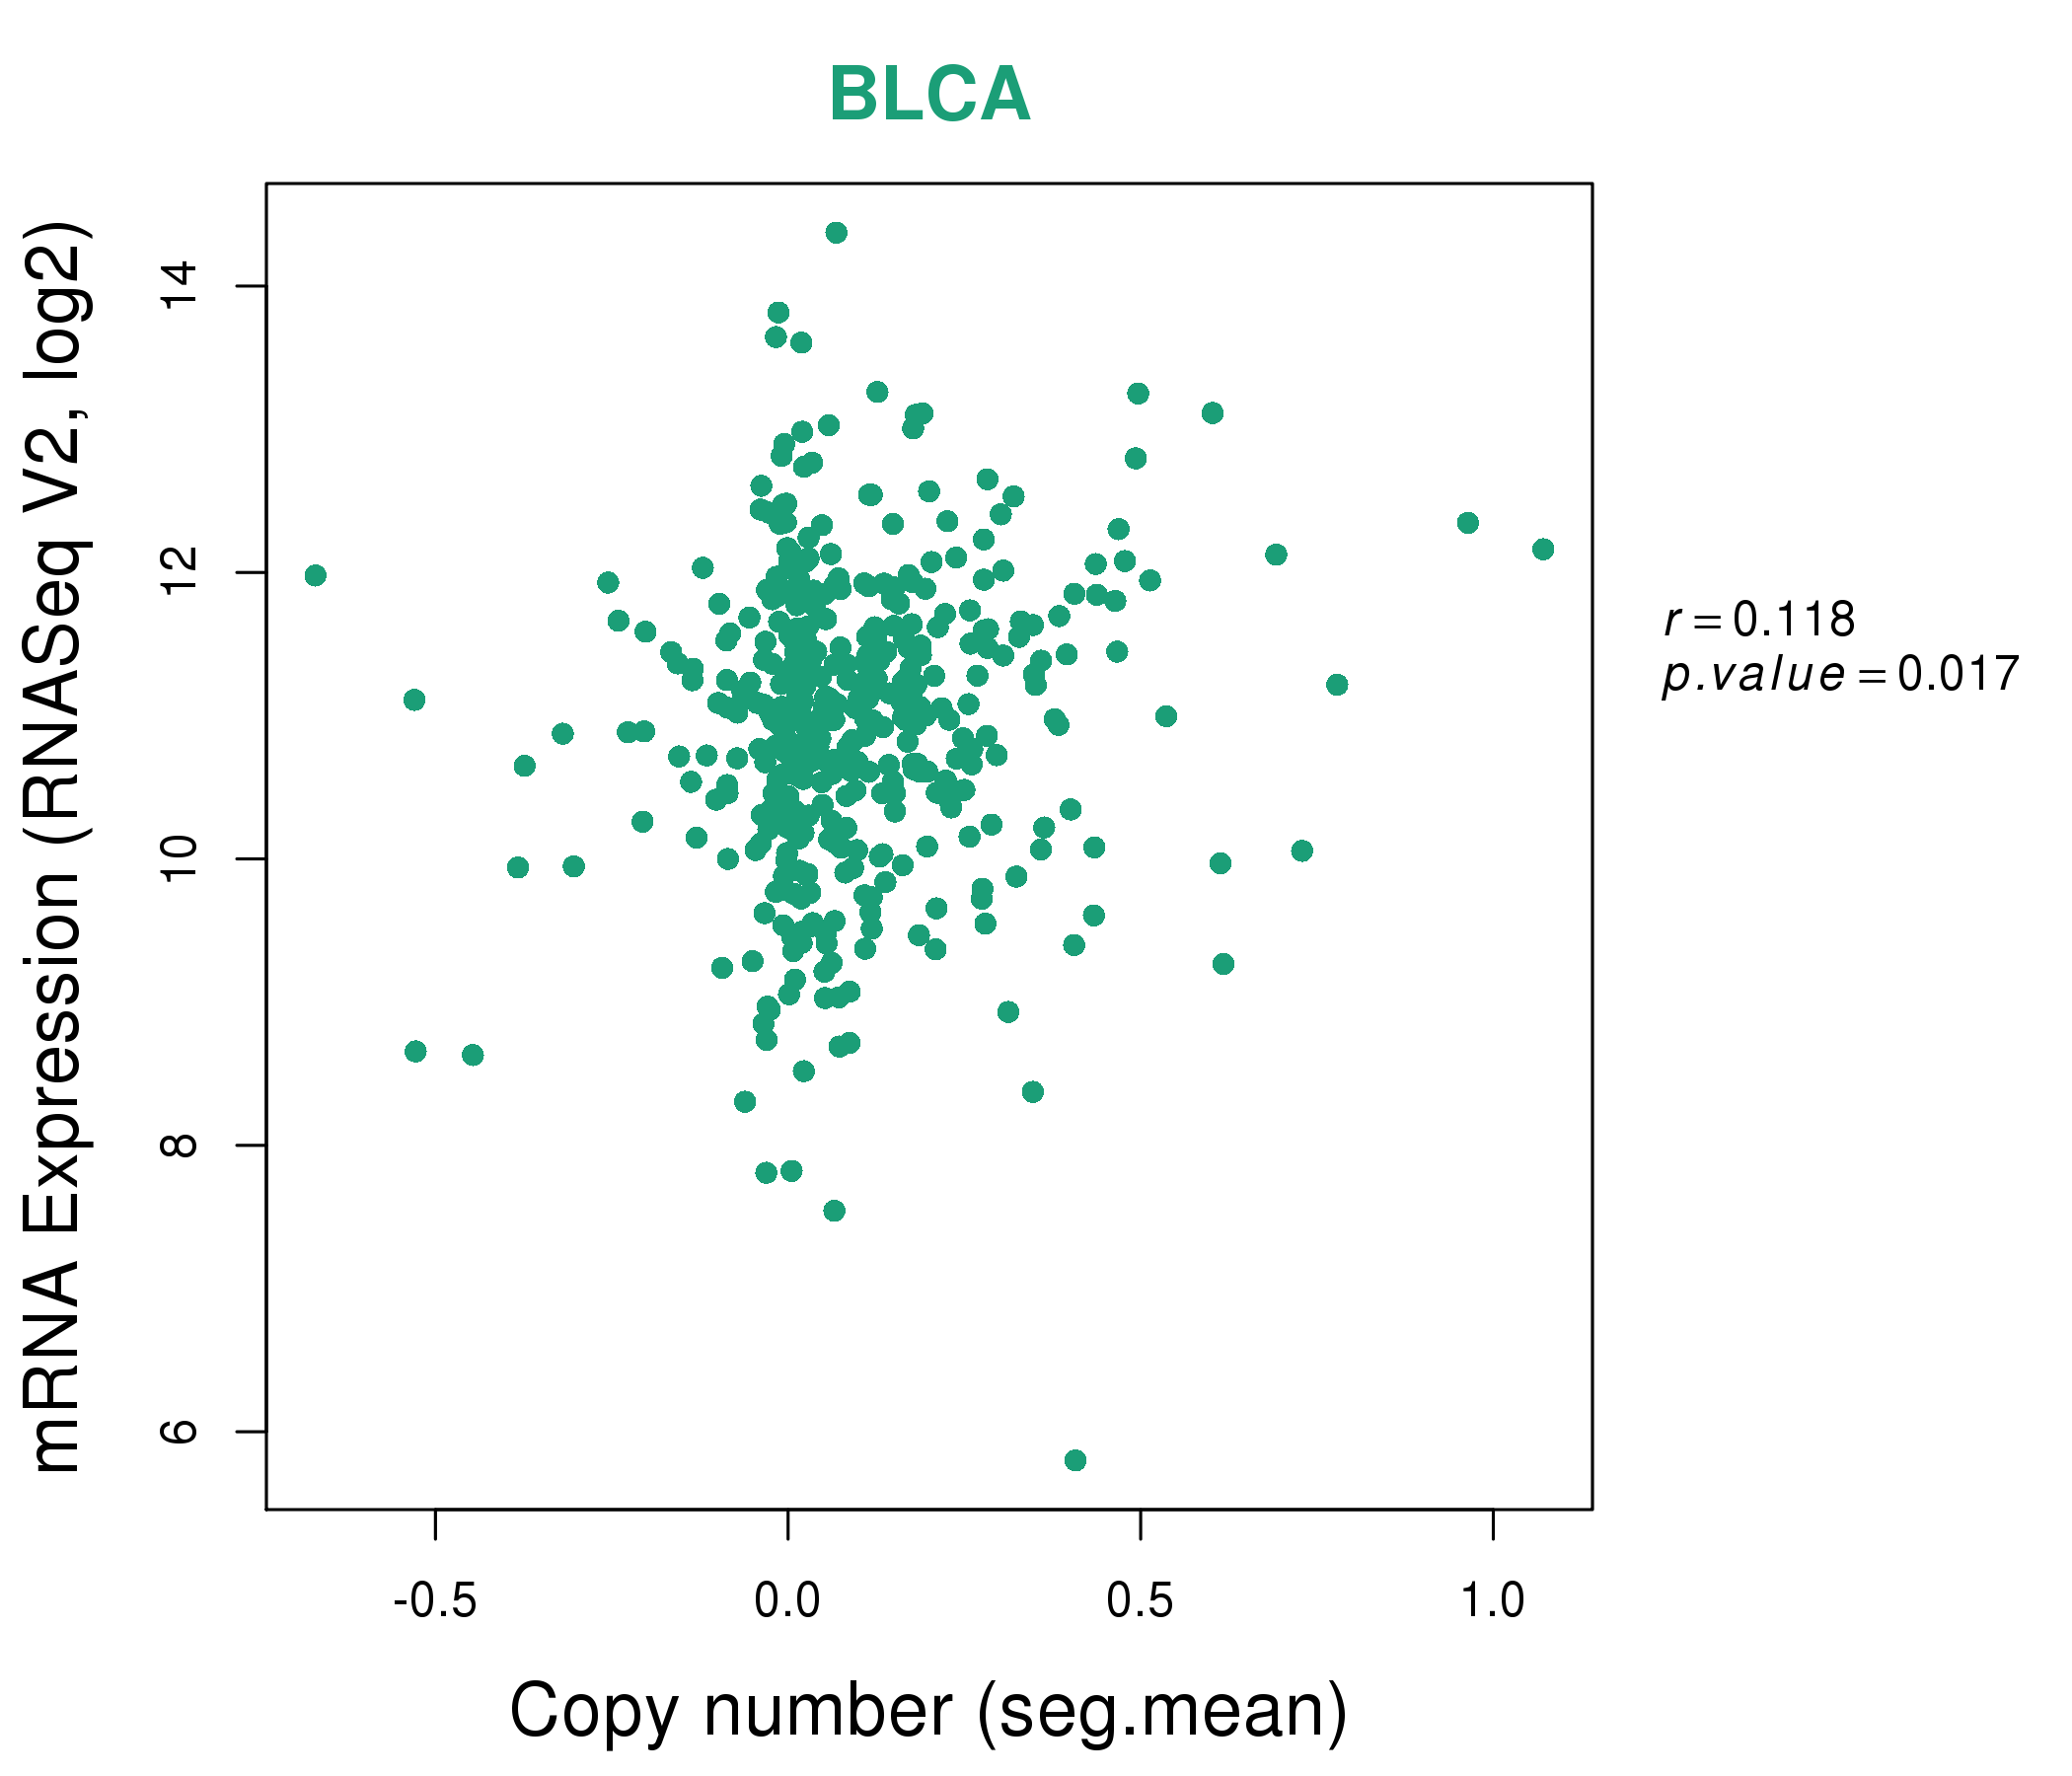
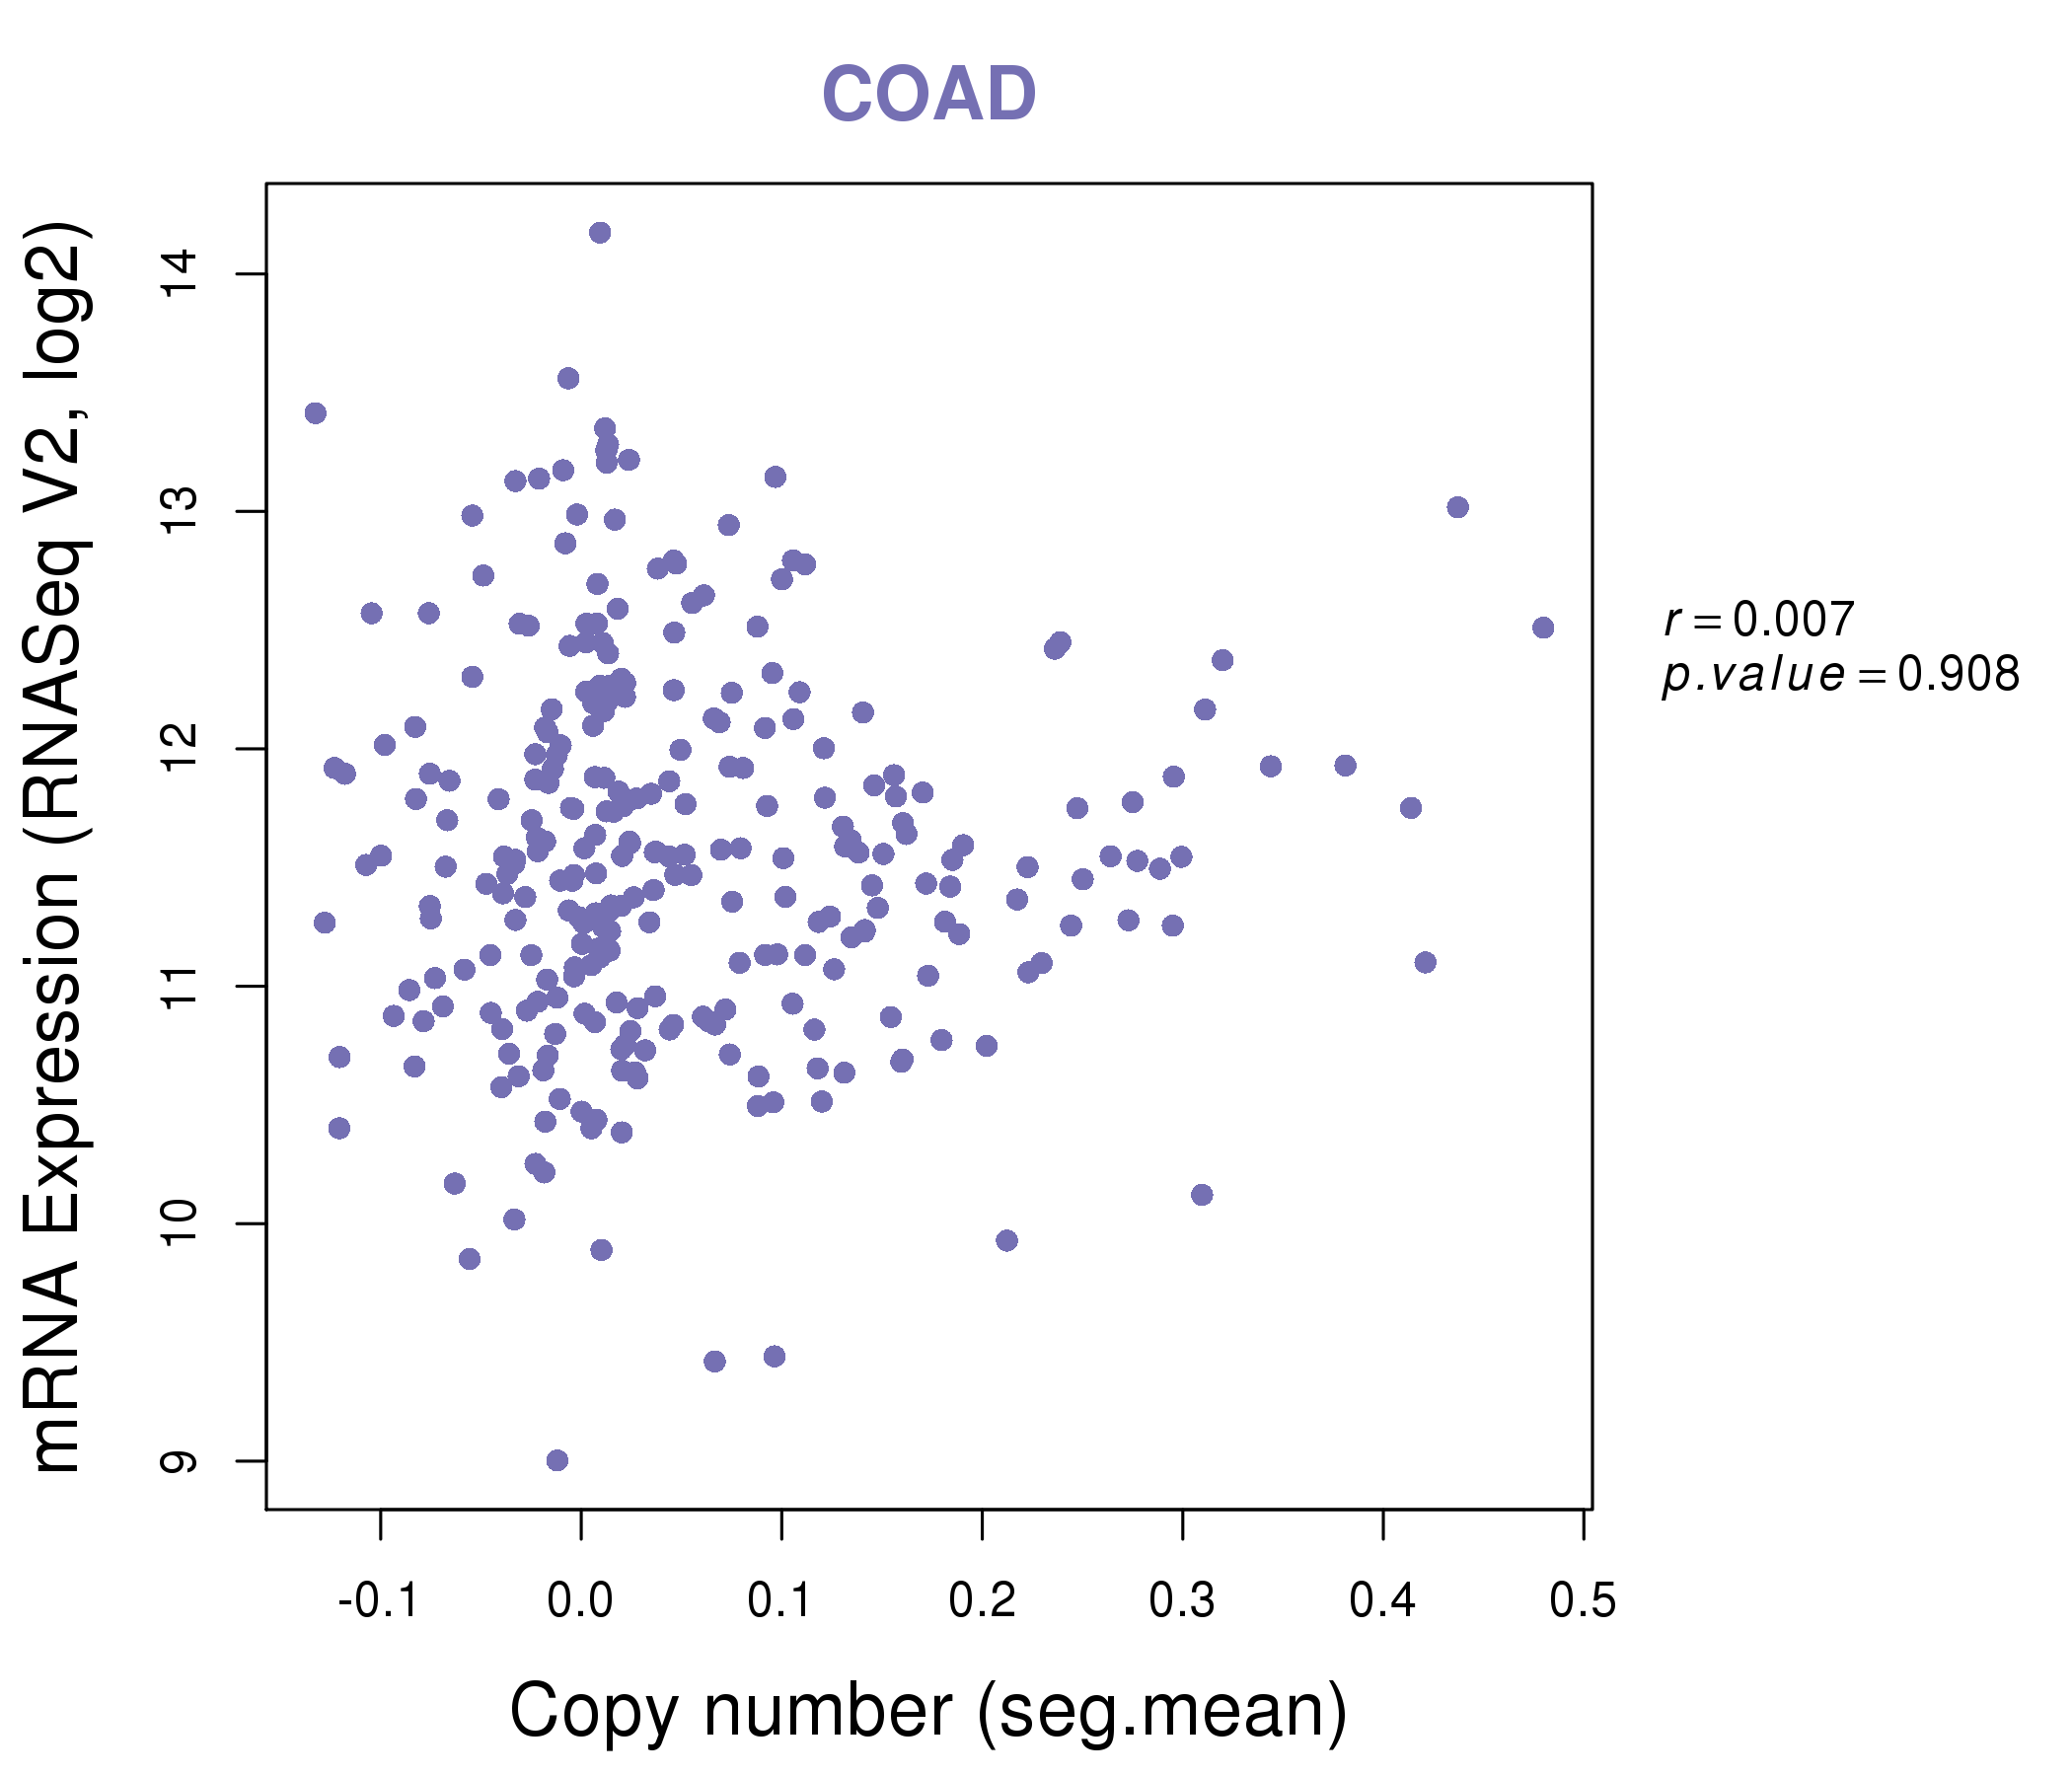
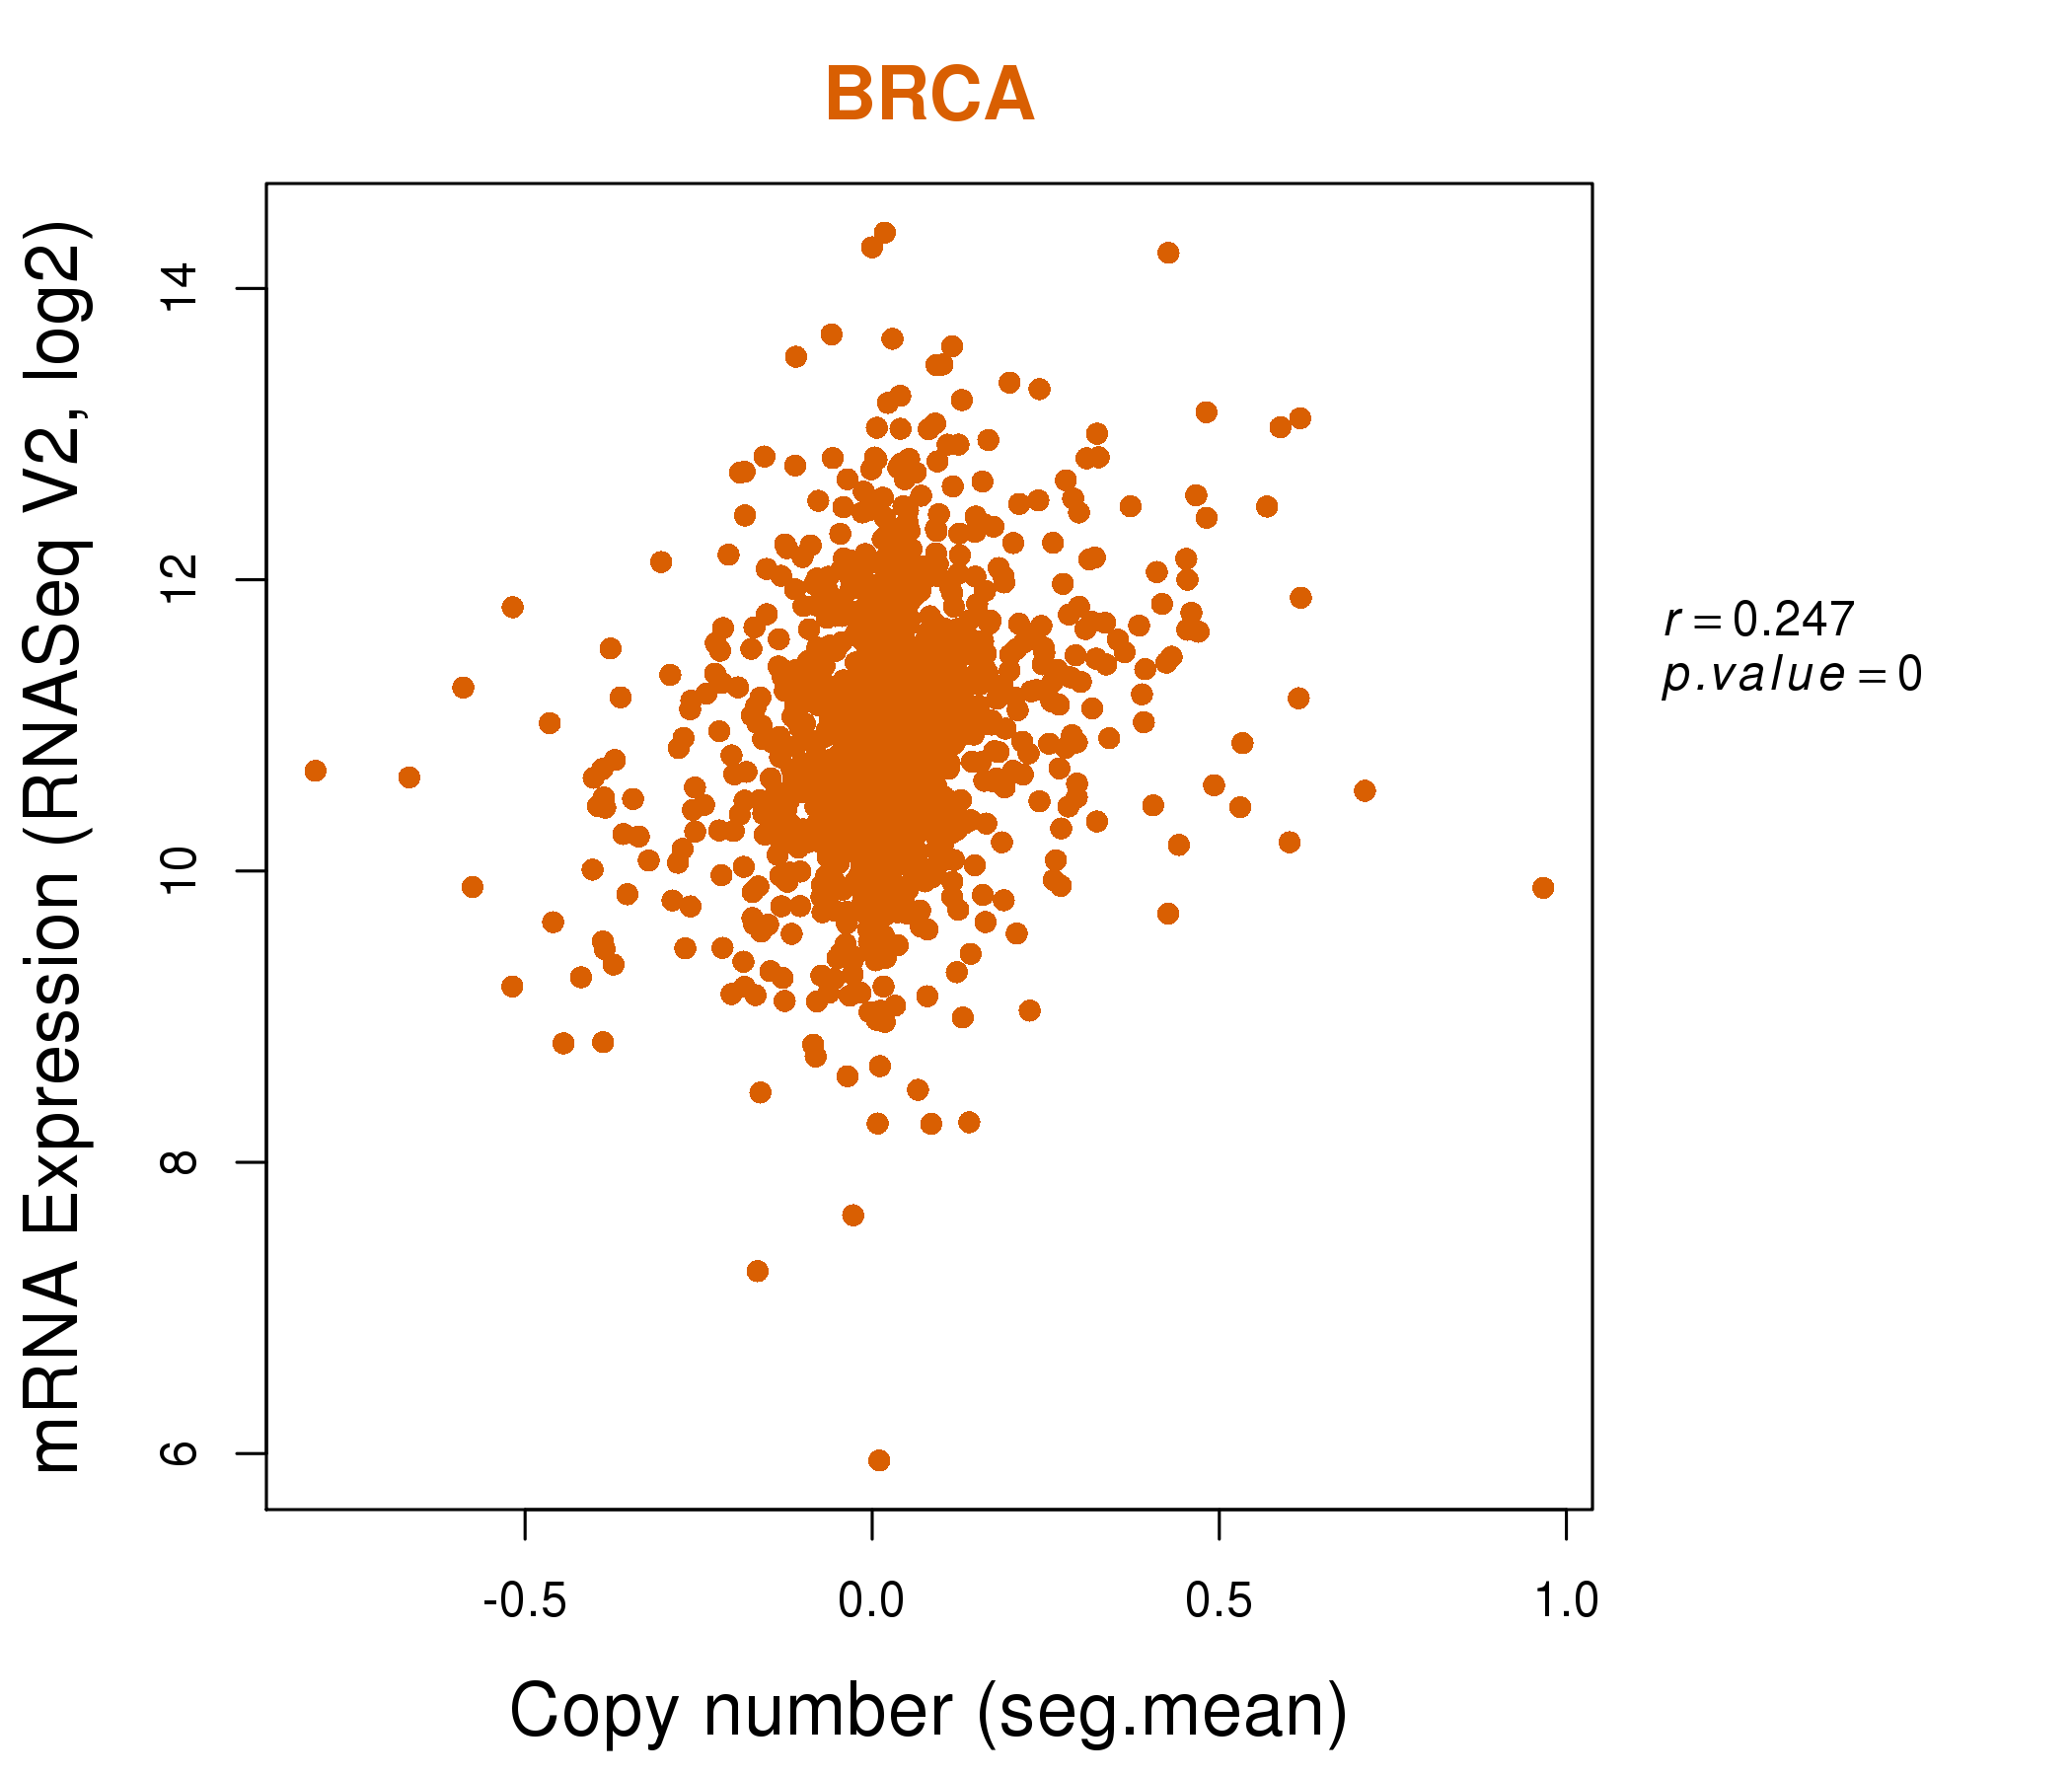
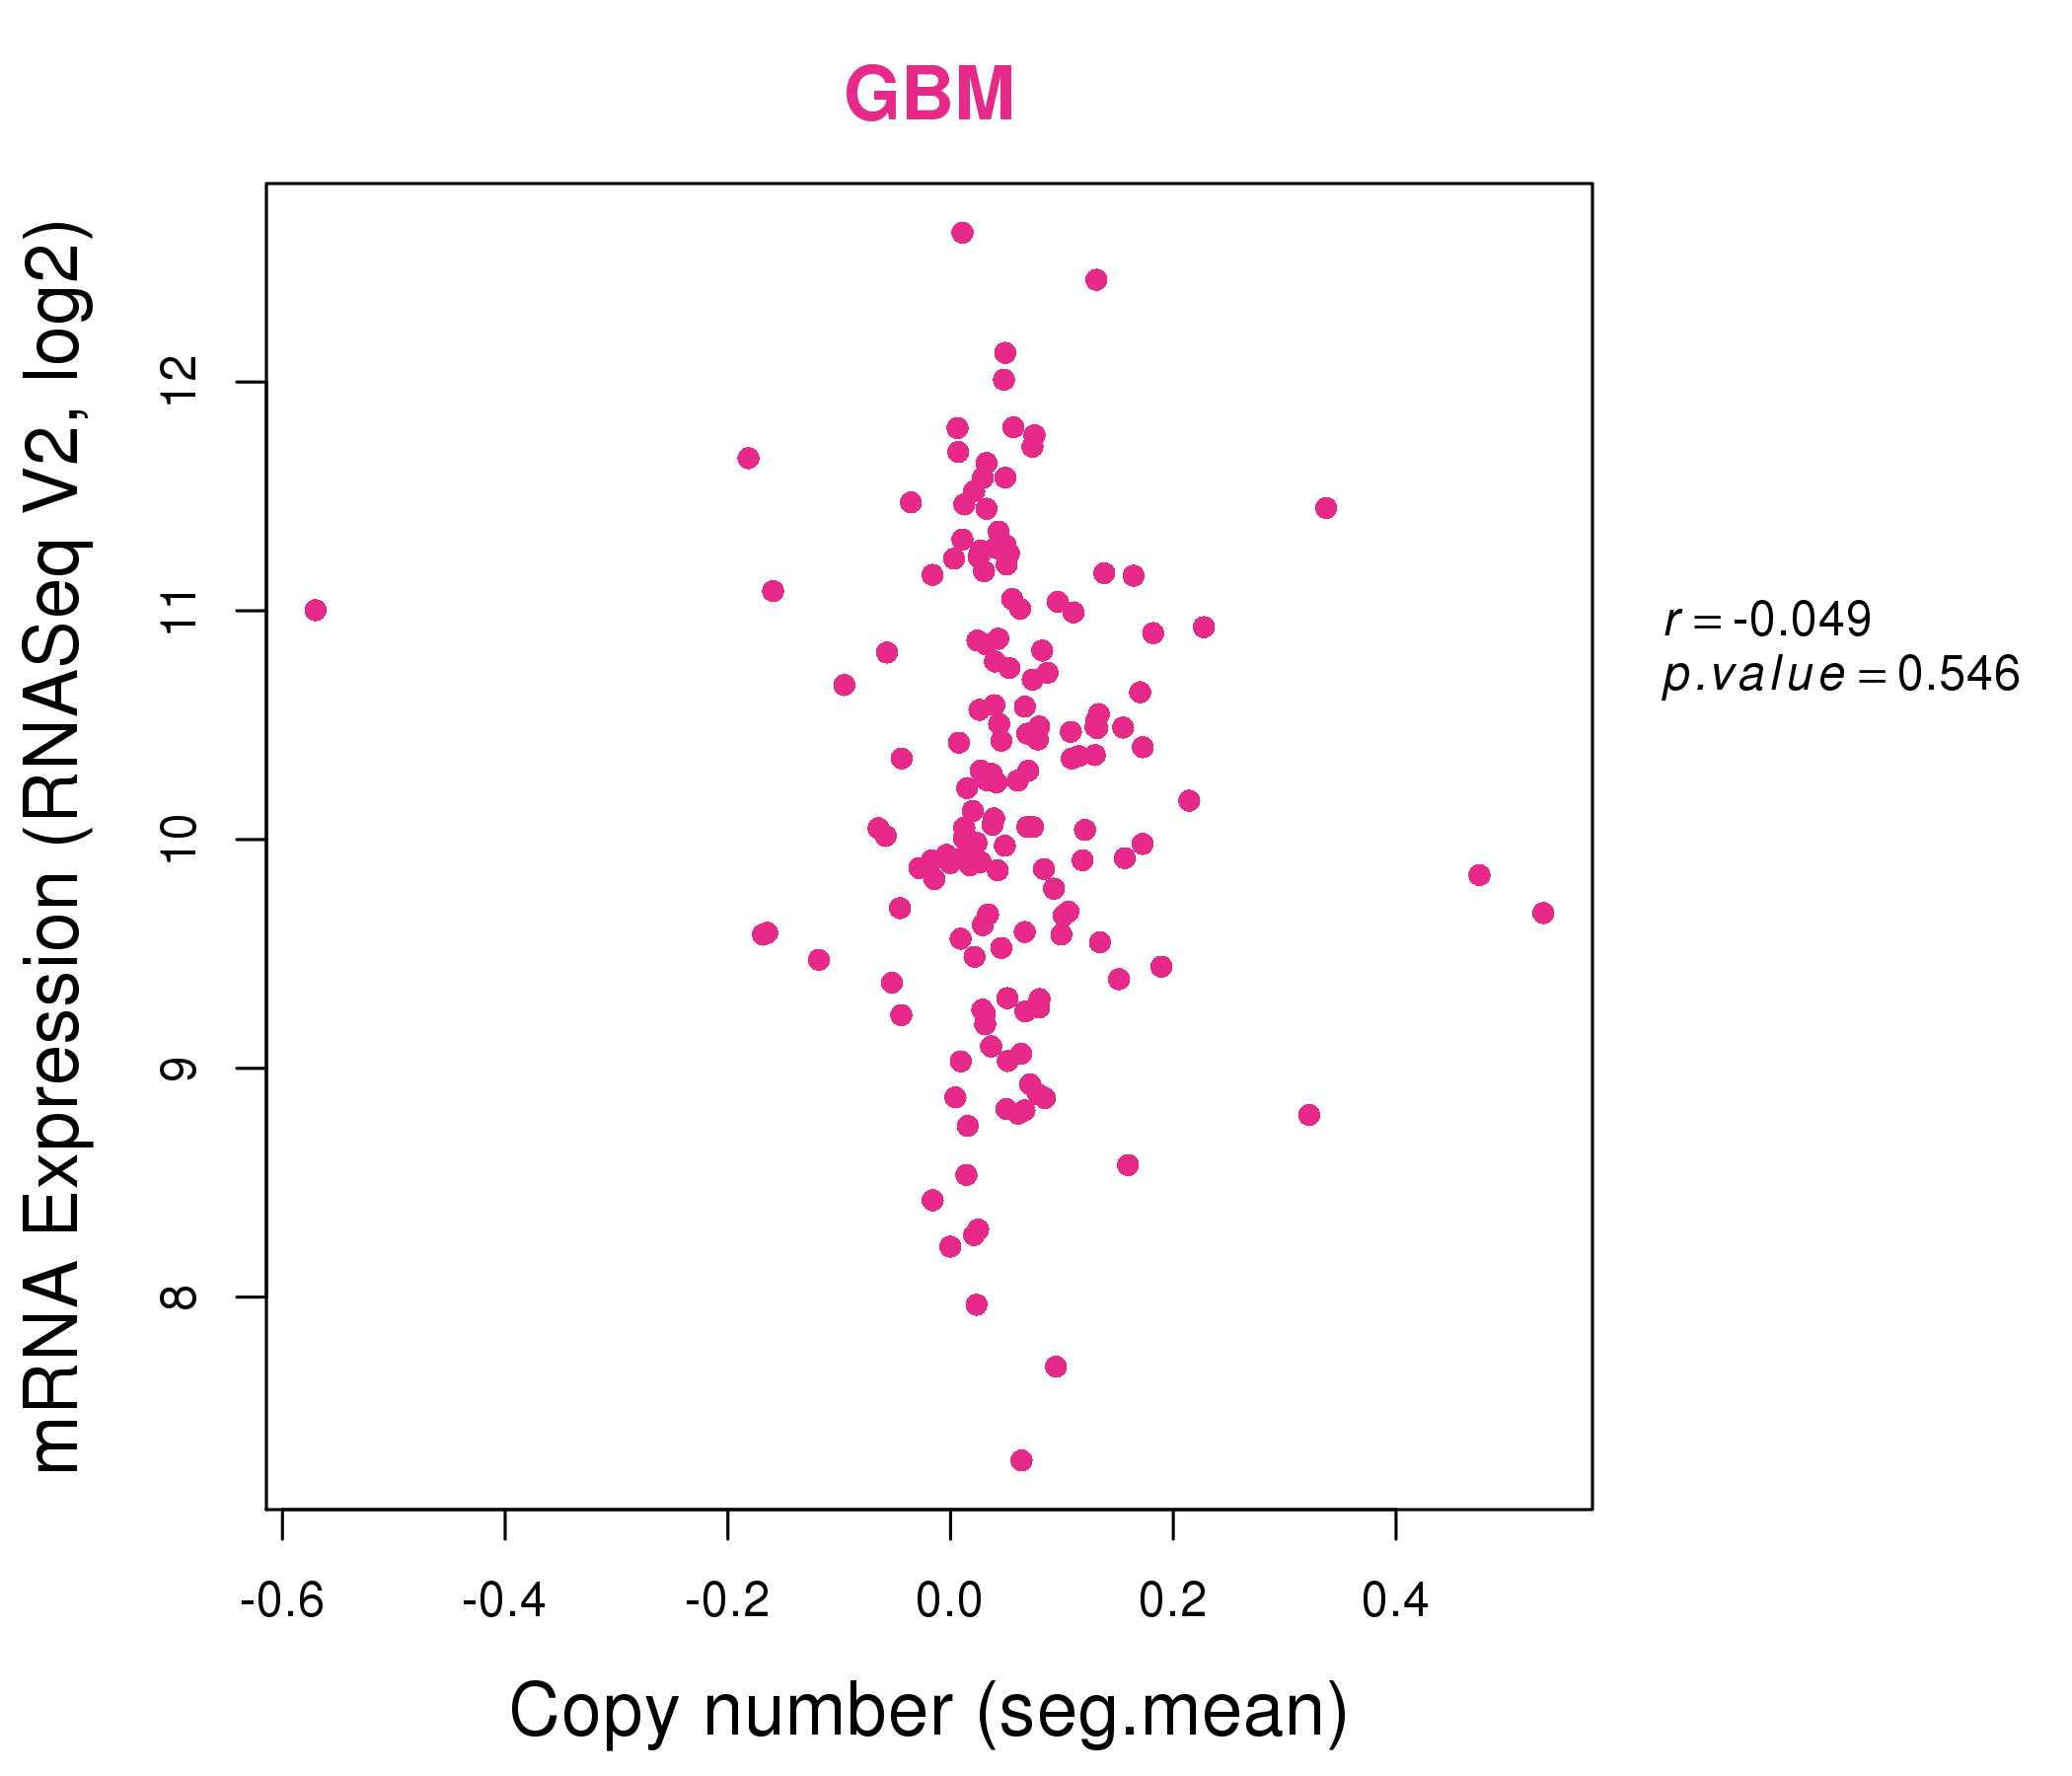
| * Copy number data were extracted from TCGA using R package TCGA-Assembler. The URLs of all public data files on TCGA DCC data server were gathered on Jan-05-2015. Function ProcessCNAData in TCGA-Assembler package was used to obtain gene-level copy number value which is calculated as the average copy number of the genomic region of a gene. |
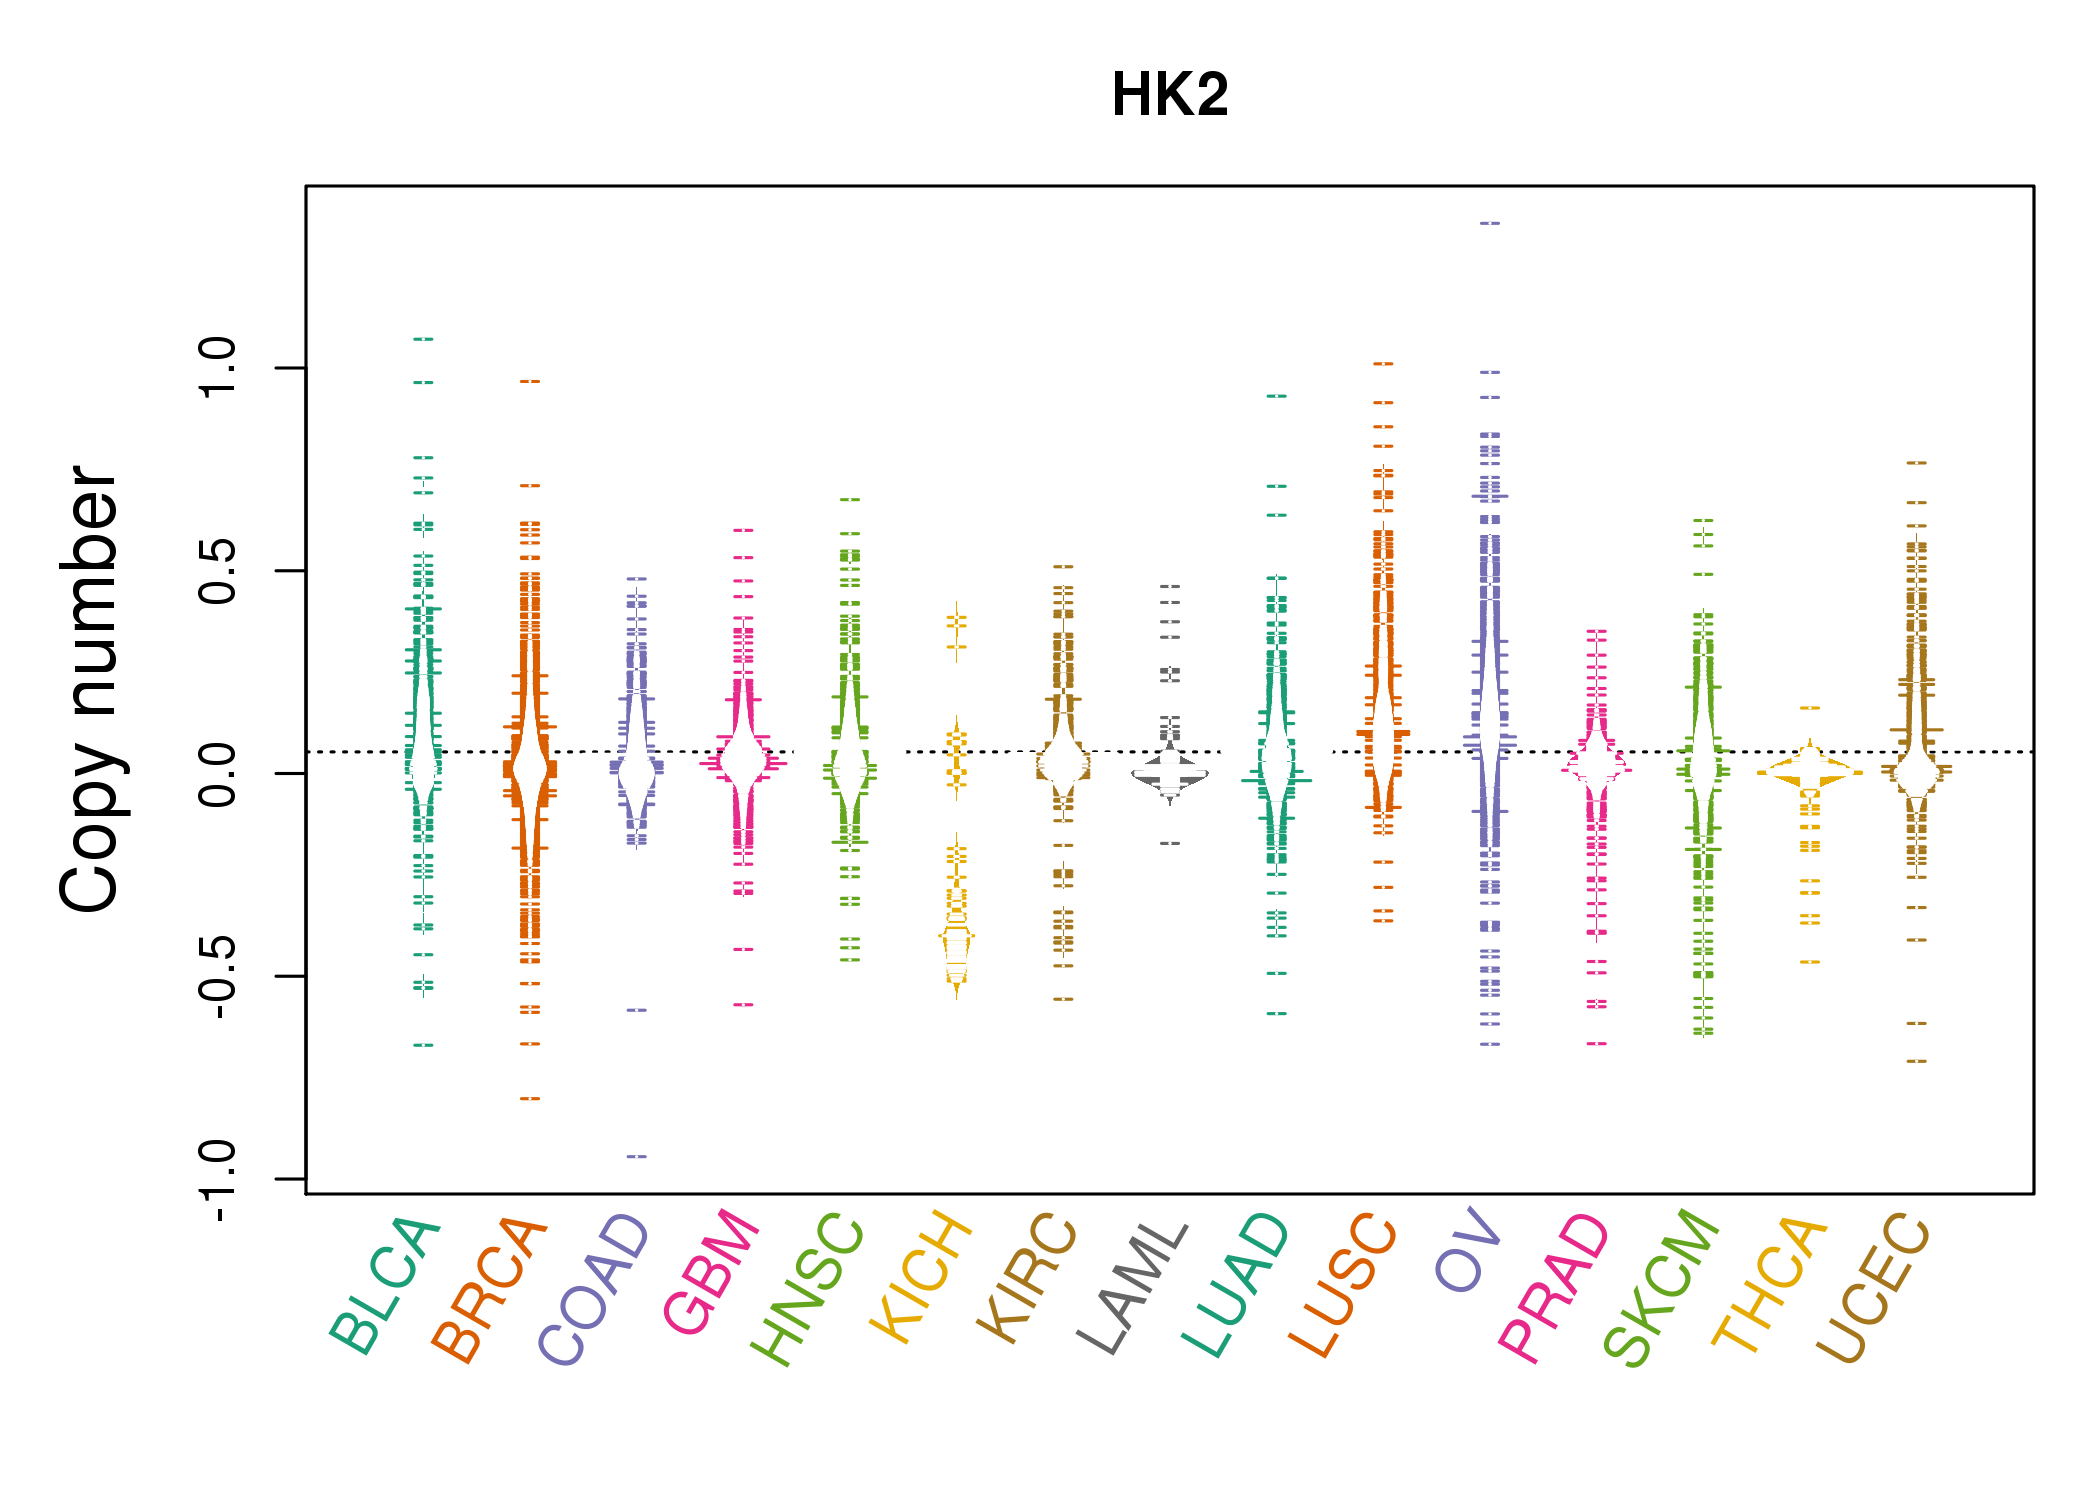 |
| cf) Tissue ID[Tissue type]: BLCA[Bladder Urothelial Carcinoma], BRCA[Breast invasive carcinoma], CESC[Cervical squamous cell carcinoma and endocervical adenocarcinoma], COAD[Colon adenocarcinoma], GBM[Glioblastoma multiforme], Glioma Low Grade, HNSC[Head and Neck squamous cell carcinoma], KICH[Kidney Chromophobe], KIRC[Kidney renal clear cell carcinoma], KIRP[Kidney renal papillary cell carcinoma], LAML[Acute Myeloid Leukemia], LUAD[Lung adenocarcinoma], LUSC[Lung squamous cell carcinoma], OV[Ovarian serous cystadenocarcinoma ], PAAD[Pancreatic adenocarcinoma], PRAD[Prostate adenocarcinoma], SKCM[Skin Cutaneous Melanoma], STAD[Stomach adenocarcinoma], THCA[Thyroid carcinoma], UCEC[Uterine Corpus Endometrial Carcinoma] |
| Top |
| Gene Expression for HK2 |
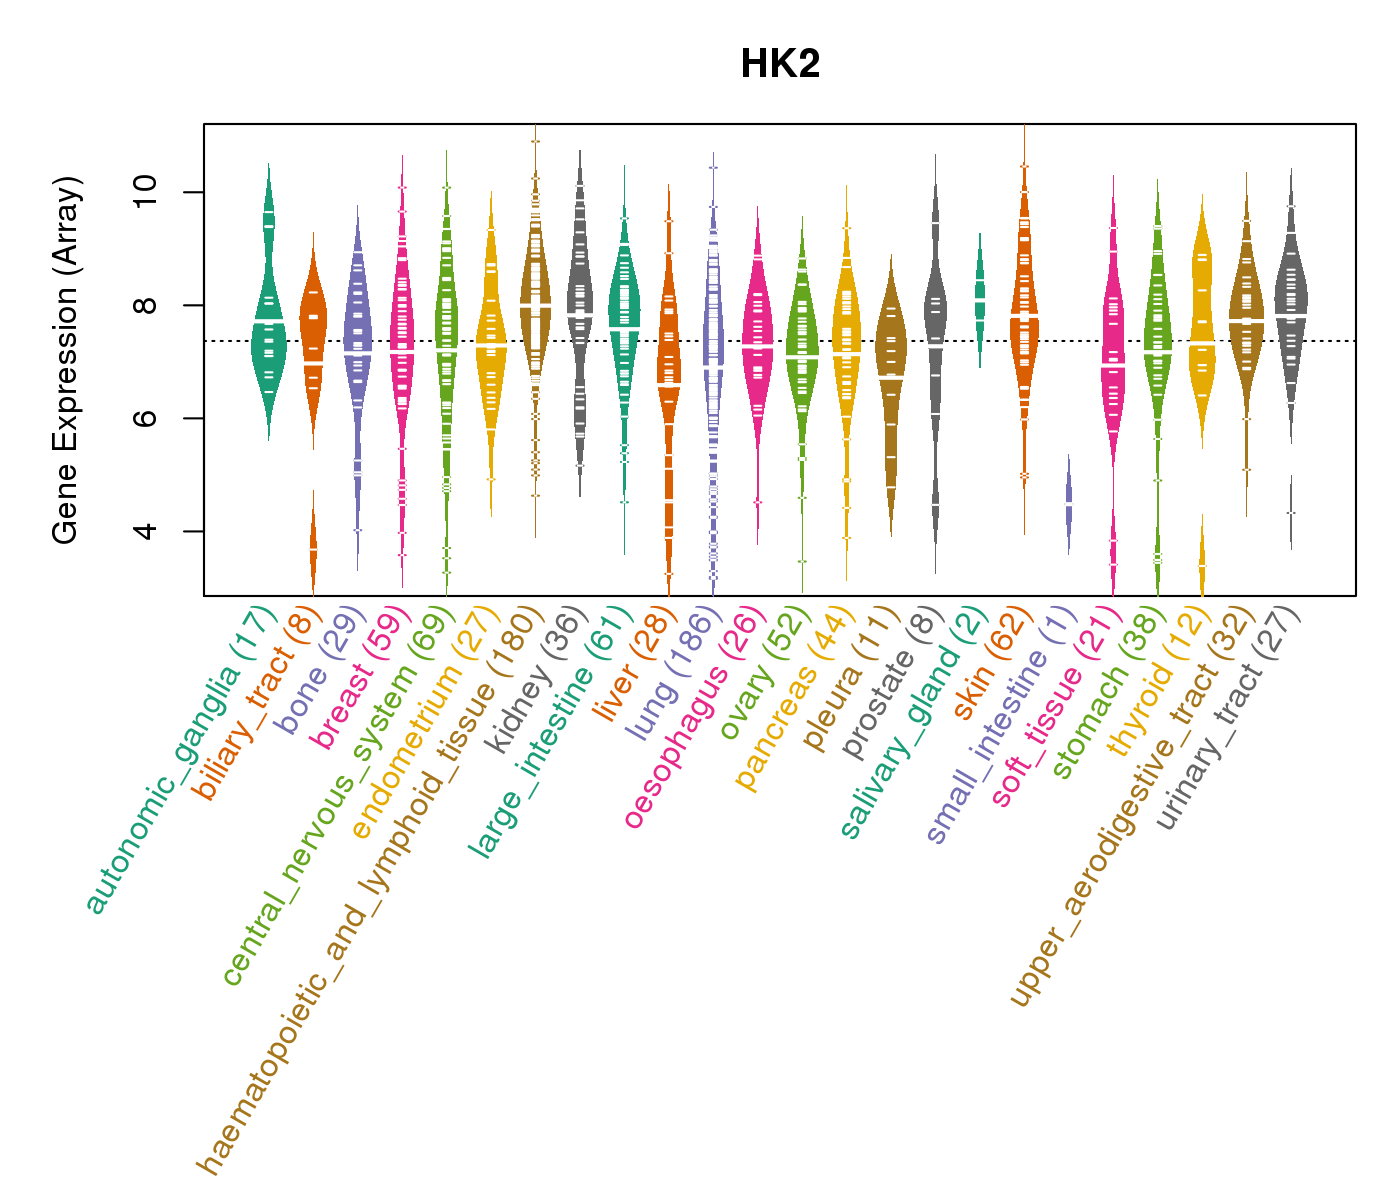
| * CCLE gene expression data were extracted from CCLE_Expression_Entrez_2012-10-18.res: Gene-centric RMA-normalized mRNA expression data. |
 |
| * Normalized gene expression data of RNASeqV2 was extracted from TCGA using R package TCGA-Assembler. The URLs of all public data files on TCGA DCC data server were gathered at Jan-05-2015. Only eight cancer types have enough normal control samples for differential expression analysis. (t test, adjusted p<0.05 (using Benjamini-Hochberg FDR)) |
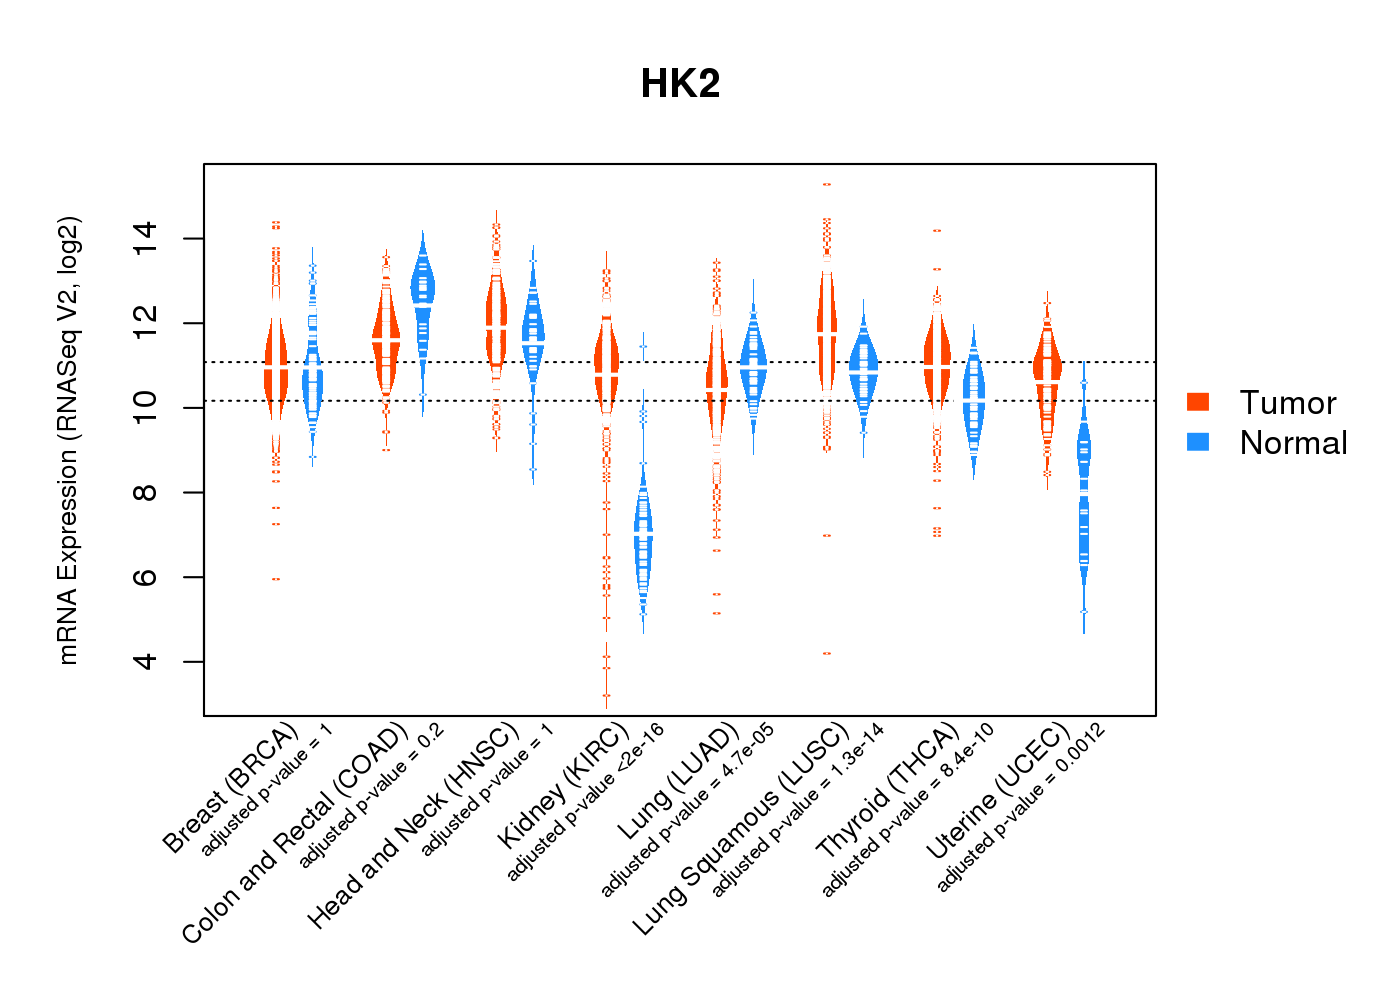 |
| Top |
| * This plots show the correlation between CNV and gene expression. |
: Open all plots for all cancer types
 |
|
 |
|
| Top |
| Gene-Gene Network Information |
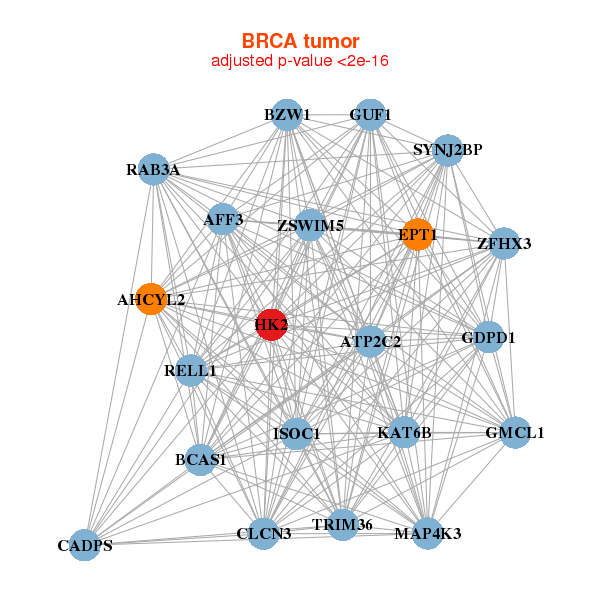
| * Co-Expression network figures were drawn using R package igraph. Only the top 20 genes with the highest correlations were shown. Red circle: input gene, orange circle: cell metabolism gene, sky circle: other gene |
: Open all plots for all cancer types
 |
|
| AFF3,AHCYL2,ATP2C2,BCAS1,BZW1,CADPS,CLCN3, EPT1,GDPD1,GMCL1,GUF1,HK2,ISOC1,MAP4K3, KAT6B,RAB3A,RELL1,SYNJ2BP,TRIM36,ZFHX3,ZSWIM5 | ACO1,AOC3,DMGDH,ESYT1,FZD4,GPAM,GPD1, HK2,LPL,MRAS,MTHFD1,NAT8L,PEX19,PLIN1, PRKAR2B,PXDN,PYGL,RBP4,TNS1,TSPAN3,VKORC1L1 |
 |
|
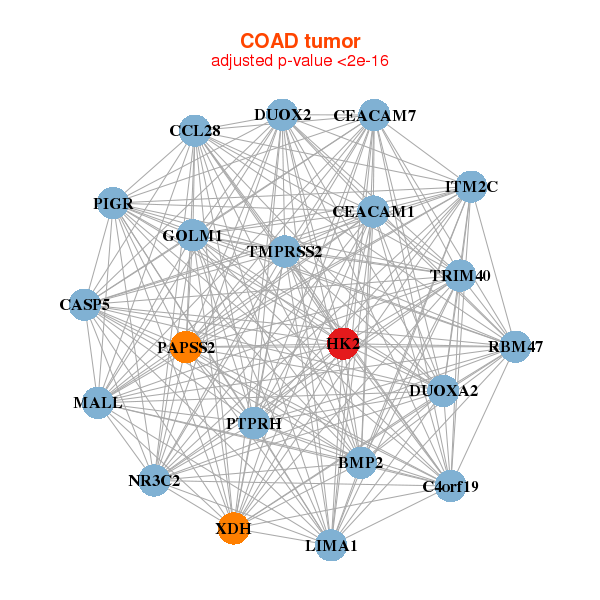
| BMP2,C4orf19,CASP5,CCL28,CEACAM1,CEACAM7,DUOX2, DUOXA2,GOLM1,HK2,ITM2C,LIMA1,MALL,NR3C2, PAPSS2,PIGR,PTPRH,RBM47,TMPRSS2,TRIM40,XDH | BAIAP2L1,CASP10,CEACAM1,CEACAM5,CEACAM6,CHD1,CLIC5, DNAJC3,DNAJC7,DTX3L,HK2,HPSE,LEO1,MUC1, RNF19B,RPS6KA4,SLCO2A1,TOP1,TRIM15,USP38,XDH |
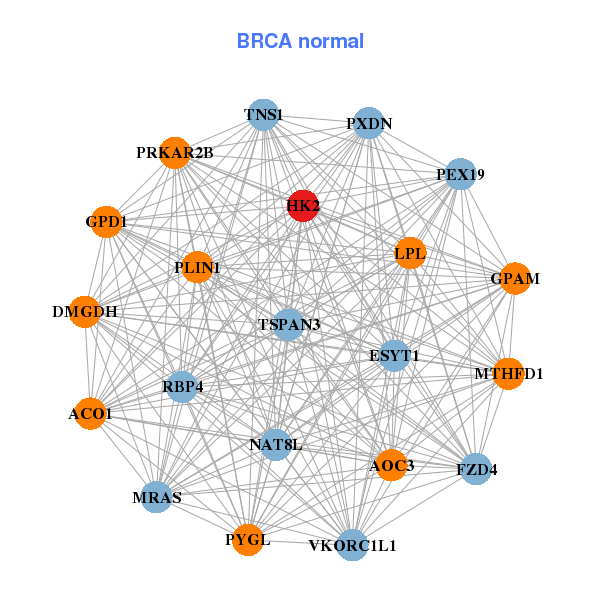
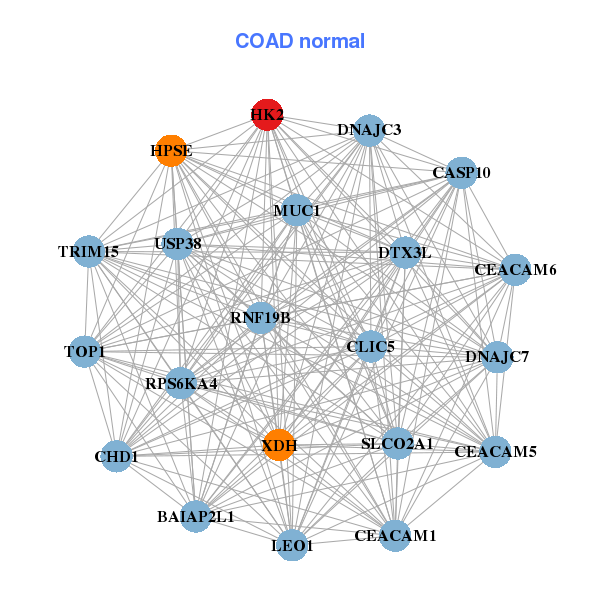
| * Co-Expression network figures were drawn using R package igraph. Only the top 20 genes with the highest correlations were shown. Red circle: input gene, orange circle: cell metabolism gene, sky circle: other gene |
: Open all plots for all cancer types
| Top |
: Open all interacting genes' information including KEGG pathway for all interacting genes from DAVID
| Top |
| Pharmacological Information for HK2 |
| There's no related Drug. |
| Top |
| Cross referenced IDs for HK2 |
| * We obtained these cross-references from Uniprot database. It covers 150 different DBs, 18 categories. http://www.uniprot.org/help/cross_references_section |
: Open all cross reference information
|
Copyright © 2016-Present - The Univsersity of Texas Health Science Center at Houston @ |