|
||||||||||||||||||||||||||||||||||||||||||||||||||||||||||||||||||||||||||||||||||||||||||||||||||||||||||||||||||||||||||||||||||||||||||||||||||||||||||||||||||||||||||||||||||||||||||||||||||||||||||||||||||||||||||||||||||||||||||||||||||||||||||||||||||||||||||||||||||||||||||||||||||||||||||||||||||||||||||||||||||||||||||||||||||||||||||||||||||||||||||||||||||||||
| |
| Phenotypic Information (metabolism pathway, cancer, disease, phenome) |
| |
| |
| Gene-Gene Network Information: Co-Expression Network, Interacting Genes & KEGG |
| |
|


| Gene Summary for ACACA |
| Basic gene info. | Gene symbol | ACACA |
| Gene name | acetyl-CoA carboxylase alpha | |
| Synonyms | ACAC|ACACAD|ACC|ACC1|ACCA | |
| Cytomap | UCSC genome browser: 17q21 | |
| Genomic location | chr17 :35441926-35766902 | |
| Type of gene | protein-coding | |
| RefGenes | NM_198834.2, NM_198836.2,NM_198837.1,NM_198838.1,NM_198839.2, NM_000664.3,NM_198835.1, | |
| Ensembl id | ENSG00000132142 | |
| Description | ACC-alphaacetyl-CoA carboxylase 1acetyl-Coenzyme A carboxylase alpha | |
| Modification date | 20141207 | |
| dbXrefs | MIM : 200350 | |
| HGNC : HGNC | ||
| Ensembl : ENSG00000278540 | ||
| HPRD : 01938 | ||
| Vega : OTTHUMG00000188463 | ||
| Protein | UniProt: Q13085 go to UniProt's Cross Reference DB Table | |
| Expression | CleanEX: HS_ACACA | |
| BioGPS: 31 | ||
| Gene Expression Atlas: ENSG00000132142 | ||
| The Human Protein Atlas: ENSG00000132142 | ||
| Pathway | NCI Pathway Interaction Database: ACACA | |
| KEGG: ACACA | ||
| REACTOME: ACACA | ||
| ConsensusPathDB | ||
| Pathway Commons: ACACA | ||
| Metabolism | MetaCyc: ACACA | |
| HUMANCyc: ACACA | ||
| Regulation | Ensembl's Regulation: ENSG00000132142 | |
| miRBase: chr17 :35,441,926-35,766,902 | ||
| TargetScan: NM_198834 | ||
| cisRED: ENSG00000132142 | ||
| Context | iHOP: ACACA | |
| cancer metabolism search in PubMed: ACACA | ||
| UCL Cancer Institute: ACACA | ||
| Assigned class in ccmGDB | A - This gene has a literature evidence and it belongs to cancer gene. | |
| References showing role of ACACA in cancer cell metabolism | 1. Moreno-Navarrete JM, Moreno M, Vidal M, Ortega F, Serrano M, et al. (2015) Deleted in breast cancer 1 plays a functional role in adipocyte differentiation. Am J Physiol Endocrinol Metab 308: E554-561. doi: 10.1152/ajpendo.00286.2014. go to article 2. Volden PA, Wonder EL, Skor MN, Carmean CM, Patel FN, et al. (2013) Chronic social isolation is associated with metabolic gene expression changes specific to mammary adipose tissue. Cancer Prev Res (Phila) 6: 634-645. doi: 10.1158/1940-6207.CAPR-12-0458. pmid: 3881320 go to article 3. Corominas-Faja B, Cuyas E, Gumuzio J, Bosch-Barrera J, Leis O, et al. (2014) Chemical inhibition of acetyl-CoA carboxylase suppresses self-renewal growth of cancer stem cells. Oncotarget 5: 8306-8316. pmid: 4226684 go to article 4. Leyssens C, Marien E, Verlinden L, Derua R, Waelkens E, et al. (2015) Remodeling of phospholipid composition in colon cancer cells by 1alpha,25(OH)2D3 and its analogs. J Steroid Biochem Mol Biol 148: 172-178. doi: 10.1016/j.jsbmb.2015.01.018. go to article 5. Vazquez-Martin A, Corominas-Faja B, Cufi S, Vellon L, Oliveras-Ferraros C, et al. (2013) The mitochondrial H(+)-ATP synthase and the lipogenic switch: new core components of metabolic reprogramming in induced pluripotent stem (iPS) cells. Cell Cycle 12: 207-218. doi: 10.4161/cc.23352. pmid: 3575450 go to article | |
| Top |
| Phenotypic Information for ACACA(metabolism pathway, cancer, disease, phenome) |
| Cancer | CGAP: ACACA |
| Familial Cancer Database: ACACA | |
| * This gene is included in those cancer gene databases. |
|
|
|
|
|
|
| ||||||||||||||||||||||||||||||||||||||||||||||||||||||||||||||||||||||||||||||||||||||||||||||||||||||||||||||||||||||||||||||||||||||||||||||||||||||||||||||||||||||||||||||||||||||||||||||||||||||||||||||||||||||||||||||||||||||||||||||||||||||||||||||||||||||||||||||||||||||||||||||||||||||||||||||||||||||||||||||||||||||||||||||||||||||||||||||||||||||||||||||||
Oncogene 1 | Significant driver gene in | |||||||||||||||||||||||||||||||||||||||||||||||||||||||||||||||||||||||||||||||||||||||||||||||||||||||||||||||||||||||||||||||||||||||||||||||||||||||||||||||||||||||||||||||||||||||||||||||||||||||||||||||||||||||||||||||||||||||||||||||||||||||||||||||||||||||||||||||||||||||||||||||||||||||||||||||||||||||||||||||||||||||||||||||||||||||||||||||||||||||||||||||||||||
| cf) number; DB name 1 Oncogene; http://nar.oxfordjournals.org/content/35/suppl_1/D721.long, 2 Tumor Suppressor gene; https://bioinfo.uth.edu/TSGene/, 3 Cancer Gene Census; http://www.nature.com/nrc/journal/v4/n3/abs/nrc1299.html, 4 CancerGenes; http://nar.oxfordjournals.org/content/35/suppl_1/D721.long, 5 Network of Cancer Gene; http://ncg.kcl.ac.uk/index.php, 1Therapeutic Vulnerabilities in Cancer; http://cbio.mskcc.org/cancergenomics/statius/ |
| KEGG_PYRUVATE_METABOLISM KEGG_PROPANOATE_METABOLISM REACTOME_INTEGRATION_OF_ENERGY_METABOLISM REACTOME_METABOLISM_OF_LIPIDS_AND_LIPOPROTEINS | |
| OMIM | 200350; gene. 200350; gene. 613933; phenotype. 613933; phenotype. |
| Orphanet | |
| Disease | KEGG Disease: ACACA |
| MedGen: ACACA (Human Medical Genetics with Condition) | |
| ClinVar: ACACA | |
| Phenotype | MGI: ACACA (International Mouse Phenotyping Consortium) |
| PhenomicDB: ACACA | |
| Mutations for ACACA |
| * Under tables are showing count per each tissue to give us broad intuition about tissue specific mutation patterns.You can go to the detailed page for each mutation database's web site. |
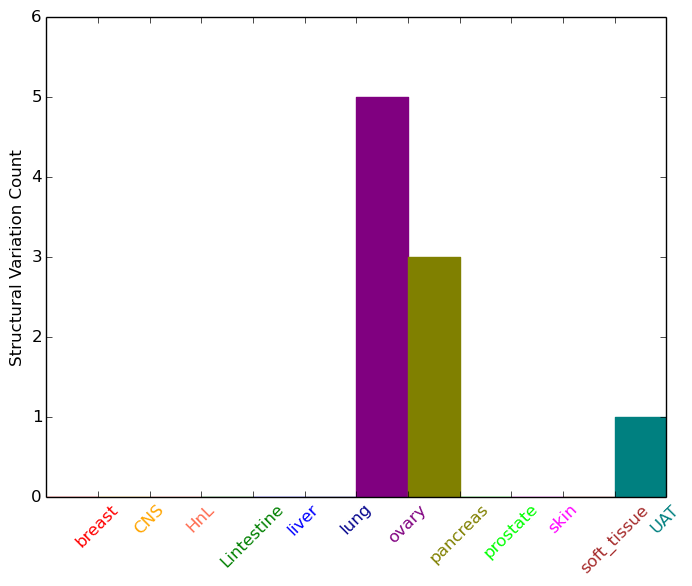
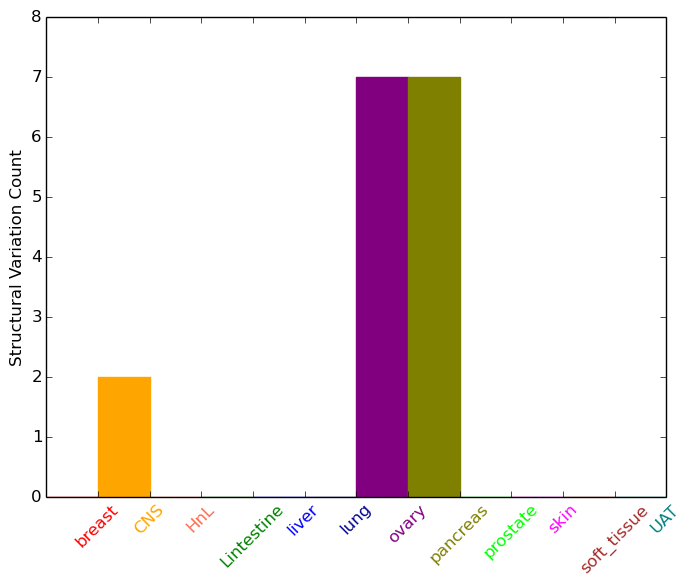
| - Statistics for Tissue and Mutation type | Top |
 |
| - For Inter-chromosomal Variations |
| * Inter-chromosomal variantions includes 'interchromosomal amplicon to amplicon', 'interchromosomal amplicon to non-amplified dna', 'interchromosomal insertion', 'Interchromosomal unknown type'. |
 |
| - For Intra-chromosomal Variations |
| * Intra-chromosomal variantions includes 'intrachromosomal amplicon to amplicon', 'intrachromosomal amplicon to non-amplified dna', 'intrachromosomal deletion', 'intrachromosomal fold-back inversion', 'intrachromosomal inversion', 'intrachromosomal tandem duplication', 'Intrachromosomal unknown type', 'intrachromosomal with inverted orientation', 'intrachromosomal with non-inverted orientation'. |
 |
| Sample | Symbol_a | Chr_a | Start_a | End_a | Symbol_b | Chr_b | Start_b | End_b |
| central_nervous_system | ACACA | chr17 | 35755632 | 35755632 | ACACA | chr17 | 35758826 | 35758826 |
| central_nervous_system | ACACA | chr17 | 35755643 | 35755643 | ACACA | chr17 | 35758807 | 35758807 |
| ovary | ACACA | chr17 | 35492008 | 35492028 | ACACA | chr17 | 35492271 | 35492291 |
| ovary | ACACA | chr17 | 35507739 | 35507759 | GGNBP2 | chr17 | 34914207 | 34914227 |
| ovary | ACACA | chr17 | 35512781 | 35512801 | AATF | chr17 | 35406977 | 35406997 |
| ovary | ACACA | chr17 | 35530905 | 35530925 | ACACA | chr17 | 35534243 | 35534263 |
| ovary | ACACA | chr17 | 35532393 | 35532413 | chr17 | 45046026 | 45046046 | |
| ovary | ACACA | chr17 | 35657517 | 35657537 | ADRBK2 | chr22 | 26008739 | 26008759 |
| ovary | ACACA | chr17 | 35714732 | 35714752 | chr17 | 45039058 | 45039078 | |
| pancreas | ACACA | chr17 | 35453740 | 35453760 | MRPL45 | chr17 | 36461866 | 36461886 |
| pancreas | ACACA | chr17 | 35476890 | 35476910 | ACACA | chr17 | 35478795 | 35478815 |
| pancreas | ACACA | chr17 | 35499723 | 35499743 | ACACA | chr17 | 35617114 | 35617134 |
| pancreas | ACACA | chr17 | 35628366 | 35628386 | ACACA | chr17 | 35631005 | 35631025 |
| pancreas | ACACA | chr17 | 35654318 | 35654338 | STK3 | chr8 | 99698169 | 99698189 |
| pancreas | ACACA | chr17 | 35741875 | 35741895 | LOC440434 | chr17 | 36401752 | 36401772 |
| pancreas | ACACA | chr17 | 35752230 | 35752250 | ACACA | chr17 | 35758781 | 35758801 |
| pancreas | ACACA | chr17 | 35755483 | 35755683 | ACACA | chr17 | 35758697 | 35758897 |
| cf) Tissue number; Tissue name (1;Breast, 2;Central_nervous_system, 3;Haematopoietic_and_lymphoid_tissue, 4;Large_intestine, 5;Liver, 6;Lung, 7;Ovary, 8;Pancreas, 9;Prostate, 10;Skin, 11;Soft_tissue, 12;Upper_aerodigestive_tract) |
| * From mRNA Sanger sequences, Chitars2.0 arranged chimeric transcripts. This table shows ACACA related fusion information. |
| ID | Head Gene | Tail Gene | Accession | Gene_a | qStart_a | qEnd_a | Chromosome_a | tStart_a | tEnd_a | Gene_a | qStart_a | qEnd_a | Chromosome_a | tStart_a | tEnd_a |
| BF910869 | RGPD5 | 1 | 143 | 2 | 113146685 | 113146827 | ACACA | 137 | 191 | 17 | 35591930 | 35591984 | |
| XX000005 | ACACA | 1 | 71 | 17 | 35479453 | 35479523 | STAC2 | 70 | 150 | 17 | 37374348 | 37374428 | |
| BF511511 | DOK3 | 25 | 368 | 5 | 176928911 | 176929254 | ACACA | 362 | 439 | 17 | 35540059 | 35540136 | |
| BF800878 | ACACA | 15 | 169 | 17 | 35765424 | 35765578 | PRKDC | 162 | 285 | 8 | 48798797 | 48798920 | |
| Top |
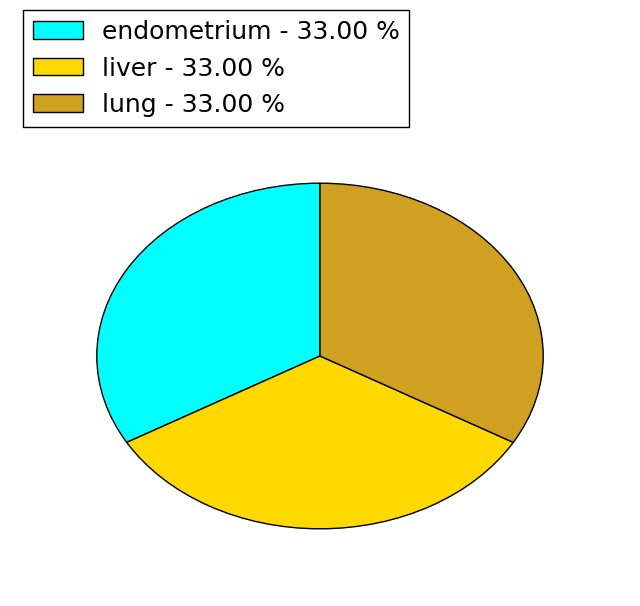
| Mutation type/ Tissue ID | brca | cns | cerv | endome | haematopo | kidn | Lintest | liver | lung | ns | ovary | pancre | prost | skin | stoma | thyro | urina | |||
| Total # sample | 12 | 3 | 4 | 1 | 1 | 4 | 2 | |||||||||||||
| GAIN (# sample) | 11 | 2 | 4 | 1 | 1 | 4 | 2 | |||||||||||||
| LOSS (# sample) | 2 | 1 | 1 |
| cf) Tissue ID; Tissue type (1; Breast, 2; Central_nervous_system, 3; Cervix, 4; Endometrium, 5; Haematopoietic_and_lymphoid_tissue, 6; Kidney, 7; Large_intestine, 8; Liver, 9; Lung, 10; NS, 11; Ovary, 12; Pancreas, 13; Prostate, 14; Skin, 15; Stomach, 16; Thyroid, 17; Urinary_tract) |
| Top |
|
 |
| Top |
| Stat. for Non-Synonymous SNVs (# total SNVs=176) | (# total SNVs=44) |
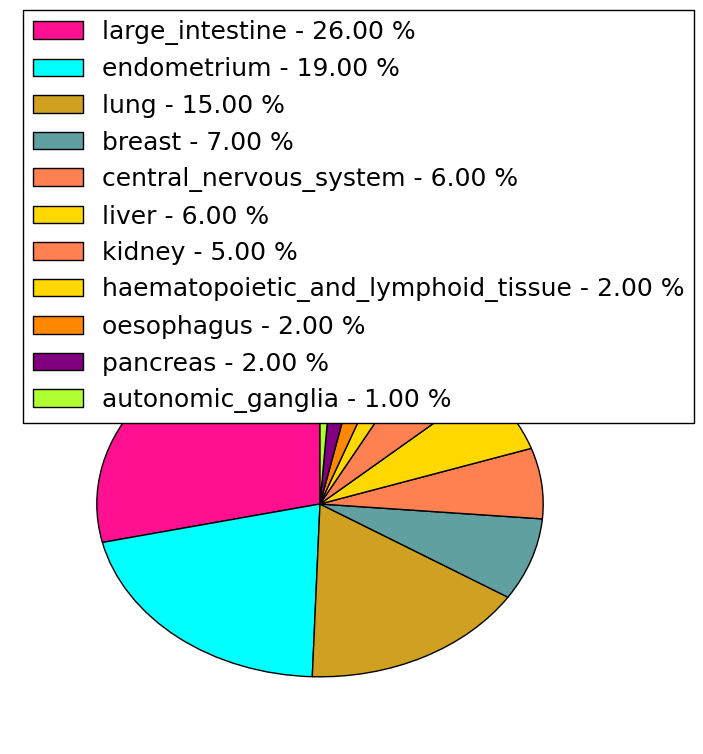 | 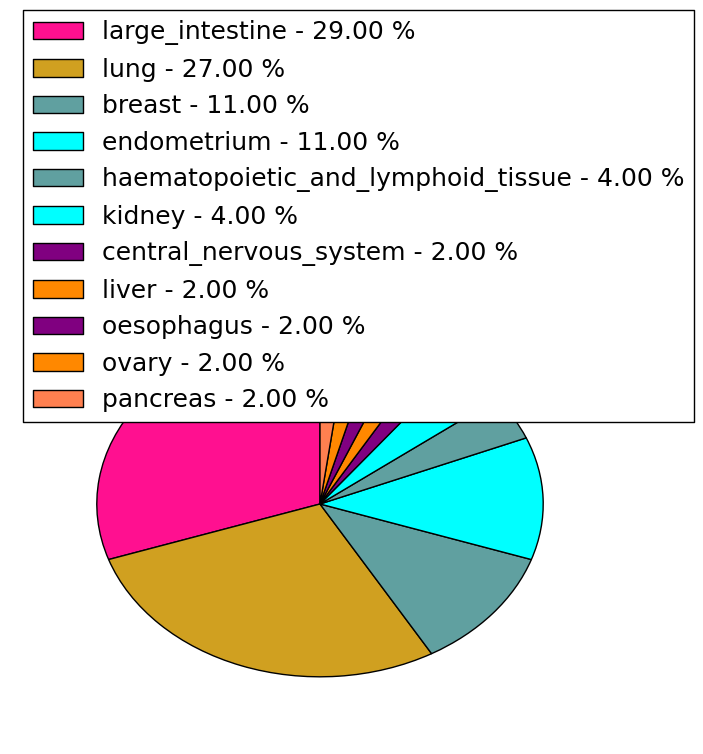 |
(# total SNVs=3) | (# total SNVs=1) |
 |  |
| Top |
| * When you move the cursor on each content, you can see more deailed mutation information on the Tooltip. Those are primary_site,primary_histology,mutation(aa),pubmedID. |
| GRCh37 position | Mutation(aa) | Unique sampleID count |
| chr17:35518873-35518873 | p.R1629Q | 4 |
| chr17:35518742-35518742 | p.R1673C | 4 |
| chr17:35591977-35591977 | p.E958D | 2 |
| chr17:35518824-35518824 | p.S1645S | 2 |
| chr17:35578665-35578665 | p.L1126L | 2 |
| chr17:35506823-35506823 | p.H1787Y | 2 |
| chr17:35486393-35486393 | p.P1853S | 2 |
| chr17:35614625-35614625 | p.S514L | 2 |
| chr17:35454849-35454849 | p.L2117L | 2 |
| chr17:35591991-35591991 | p.A954T | 2 |
| Top |
|
 |
| Point Mutation/ Tissue ID | 1 | 2 | 3 | 4 | 5 | 6 | 7 | 8 | 9 | 10 | 11 | 12 | 13 | 14 | 15 | 16 | 17 | 18 | 19 | 20 |
| # sample | 13 | 4 | 1 | 34 | 5 | 12 | 7 | 16 | 7 | 1 | 1 | 25 | 18 | 1 | 23 | |||||
| # mutation | 14 | 4 | 1 | 36 | 5 | 12 | 7 | 20 | 7 | 1 | 1 | 29 | 22 | 1 | 34 | |||||
| nonsynonymous SNV | 10 | 3 | 1 | 27 | 4 | 11 | 6 | 14 | 4 | 1 | 18 | 16 | 1 | 29 | ||||||
| synonymous SNV | 4 | 1 | 9 | 1 | 1 | 1 | 6 | 3 | 1 | 11 | 6 | 5 |
| cf) Tissue ID; Tissue type (1; BLCA[Bladder Urothelial Carcinoma], 2; BRCA[Breast invasive carcinoma], 3; CESC[Cervical squamous cell carcinoma and endocervical adenocarcinoma], 4; COAD[Colon adenocarcinoma], 5; GBM[Glioblastoma multiforme], 6; Glioma Low Grade, 7; HNSC[Head and Neck squamous cell carcinoma], 8; KICH[Kidney Chromophobe], 9; KIRC[Kidney renal clear cell carcinoma], 10; KIRP[Kidney renal papillary cell carcinoma], 11; LAML[Acute Myeloid Leukemia], 12; LUAD[Lung adenocarcinoma], 13; LUSC[Lung squamous cell carcinoma], 14; OV[Ovarian serous cystadenocarcinoma ], 15; PAAD[Pancreatic adenocarcinoma], 16; PRAD[Prostate adenocarcinoma], 17; SKCM[Skin Cutaneous Melanoma], 18:STAD[Stomach adenocarcinoma], 19:THCA[Thyroid carcinoma], 20:UCEC[Uterine Corpus Endometrial Carcinoma]) |
| Top |
| * We represented just top 10 SNVs. When you move the cursor on each content, you can see more deailed mutation information on the Tooltip. Those are primary_site, primary_histology, mutation(aa), pubmedID. |
| Genomic Position | Mutation(aa) | Unique sampleID count |
| chr17:35518742 | p.R1673C,ACACA | 4 |
| chr17:35518873 | p.R1629Q,ACACA | 3 |
| chr17:35640208 | p.N214K,ACACA | 2 |
| chr17:35468504 | p.R918Q,ACACA | 2 |
| chr17:35545329 | p.R1460H,ACACA | 2 |
| chr17:35506883 | p.L2117L,ACACA | 2 |
| chr17:35641791 | p.R2081L,ACACA | 2 |
| chr17:35631165 | p.F95F,ACACA | 2 |
| chr17:35597475 | p.G1801R,ACACA | 2 |
| chr17:35454849 | p.E958D,ACACA | 2 |
| * Copy number data were extracted from TCGA using R package TCGA-Assembler. The URLs of all public data files on TCGA DCC data server were gathered on Jan-05-2015. Function ProcessCNAData in TCGA-Assembler package was used to obtain gene-level copy number value which is calculated as the average copy number of the genomic region of a gene. |
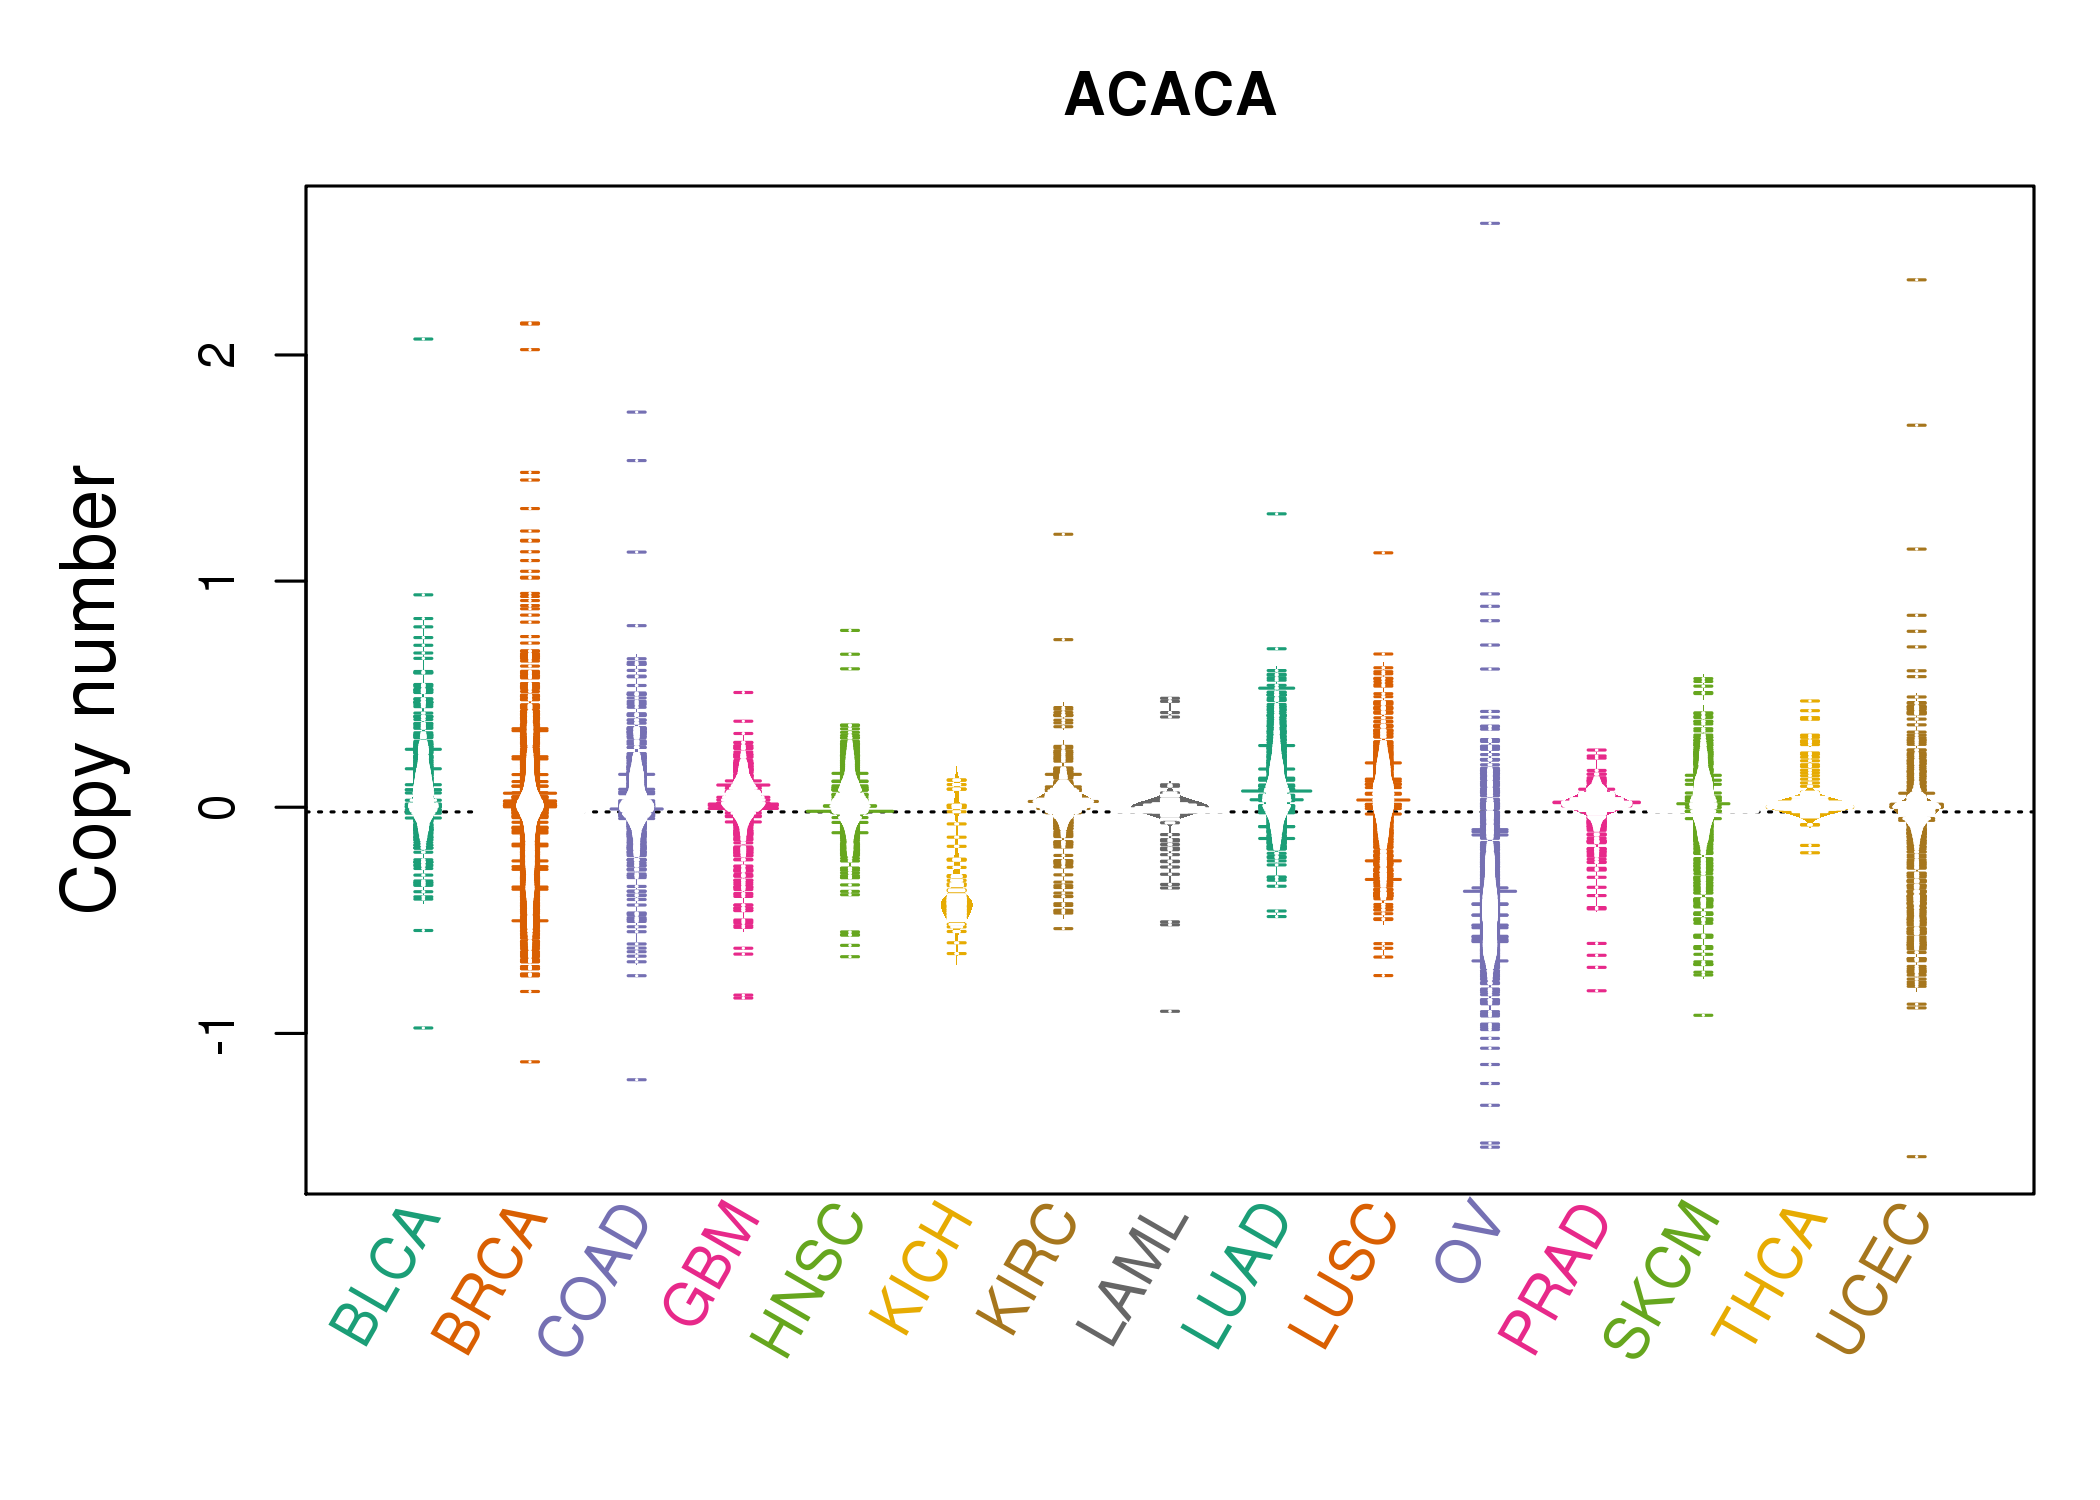 |
| cf) Tissue ID[Tissue type]: BLCA[Bladder Urothelial Carcinoma], BRCA[Breast invasive carcinoma], CESC[Cervical squamous cell carcinoma and endocervical adenocarcinoma], COAD[Colon adenocarcinoma], GBM[Glioblastoma multiforme], Glioma Low Grade, HNSC[Head and Neck squamous cell carcinoma], KICH[Kidney Chromophobe], KIRC[Kidney renal clear cell carcinoma], KIRP[Kidney renal papillary cell carcinoma], LAML[Acute Myeloid Leukemia], LUAD[Lung adenocarcinoma], LUSC[Lung squamous cell carcinoma], OV[Ovarian serous cystadenocarcinoma ], PAAD[Pancreatic adenocarcinoma], PRAD[Prostate adenocarcinoma], SKCM[Skin Cutaneous Melanoma], STAD[Stomach adenocarcinoma], THCA[Thyroid carcinoma], UCEC[Uterine Corpus Endometrial Carcinoma] |
| Top |
| Gene Expression for ACACA |
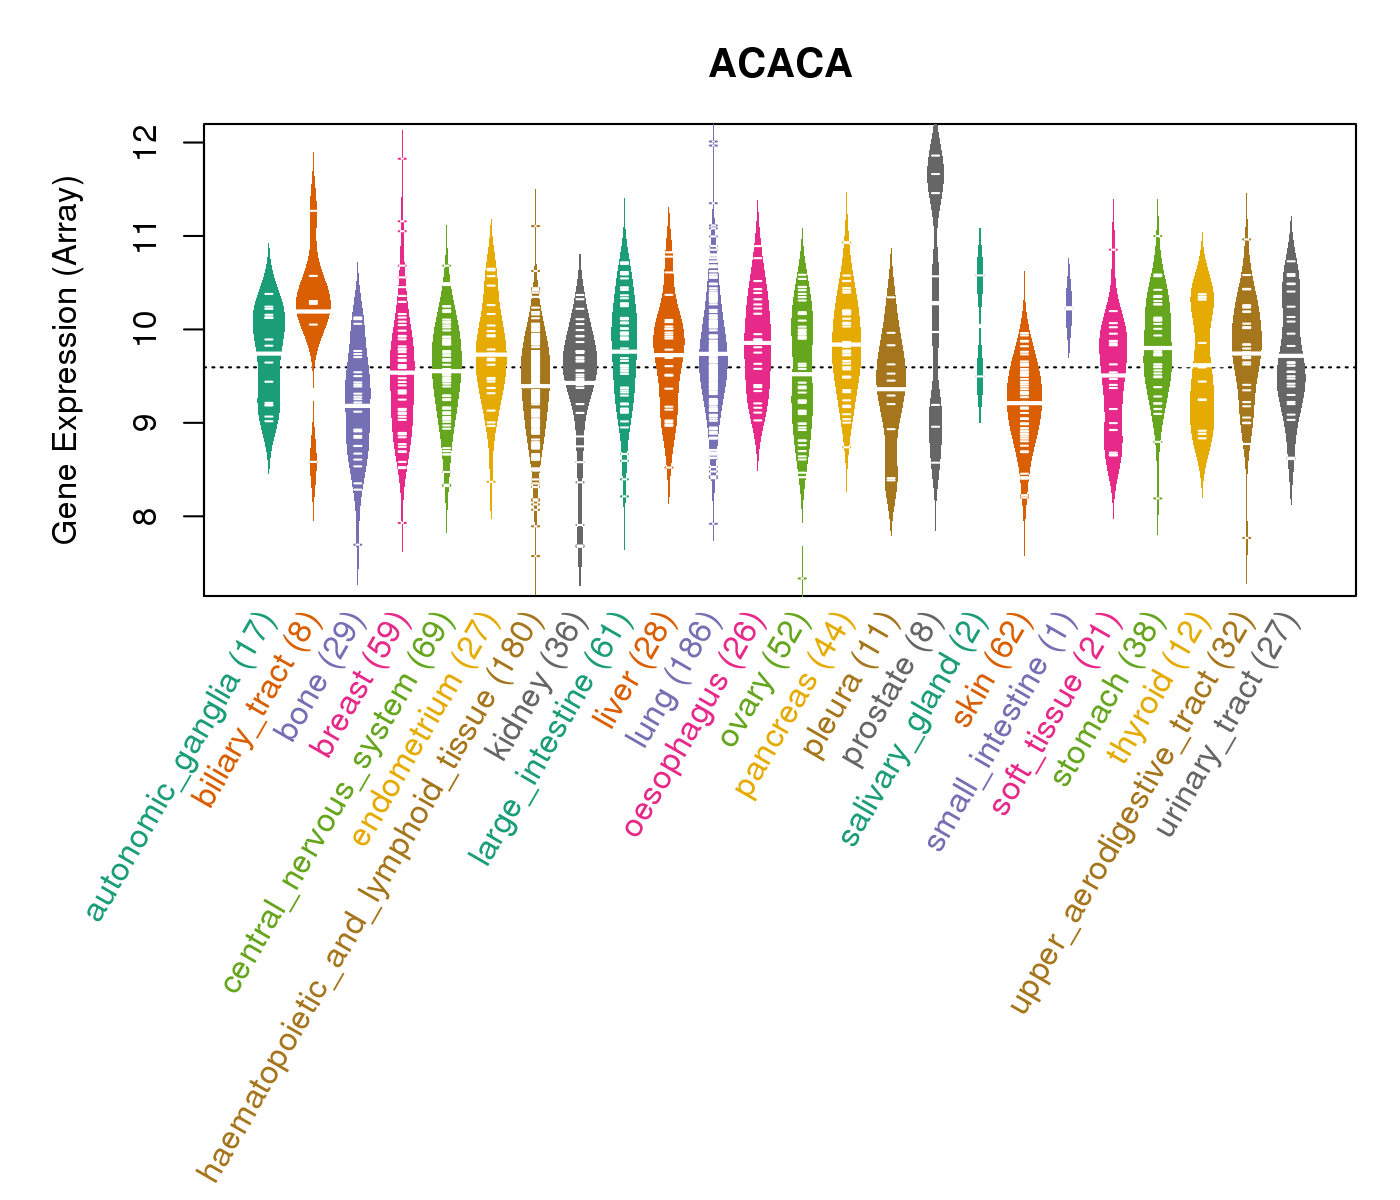
| * CCLE gene expression data were extracted from CCLE_Expression_Entrez_2012-10-18.res: Gene-centric RMA-normalized mRNA expression data. |
 |
| Top |
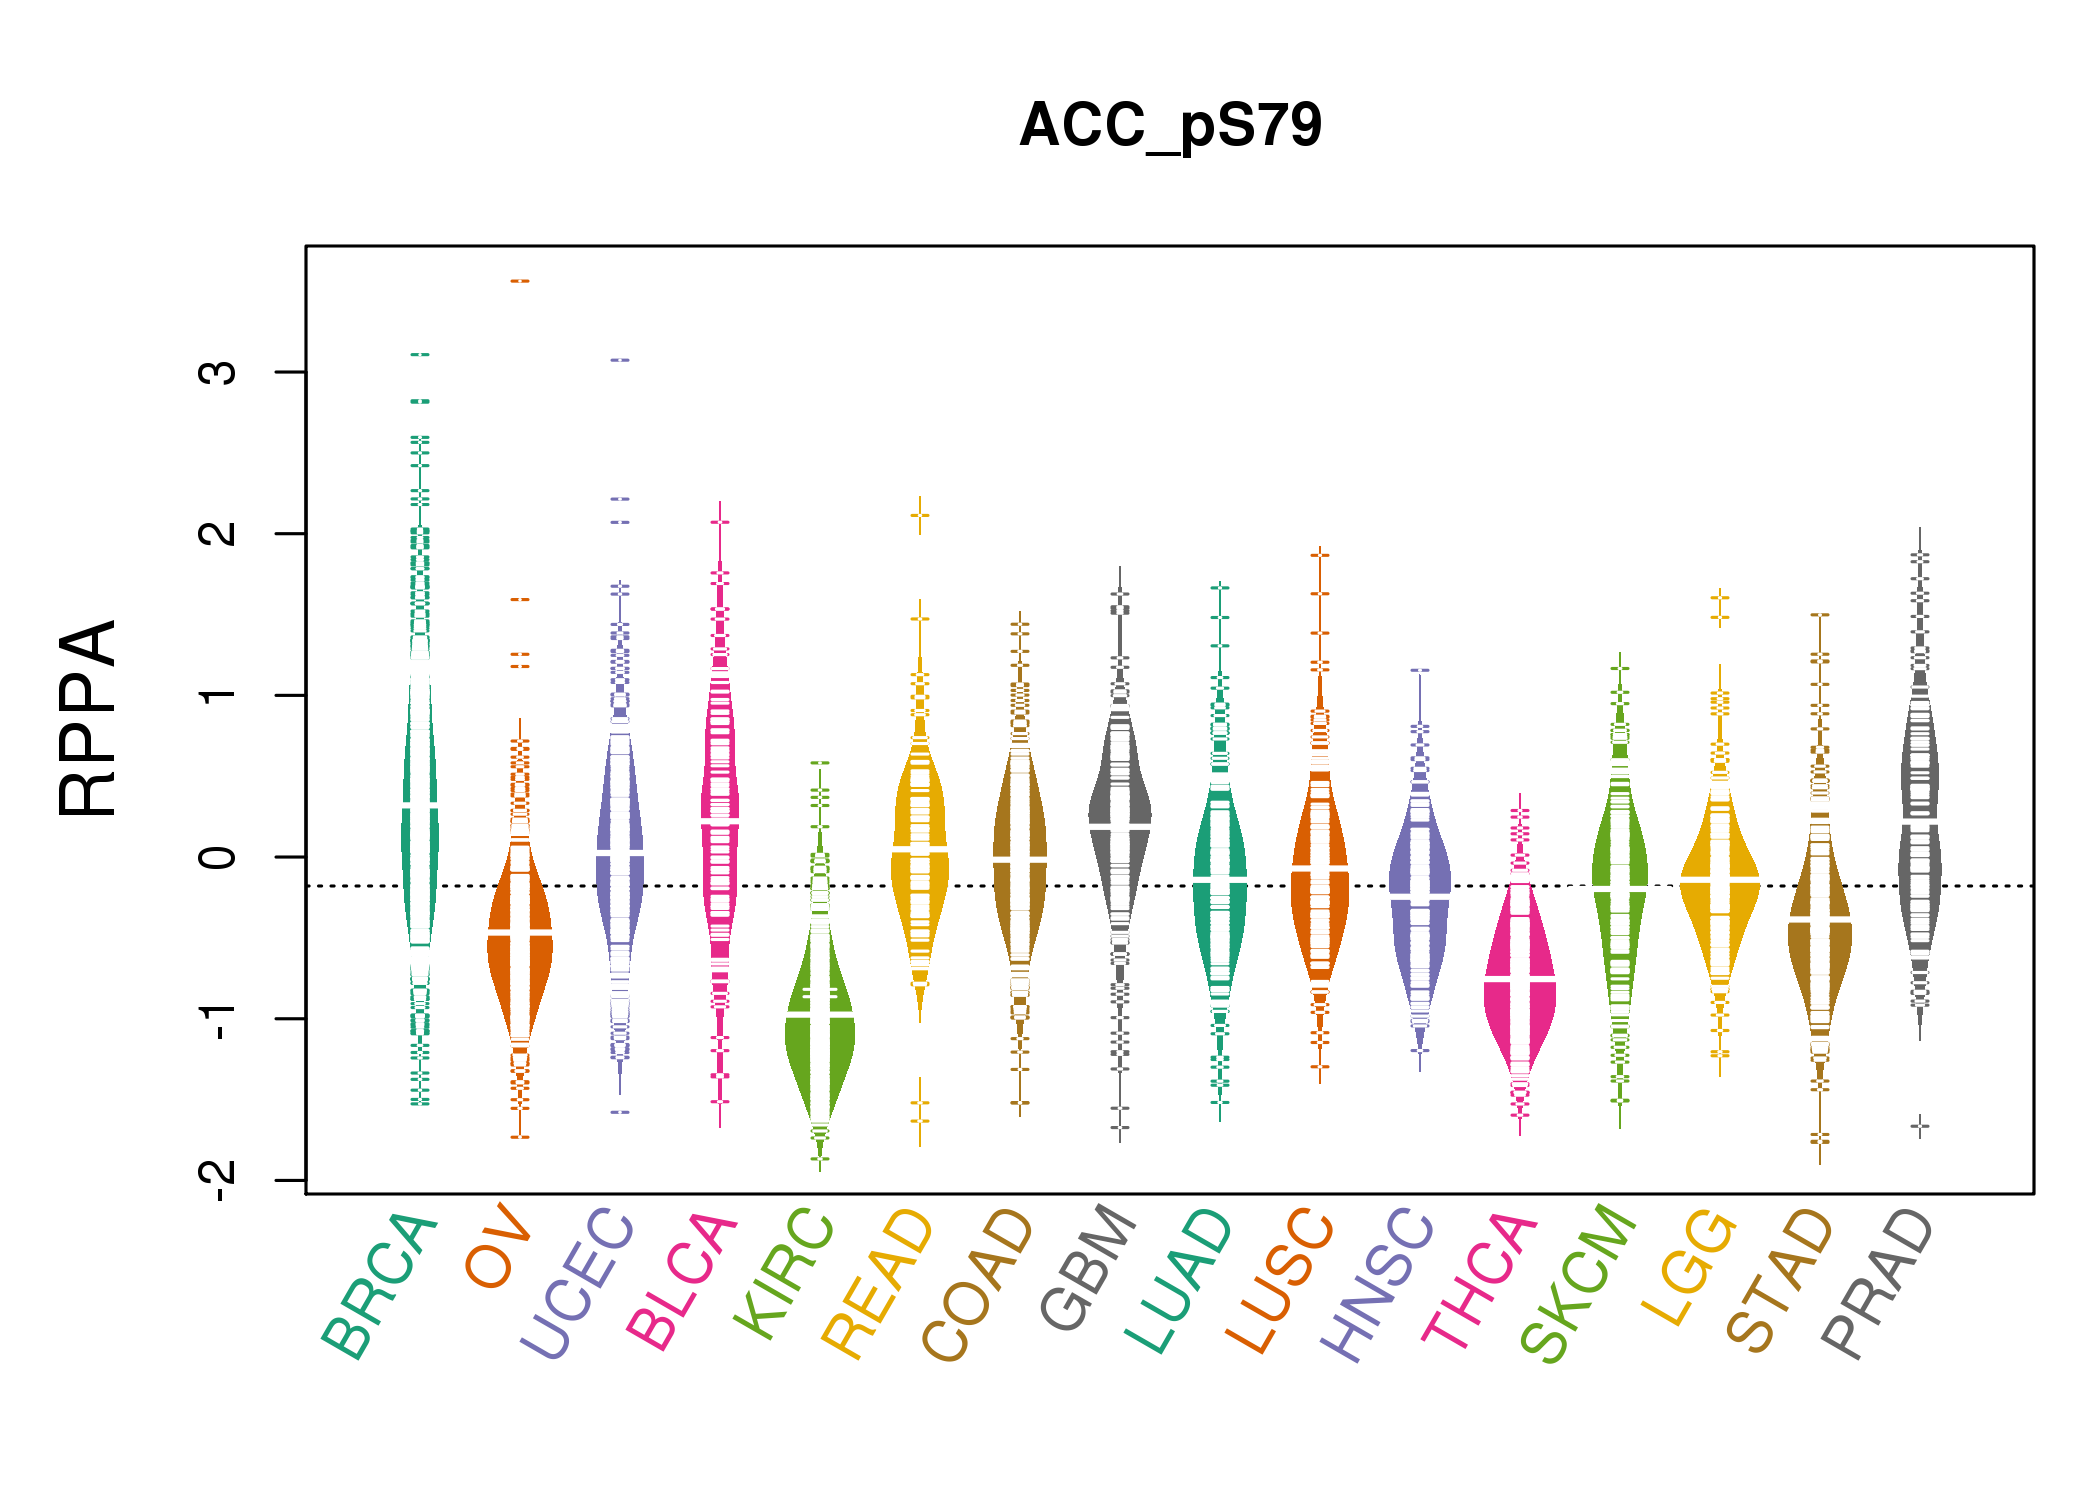
| *RPPA protein expression data were extracted from TCPA (The Cancer Proteome Atlas). Normalized data based on replicated based normalization (RBN) was used to draw following figures. |
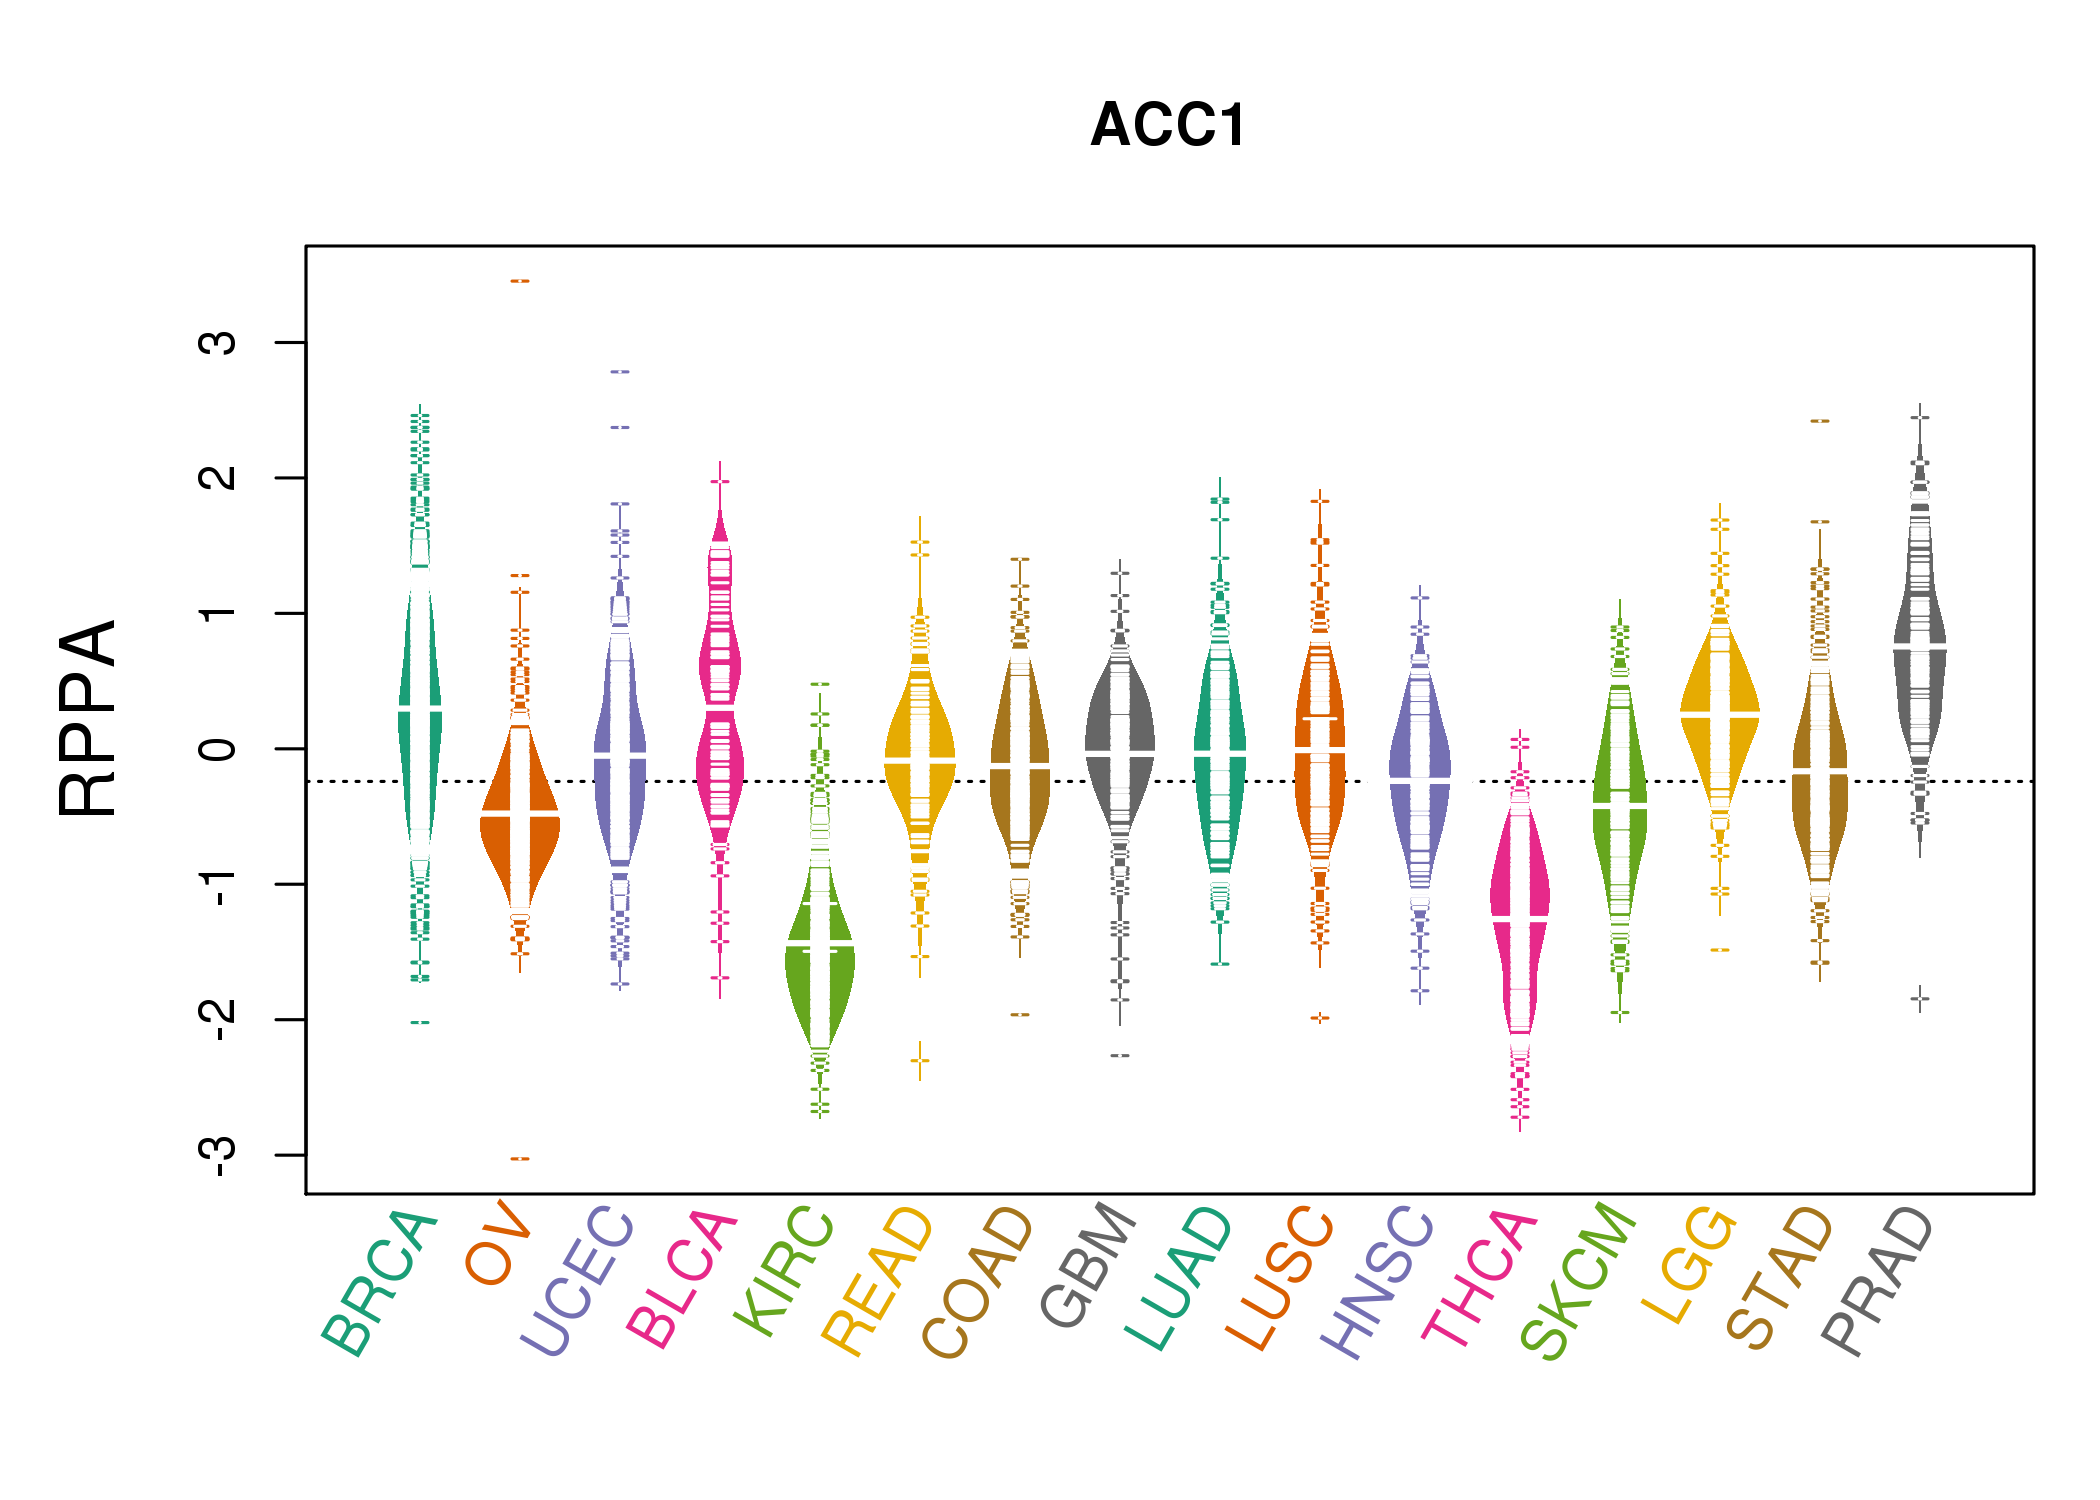 |
 |
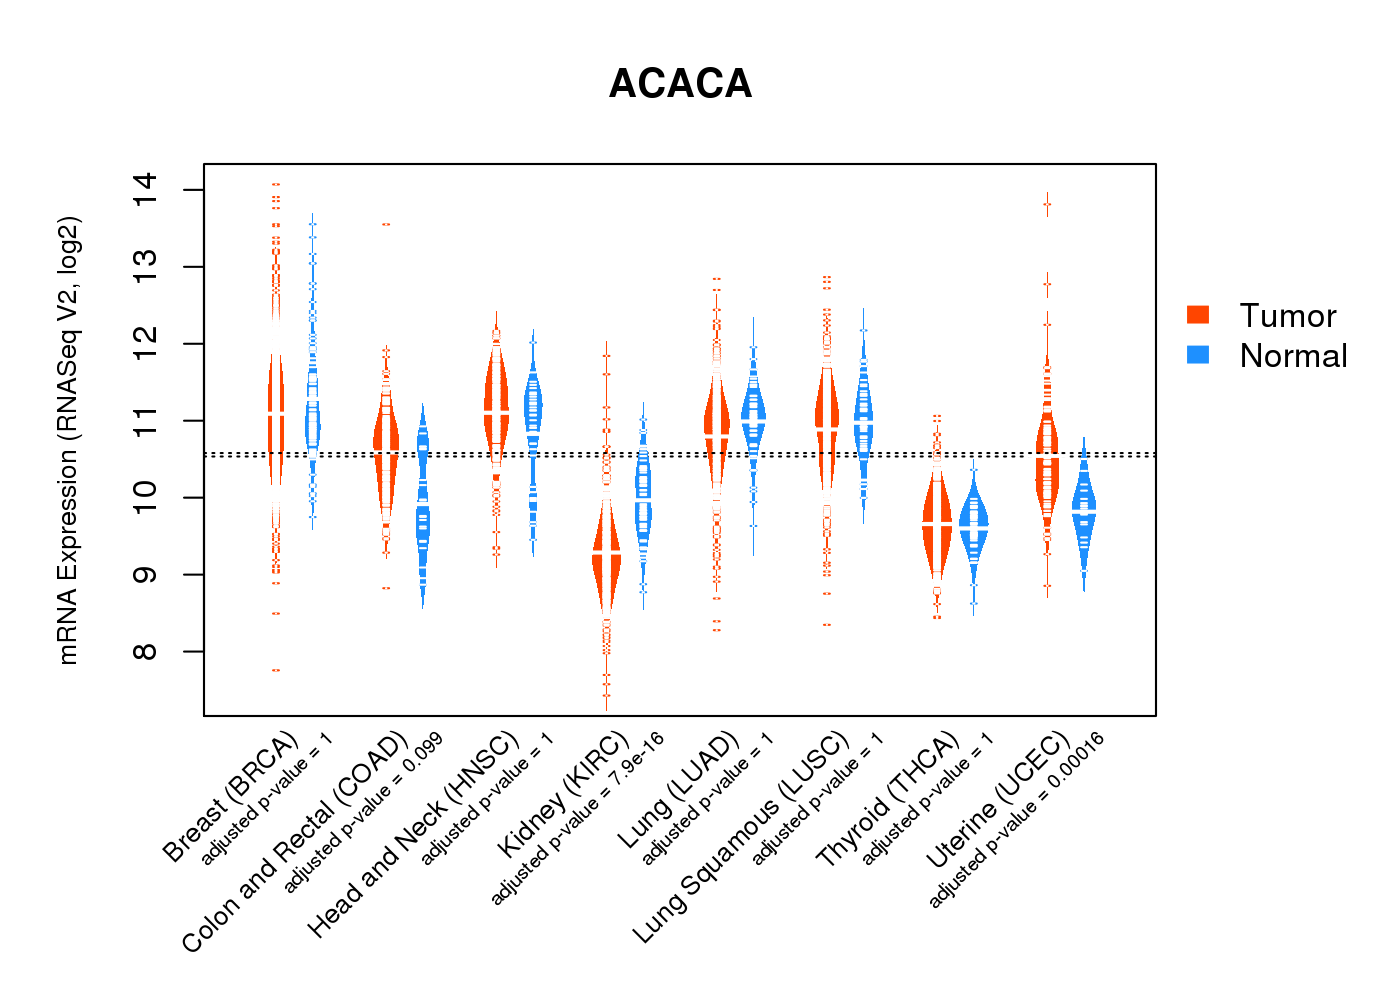
| * Normalized gene expression data of RNASeqV2 was extracted from TCGA using R package TCGA-Assembler. The URLs of all public data files on TCGA DCC data server were gathered at Jan-05-2015. Only eight cancer types have enough normal control samples for differential expression analysis. (t test, adjusted p<0.05 (using Benjamini-Hochberg FDR)) |
 |
| Top |
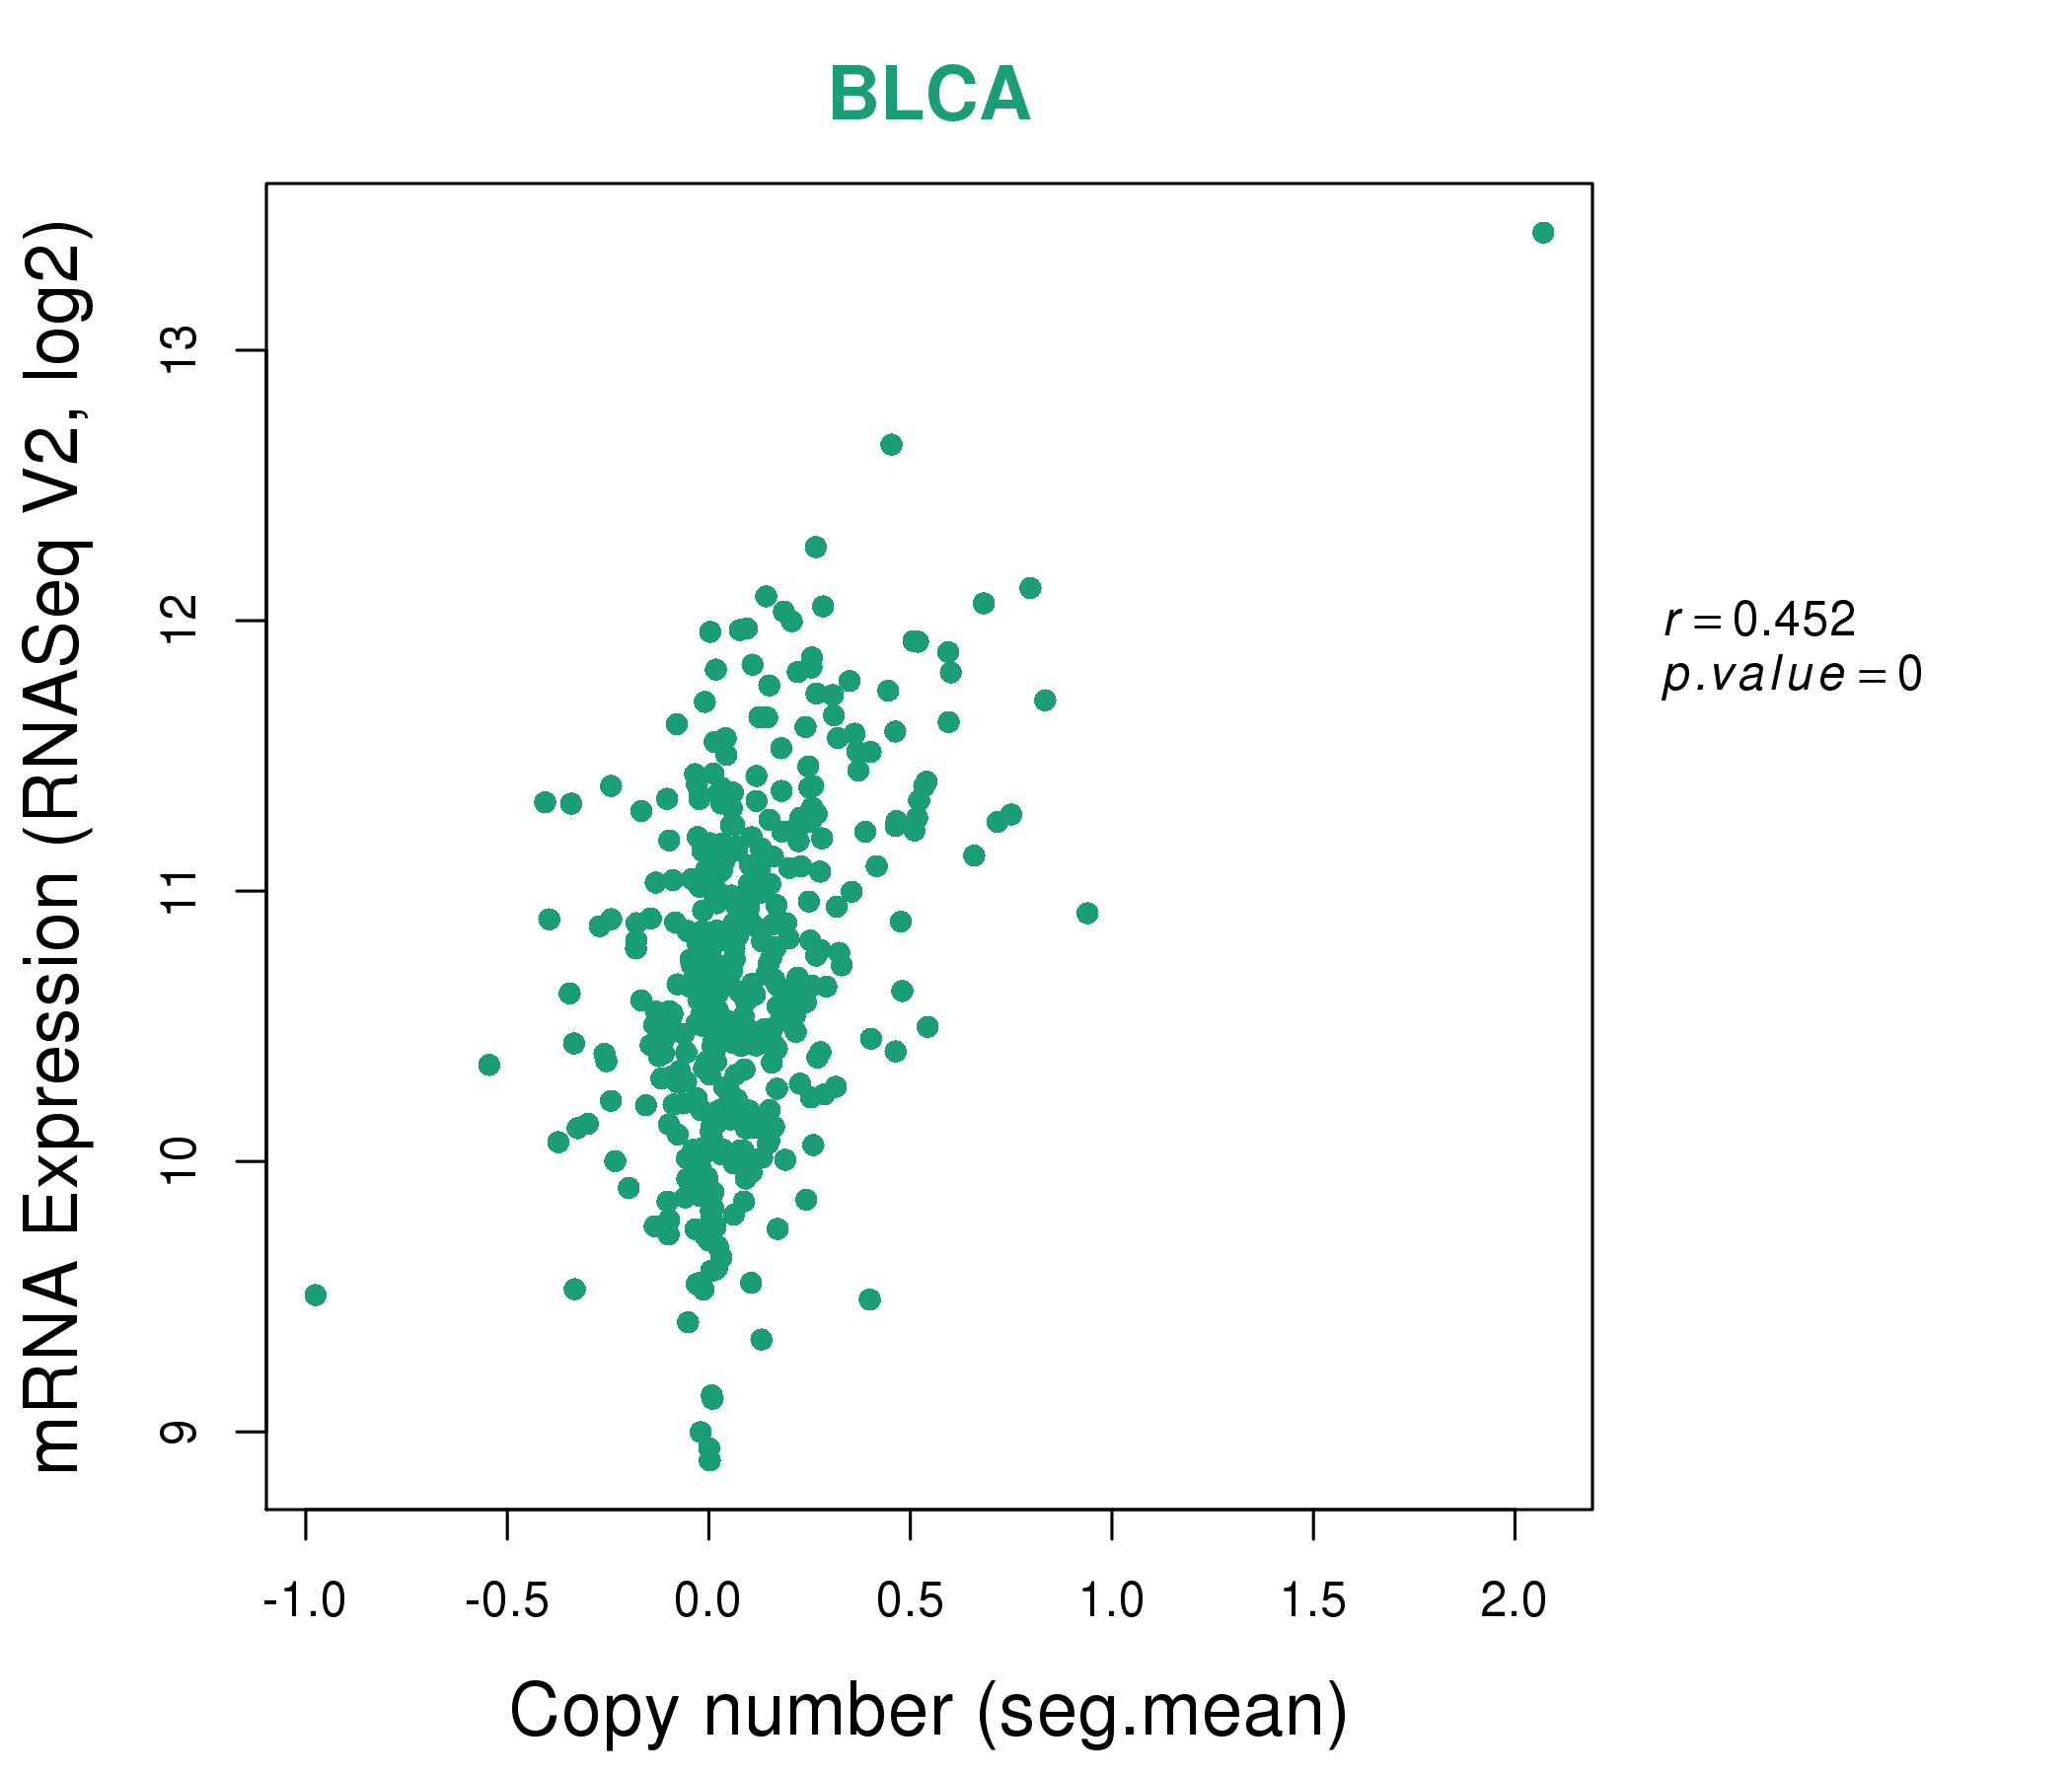
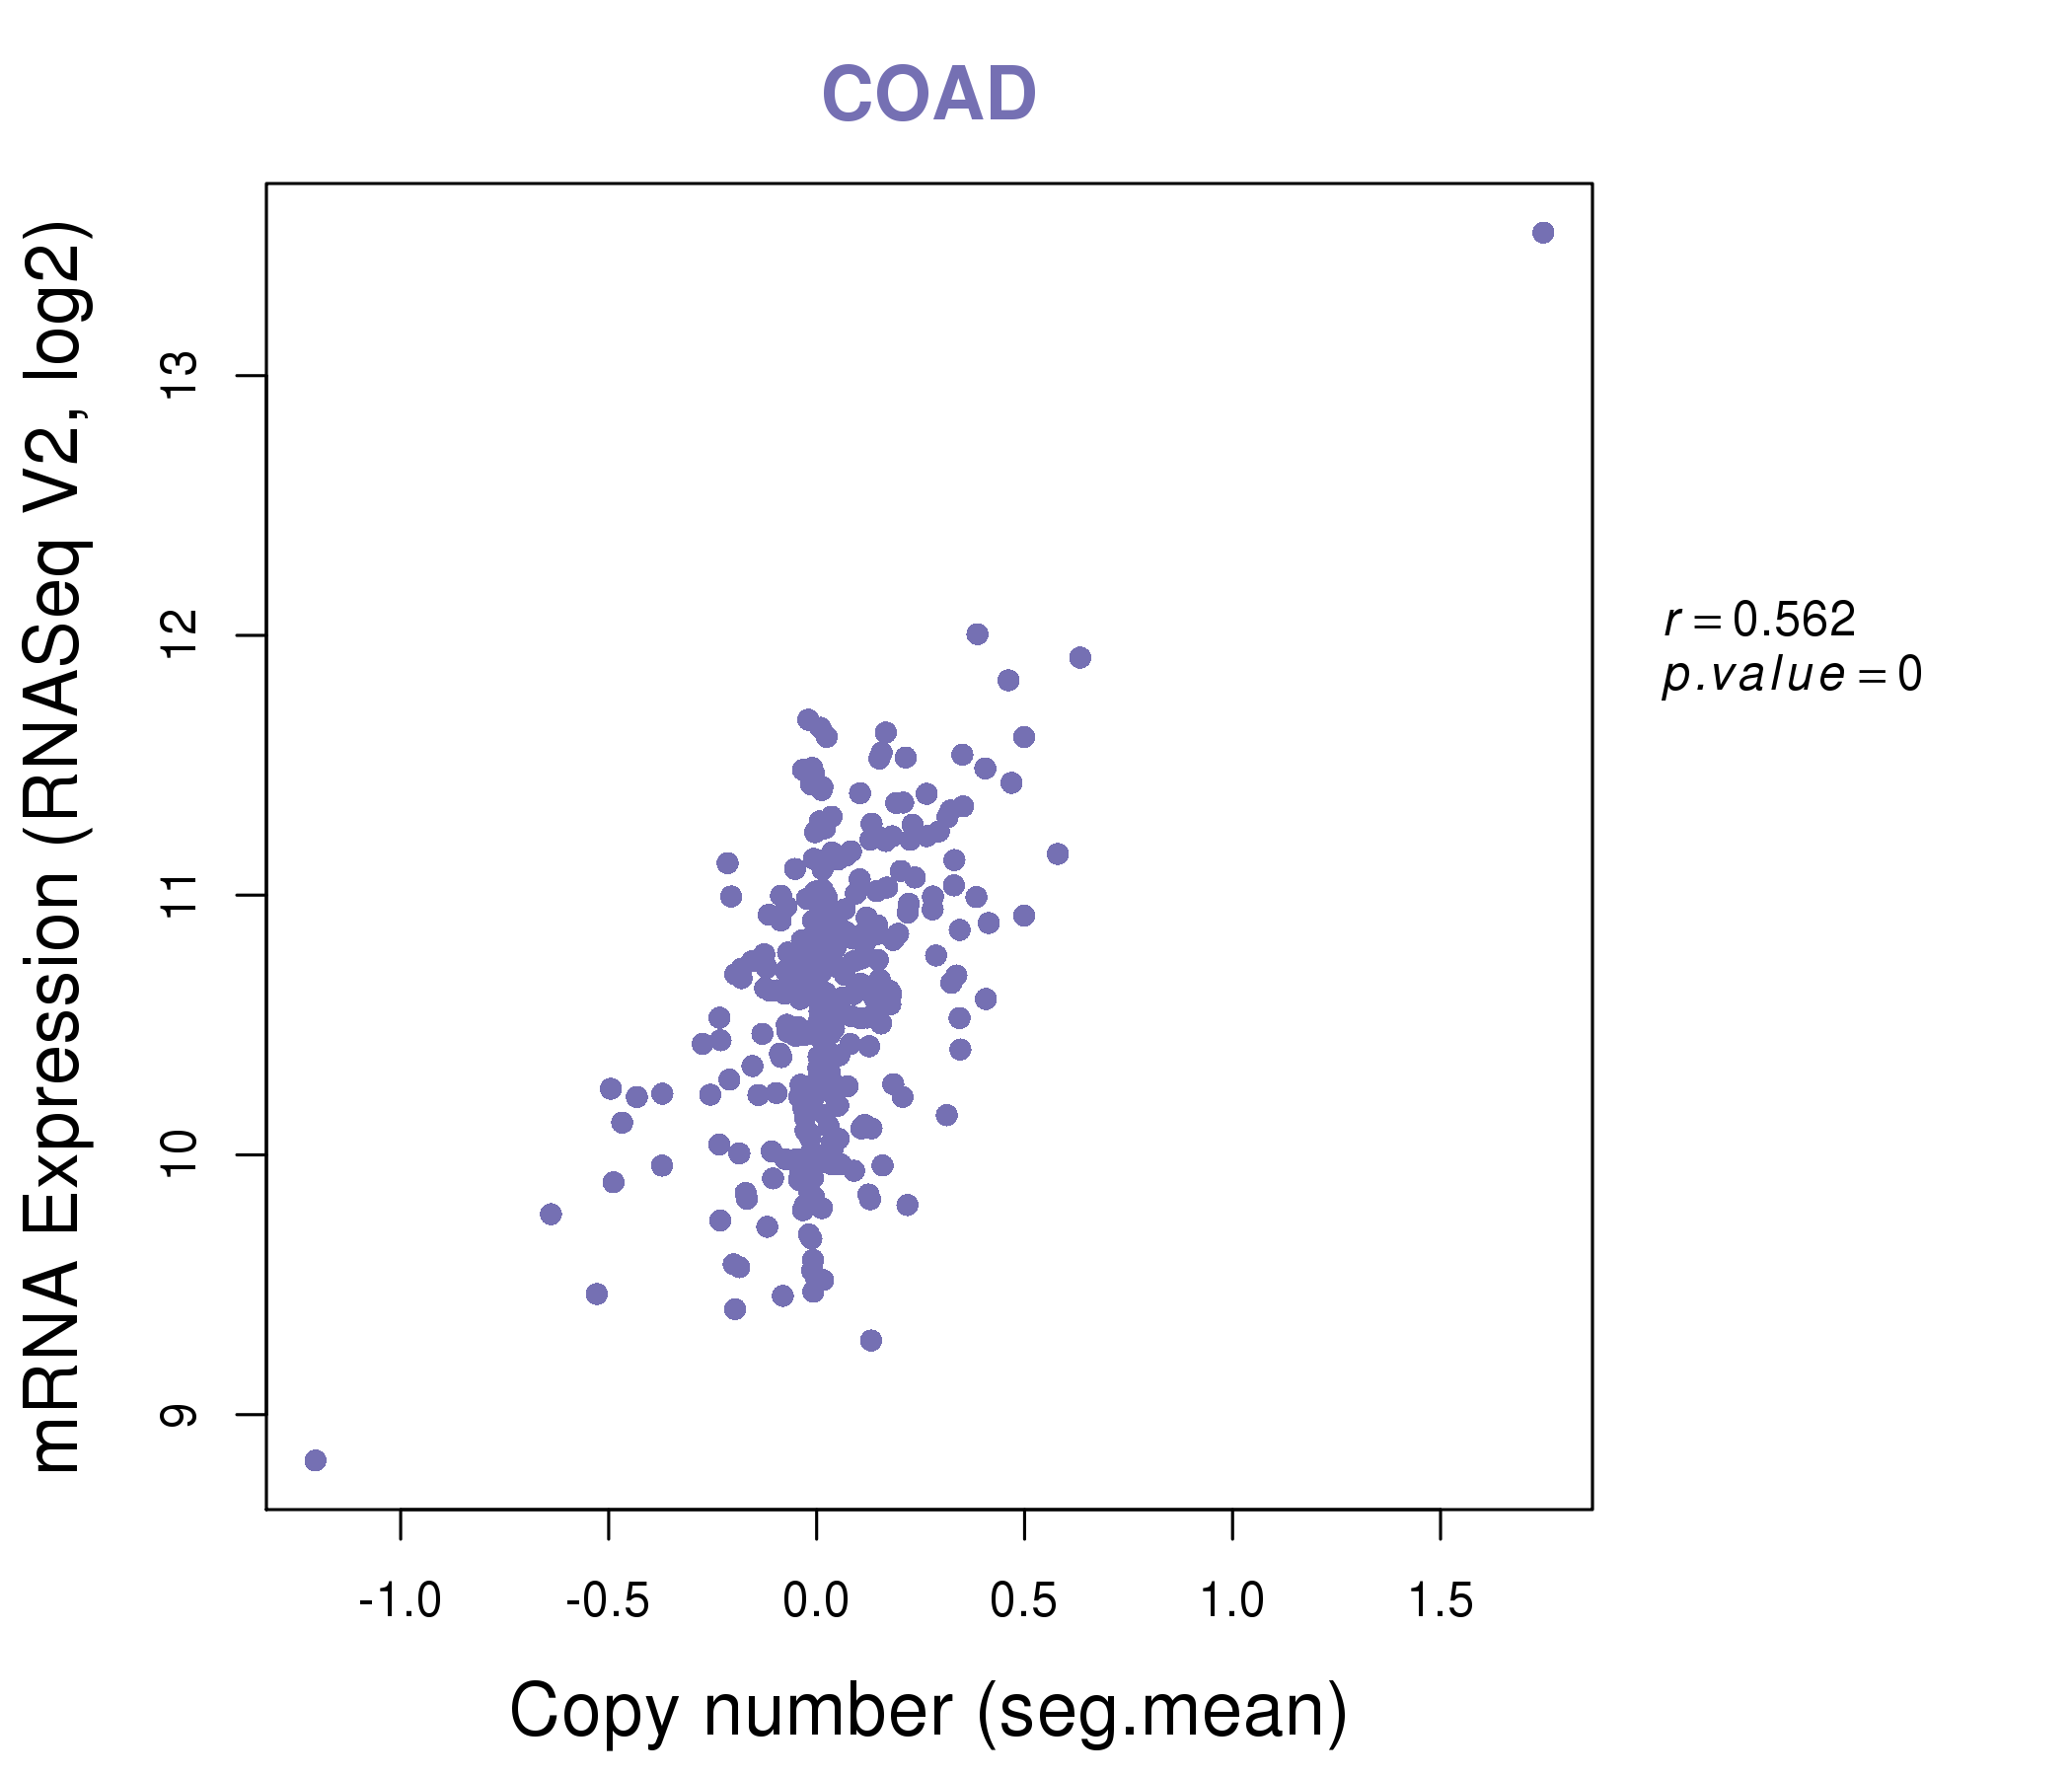
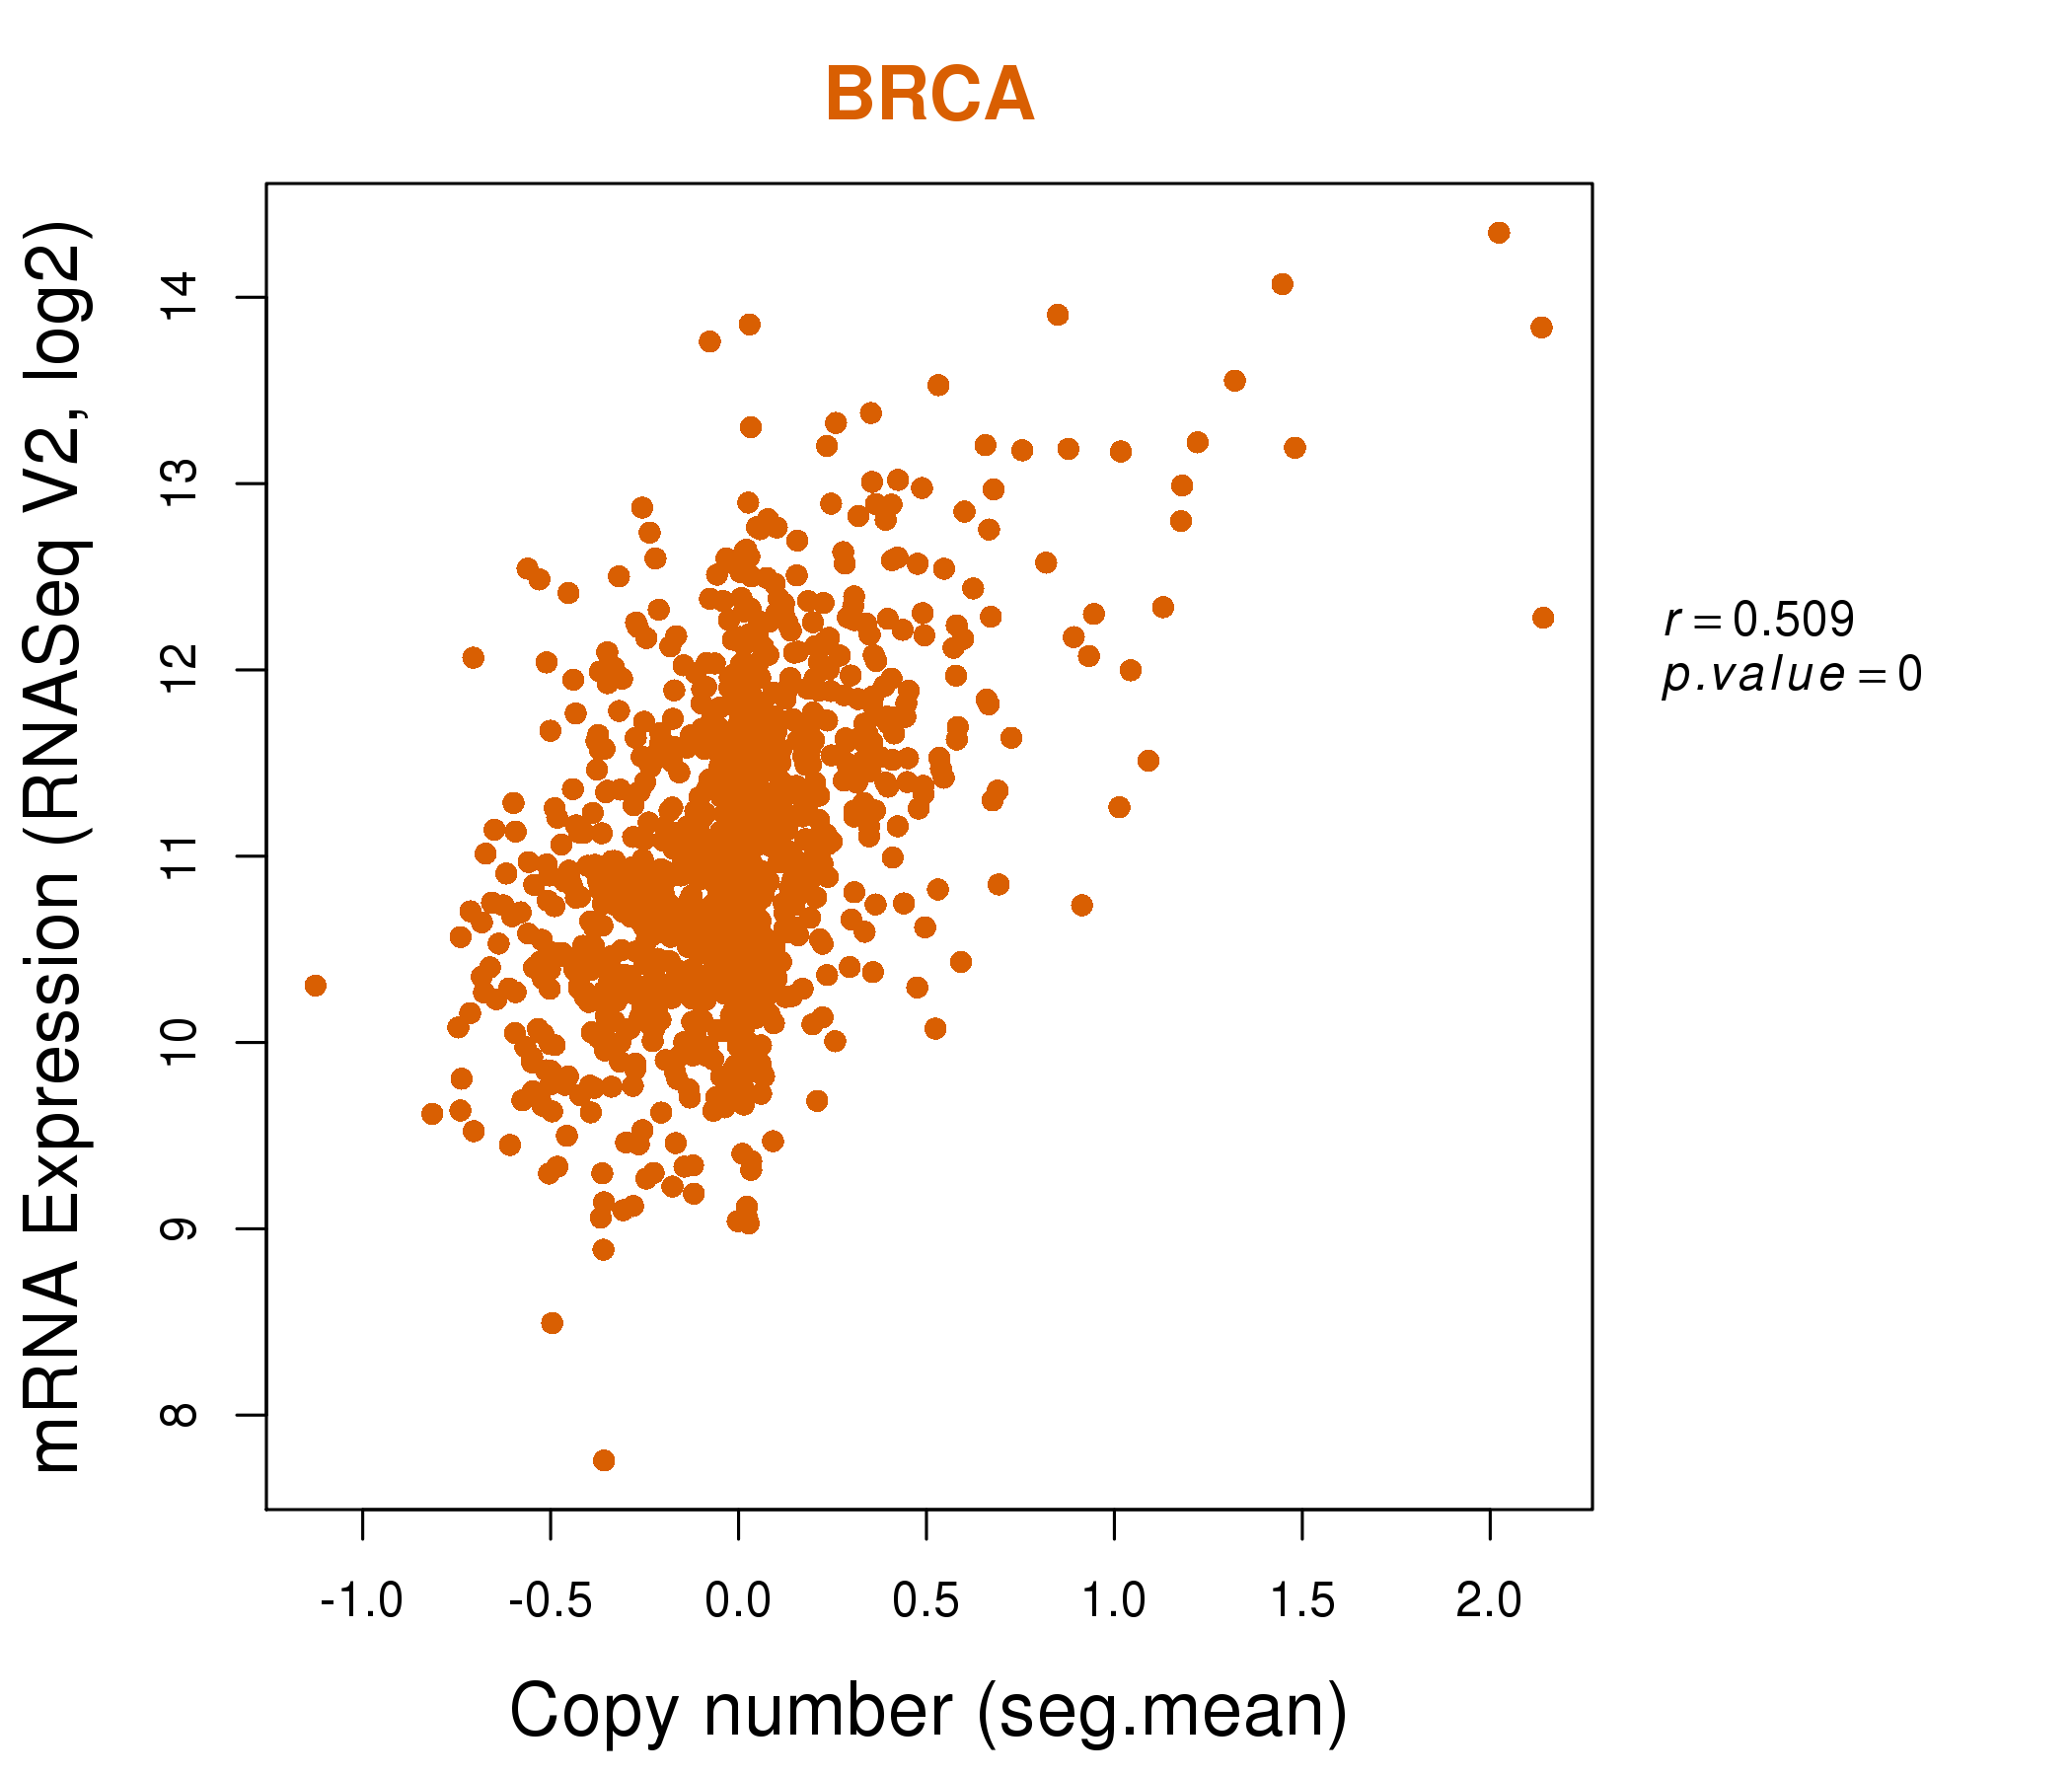
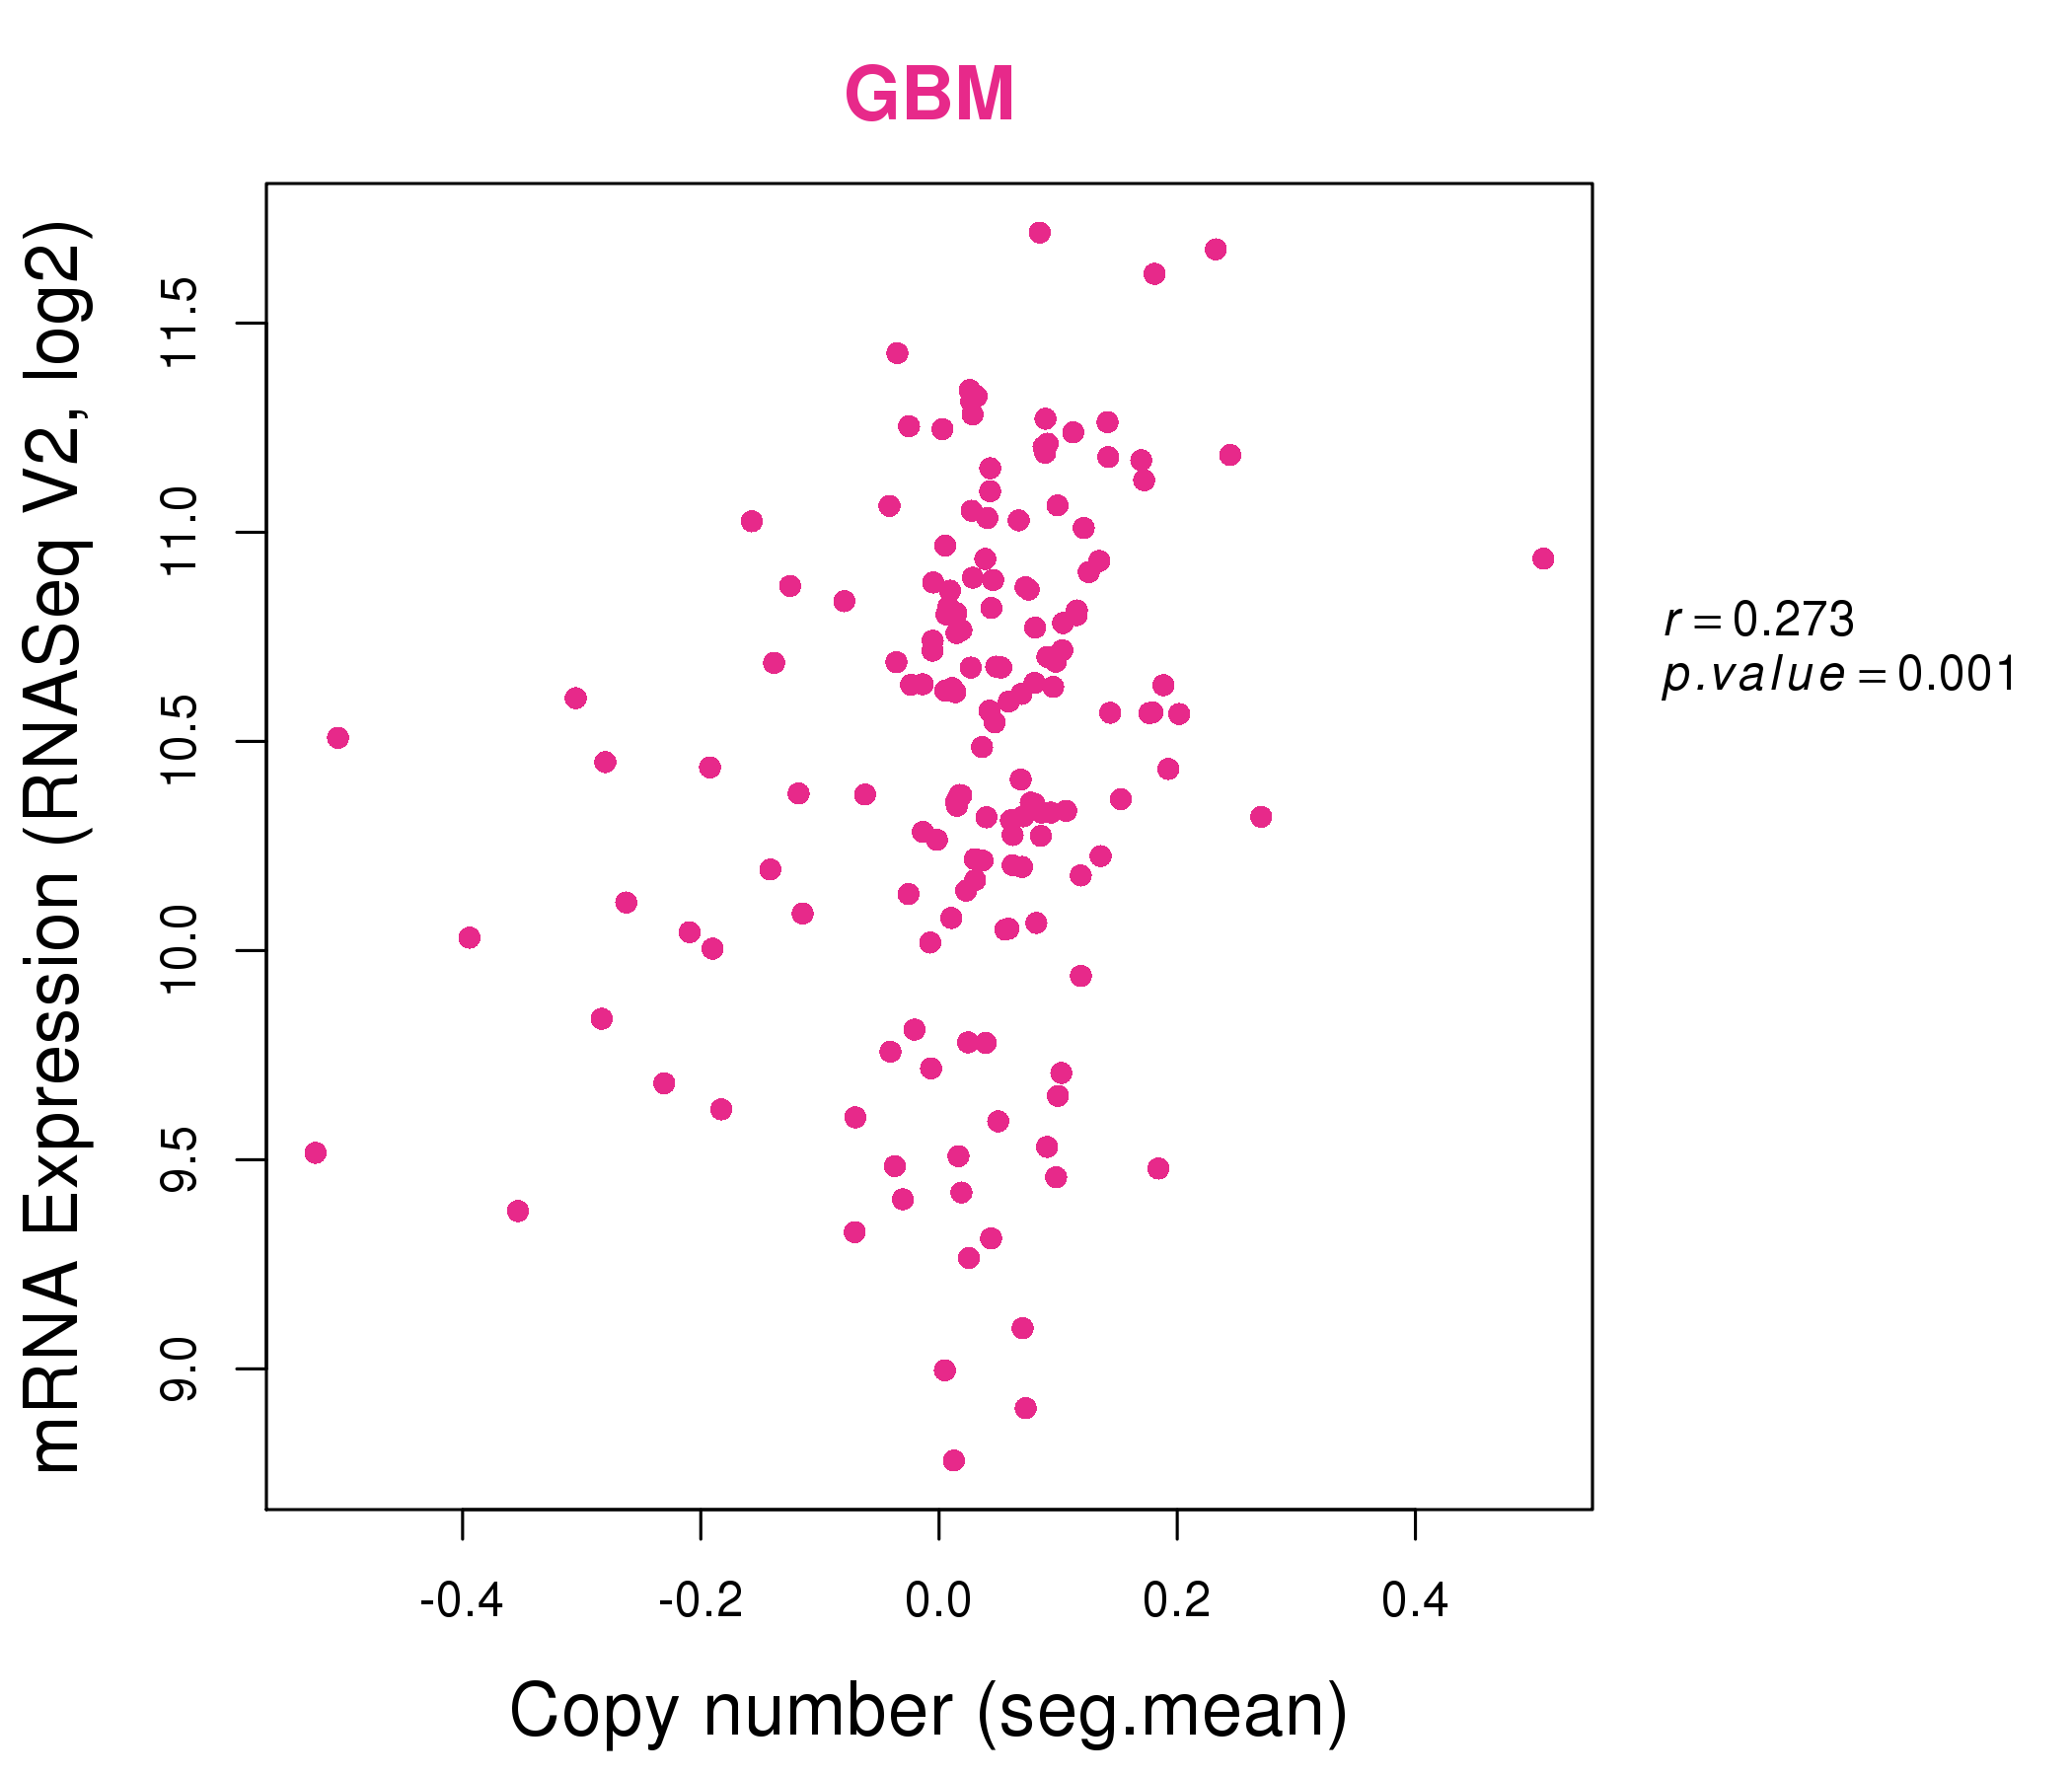
| * This plots show the correlation between CNV and gene expression. |
: Open all plots for all cancer types
 |
|
 |
|
| Top |
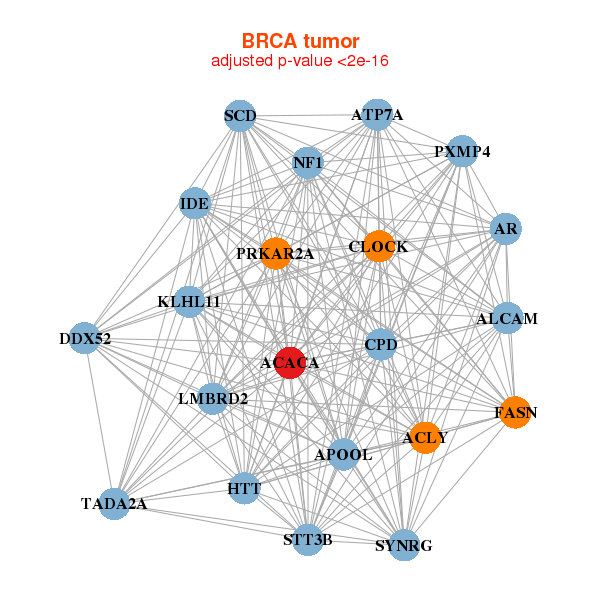
| Gene-Gene Network Information |
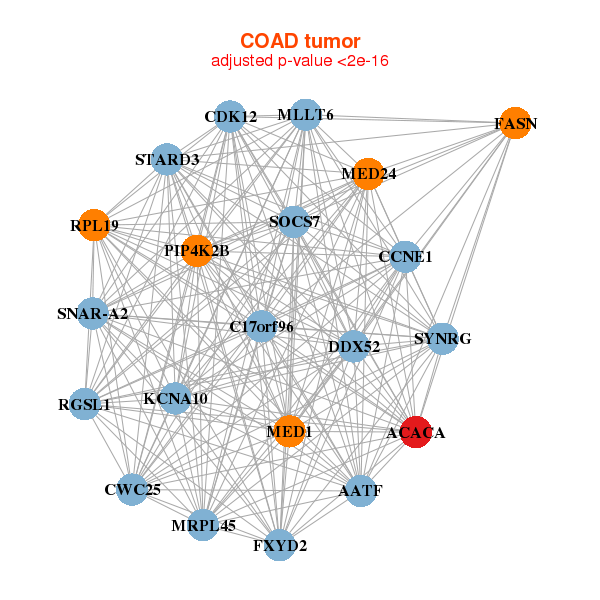
| * Co-Expression network figures were drawn using R package igraph. Only the top 20 genes with the highest correlations were shown. Red circle: input gene, orange circle: cell metabolism gene, sky circle: other gene |
: Open all plots for all cancer types
 |
| ||||
| ACACA,ACLY,ALCAM,APOOL,AR,ATP7A,CLOCK, CPD,DDX52,FASN,HTT,IDE,KLHL11,LMBRD2, NF1,PRKAR2A,PXMP4,SCD,STT3B,SYNRG,TADA2A | AACS,ACACA,BCKDHB,CSPG5,EYS,FADS1,FADS2, FASN,HIBCH,IDH1,LONP2,LSS,MCCC1,ME1, PNPLA3,SC5D,SCD,SCP2,SUOX,TBC1D24,TMEM132B | ||||
 |
| ||||
| AATF,ACACA,C17orf96,CCNE1,CDK12,CWC25,DDX52, FASN,FXYD2,KCNA10,MED1,MED24,MLLT6,MRPL45, PIP4K2B,RGSL1,RPL19,SNAR-A2,SOCS7,STARD3,SYNRG | ACACA,ATXN2,PRRC2A,BAZ1B,CDK5RAP2,CKAP5,DAG1, HERC1,HUWE1,ILF3,IPO9,MDC1,PBRM1,POLR1A, PRKDC,TCHP,TCOF1,TP53BP1,TTLL5,UBAP2L,URB1 |
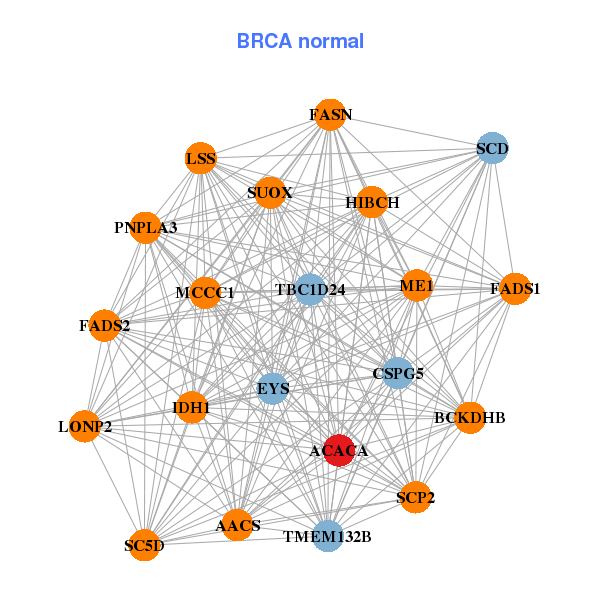
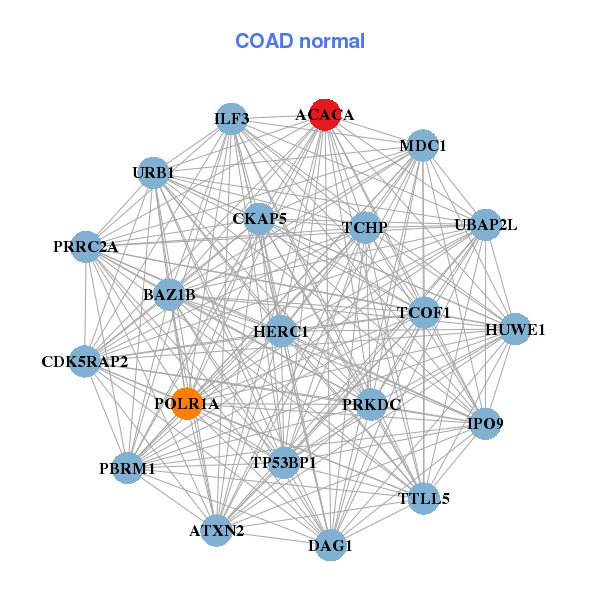
| * Co-Expression network figures were drawn using R package igraph. Only the top 20 genes with the highest correlations were shown. Red circle: input gene, orange circle: cell metabolism gene, sky circle: other gene |
: Open all plots for all cancer types
| Top |
: Open all interacting genes' information including KEGG pathway for all interacting genes from DAVID
| Top |
| Pharmacological Information for ACACA |
| DB Category | DB Name | DB's ID and Url link |
| Chemistry | BindingDB | Q13085; -. |
| Chemistry | ChEMBL | CHEMBL3351; -. |
| Chemistry | GuidetoPHARMACOLOGY | 1263; -. |
| Chemistry | BindingDB | Q13085; -. |
| Chemistry | ChEMBL | CHEMBL3351; -. |
| Chemistry | GuidetoPHARMACOLOGY | 1263; -. |
| Organism-specific databases | PharmGKB | PA24421; -. |
| Organism-specific databases | PharmGKB | PA24421; -. |
| Organism-specific databases | CTD | 31; -. |
| Organism-specific databases | CTD | 31; -. |
| * Gene Centered Interaction Network. |
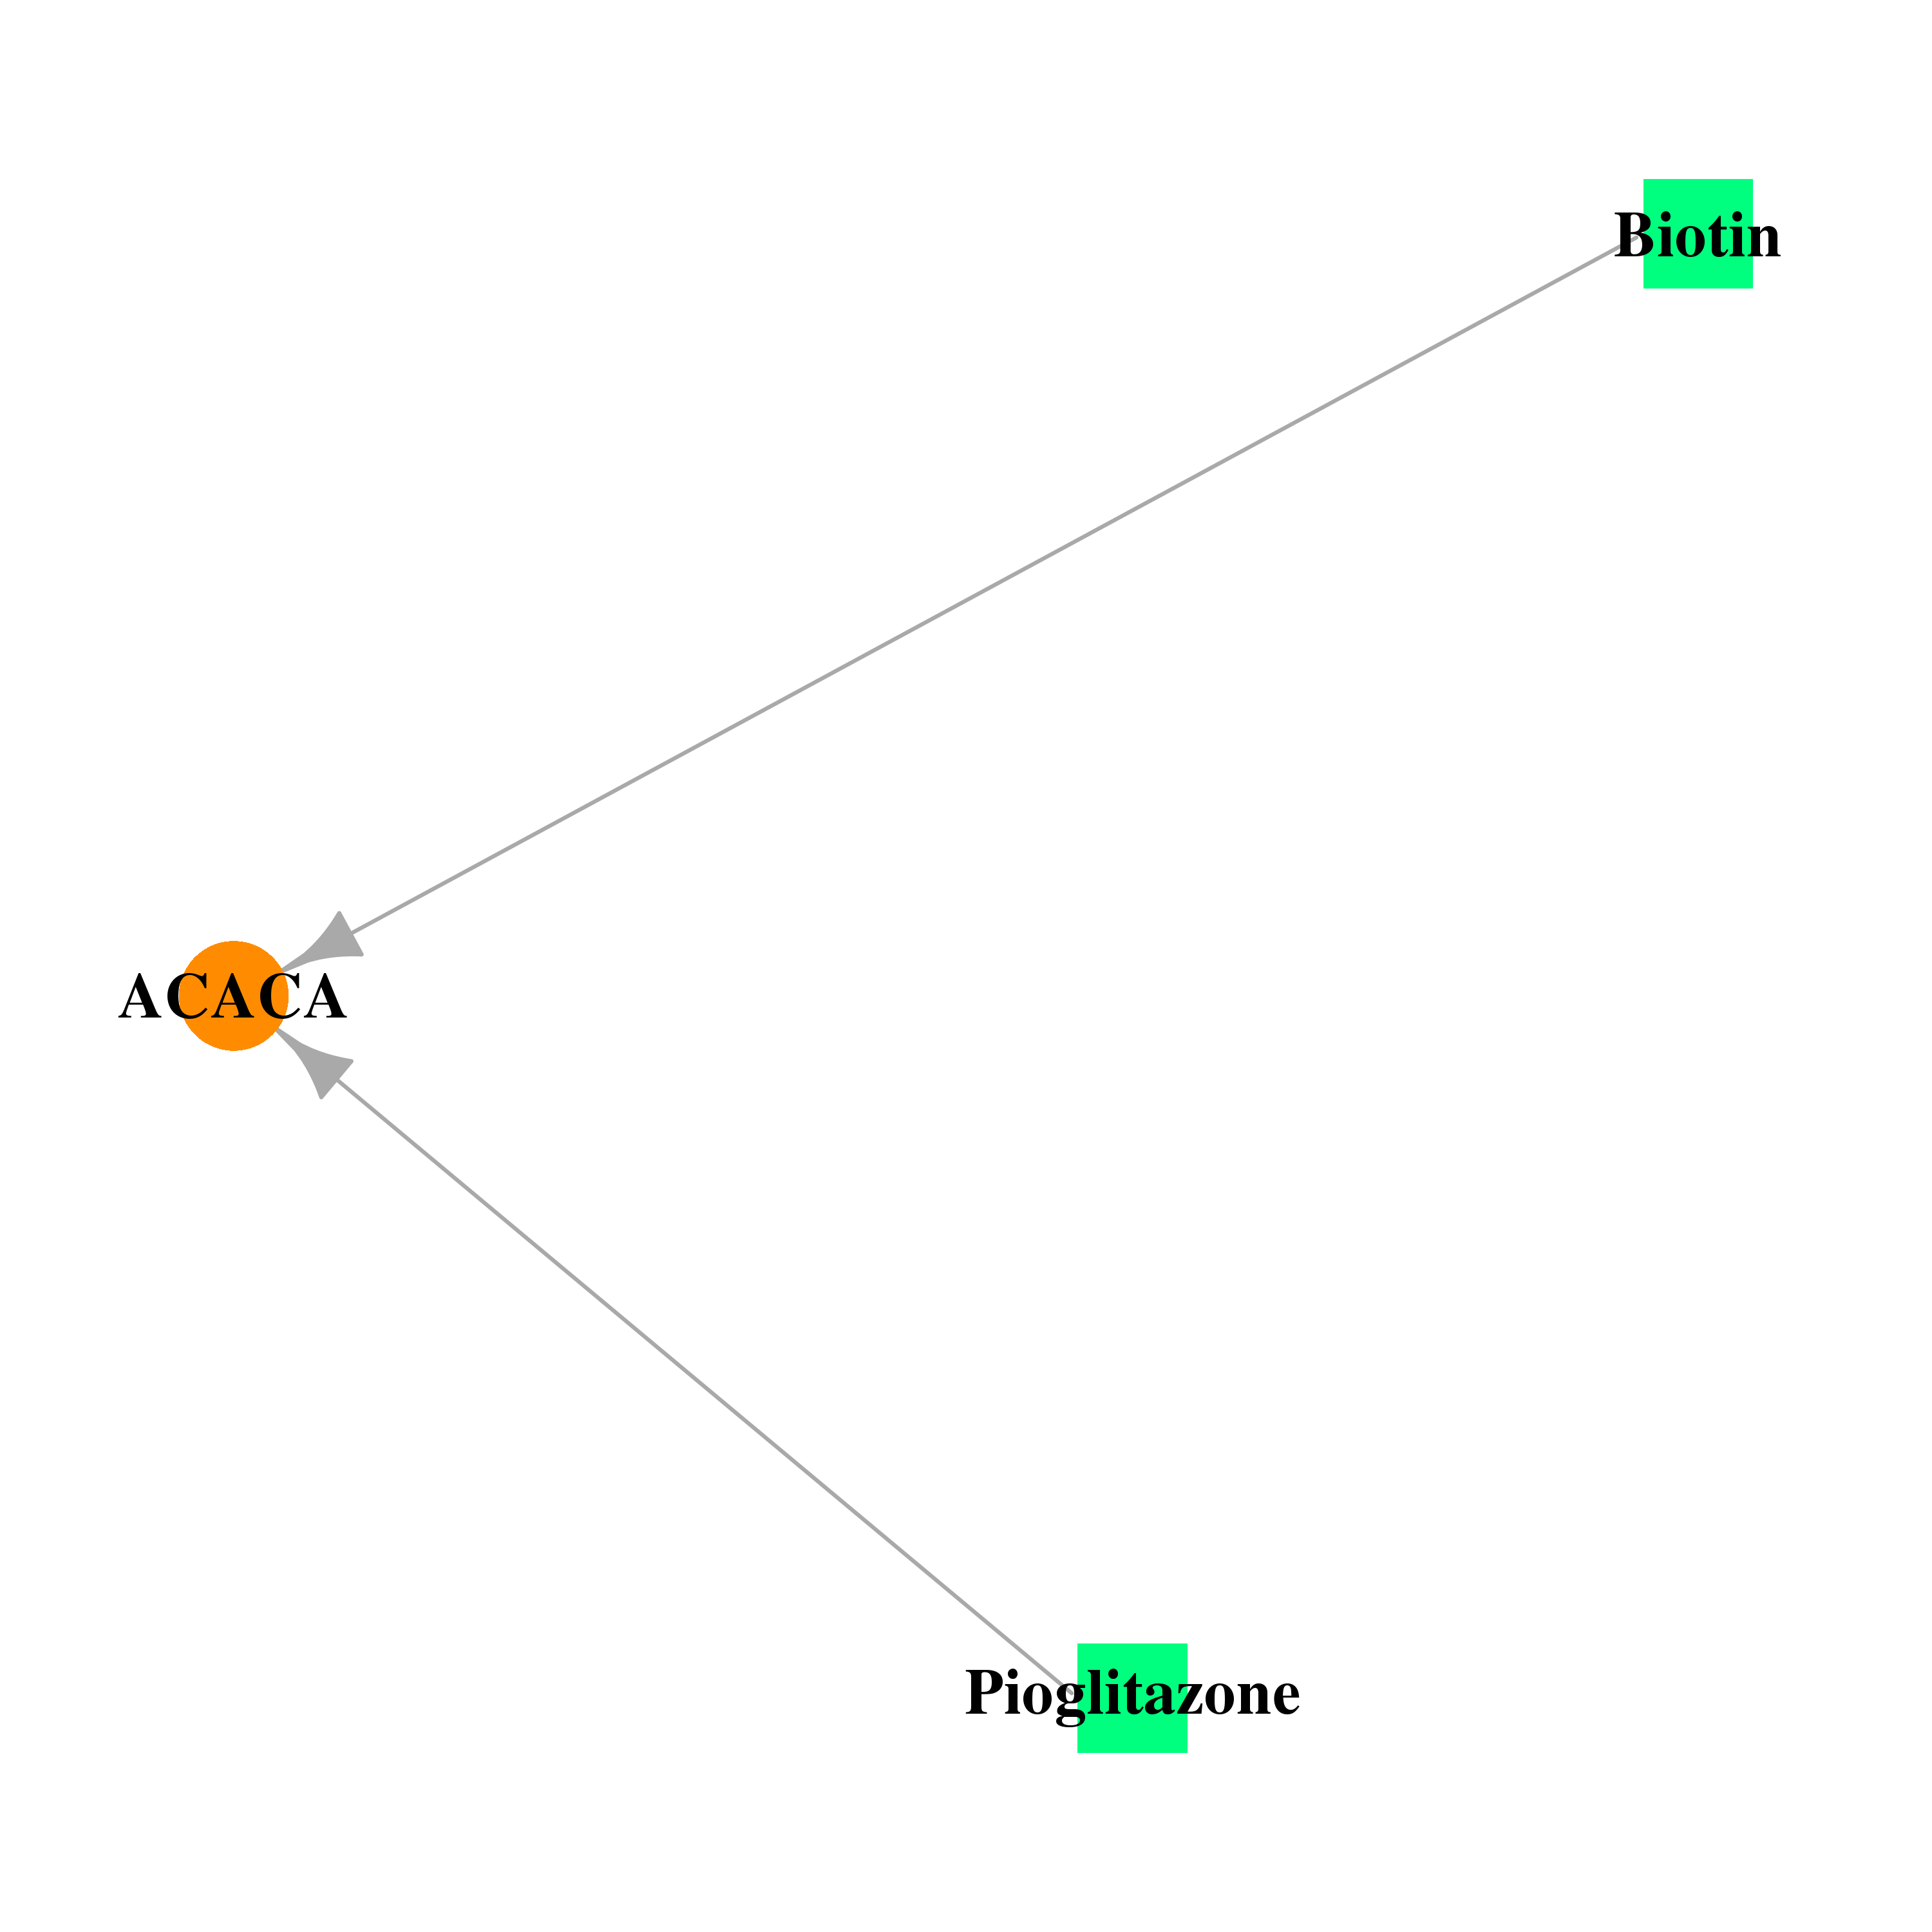 |
| * Drug Centered Interaction Network. |
| DrugBank ID | Target Name | Drug Groups | Generic Name | Drug Centered Network | Drug Structure |
| DB00121 | acetyl-CoA carboxylase alpha | approved; nutraceutical | Biotin | 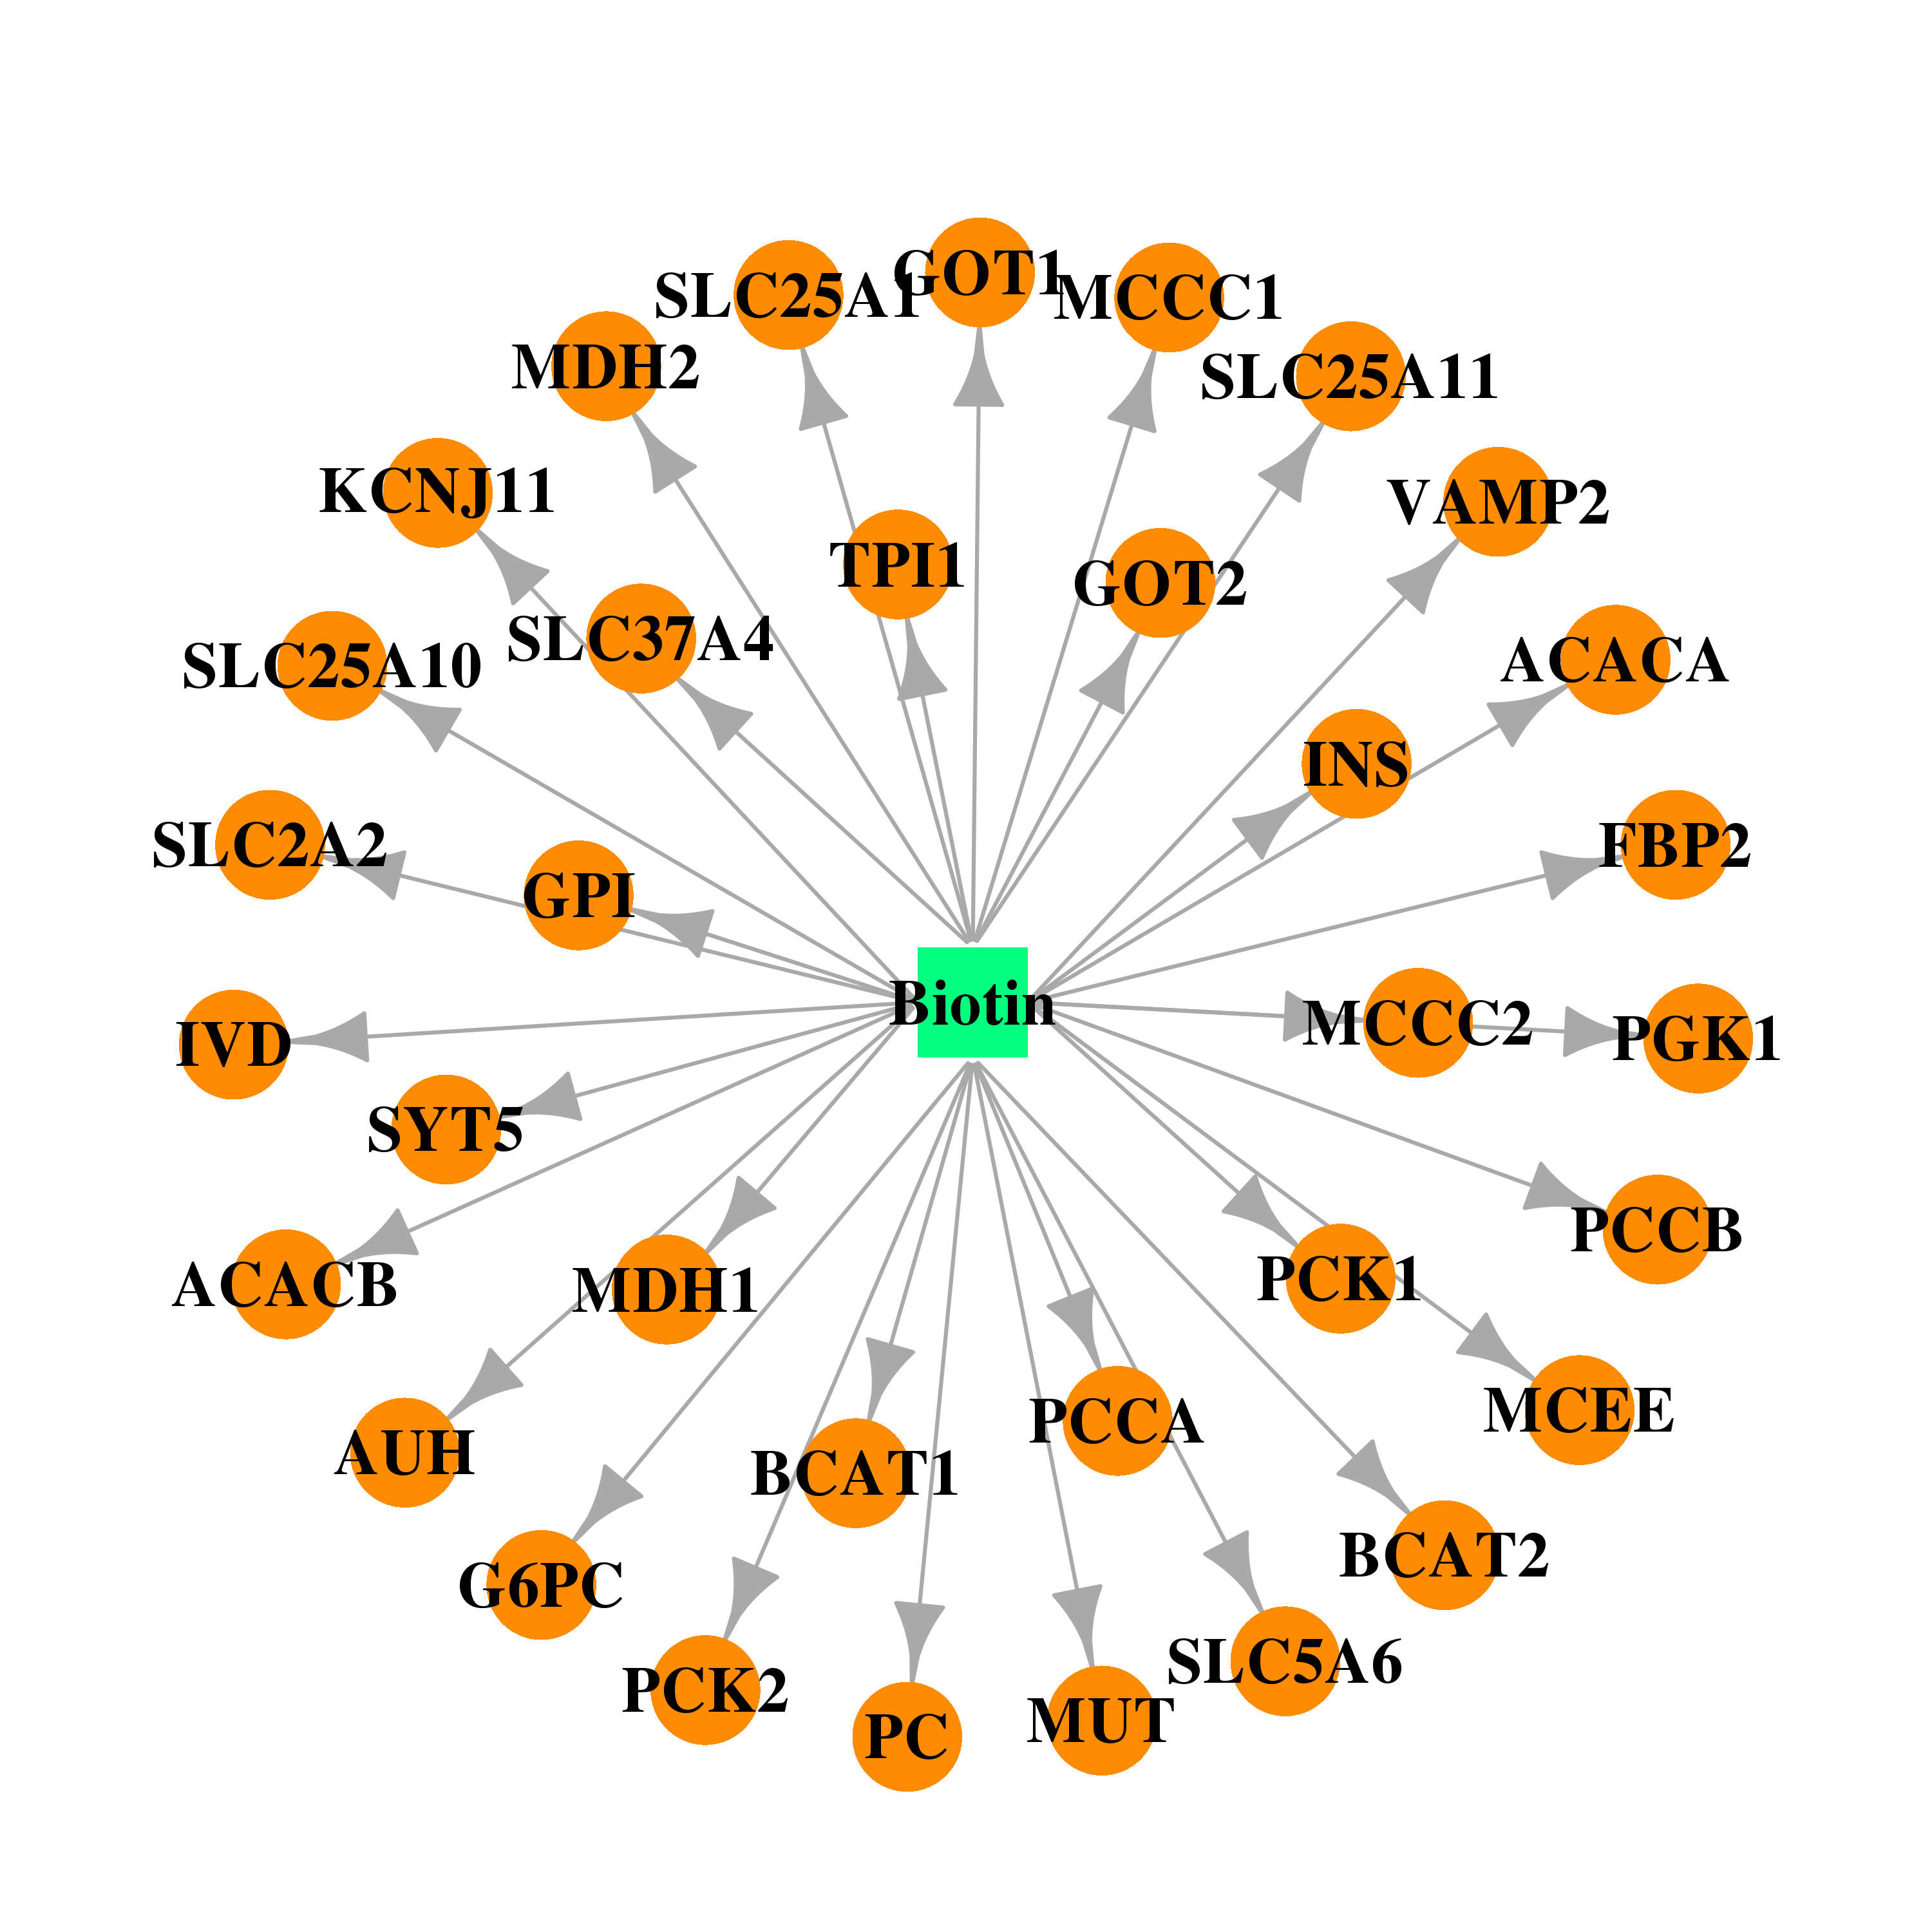 | 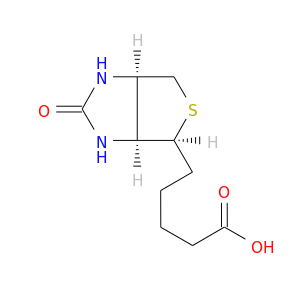 |
| DB01132 | acetyl-CoA carboxylase alpha | approved; investigational | Pioglitazone |  | 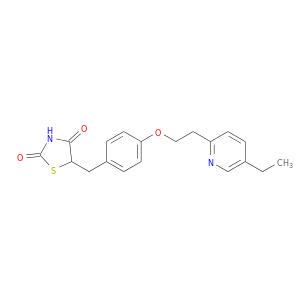 |
| Top |
| Cross referenced IDs for ACACA |
| * We obtained these cross-references from Uniprot database. It covers 150 different DBs, 18 categories. http://www.uniprot.org/help/cross_references_section |
: Open all cross reference information
|
Copyright © 2016-Present - The Univsersity of Texas Health Science Center at Houston @ |