|
|||||||||||||||||||||||||||||||||||||||||||||||||||||||||||||||||||||||||||||||||||||||||||||||||||||||||||||||||||||||||||||||||||||||||||||||||||||||||||||||||||||||||||||||||||||||||||||||||||||||||||||||||||||||||||||||||||||||||||||||||||||||||||||||||||||||||||||||||||||||||||||||||||||||||||||||||||||||||||||||||||||||||||||||||||||||||||||||||||||||||||||||||||||||||||||||||||||||||
| |
| Phenotypic Information (metabolism pathway, cancer, disease, phenome) |
| |
| |
| Gene-Gene Network Information: Co-Expression Network, Interacting Genes & KEGG |
| |
|


| Gene Summary for HMOX1 |
| Basic gene info. | Gene symbol | HMOX1 |
| Gene name | heme oxygenase (decycling) 1 | |
| Synonyms | HMOX1D|HO-1|HSP32|bK286B10 | |
| Cytomap | UCSC genome browser: 22q13.1 | |
| Genomic location | chr22 :35777059-35790207 | |
| Type of gene | protein-coding | |
| RefGenes | NM_002133.2, | |
| Ensembl id | ENSG00000100292 | |
| Description | heat shock protein, 32-kDheme oxygenase 1 | |
| Modification date | 20141222 | |
| dbXrefs | MIM : 141250 | |
| HGNC : HGNC | ||
| Ensembl : ENSG00000100292 | ||
| HPRD : 00782 | ||
| Vega : OTTHUMG00000150960 | ||
| Protein | UniProt: P09601 go to UniProt's Cross Reference DB Table | |
| Expression | CleanEX: HS_HMOX1 | |
| BioGPS: 3162 | ||
| Gene Expression Atlas: ENSG00000100292 | ||
| The Human Protein Atlas: ENSG00000100292 | ||
| Pathway | NCI Pathway Interaction Database: HMOX1 | |
| KEGG: HMOX1 | ||
| REACTOME: HMOX1 | ||
| ConsensusPathDB | ||
| Pathway Commons: HMOX1 | ||
| Metabolism | MetaCyc: HMOX1 | |
| HUMANCyc: HMOX1 | ||
| Regulation | Ensembl's Regulation: ENSG00000100292 | |
| miRBase: chr22 :35,777,059-35,790,207 | ||
| TargetScan: NM_002133 | ||
| cisRED: ENSG00000100292 | ||
| Context | iHOP: HMOX1 | |
| cancer metabolism search in PubMed: HMOX1 | ||
| UCL Cancer Institute: HMOX1 | ||
| Assigned class in ccmGDB | A - This gene has a literature evidence and it belongs to cancer gene. | |
| References showing role of HMOX1 in cancer cell metabolism | 1. Biswas C, Shah N, Muthu M, La P, Fernando AP, et al. (2014) Nuclear heme oxygenase-1 (HO-1) modulates subcellular distribution and activation of Nrf2, impacting metabolic and anti-oxidant defenses. J Biol Chem 289: 26882-26894. doi: 10.1074/jbc.M114.567685. pmid: 4175329. go to article 2. Schmidt A, Dietrich S, Steuer A, Weltmann KD, von Woedtke T, et al. (2015) Non-thermal plasma activates human keratinocytes by stimulation of antioxidant and phase II pathways. J Biol Chem 290: 6731-6750. doi: 10.1074/jbc.M114.603555. pmid: 4358097. go to article 3. Lee PJ, Shin I, Seo SY, Kim H, Kim HP (2014) Upregulation of both heme oxygenase-1 and ATPase inhibitory factor 1 renders tumoricidal activity by synthetic flavonoids via depleting cellular ATP. Bioorg Med Chem Lett 24: 4845-4849. doi: 10.1016/j.bmcl.2014.08.055 go to article | |
| Top |
| Phenotypic Information for HMOX1(metabolism pathway, cancer, disease, phenome) |
| Cancer | CGAP: HMOX1 |
| Familial Cancer Database: HMOX1 | |
| * This gene is included in those cancer gene databases. |
|
|
|
|
|
|
| |||||||||||||||||||||||||||||||||||||||||||||||||||||||||||||||||||||||||||||||||||||||||||||||||||||||||||||||||||||||||||||||||||||||||||||||||||||||||||||||||||||||||||||||||||||||||||||||||||||||||||||||||||||||||||||||||||||||||||||||||||||||||||||||||||||||||||||||||||||||||||||||||||||||||||||||||||||||||||||||||||||||||||||||||||||||||||||||||||||||||||||||||||||||||||||||||||
Oncogene 1 | Significant driver gene in | ||||||||||||||||||||||||||||||||||||||||||||||||||||||||||||||||||||||||||||||||||||||||||||||||||||||||||||||||||||||||||||||||||||||||||||||||||||||||||||||||||||||||||||||||||||||||||||||||||||||||||||||||||||||||||||||||||||||||||||||||||||||||||||||||||||||||||||||||||||||||||||||||||||||||||||||||||||||||||||||||||||||||||||||||||||||||||||||||||||||||||||||||||||||||||||||||||||||||
| cf) number; DB name 1 Oncogene; http://nar.oxfordjournals.org/content/35/suppl_1/D721.long, 2 Tumor Suppressor gene; https://bioinfo.uth.edu/TSGene/, 3 Cancer Gene Census; http://www.nature.com/nrc/journal/v4/n3/abs/nrc1299.html, 4 CancerGenes; http://nar.oxfordjournals.org/content/35/suppl_1/D721.long, 5 Network of Cancer Gene; http://ncg.kcl.ac.uk/index.php, 1Therapeutic Vulnerabilities in Cancer; http://cbio.mskcc.org/cancergenomics/statius/ |
| KEGG_PORPHYRIN_AND_CHLOROPHYLL_METABOLISM REACTOME_METABOLISM_OF_PORPHYRINS | |
| OMIM | 141250; gene. 614034; phenotype. |
| Orphanet | |
| Disease | KEGG Disease: HMOX1 |
| MedGen: HMOX1 (Human Medical Genetics with Condition) | |
| ClinVar: HMOX1 | |
| Phenotype | MGI: HMOX1 (International Mouse Phenotyping Consortium) |
| PhenomicDB: HMOX1 | |
| Mutations for HMOX1 |
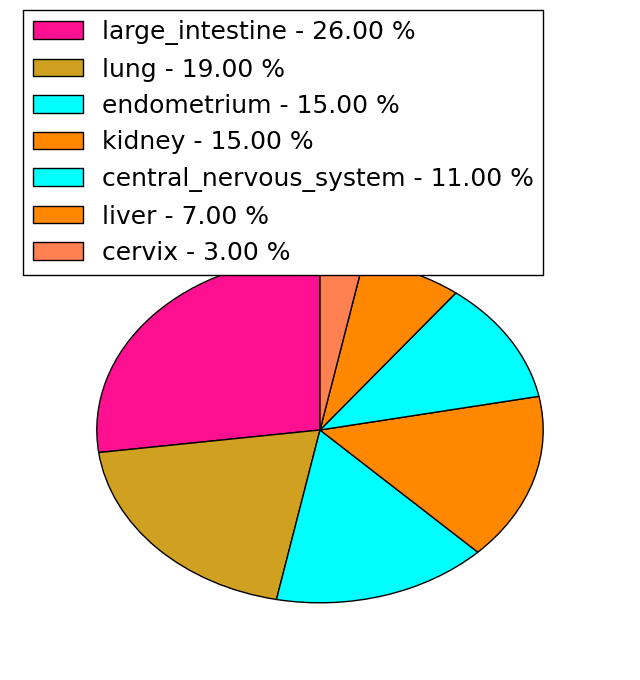
| * Under tables are showing count per each tissue to give us broad intuition about tissue specific mutation patterns.You can go to the detailed page for each mutation database's web site. |
| There's no structural variation information in COSMIC data for this gene. |
| * From mRNA Sanger sequences, Chitars2.0 arranged chimeric transcripts. This table shows HMOX1 related fusion information. |
| ID | Head Gene | Tail Gene | Accession | Gene_a | qStart_a | qEnd_a | Chromosome_a | tStart_a | tEnd_a | Gene_a | qStart_a | qEnd_a | Chromosome_a | tStart_a | tEnd_a |
| Top |
| Mutation type/ Tissue ID | brca | cns | cerv | endome | haematopo | kidn | Lintest | liver | lung | ns | ovary | pancre | prost | skin | stoma | thyro | urina | |||
| Total # sample | 1 | |||||||||||||||||||
| GAIN (# sample) | 1 | |||||||||||||||||||
| LOSS (# sample) |
| cf) Tissue ID; Tissue type (1; Breast, 2; Central_nervous_system, 3; Cervix, 4; Endometrium, 5; Haematopoietic_and_lymphoid_tissue, 6; Kidney, 7; Large_intestine, 8; Liver, 9; Lung, 10; NS, 11; Ovary, 12; Pancreas, 13; Prostate, 14; Skin, 15; Stomach, 16; Thyroid, 17; Urinary_tract) |
| Top |
|
 |
| Top |
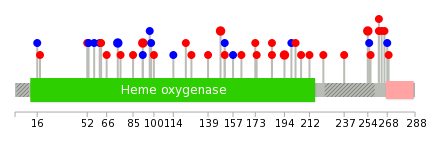
| Stat. for Non-Synonymous SNVs (# total SNVs=26) | (# total SNVs=10) |
 |  |
(# total SNVs=1) | (# total SNVs=0) |
 |
| Top |
| * When you move the cursor on each content, you can see more deailed mutation information on the Tooltip. Those are primary_site,primary_histology,mutation(aa),pubmedID. |
| GRCh37 position | Mutation(aa) | Unique sampleID count |
| chr22:35783113-35783113 | p.A194T | 2 |
| chr22:35782755-35782755 | p.F74F | 2 |
| chr22:35782975-35782975 | p.K148E | 2 |
| chr22:35782808-35782808 | p.D92G | 2 |
| chr22:35789485-35789485 | p.R254T | 2 |
| chr22:35783086-35783086 | p.R185S | 2 |
| chr22:35789509-35789509 | p.R262H | 1 |
| chr22:35782948-35782948 | p.G139C | 1 |
| chr22:35783130-35783130 | p.V199V | 1 |
| chr22:35782760-35782760 | p.P76H | 1 |
| Top |
|
 |
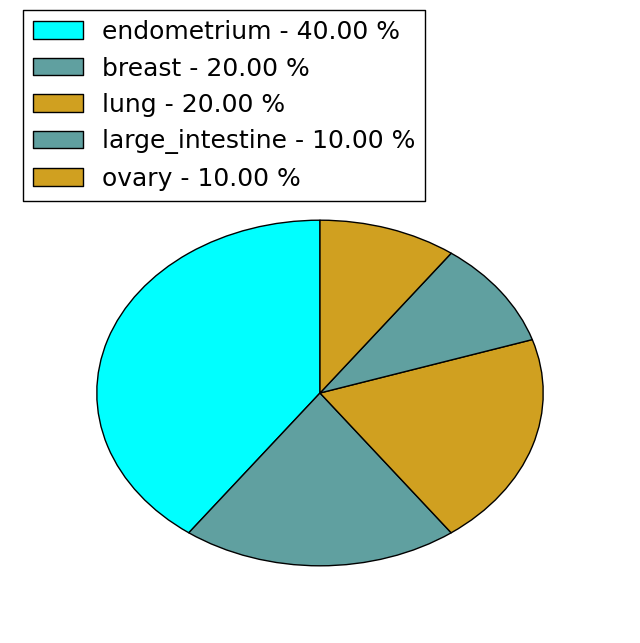
| Point Mutation/ Tissue ID | 1 | 2 | 3 | 4 | 5 | 6 | 7 | 8 | 9 | 10 | 11 | 12 | 13 | 14 | 15 | 16 | 17 | 18 | 19 | 20 |
| # sample | 2 | 1 | 7 | 1 | 2 | 1 | 3 | 2 | 1 | 3 | 7 | 8 | ||||||||
| # mutation | 2 | 1 | 6 | 1 | 2 | 1 | 3 | 2 | 1 | 3 | 7 | 8 | ||||||||
| nonsynonymous SNV | 1 | 4 | 1 | 2 | 1 | 2 | 1 | 1 | 5 | 4 | ||||||||||
| synonymous SNV | 2 | 2 | 1 | 1 | 1 | 2 | 2 | 4 |
| cf) Tissue ID; Tissue type (1; BLCA[Bladder Urothelial Carcinoma], 2; BRCA[Breast invasive carcinoma], 3; CESC[Cervical squamous cell carcinoma and endocervical adenocarcinoma], 4; COAD[Colon adenocarcinoma], 5; GBM[Glioblastoma multiforme], 6; Glioma Low Grade, 7; HNSC[Head and Neck squamous cell carcinoma], 8; KICH[Kidney Chromophobe], 9; KIRC[Kidney renal clear cell carcinoma], 10; KIRP[Kidney renal papillary cell carcinoma], 11; LAML[Acute Myeloid Leukemia], 12; LUAD[Lung adenocarcinoma], 13; LUSC[Lung squamous cell carcinoma], 14; OV[Ovarian serous cystadenocarcinoma ], 15; PAAD[Pancreatic adenocarcinoma], 16; PRAD[Prostate adenocarcinoma], 17; SKCM[Skin Cutaneous Melanoma], 18:STAD[Stomach adenocarcinoma], 19:THCA[Thyroid carcinoma], 20:UCEC[Uterine Corpus Endometrial Carcinoma]) |
| Top |
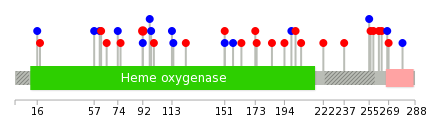
| * We represented just top 10 SNVs. When you move the cursor on each content, you can see more deailed mutation information on the Tooltip. Those are primary_site, primary_histology, mutation(aa), pubmedID. |
| Genomic Position | Mutation(aa) | Unique sampleID count |
| chr22:35782808 | p.D92G | 2 |
| chr22:35789491 | p.R113R | 1 |
| chr22:35782809 | p.G255G | 1 |
| chr22:35783051 | p.Y114Y | 1 |
| chr22:35789496 | p.K256R | 1 |
| chr22:35782824 | p.R123C | 1 |
| chr22:35783055 | p.P258T | 1 |
| chr22:35779123 | p.A16A | 1 |
| chr22:35789509 | p.A151V | 1 |
| chr22:35782827 | p.R262H | 1 |
| * Copy number data were extracted from TCGA using R package TCGA-Assembler. The URLs of all public data files on TCGA DCC data server were gathered on Jan-05-2015. Function ProcessCNAData in TCGA-Assembler package was used to obtain gene-level copy number value which is calculated as the average copy number of the genomic region of a gene. |
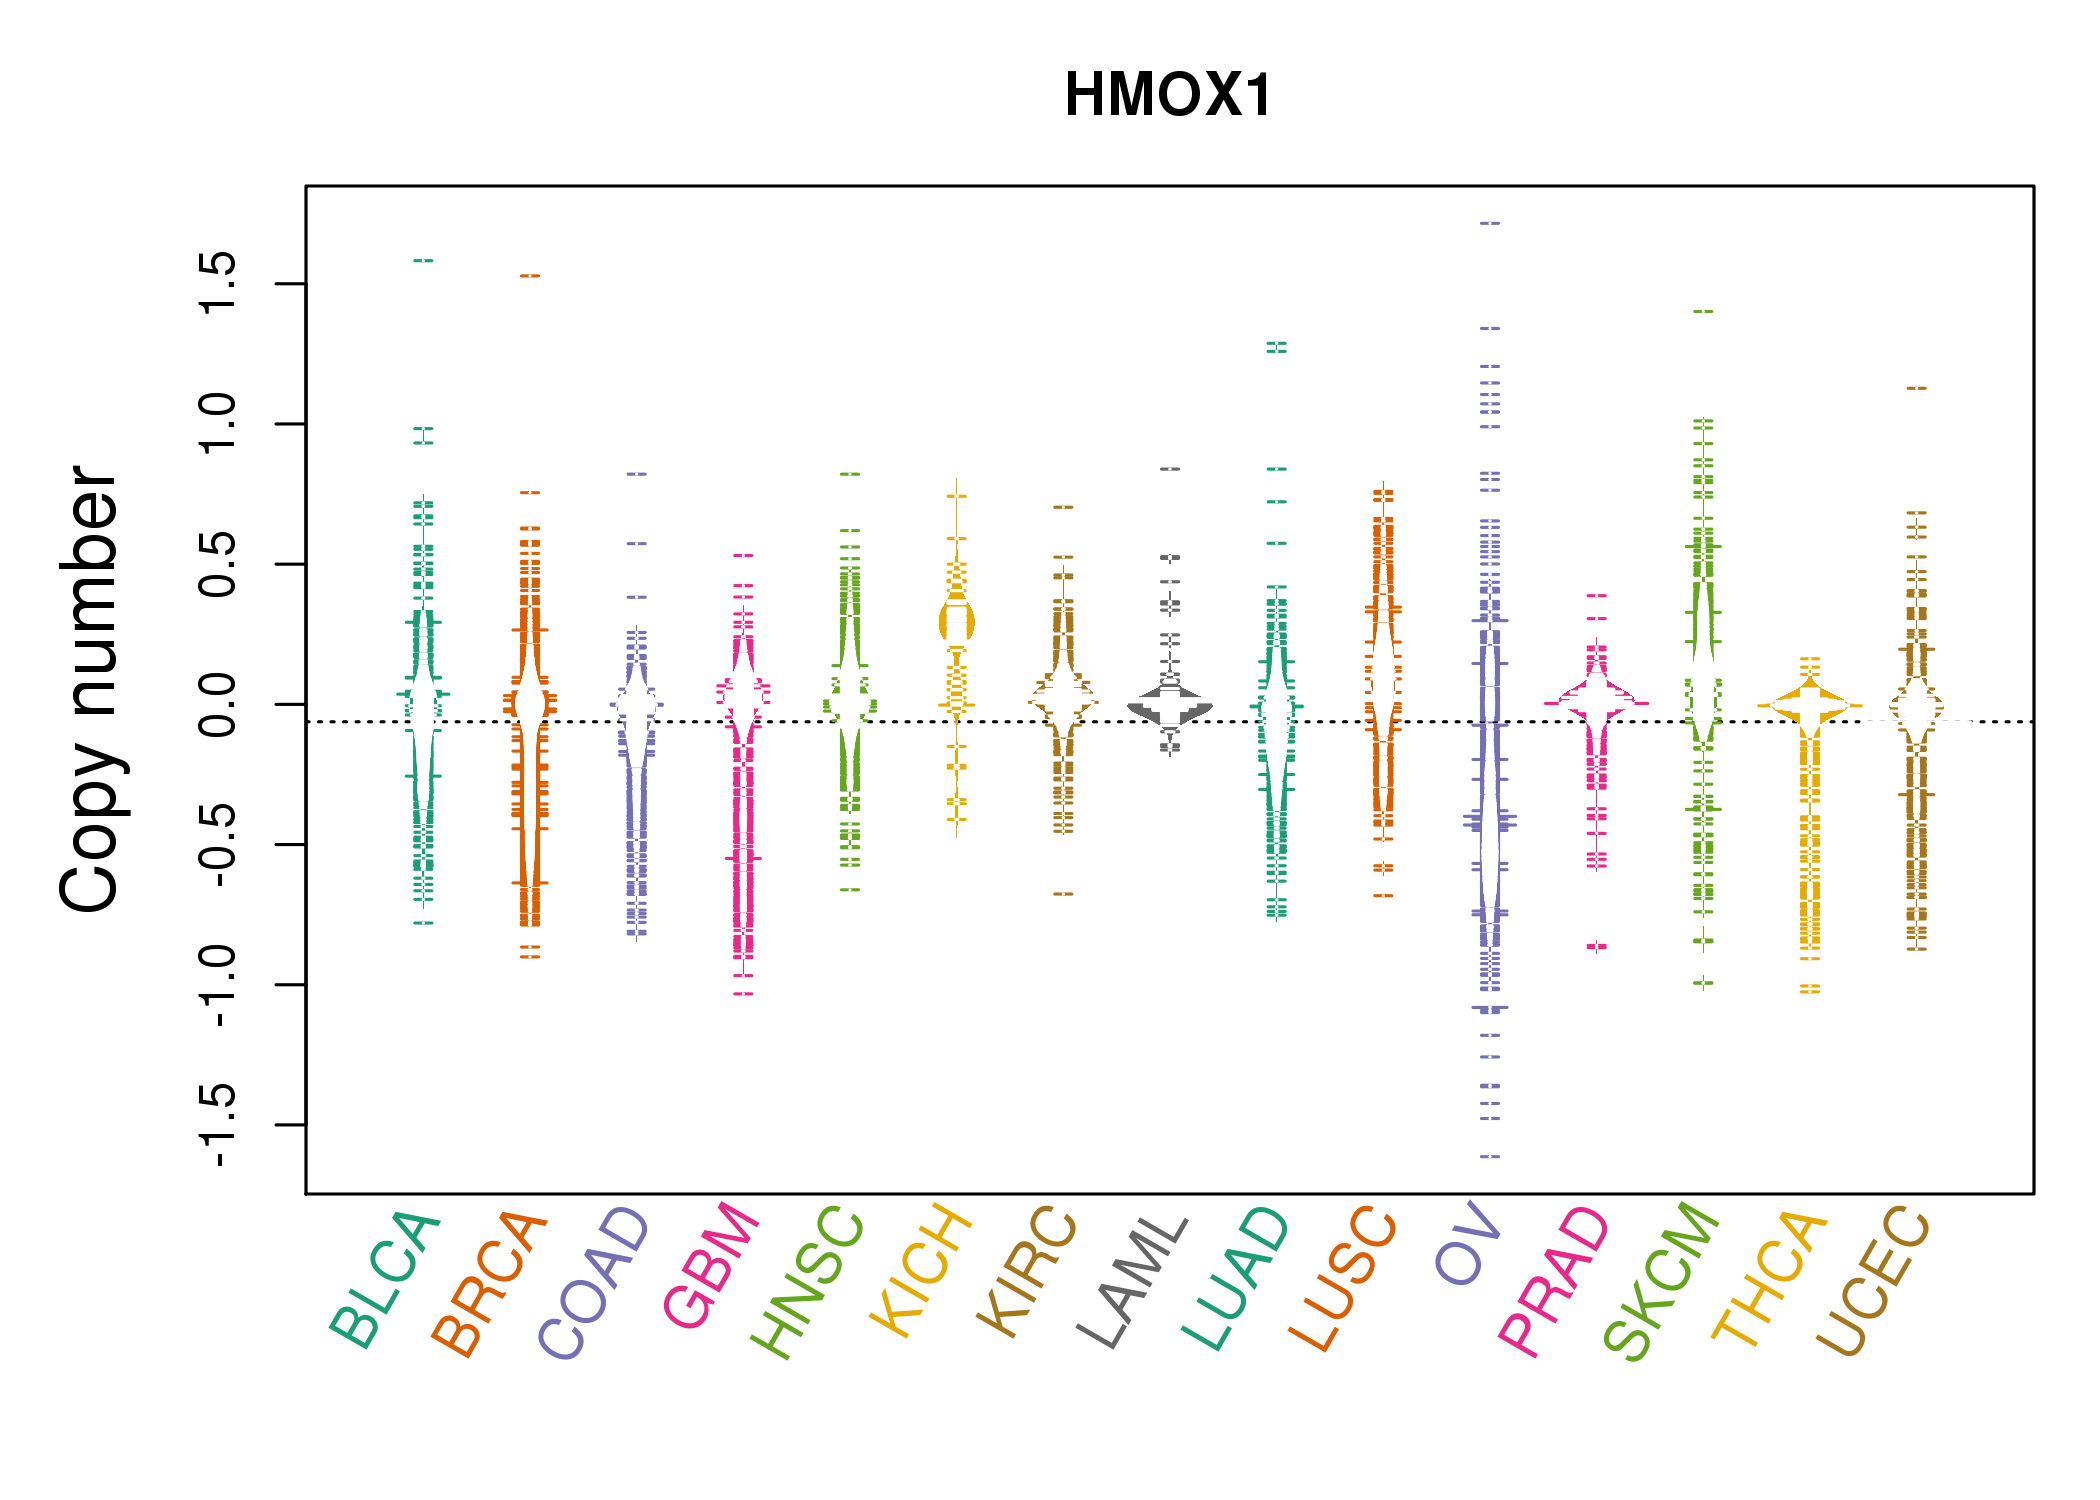 |
| cf) Tissue ID[Tissue type]: BLCA[Bladder Urothelial Carcinoma], BRCA[Breast invasive carcinoma], CESC[Cervical squamous cell carcinoma and endocervical adenocarcinoma], COAD[Colon adenocarcinoma], GBM[Glioblastoma multiforme], Glioma Low Grade, HNSC[Head and Neck squamous cell carcinoma], KICH[Kidney Chromophobe], KIRC[Kidney renal clear cell carcinoma], KIRP[Kidney renal papillary cell carcinoma], LAML[Acute Myeloid Leukemia], LUAD[Lung adenocarcinoma], LUSC[Lung squamous cell carcinoma], OV[Ovarian serous cystadenocarcinoma ], PAAD[Pancreatic adenocarcinoma], PRAD[Prostate adenocarcinoma], SKCM[Skin Cutaneous Melanoma], STAD[Stomach adenocarcinoma], THCA[Thyroid carcinoma], UCEC[Uterine Corpus Endometrial Carcinoma] |
| Top |
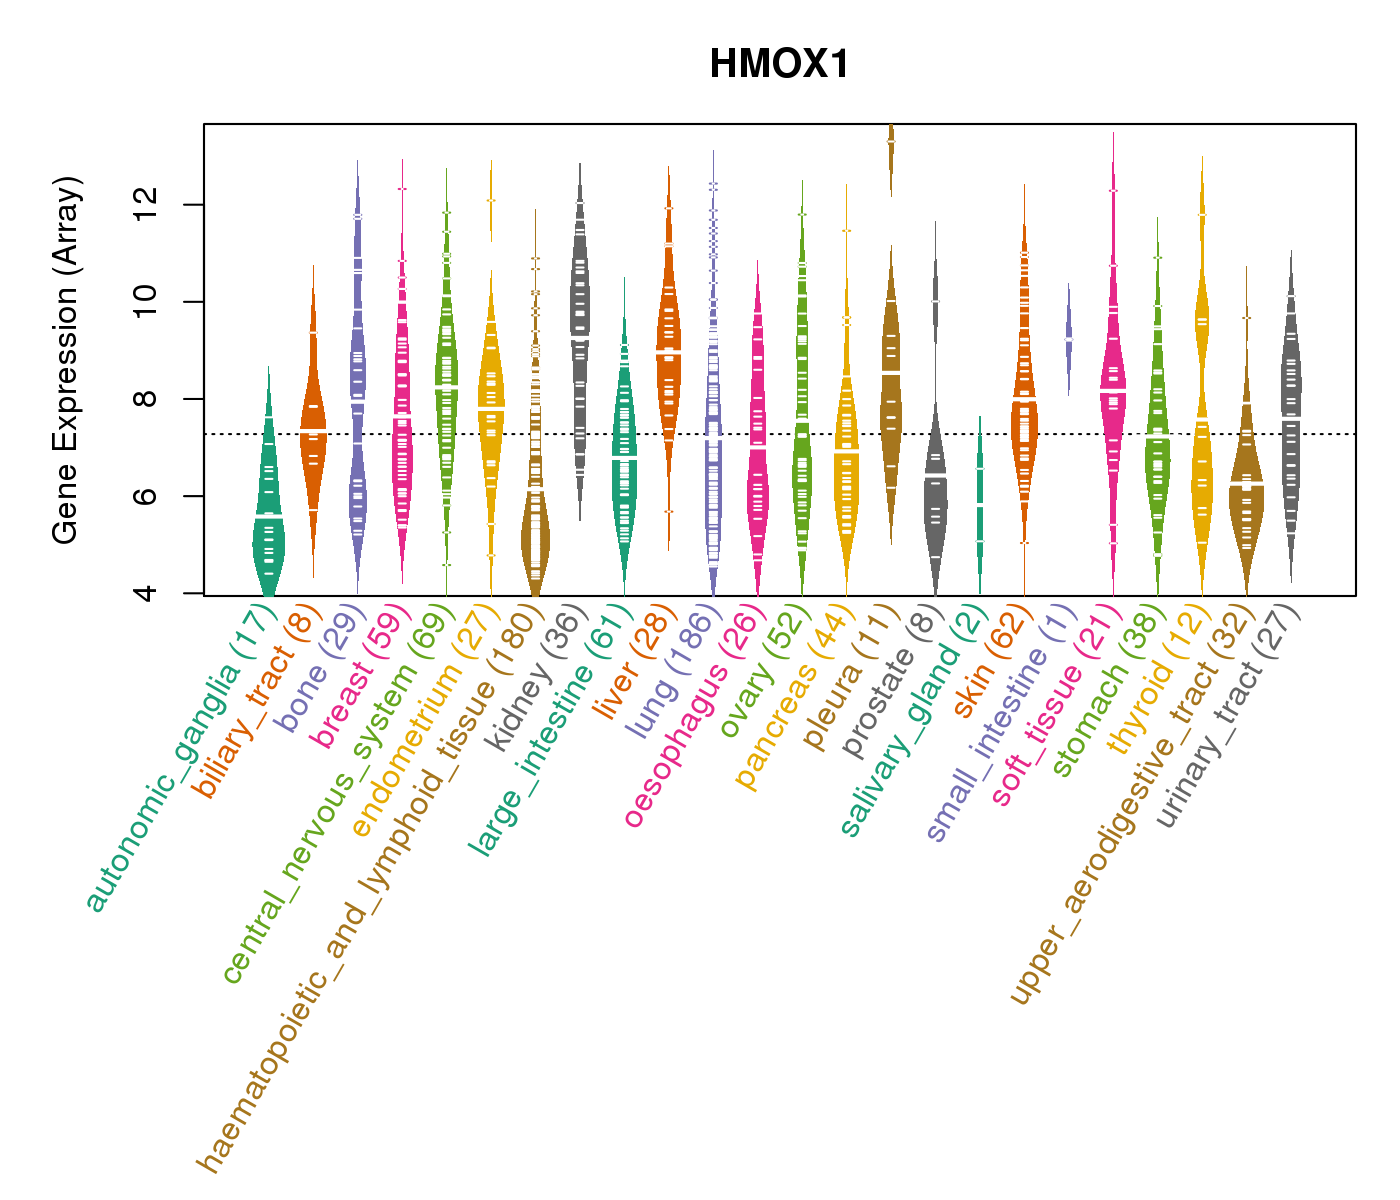
| Gene Expression for HMOX1 |
| * CCLE gene expression data were extracted from CCLE_Expression_Entrez_2012-10-18.res: Gene-centric RMA-normalized mRNA expression data. |
 |
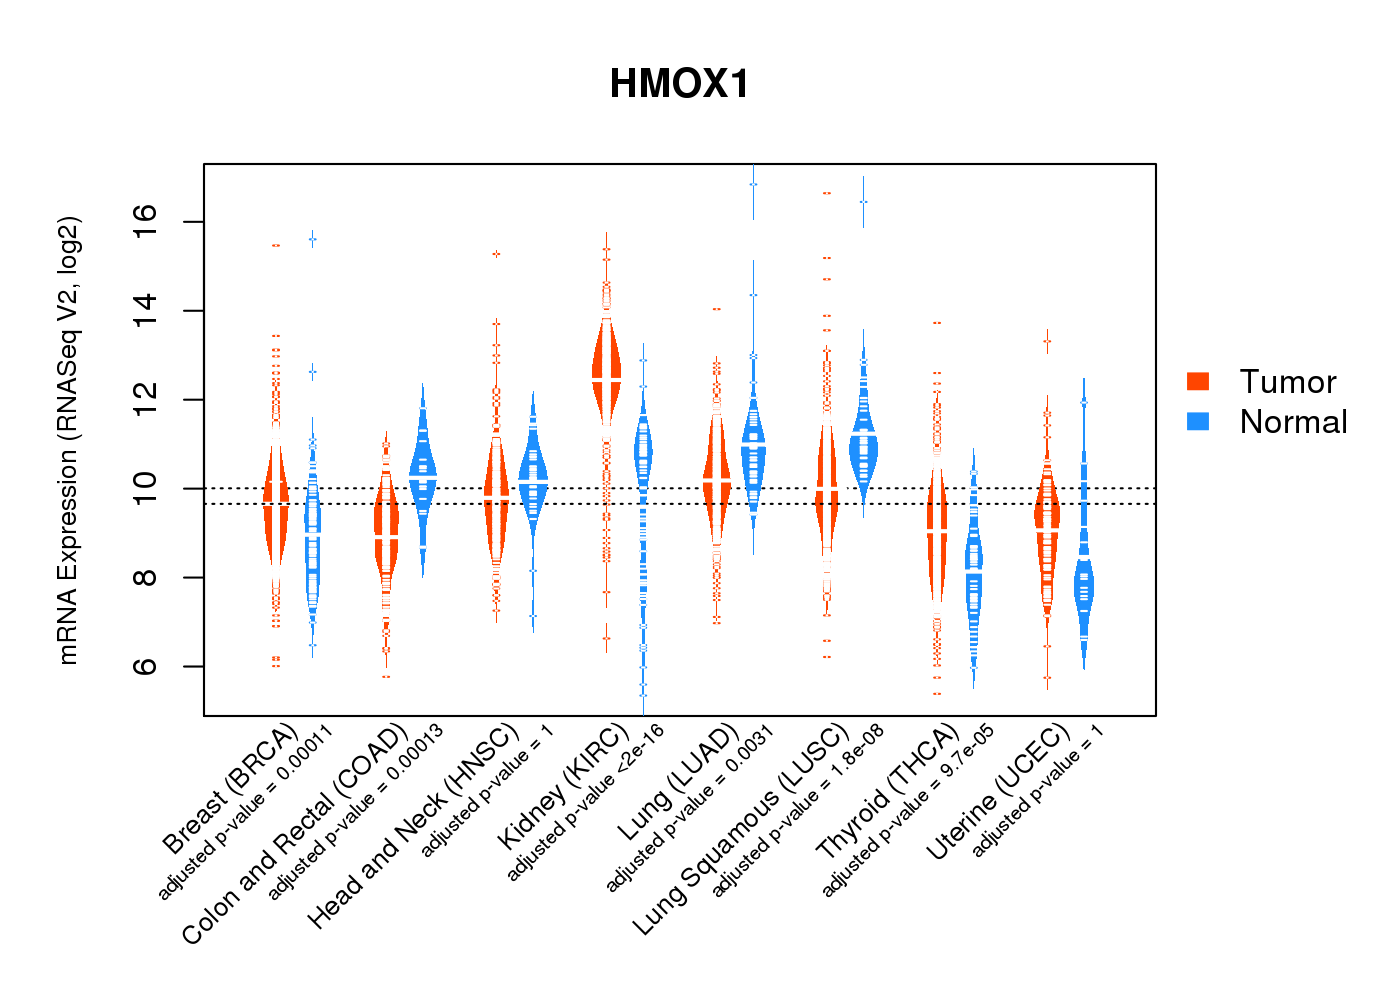
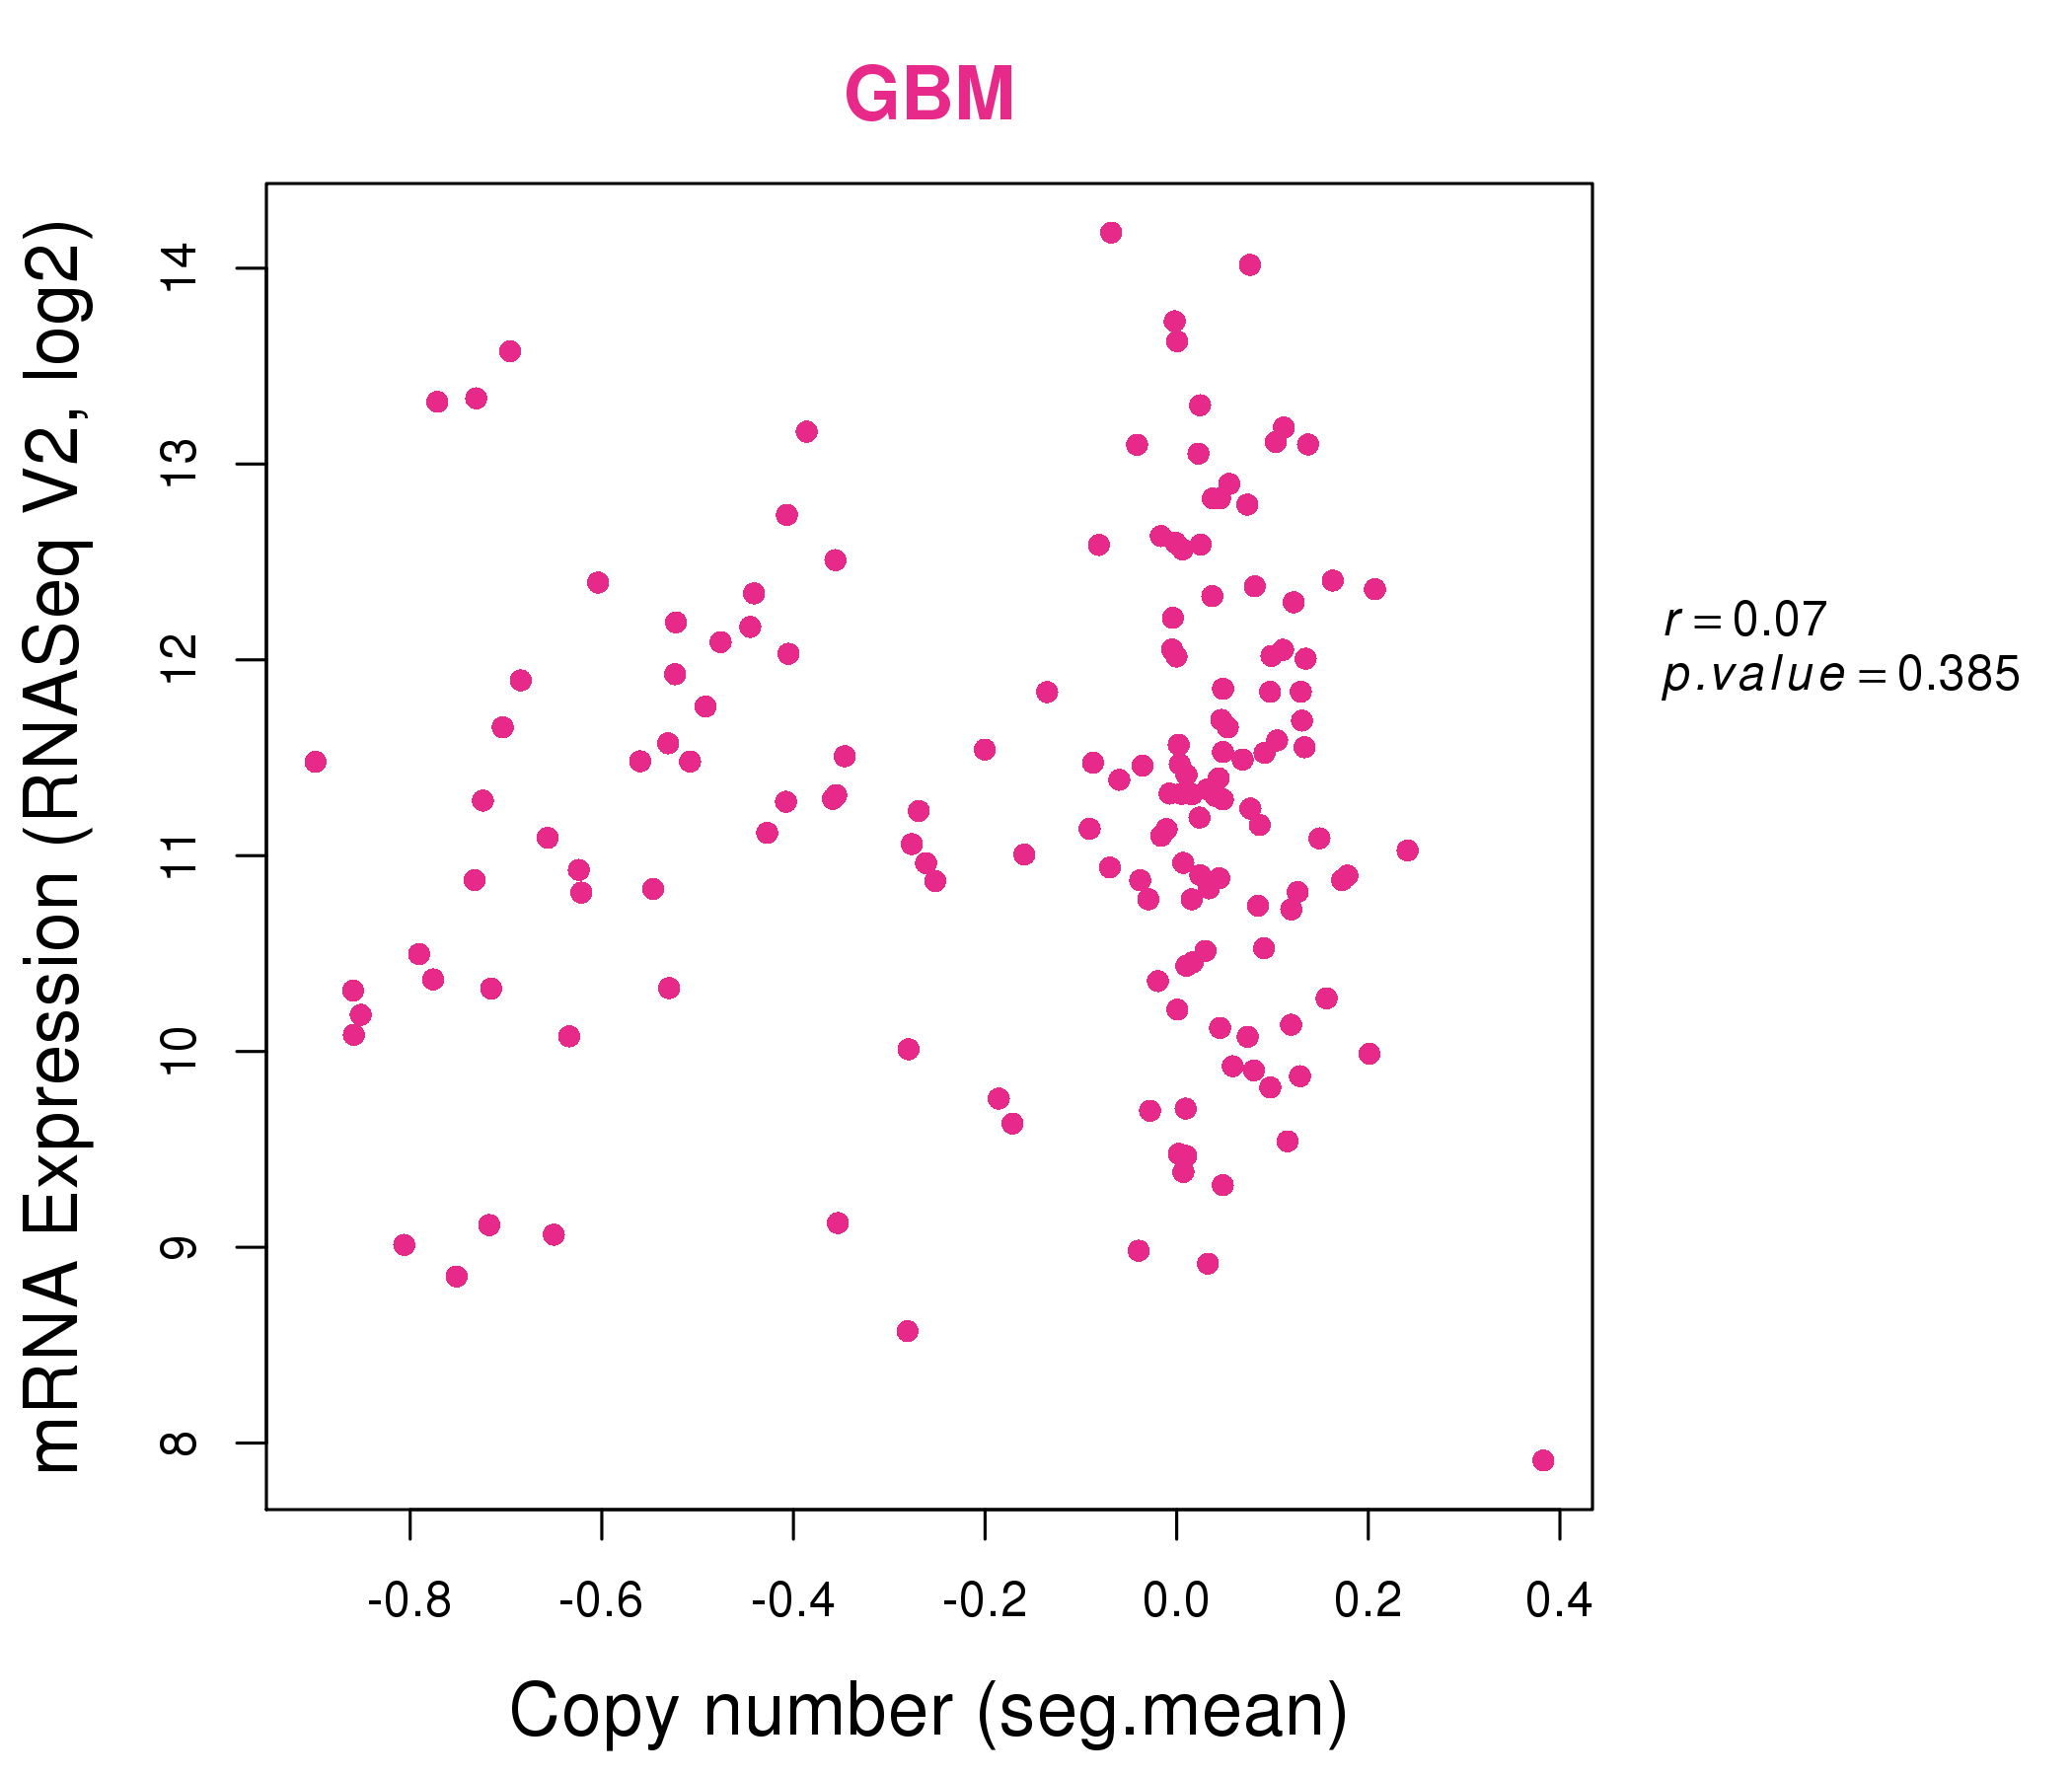
| * Normalized gene expression data of RNASeqV2 was extracted from TCGA using R package TCGA-Assembler. The URLs of all public data files on TCGA DCC data server were gathered at Jan-05-2015. Only eight cancer types have enough normal control samples for differential expression analysis. (t test, adjusted p<0.05 (using Benjamini-Hochberg FDR)) |
 |
| Top |
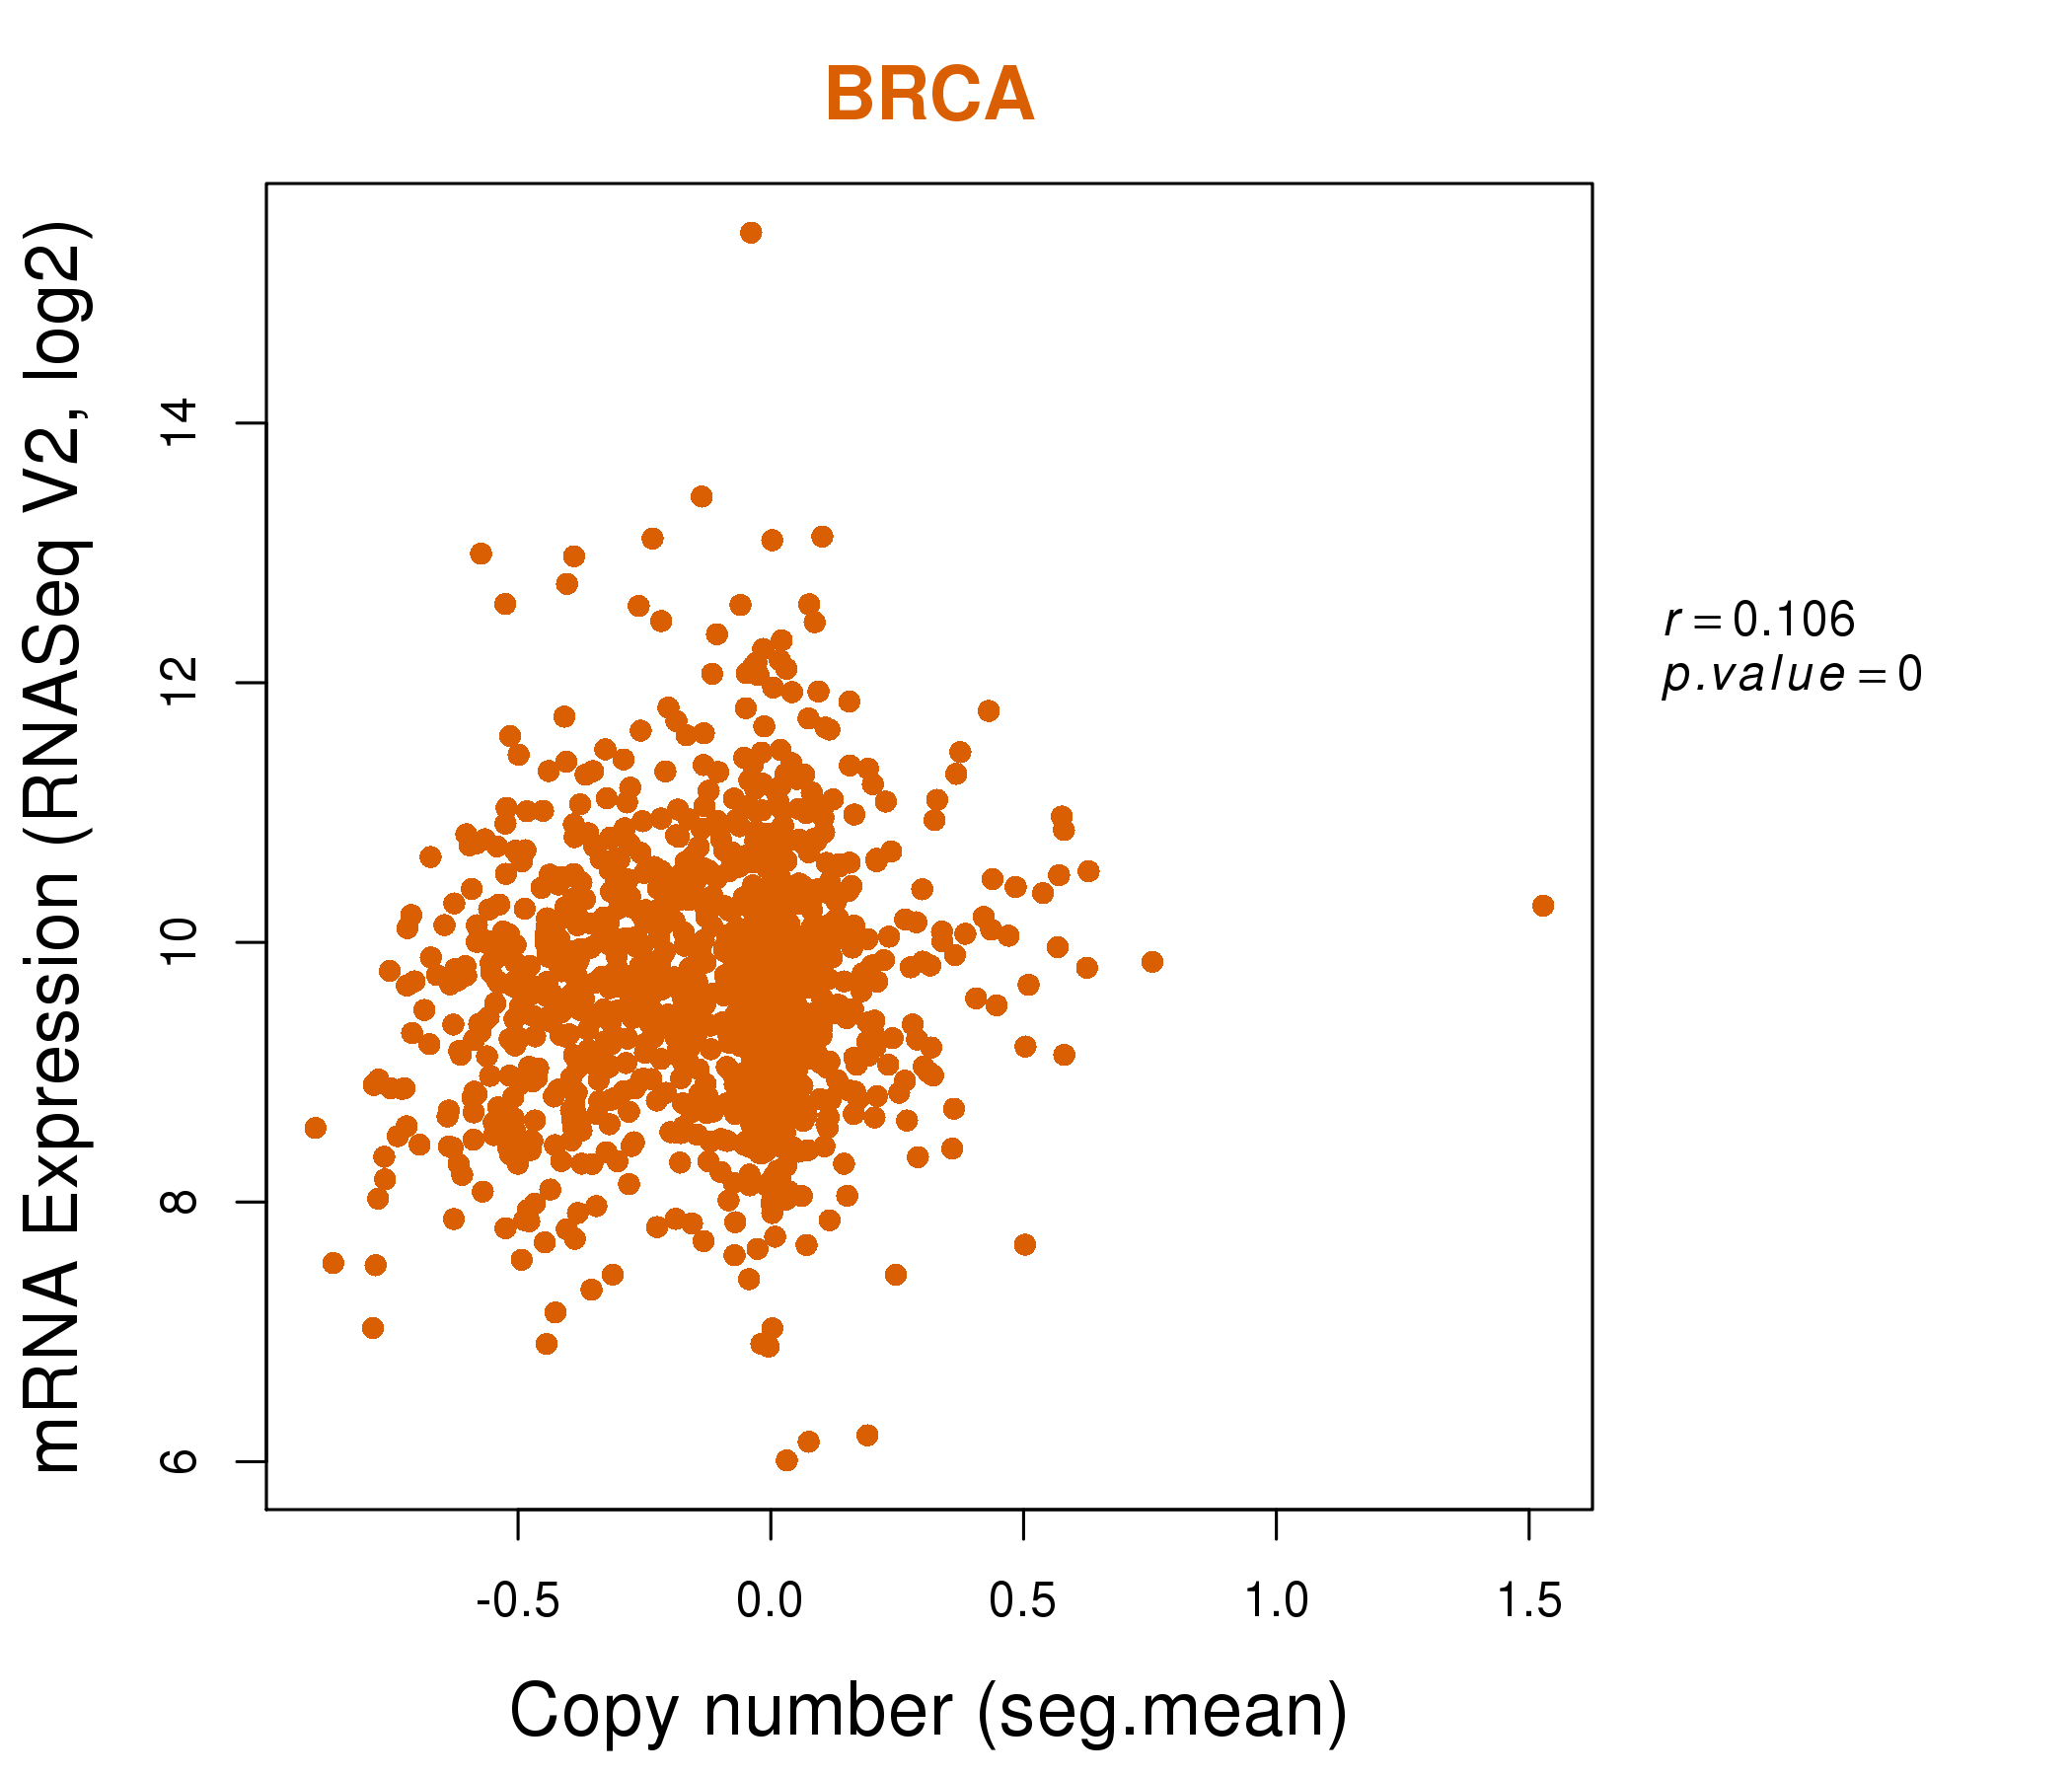
| * This plots show the correlation between CNV and gene expression. |
: Open all plots for all cancer types
 |
|
 |
|
| Top |
| Gene-Gene Network Information |
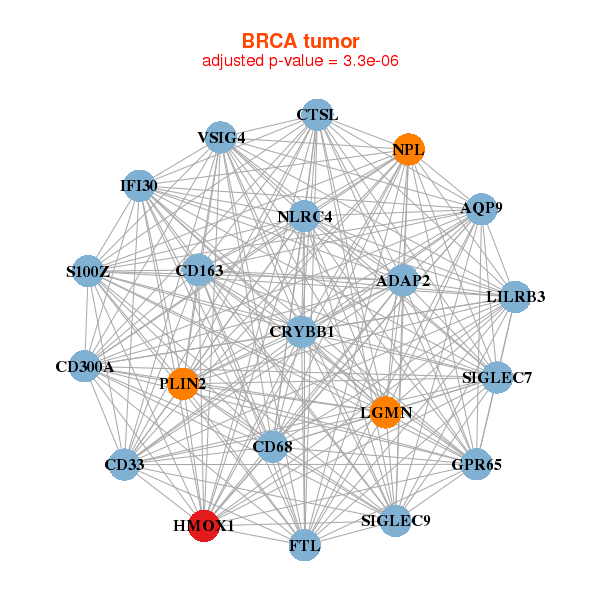
| * Co-Expression network figures were drawn using R package igraph. Only the top 20 genes with the highest correlations were shown. Red circle: input gene, orange circle: cell metabolism gene, sky circle: other gene |
: Open all plots for all cancer types
 |
| ||||
| ADAP2,AQP9,CD163,CD300A,CD33,CD68,CRYBB1, CTSL,FTL,GPR65,HMOX1,IFI30,LGMN,LILRB3, NLRC4,NPL,PLIN2,S100Z,SIGLEC7,SIGLEC9,VSIG4 | CCL18,CD163,CD200R1L,CDRT15,CEACAM3,CETP,CHST13, GAD2,GAP43,HMOX1,LGI2,OR2AG1,OR8D1,RHOXF2B, SLC48A1,SNORA19,SPATA8,SPRR2F,TECTB,VENTXP1,WNT1 | ||||
 |
| ||||
| CD14,CD300A,CD33,CD86,CYTH4,FCGR1A,FCGR1B, FPR3,HAVCR2,HMOX1,LAIR1,LAPTM5,LRRC25,MS4A4A, MS4A6A,NFAM1,SIGLEC7,SIGLEC9,SLCO2B1,SPI1,TYROBP | ACOX1,ACSL5,ANKS4B,ATP1B1,LINC00483,C1orf106,CHMP4B, CTSZ,ESPN,FTH1P3,HECTD3,HKDC1,HMOX1,KALRN, KIAA0247,MGAT4A,MPP5,PRR13,SLC9A3R1,TRHDE,TUBAL3 |
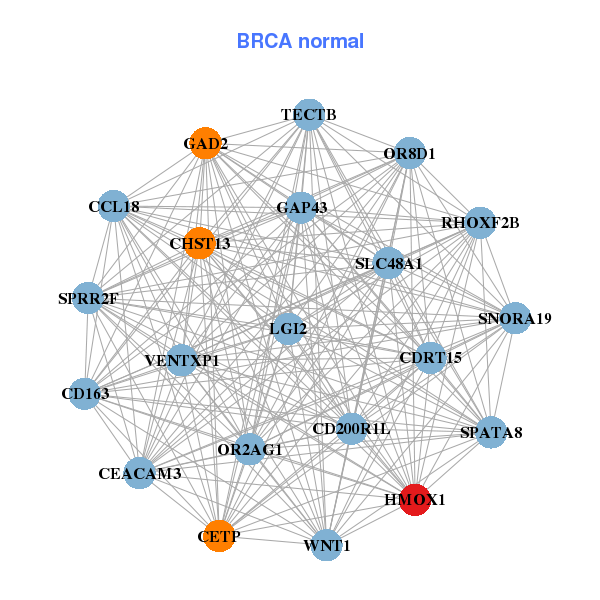
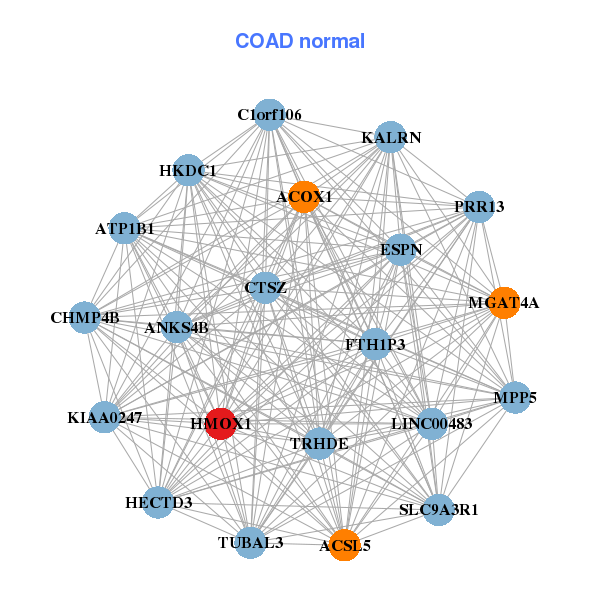
| * Co-Expression network figures were drawn using R package igraph. Only the top 20 genes with the highest correlations were shown. Red circle: input gene, orange circle: cell metabolism gene, sky circle: other gene |
: Open all plots for all cancer types
| Top |
: Open all interacting genes' information including KEGG pathway for all interacting genes from DAVID
| Top |
| Pharmacological Information for HMOX1 |
| DB Category | DB Name | DB's ID and Url link |
| Chemistry | BindingDB | P09601; -. |
| Chemistry | ChEMBL | CHEMBL2823; -. |
| Organism-specific databases | PharmGKB | PA29341; -. |
| Organism-specific databases | CTD | 3162; -. |
| * Gene Centered Interaction Network. |
 |
| * Drug Centered Interaction Network. |
| DrugBank ID | Target Name | Drug Groups | Generic Name | Drug Centered Network | Drug Structure |
| DB00157 | heme oxygenase (decycling) 1 | approved; nutraceutical | NADH |  |  |
| DB01942 | heme oxygenase (decycling) 1 | experimental | Formic Acid |  |  |
| DB02073 | heme oxygenase (decycling) 1 | experimental | Biliverdine Ix Alpha | 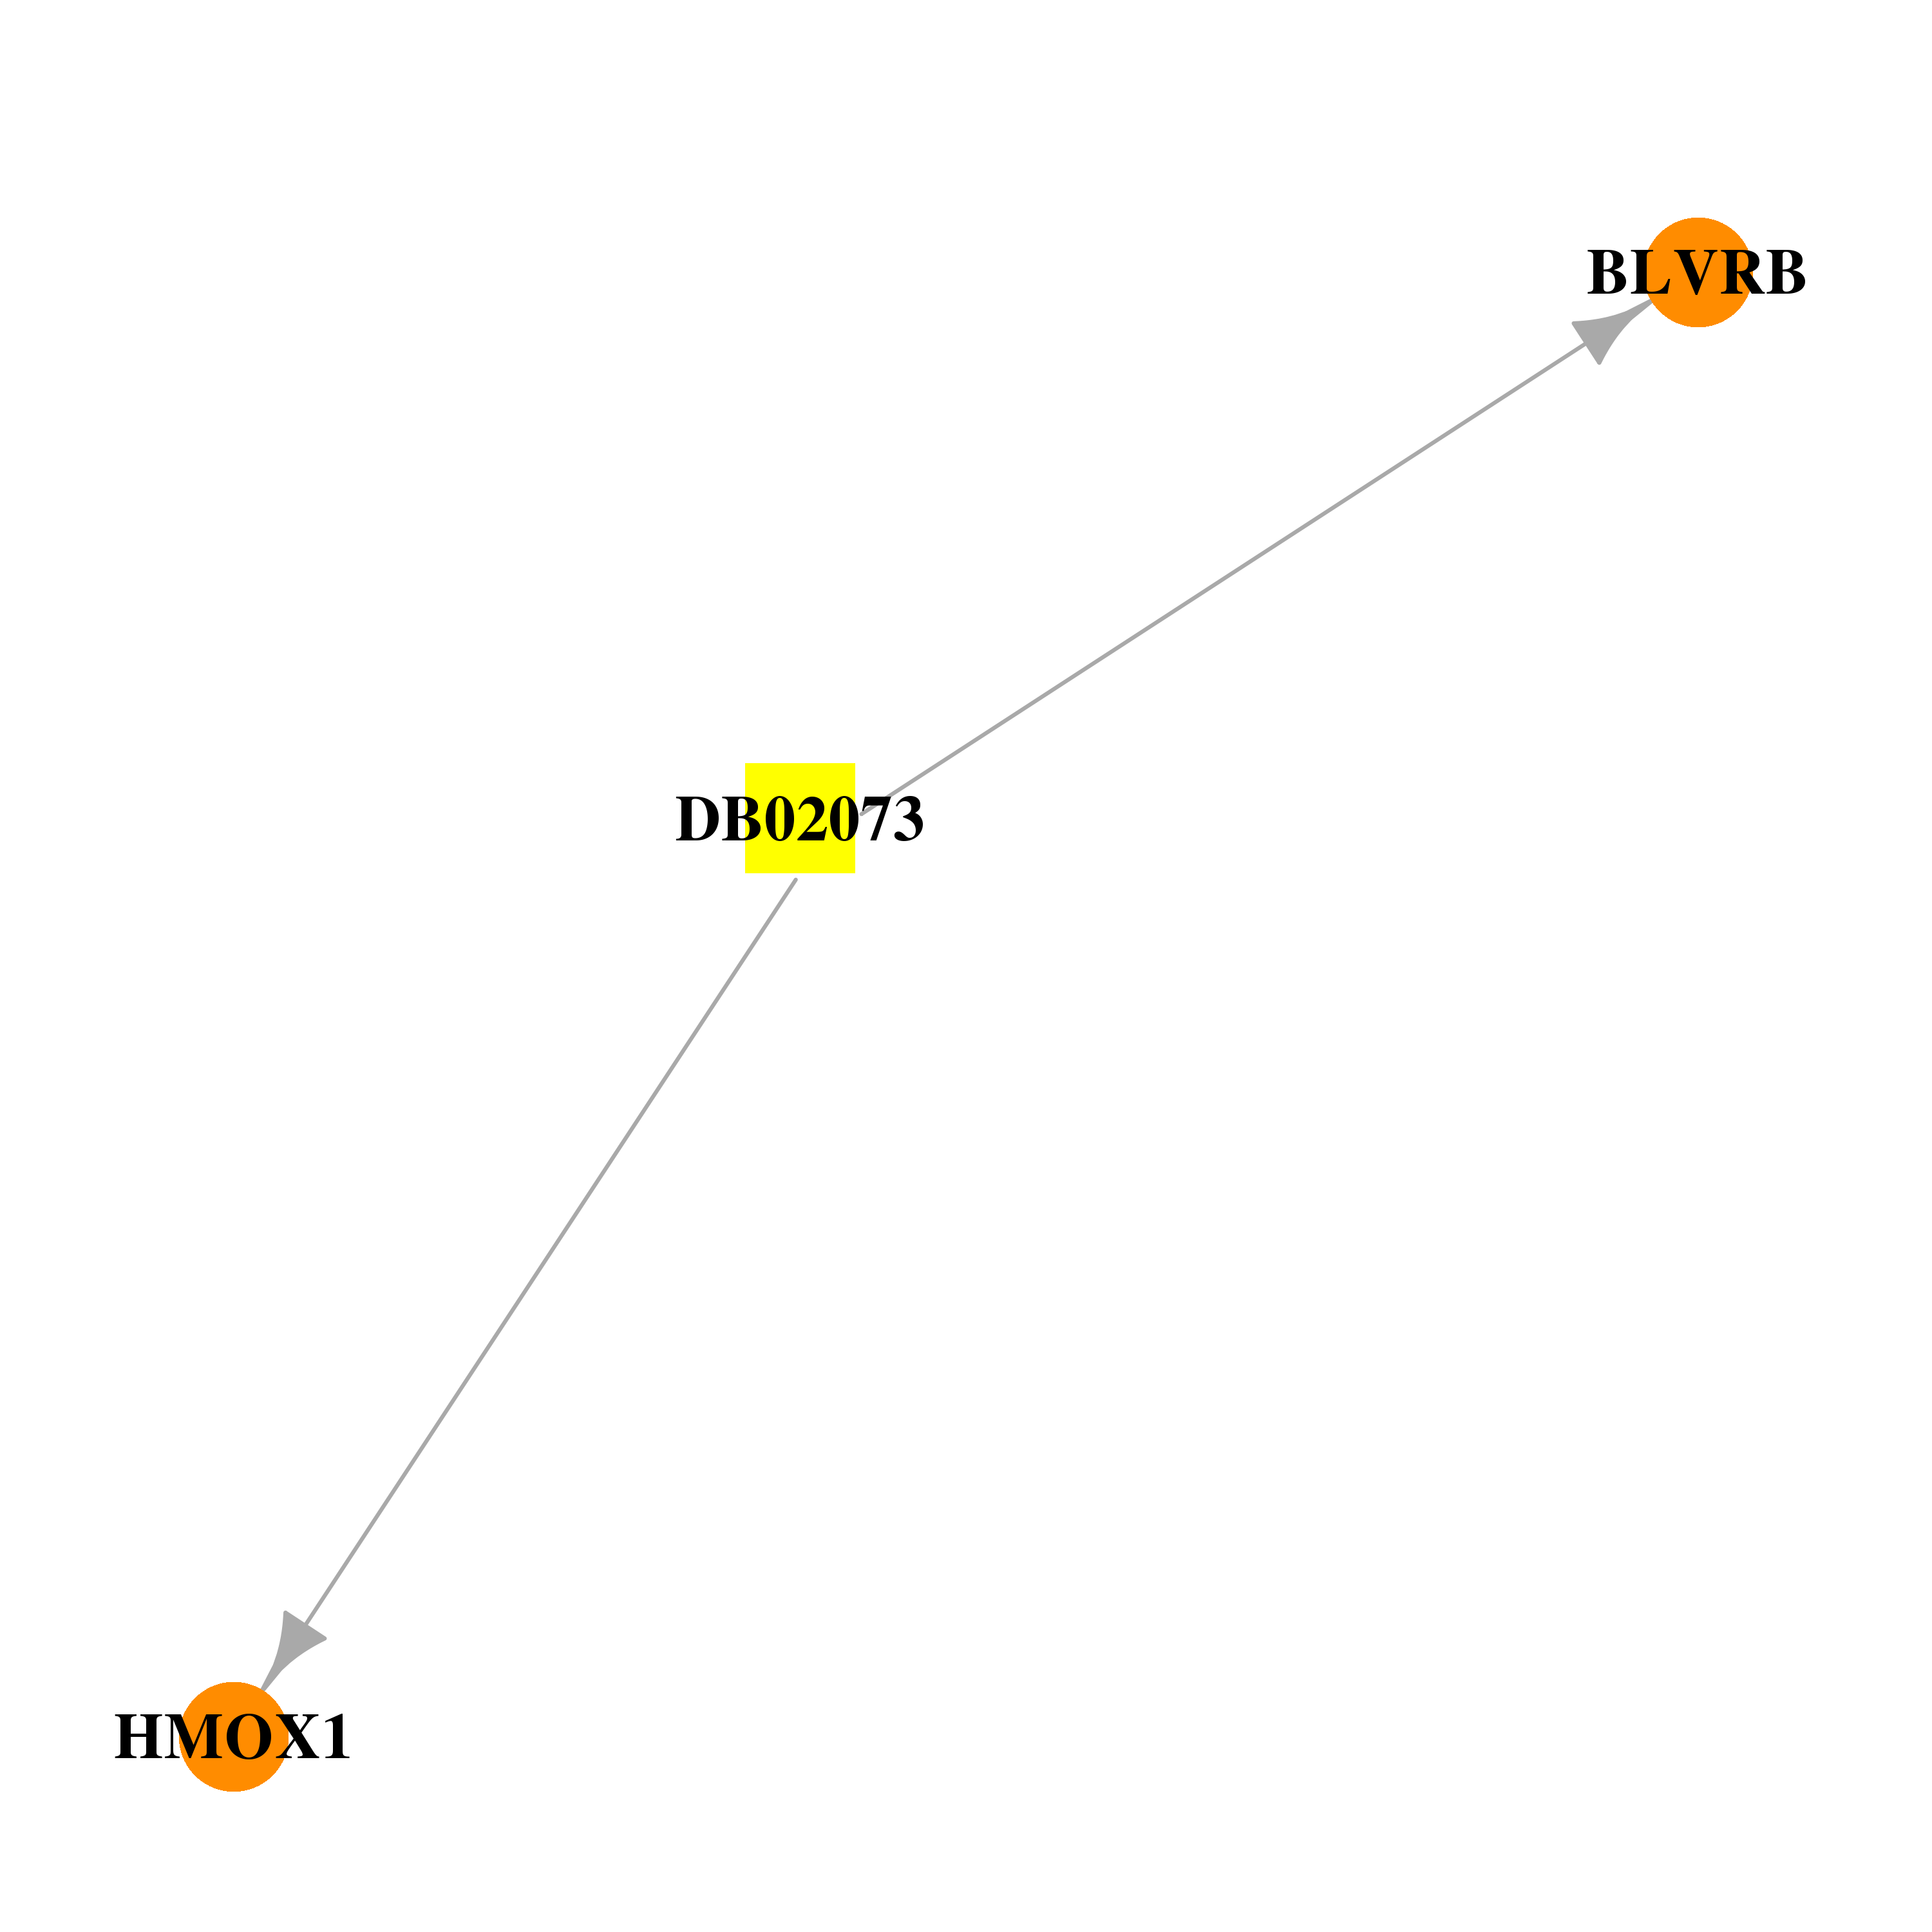 |  |
| DB02468 | heme oxygenase (decycling) 1 | experimental | 12-Phenylheme | 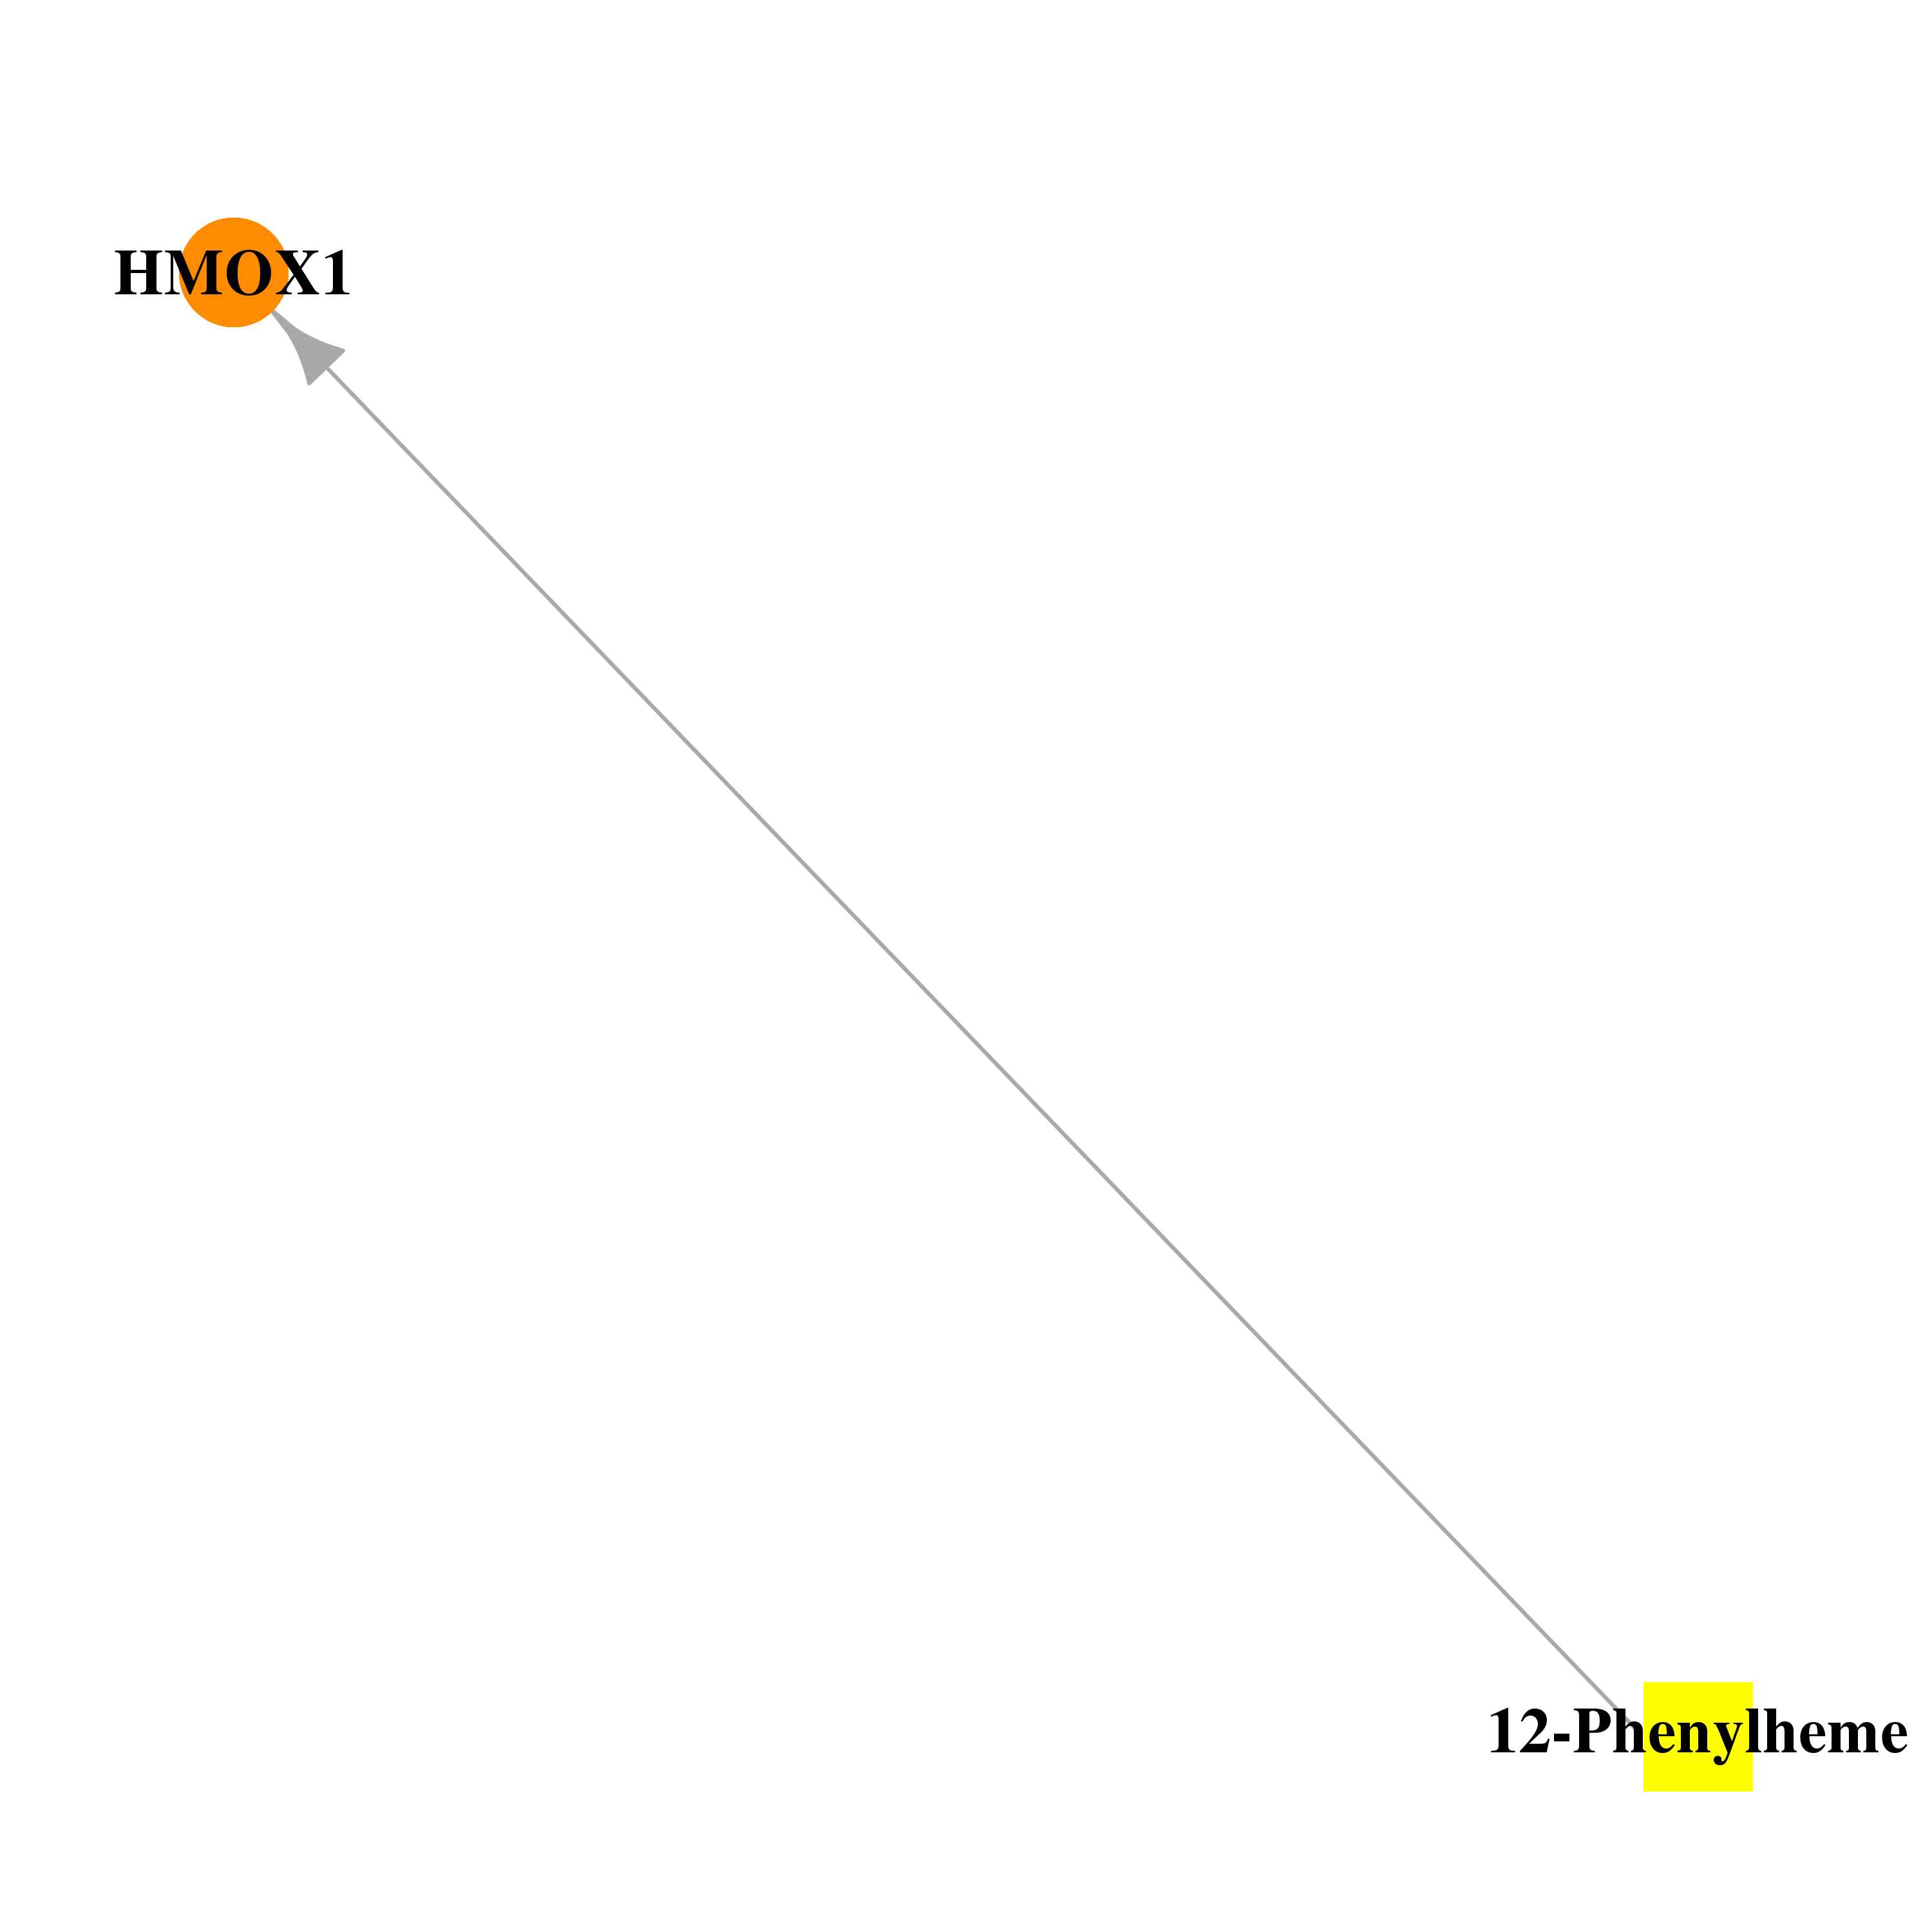 | 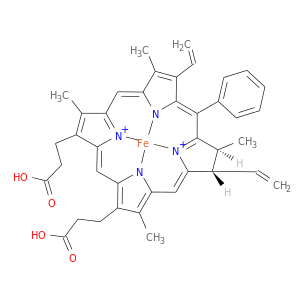 |
| DB03014 | heme oxygenase (decycling) 1 | experimental | Heme | 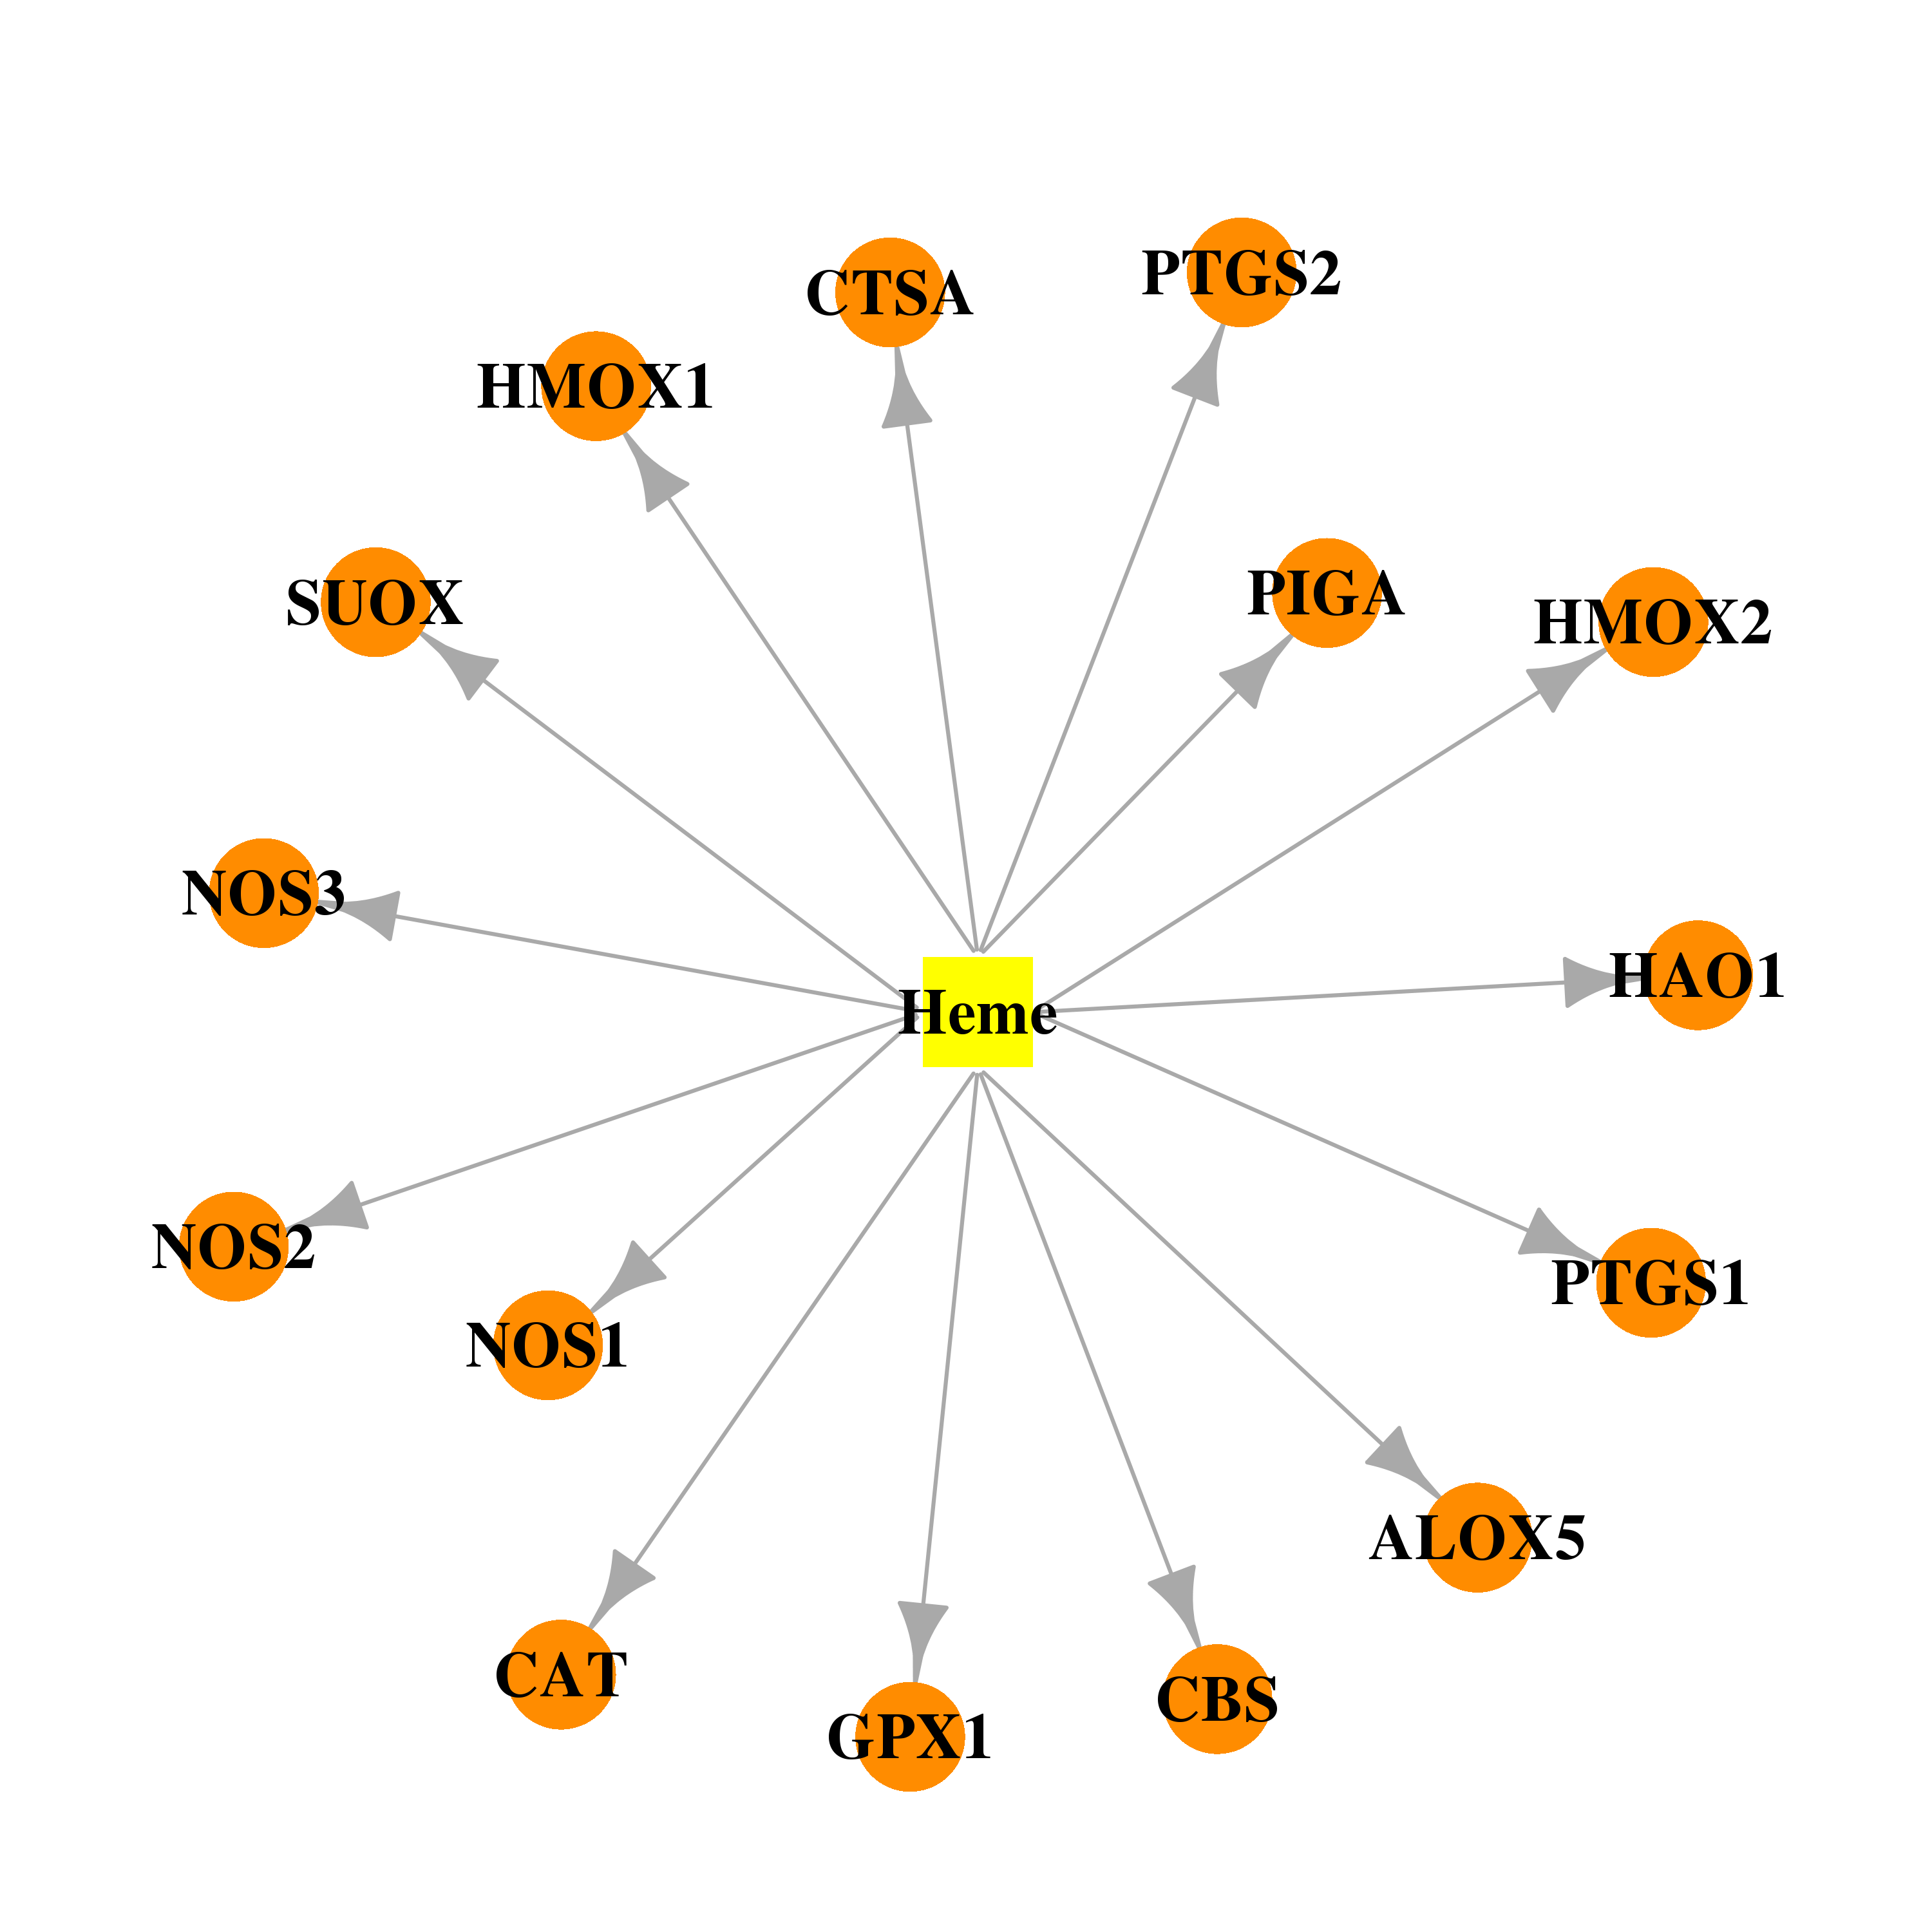 | 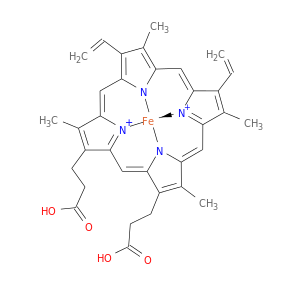 |
| DB03906 | heme oxygenase (decycling) 1 | experimental | 2-Phenylheme | 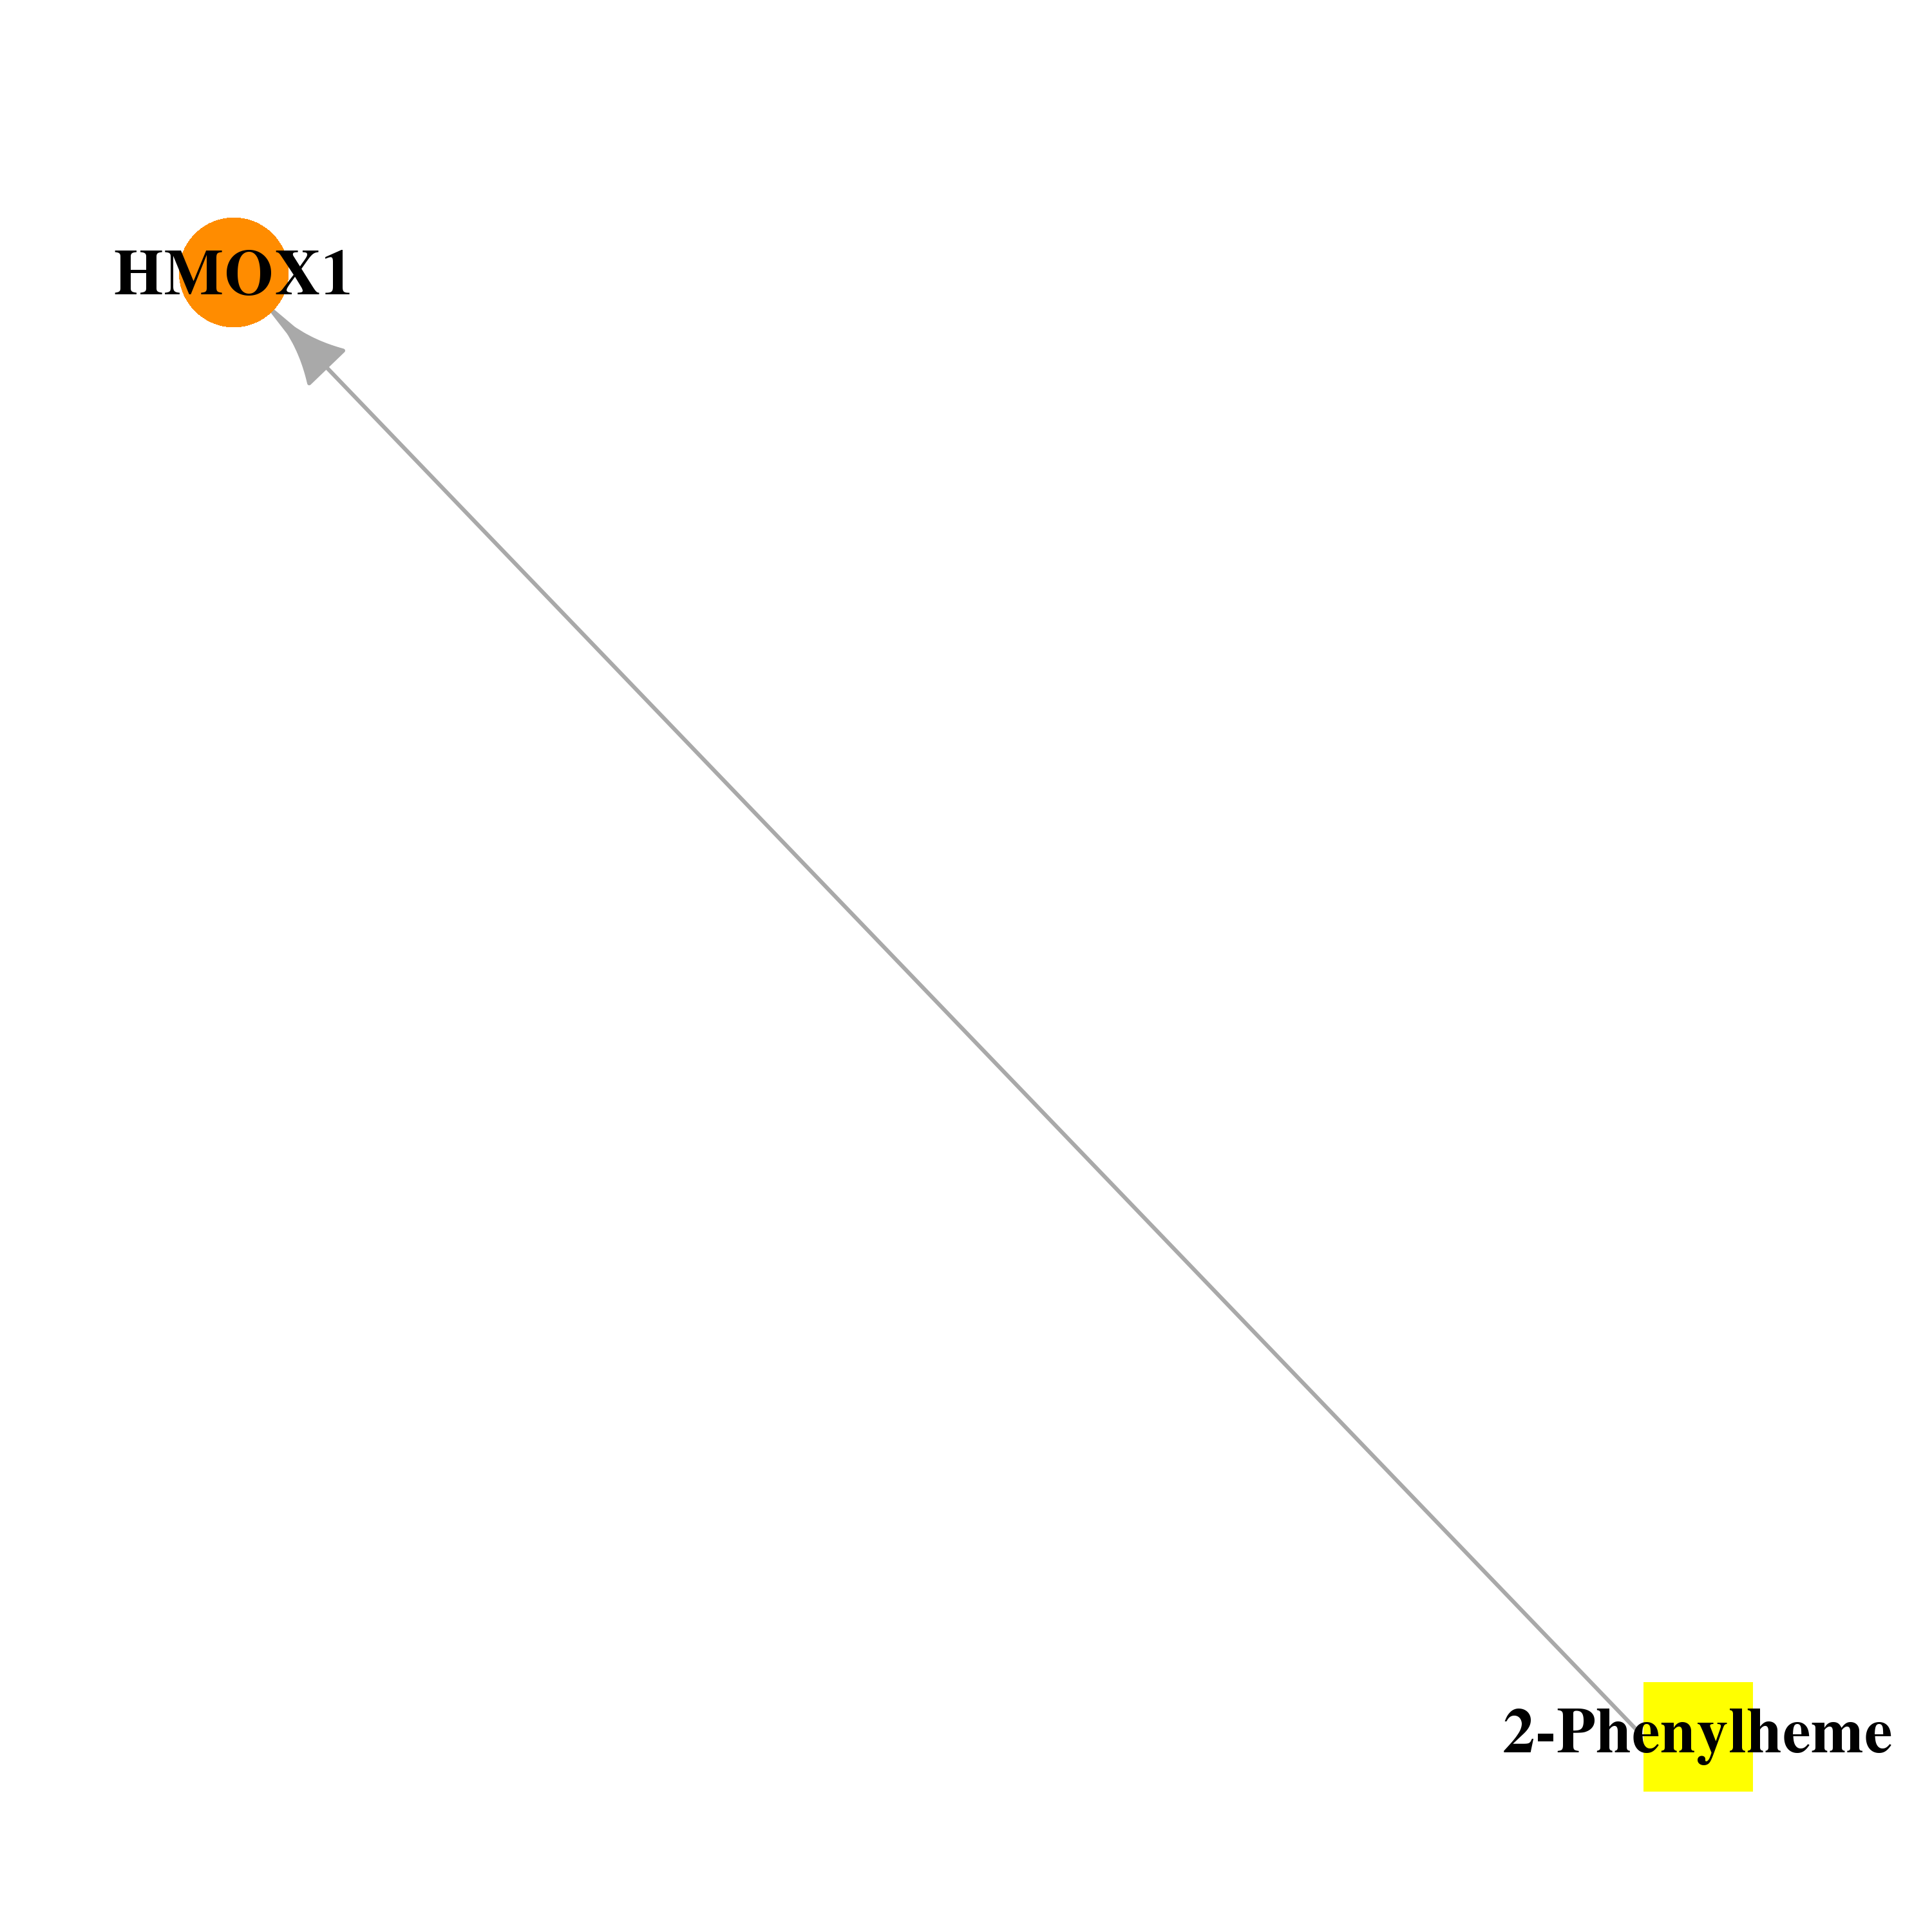 | 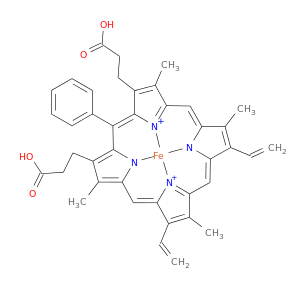 |
| DB04803 | heme oxygenase (decycling) 1 | experimental | Verdoheme |  |  |
| DB06914 | heme oxygenase (decycling) 1 | experimental | 1-({2-[2-(4-CHLOROPHENYL)ETHYL]-1,3-DIOXOLAN-2-YL}METHYL)-1H-IMIDAZOLE |  | 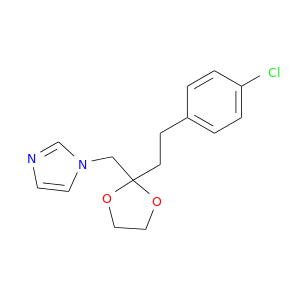 |
| DB07342 | heme oxygenase (decycling) 1 | experimental | 1-(adamantan-1-yl)-2-(1H-imidazol-1-yl)ethanone |  | 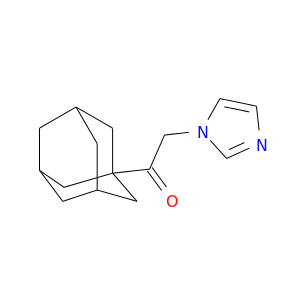 |
| Top |
| Cross referenced IDs for HMOX1 |
| * We obtained these cross-references from Uniprot database. It covers 150 different DBs, 18 categories. http://www.uniprot.org/help/cross_references_section |
: Open all cross reference information
|
Copyright © 2016-Present - The Univsersity of Texas Health Science Center at Houston @ |