|
||||||||||||||||||||
| |
| Phenotypic Information (metabolism pathway, cancer, disease, phenome) |
| |
| |
| Gene-Gene Network Information: Co-Expression Network, Interacting Genes & KEGG |
| |
|


| Gene Summary for HNMT |
| Top |
| Phenotypic Information for HNMT(metabolism pathway, cancer, disease, phenome) |
| Cancer | CGAP: HNMT |
| Familial Cancer Database: HNMT | |
| * This gene is included in those cancer gene databases. |
|
|
|
|
|
| . | ||||||||||||||
Oncogene 1 | Significant driver gene in | |||||||||||||||||||
| cf) number; DB name 1 Oncogene; http://nar.oxfordjournals.org/content/35/suppl_1/D721.long, 2 Tumor Suppressor gene; https://bioinfo.uth.edu/TSGene/, 3 Cancer Gene Census; http://www.nature.com/nrc/journal/v4/n3/abs/nrc1299.html, 4 CancerGenes; http://nar.oxfordjournals.org/content/35/suppl_1/D721.long, 5 Network of Cancer Gene; http://ncg.kcl.ac.uk/index.php, 1Therapeutic Vulnerabilities in Cancer; http://cbio.mskcc.org/cancergenomics/statius/ |
| KEGG_HISTIDINE_METABOLISM | |
| OMIM | 605238; gene. |
| Orphanet | |
| Disease | KEGG Disease: HNMT |
| MedGen: HNMT (Human Medical Genetics with Condition) | |
| ClinVar: HNMT | |
| Phenotype | MGI: HNMT (International Mouse Phenotyping Consortium) |
| PhenomicDB: HNMT | |
| Mutations for HNMT |
| * Under tables are showing count per each tissue to give us broad intuition about tissue specific mutation patterns.You can go to the detailed page for each mutation database's web site. |
| There's no structural variation information in COSMIC data for this gene. |
| * From mRNA Sanger sequences, Chitars2.0 arranged chimeric transcripts. This table shows HNMT related fusion information. |
| ID | Head Gene | Tail Gene | Accession | Gene_a | qStart_a | qEnd_a | Chromosome_a | tStart_a | tEnd_a | Gene_a | qStart_a | qEnd_a | Chromosome_a | tStart_a | tEnd_a |
| Top |
| There's no copy number variation information in COSMIC data for this gene. |
| Top |
|
 |
| Top |
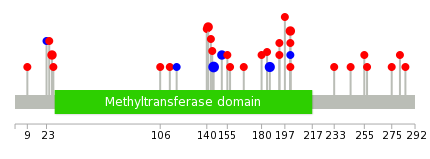
| Stat. for Non-Synonymous SNVs (# total SNVs=23) | (# total SNVs=9) |
 |  |
(# total SNVs=0) | (# total SNVs=1) |
 |
| Top |
| * When you move the cursor on each content, you can see more deailed mutation information on the Tooltip. Those are primary_site,primary_histology,mutation(aa),pubmedID. |
| GRCh37 position | Mutation(aa) | Unique sampleID count |
| chr2:138771379-138771379 | p.Y186Y | 3 |
| chr2:138762707-138762707 | p.L145L | 2 |
| chr2:138771422-138771422 | p.S201P | 2 |
| chr2:138762725-138762725 | p.I151I | 2 |
| chr2:138771423-138771423 | p.S201L | 2 |
| chr2:138759758-138759758 | p.M141I | 2 |
| chr2:138771398-138771398 | p.D193N | 2 |
| chr2:138762705-138762705 | p.L145L | 2 |
| chr2:138722141-138722141 | p.T27M | 2 |
| chr2:138722143-138722143 | p.E28K | 1 |
| Top |
|
 |
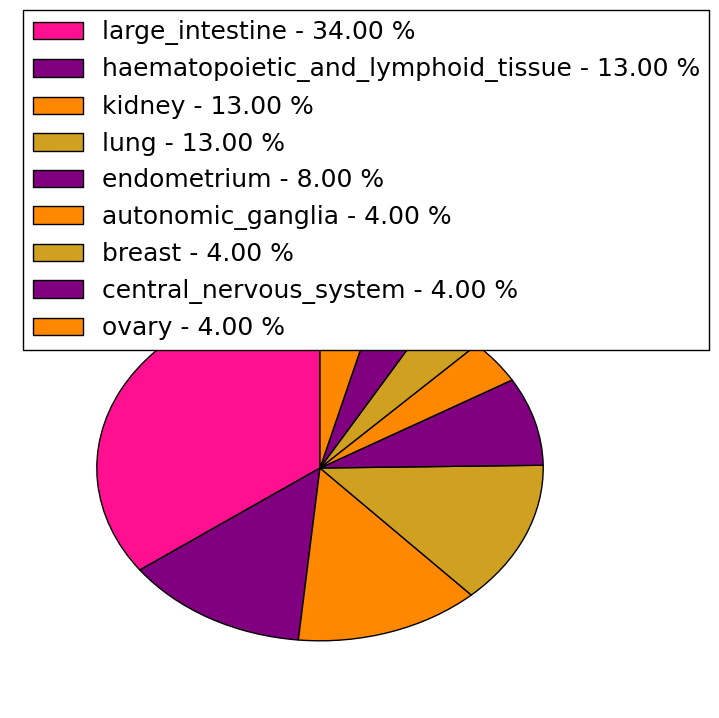
| Point Mutation/ Tissue ID | 1 | 2 | 3 | 4 | 5 | 6 | 7 | 8 | 9 | 10 | 11 | 12 | 13 | 14 | 15 | 16 | 17 | 18 | 19 | 20 |
| # sample | 1 | 11 | 1 | 1 | 3 | 4 | 1 | 2 | 5 | |||||||||||
| # mutation | 1 | 9 | 1 | 1 | 5 | 5 | 1 | 2 | 5 | |||||||||||
| nonsynonymous SNV | 1 | 8 | 1 | 1 | 4 | 4 | 1 | 1 | 2 | |||||||||||
| synonymous SNV | 1 | 1 | 1 | 1 | 3 |
| cf) Tissue ID; Tissue type (1; BLCA[Bladder Urothelial Carcinoma], 2; BRCA[Breast invasive carcinoma], 3; CESC[Cervical squamous cell carcinoma and endocervical adenocarcinoma], 4; COAD[Colon adenocarcinoma], 5; GBM[Glioblastoma multiforme], 6; Glioma Low Grade, 7; HNSC[Head and Neck squamous cell carcinoma], 8; KICH[Kidney Chromophobe], 9; KIRC[Kidney renal clear cell carcinoma], 10; KIRP[Kidney renal papillary cell carcinoma], 11; LAML[Acute Myeloid Leukemia], 12; LUAD[Lung adenocarcinoma], 13; LUSC[Lung squamous cell carcinoma], 14; OV[Ovarian serous cystadenocarcinoma ], 15; PAAD[Pancreatic adenocarcinoma], 16; PRAD[Prostate adenocarcinoma], 17; SKCM[Skin Cutaneous Melanoma], 18:STAD[Stomach adenocarcinoma], 19:THCA[Thyroid carcinoma], 20:UCEC[Uterine Corpus Endometrial Carcinoma]) |
| Top |
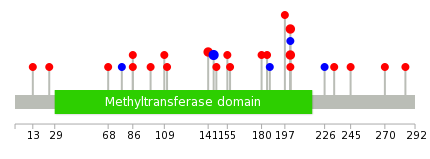
| * We represented just top 10 SNVs. When you move the cursor on each content, you can see more deailed mutation information on the Tooltip. Those are primary_site, primary_histology, mutation(aa), pubmedID. |
| Genomic Position | Mutation(aa) | Unique sampleID count |
| chr2:138771422 | p.S201P | 3 |
| chr2:138759758 | p.M141I | 2 |
| chr2:138771423 | p.L145L | 2 |
| chr2:138762705 | p.S201L | 2 |
| chr2:138762743 | p.R86H | 1 |
| chr2:138771630 | p.S201S | 1 |
| chr2:138738851 | p.R99H | 1 |
| chr2:138771361 | p.I226I | 1 |
| chr2:138771674 | p.R109C | 1 |
| chr2:138738852 | p.G233D | 1 |
| * Copy number data were extracted from TCGA using R package TCGA-Assembler. The URLs of all public data files on TCGA DCC data server were gathered on Jan-05-2015. Function ProcessCNAData in TCGA-Assembler package was used to obtain gene-level copy number value which is calculated as the average copy number of the genomic region of a gene. |
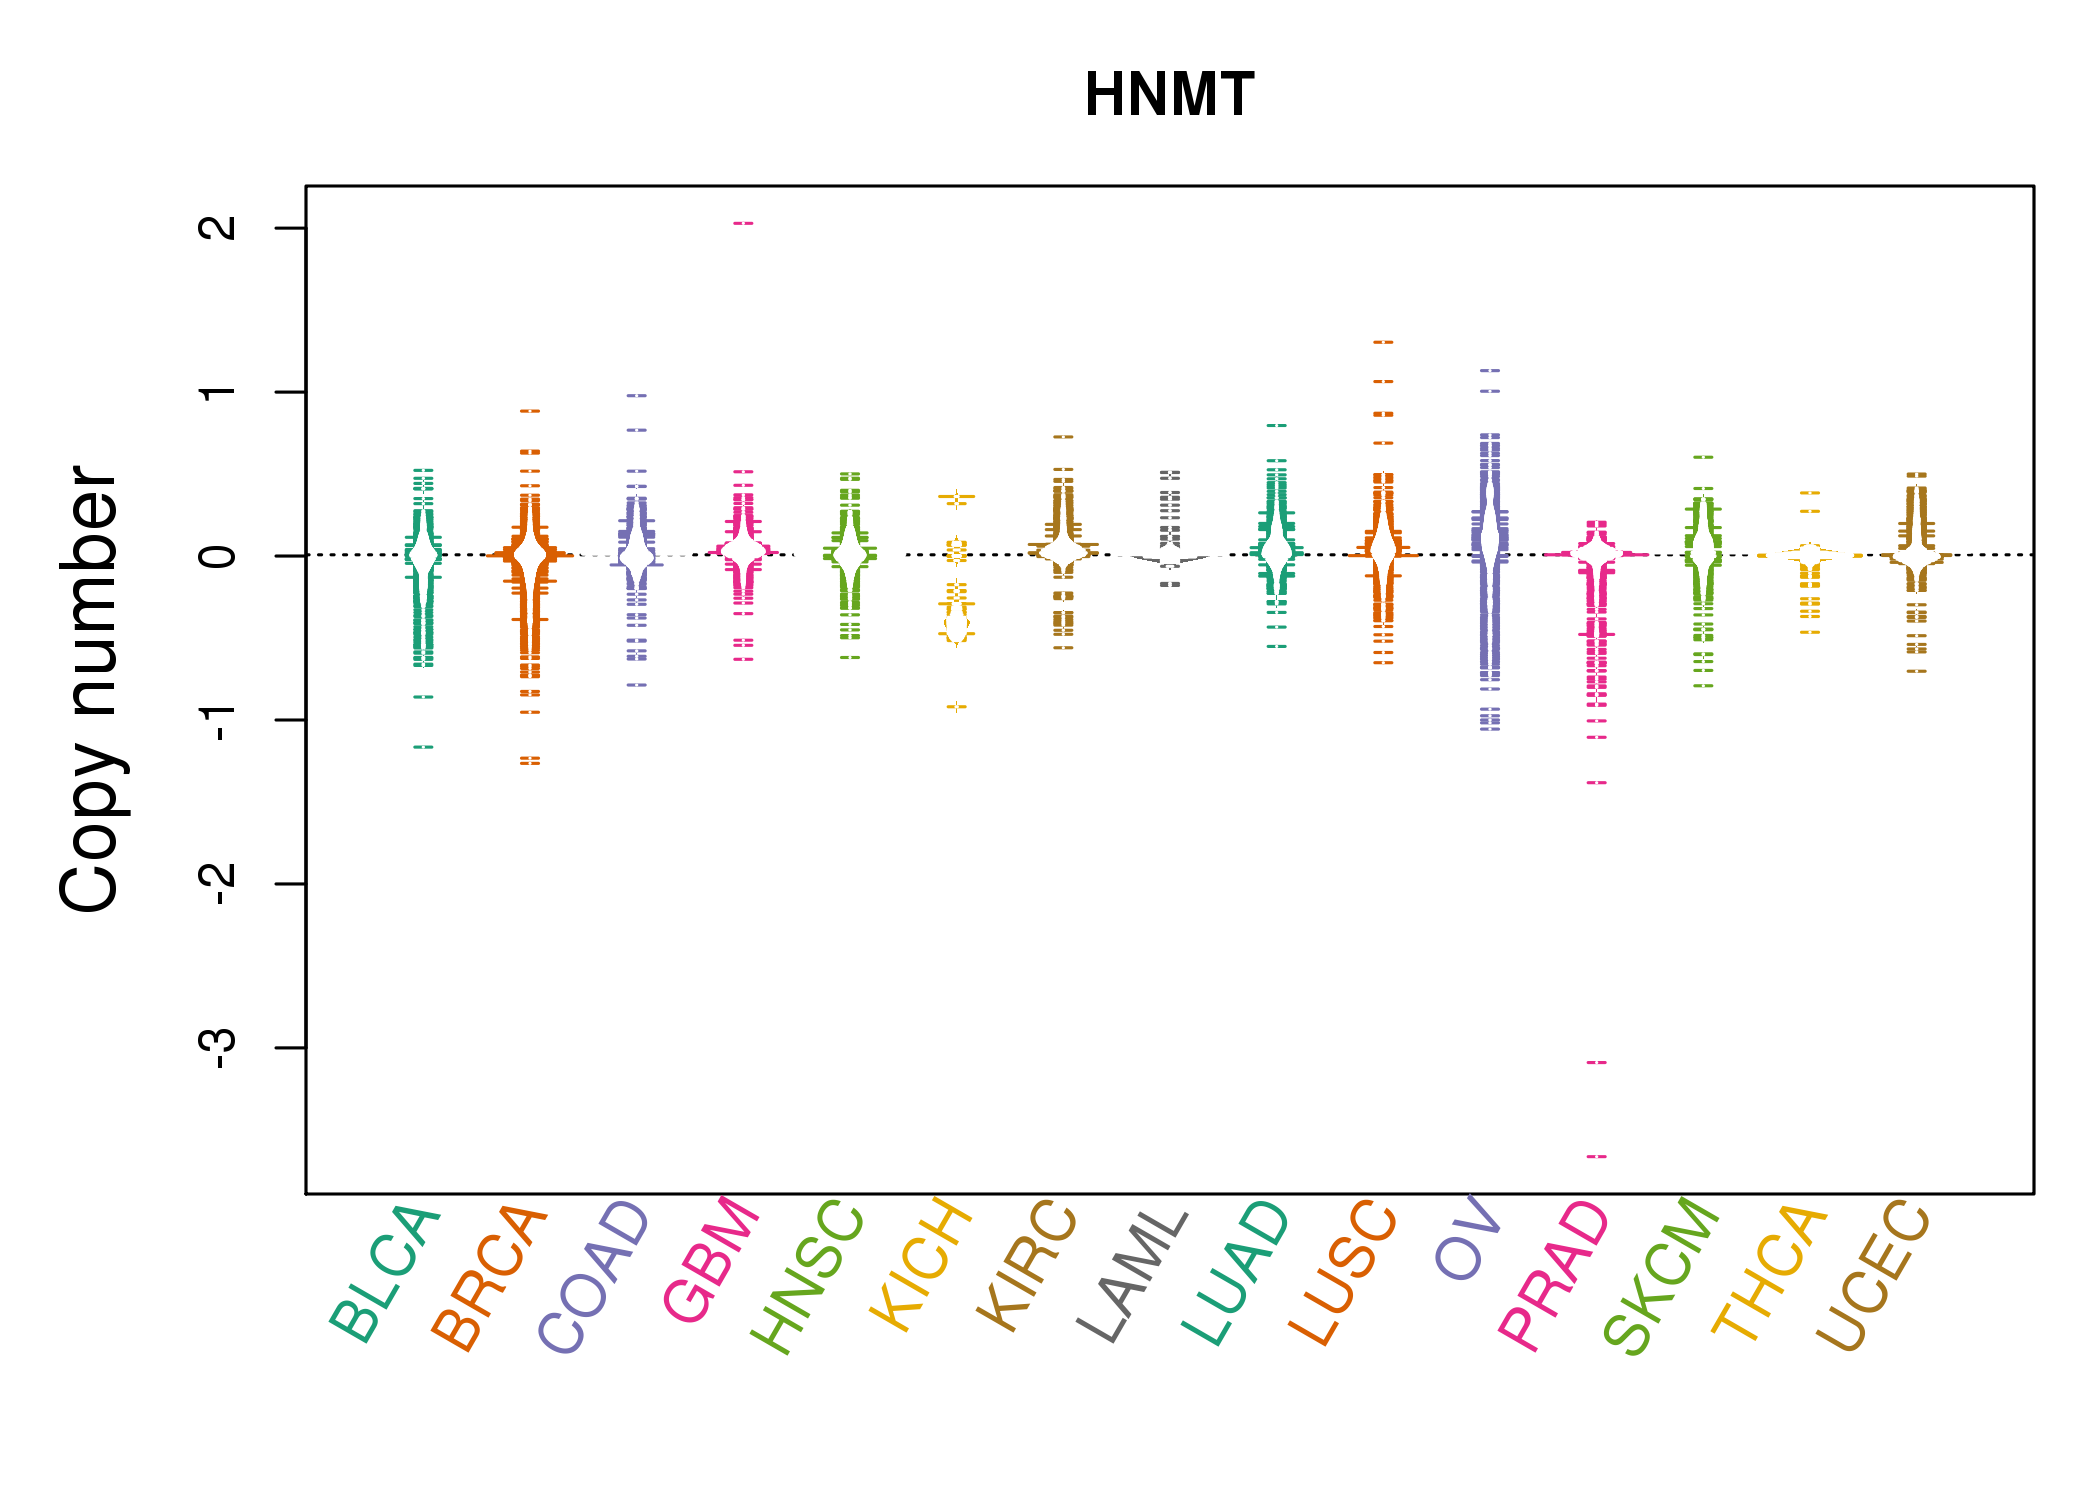 |
| cf) Tissue ID[Tissue type]: BLCA[Bladder Urothelial Carcinoma], BRCA[Breast invasive carcinoma], CESC[Cervical squamous cell carcinoma and endocervical adenocarcinoma], COAD[Colon adenocarcinoma], GBM[Glioblastoma multiforme], Glioma Low Grade, HNSC[Head and Neck squamous cell carcinoma], KICH[Kidney Chromophobe], KIRC[Kidney renal clear cell carcinoma], KIRP[Kidney renal papillary cell carcinoma], LAML[Acute Myeloid Leukemia], LUAD[Lung adenocarcinoma], LUSC[Lung squamous cell carcinoma], OV[Ovarian serous cystadenocarcinoma ], PAAD[Pancreatic adenocarcinoma], PRAD[Prostate adenocarcinoma], SKCM[Skin Cutaneous Melanoma], STAD[Stomach adenocarcinoma], THCA[Thyroid carcinoma], UCEC[Uterine Corpus Endometrial Carcinoma] |
| Top |
| Gene Expression for HNMT |
| * CCLE gene expression data were extracted from CCLE_Expression_Entrez_2012-10-18.res: Gene-centric RMA-normalized mRNA expression data. |
 |
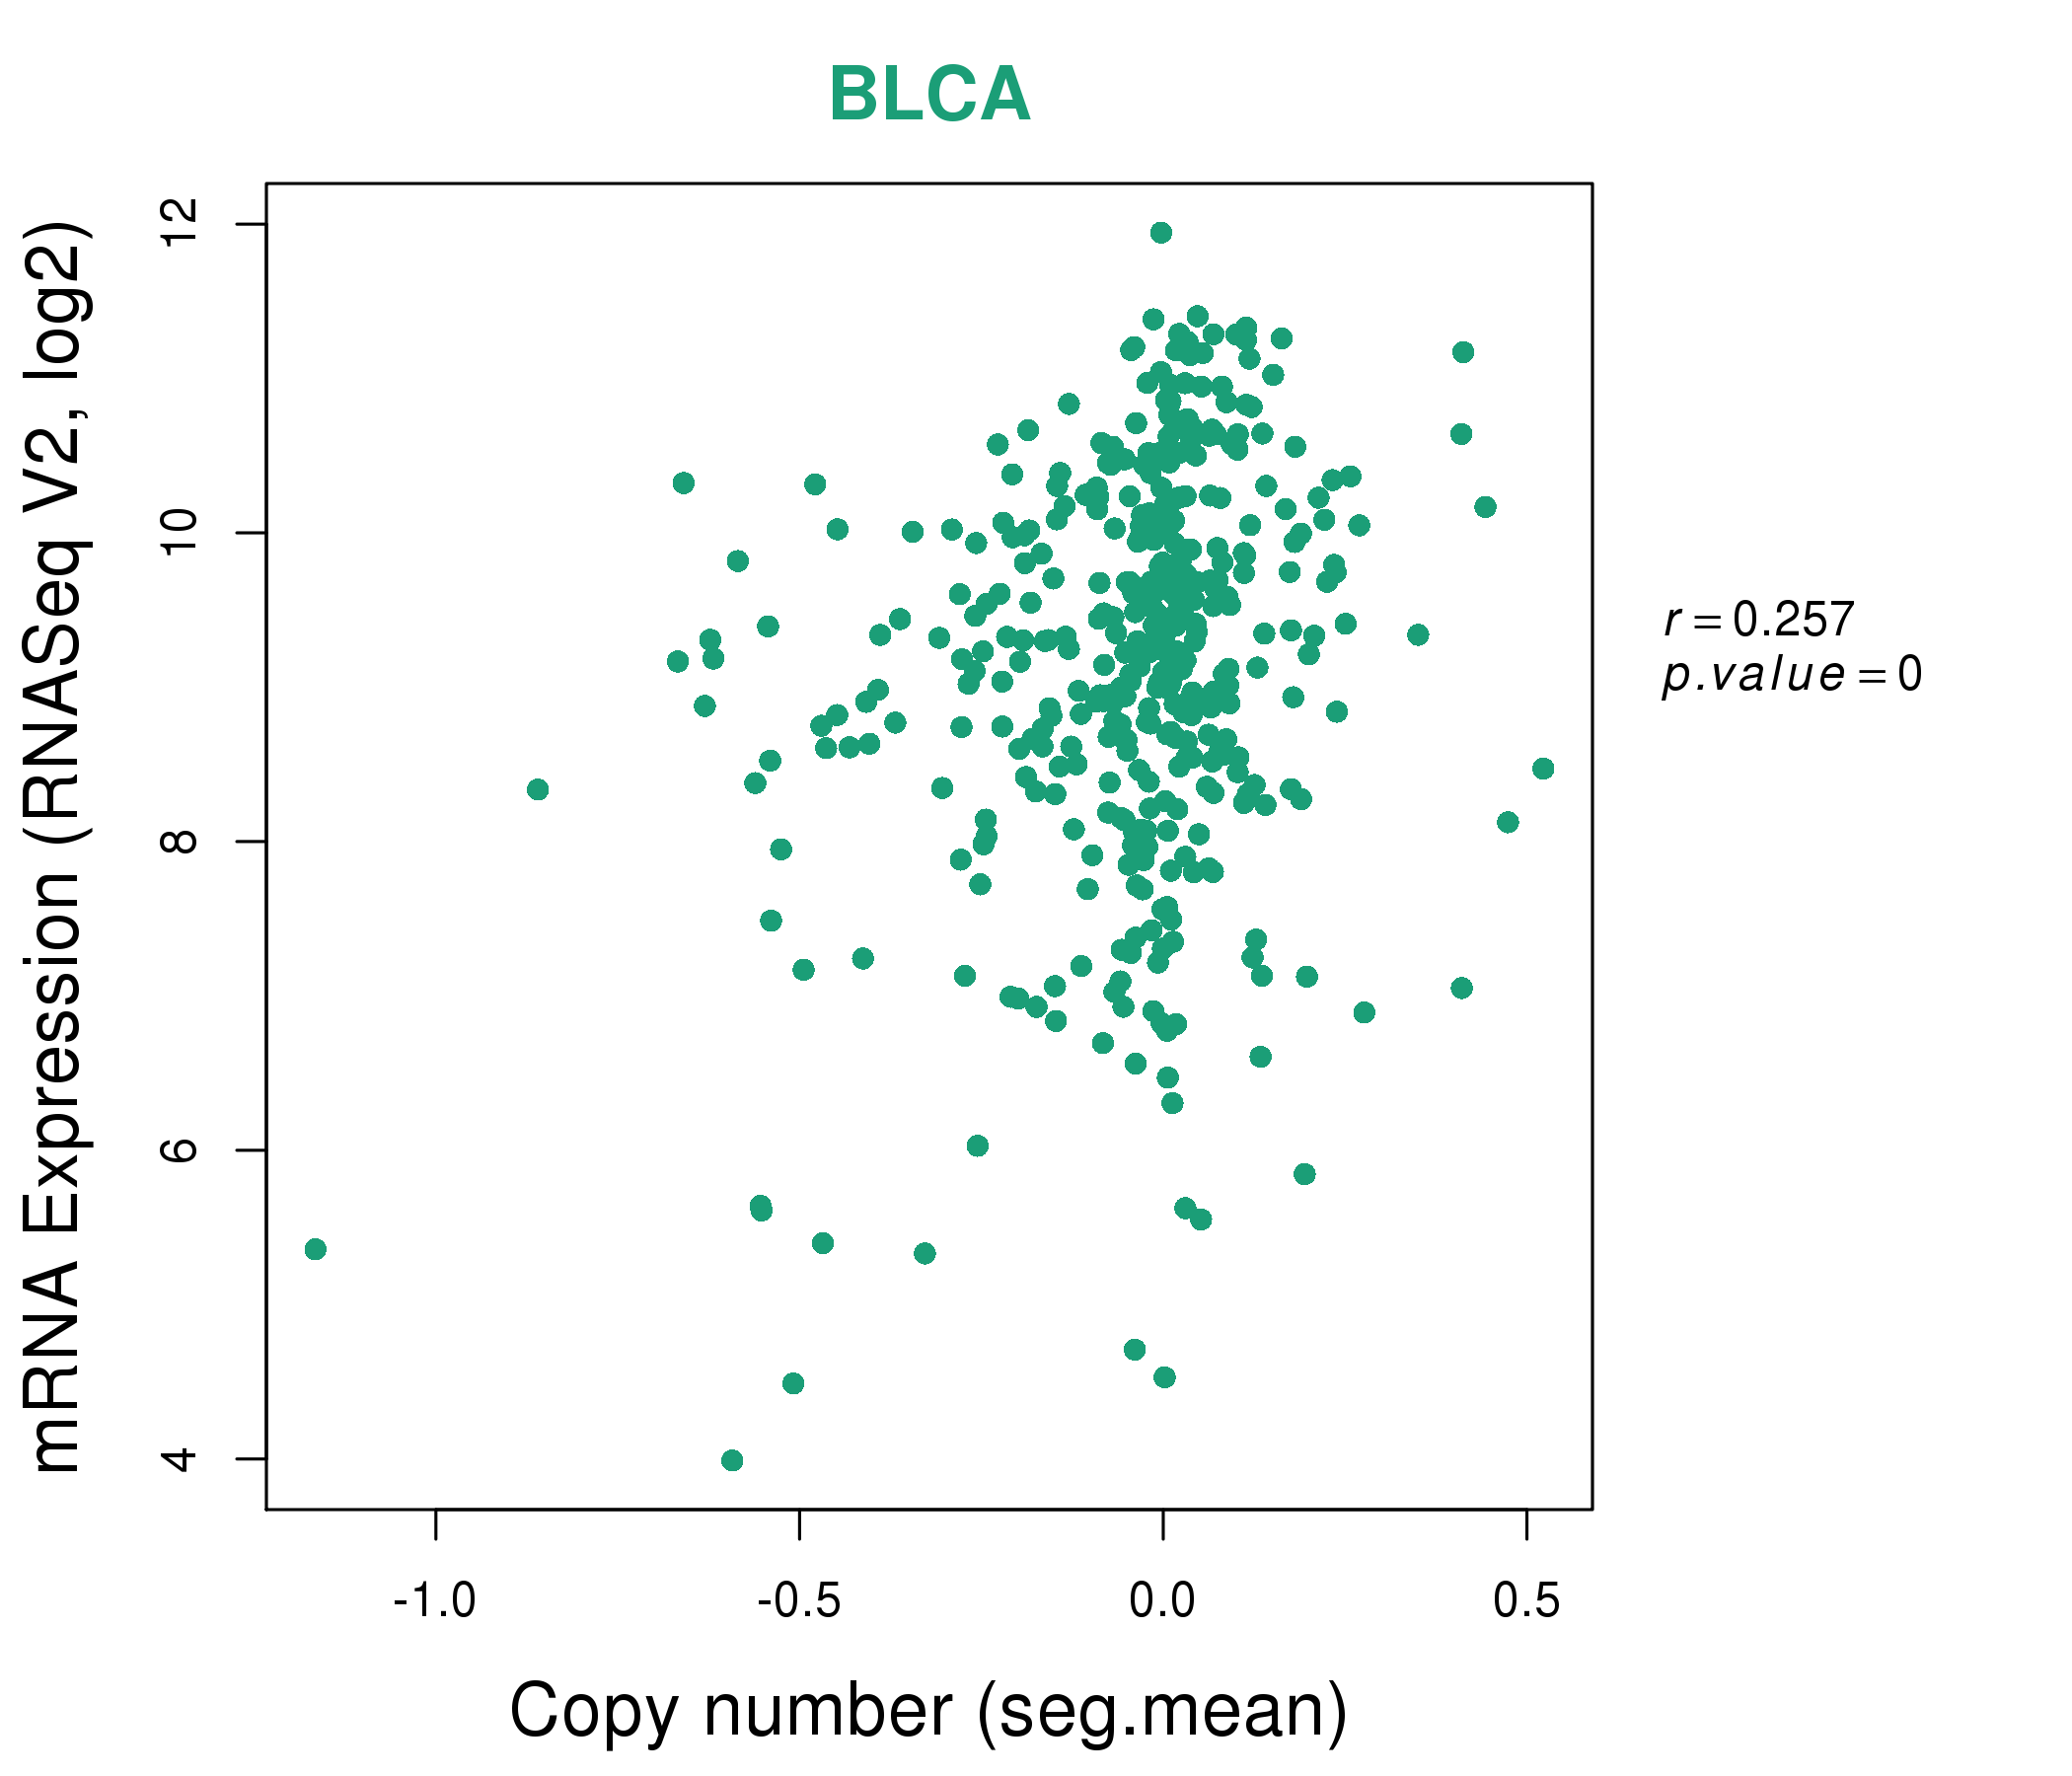
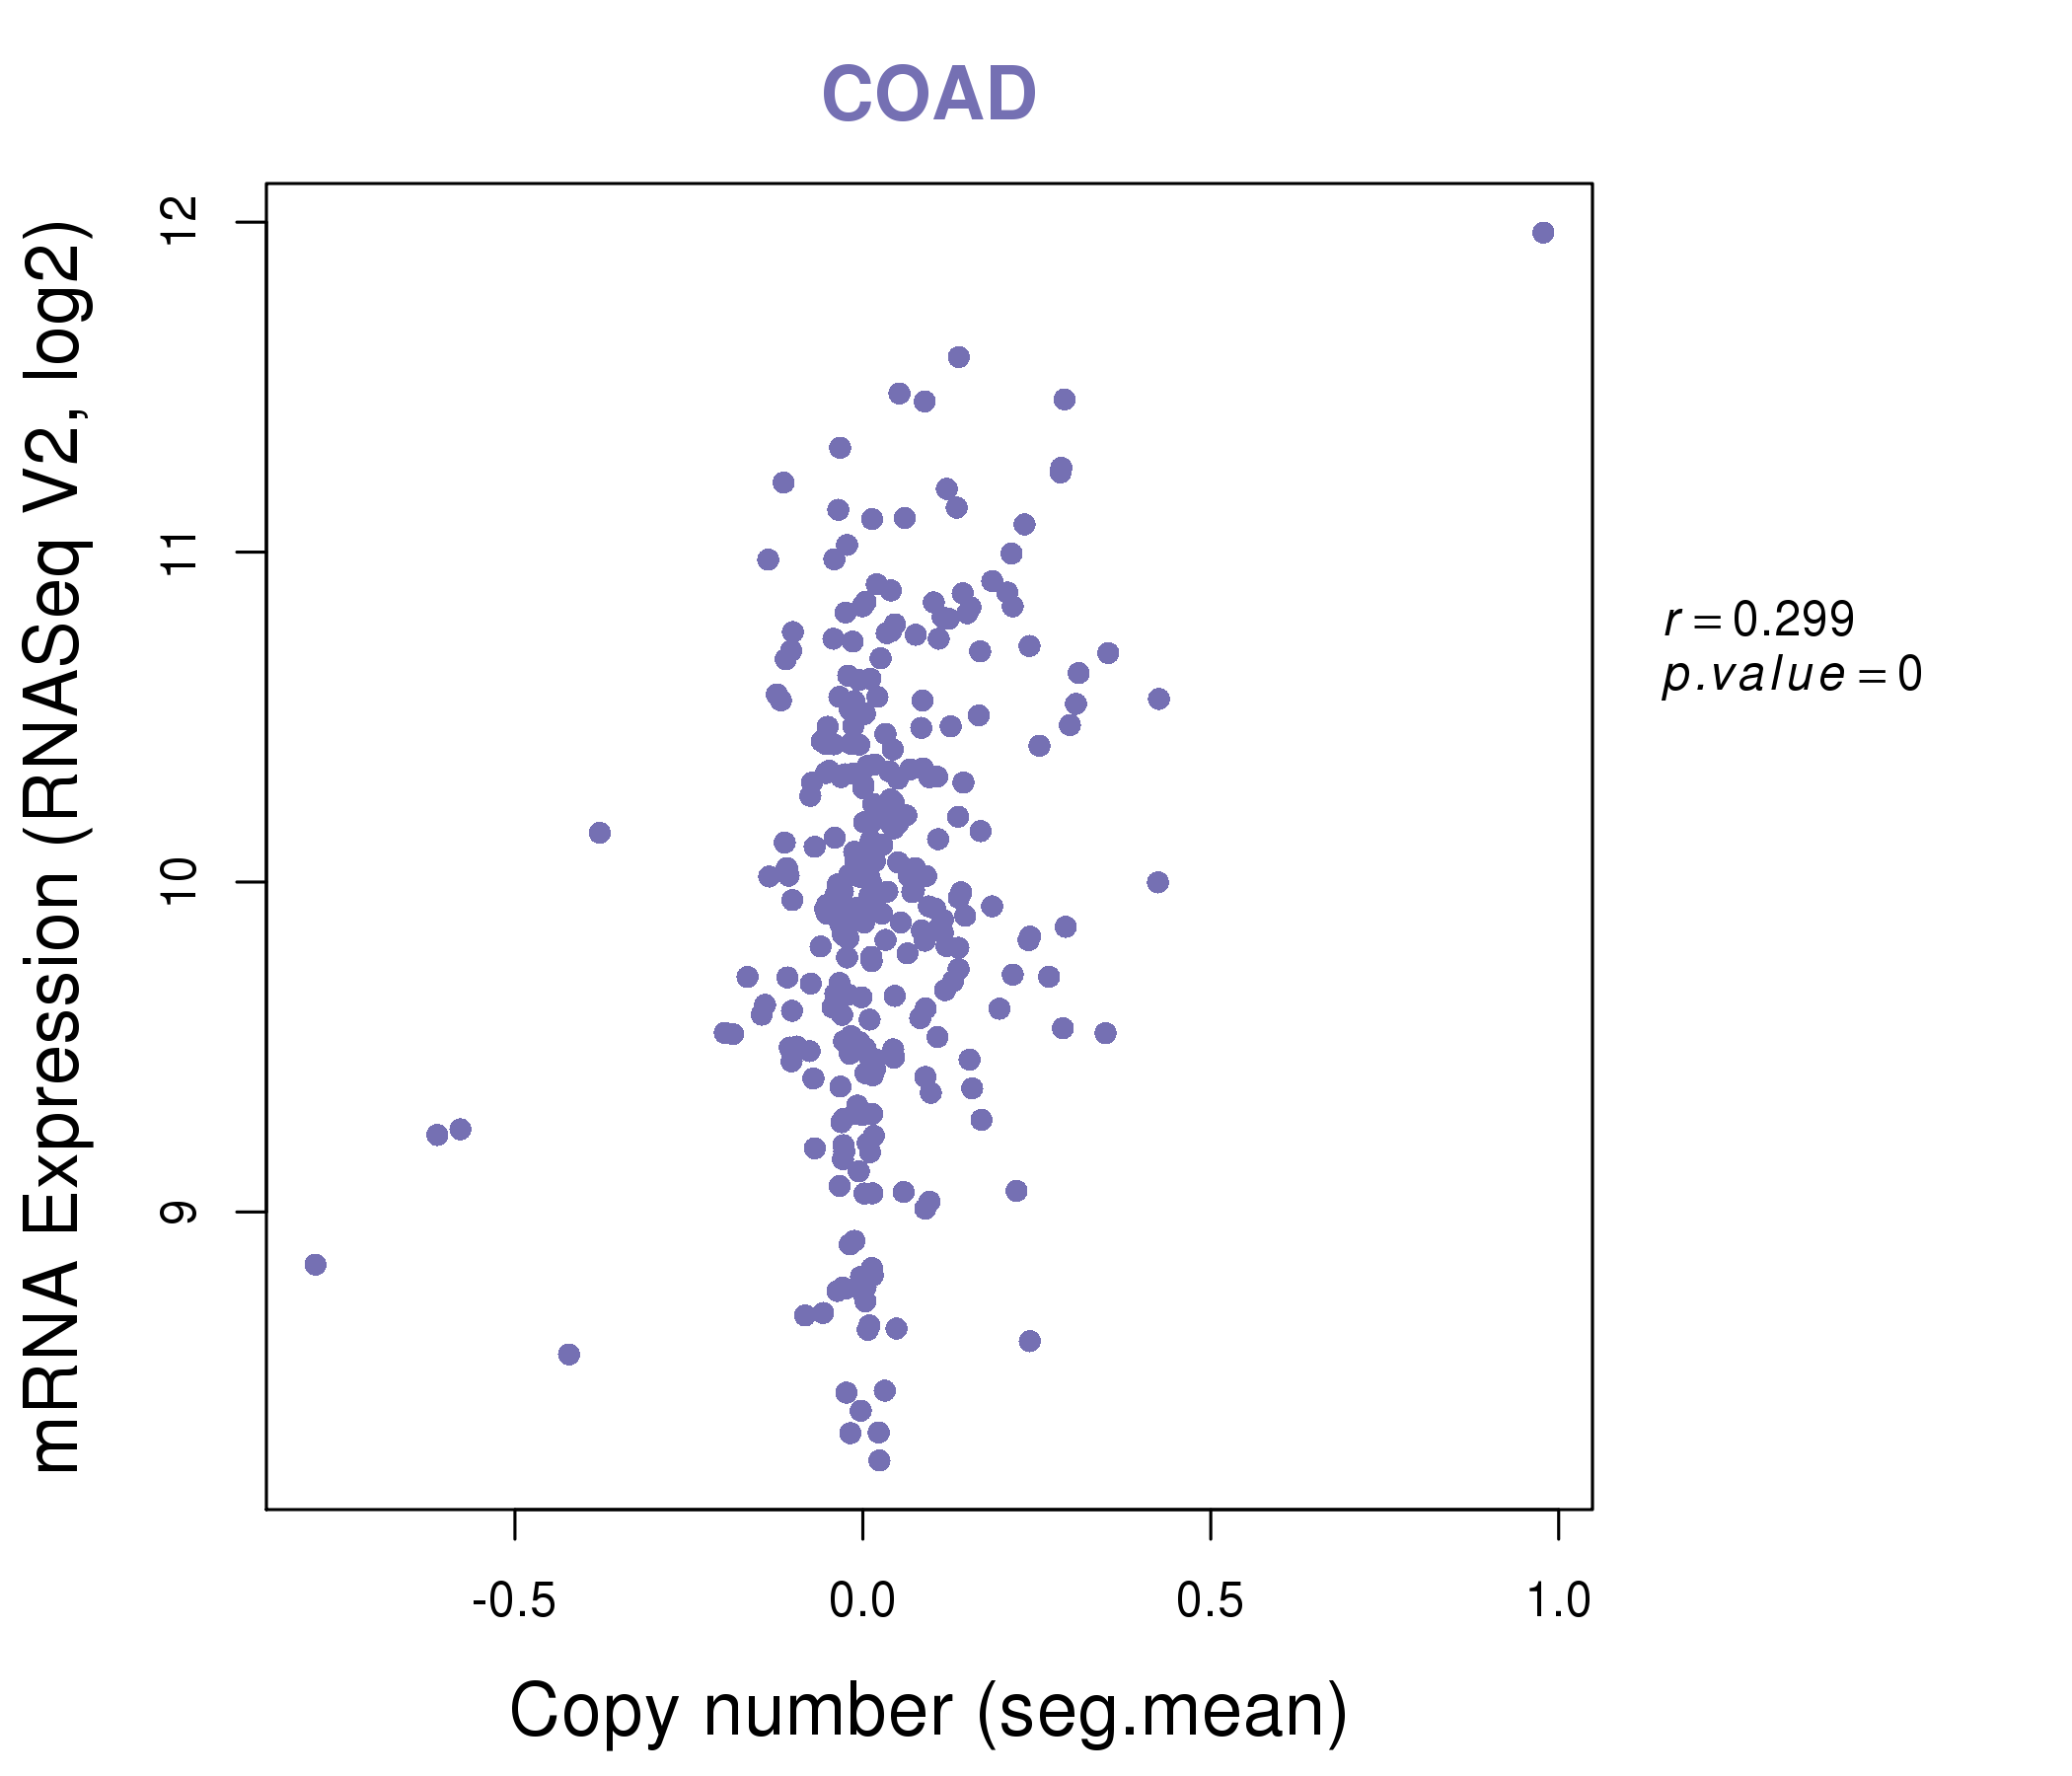
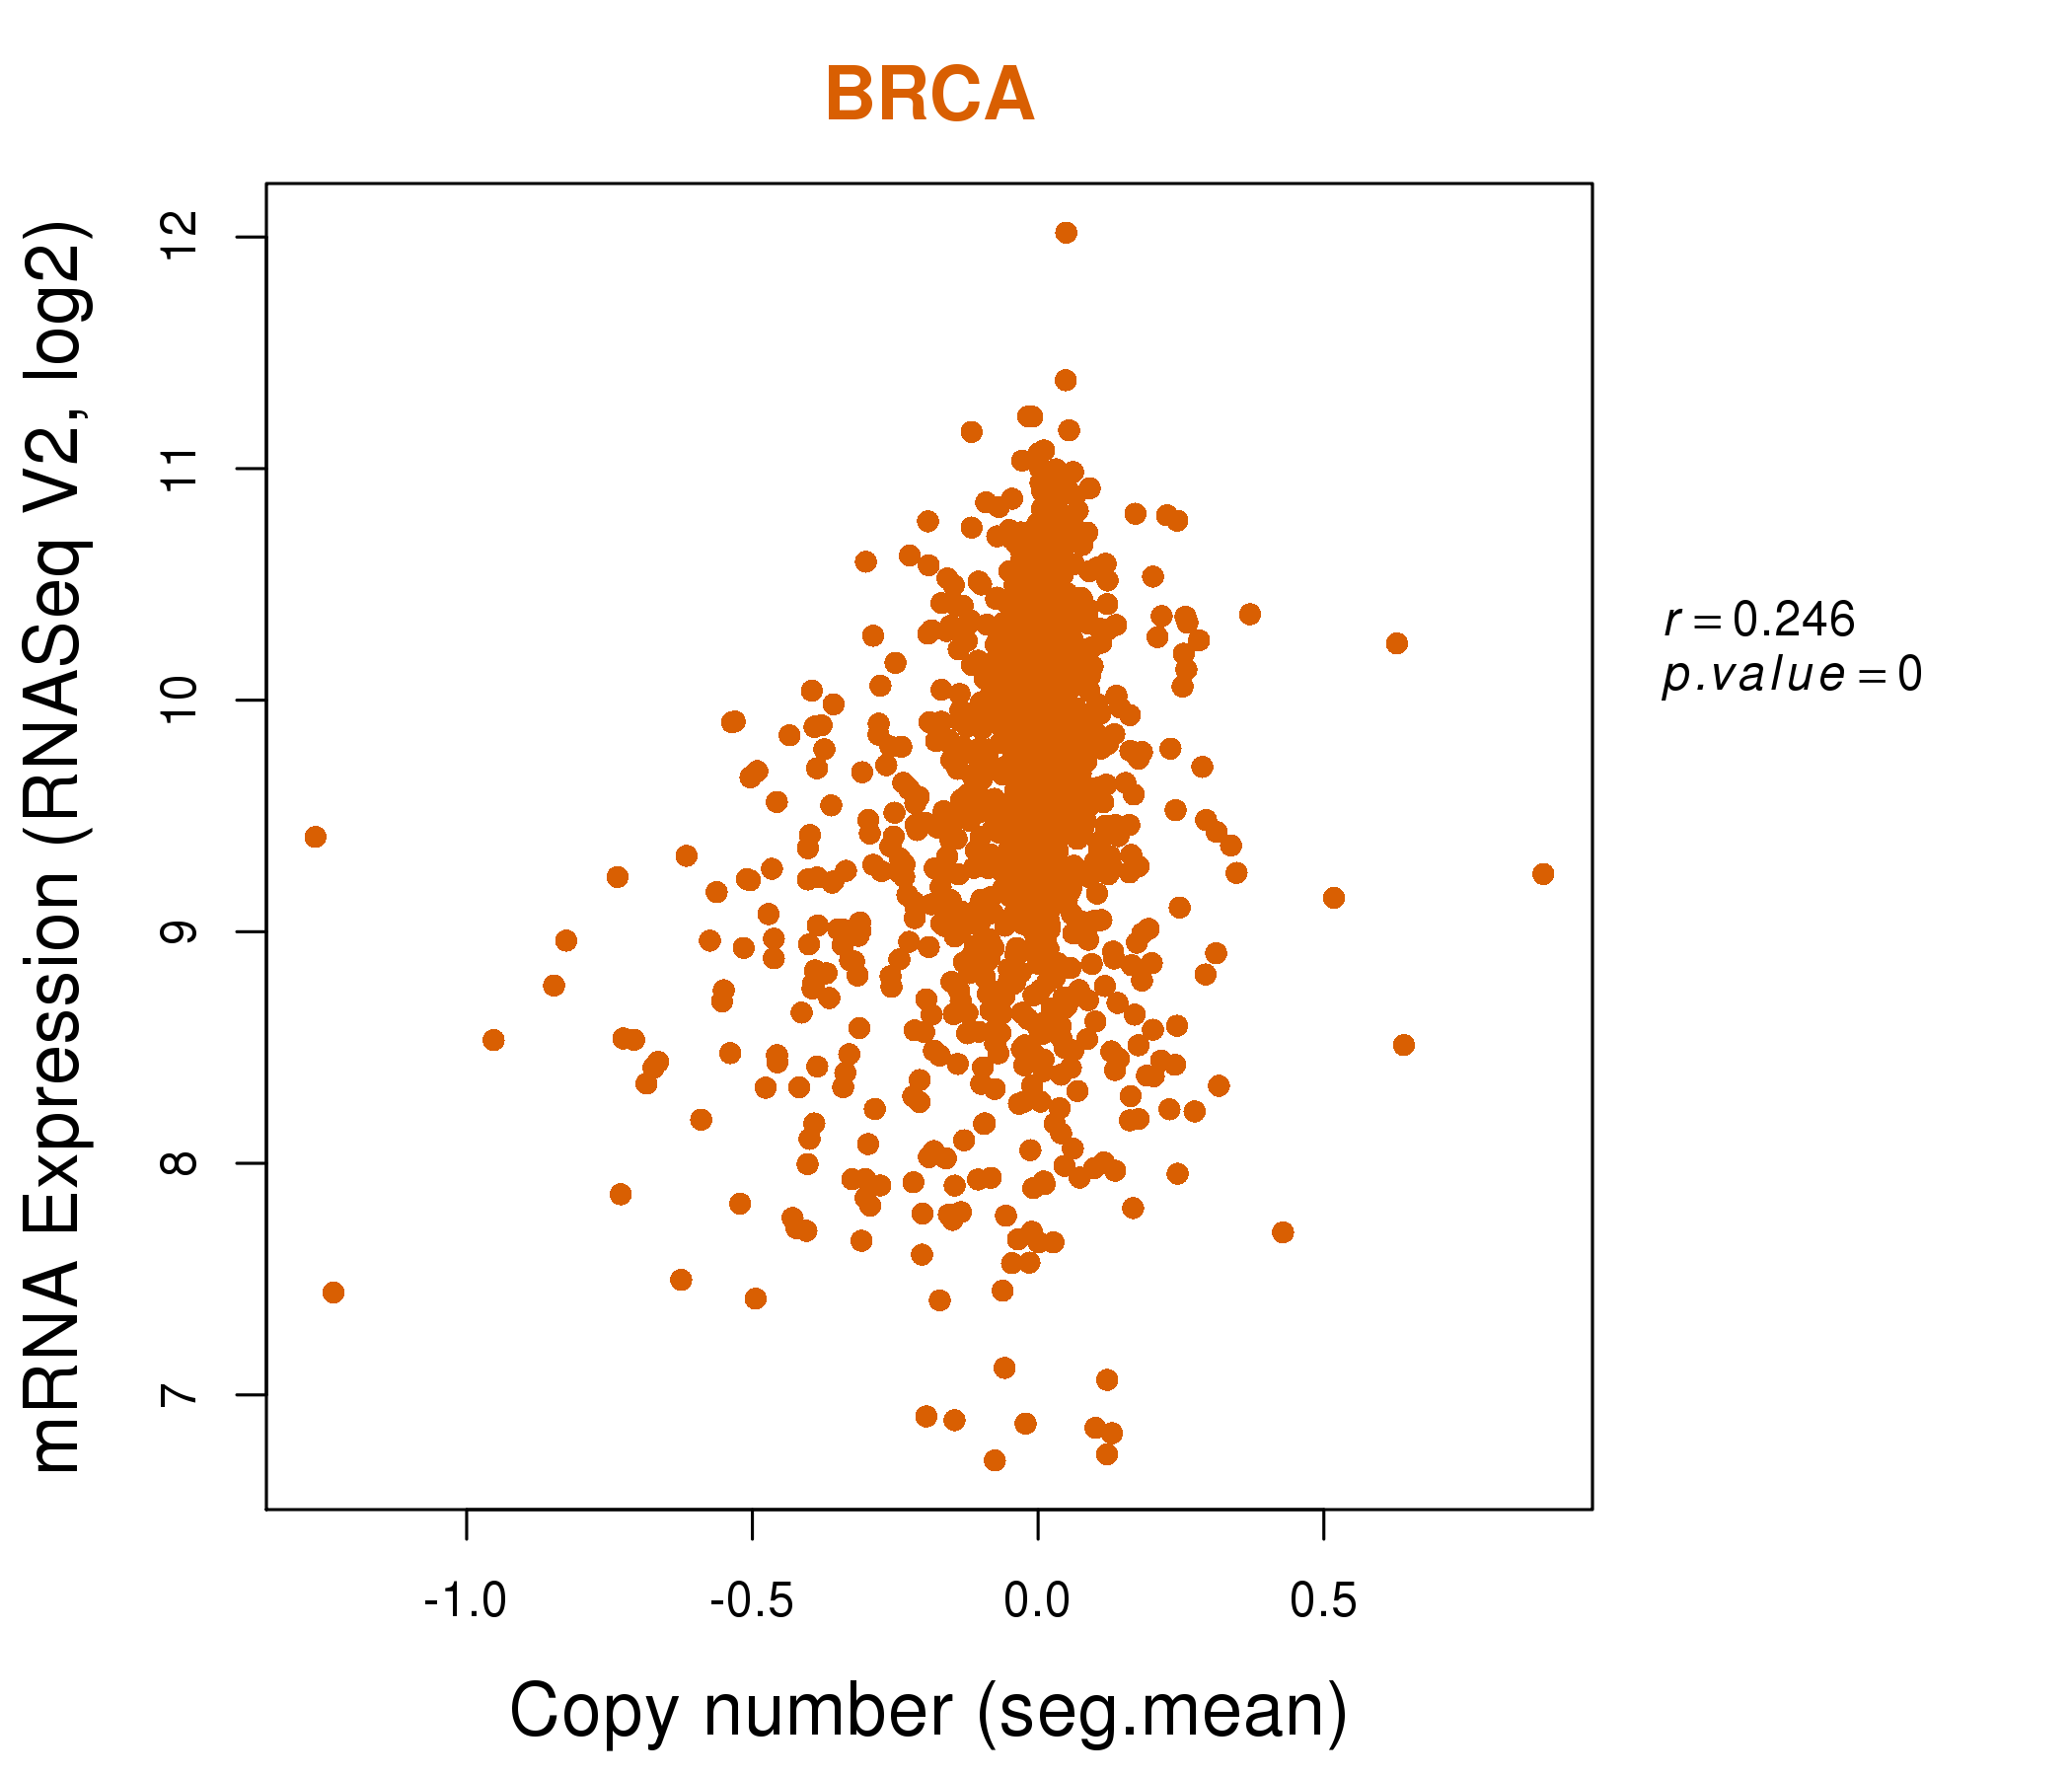
| * Normalized gene expression data of RNASeqV2 was extracted from TCGA using R package TCGA-Assembler. The URLs of all public data files on TCGA DCC data server were gathered at Jan-05-2015. Only eight cancer types have enough normal control samples for differential expression analysis. (t test, adjusted p<0.05 (using Benjamini-Hochberg FDR)) |
 |
| Top |
| * This plots show the correlation between CNV and gene expression. |
: Open all plots for all cancer types
 |
|
 |
|

| Top |
| Gene-Gene Network Information |
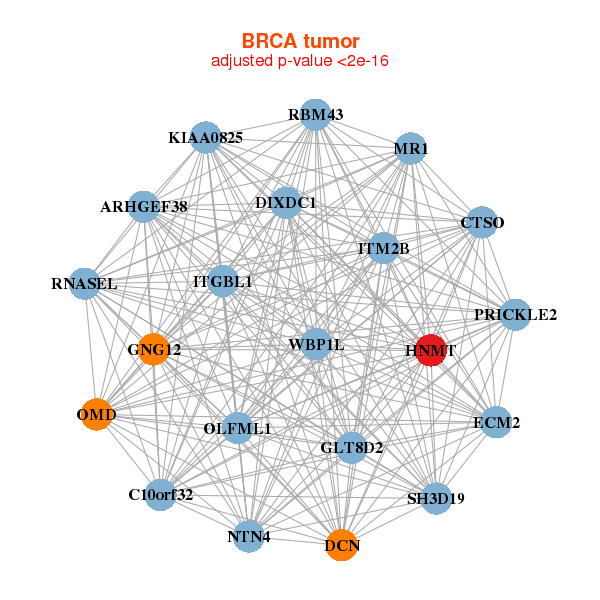
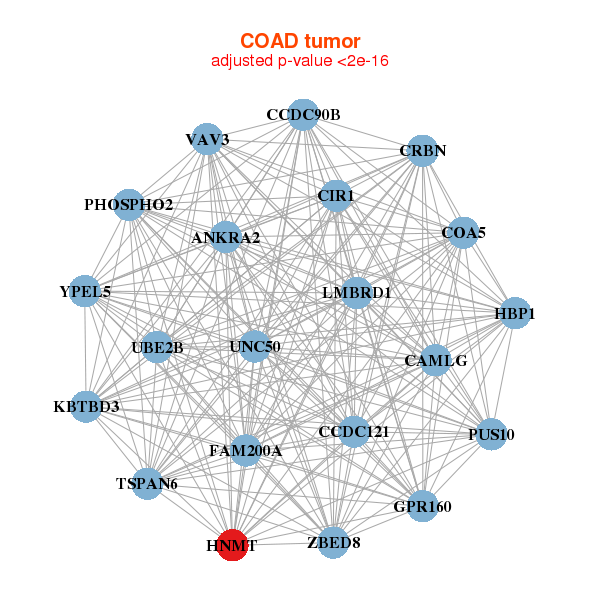
| * Co-Expression network figures were drawn using R package igraph. Only the top 20 genes with the highest correlations were shown. Red circle: input gene, orange circle: cell metabolism gene, sky circle: other gene |
: Open all plots for all cancer types
 |
| ||||
| ARHGEF38,WBP1L,C10orf32,KIAA0825,CTSO,DCN,DIXDC1, ECM2,GLT8D2,GNG12,HNMT,ITGBL1,ITM2B,MR1, NTN4,OLFML1,OMD,PRICKLE2,RBM43,RNASEL,SH3D19 | ASAH1,ASPH,TMEM230,CAV1,EBF1,ECM2,GPR34, GTDC1,HNMT,MBD2,MGST1,OSTM1,PALM2-AKAP2,PARVA, PDE8A,PGRMC2,RTN3,SEPT11,SH3D19,STX7,VAMP3 | ||||
 |
| ||||
| ANKRA2,COA5,ZBED8,CAMLG,CCDC121,CCDC90B,CIR1, CRBN,FAM200A,GPR160,HBP1,HNMT,KBTBD3,LMBRD1, PHOSPHO2,PUS10,TSPAN6,UBE2B,UNC50,VAV3,YPEL5 | SMIM7,TMEM230,CLNS1A,DPH5,DUSP11,HNMT,IAH1, LIAS,LYRM7,MRPL15,MRPL45,MRPS33,NDUFB5,NUDCD2, RPL34,RPS8,RPSA,SDHD,TATDN1,TMEM69,ZNF627 |
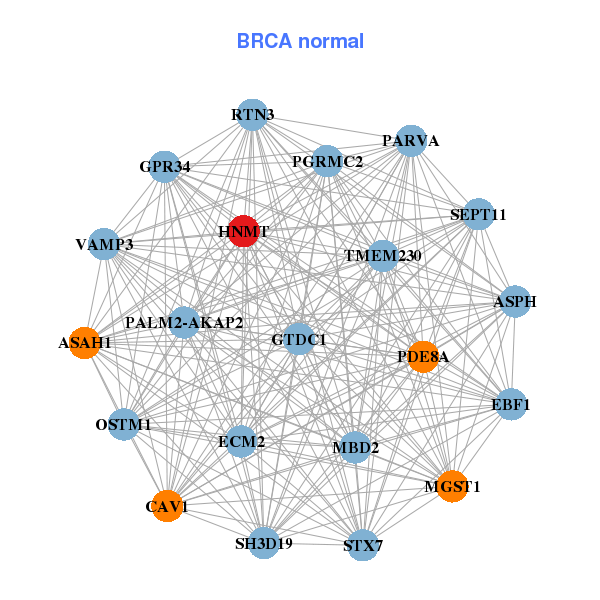

| * Co-Expression network figures were drawn using R package igraph. Only the top 20 genes with the highest correlations were shown. Red circle: input gene, orange circle: cell metabolism gene, sky circle: other gene |
: Open all plots for all cancer types
| Top |
: Open all interacting genes' information including KEGG pathway for all interacting genes from DAVID
| Top |
| Pharmacological Information for HNMT |
| DB Category | DB Name | DB's ID and Url link |
| Chemistry | BindingDB | P50135; -. |
| Chemistry | ChEMBL | CHEMBL2190; -. |
| Organism-specific databases | PharmGKB | PA190; -. |
| Organism-specific databases | CTD | 3176; -. |
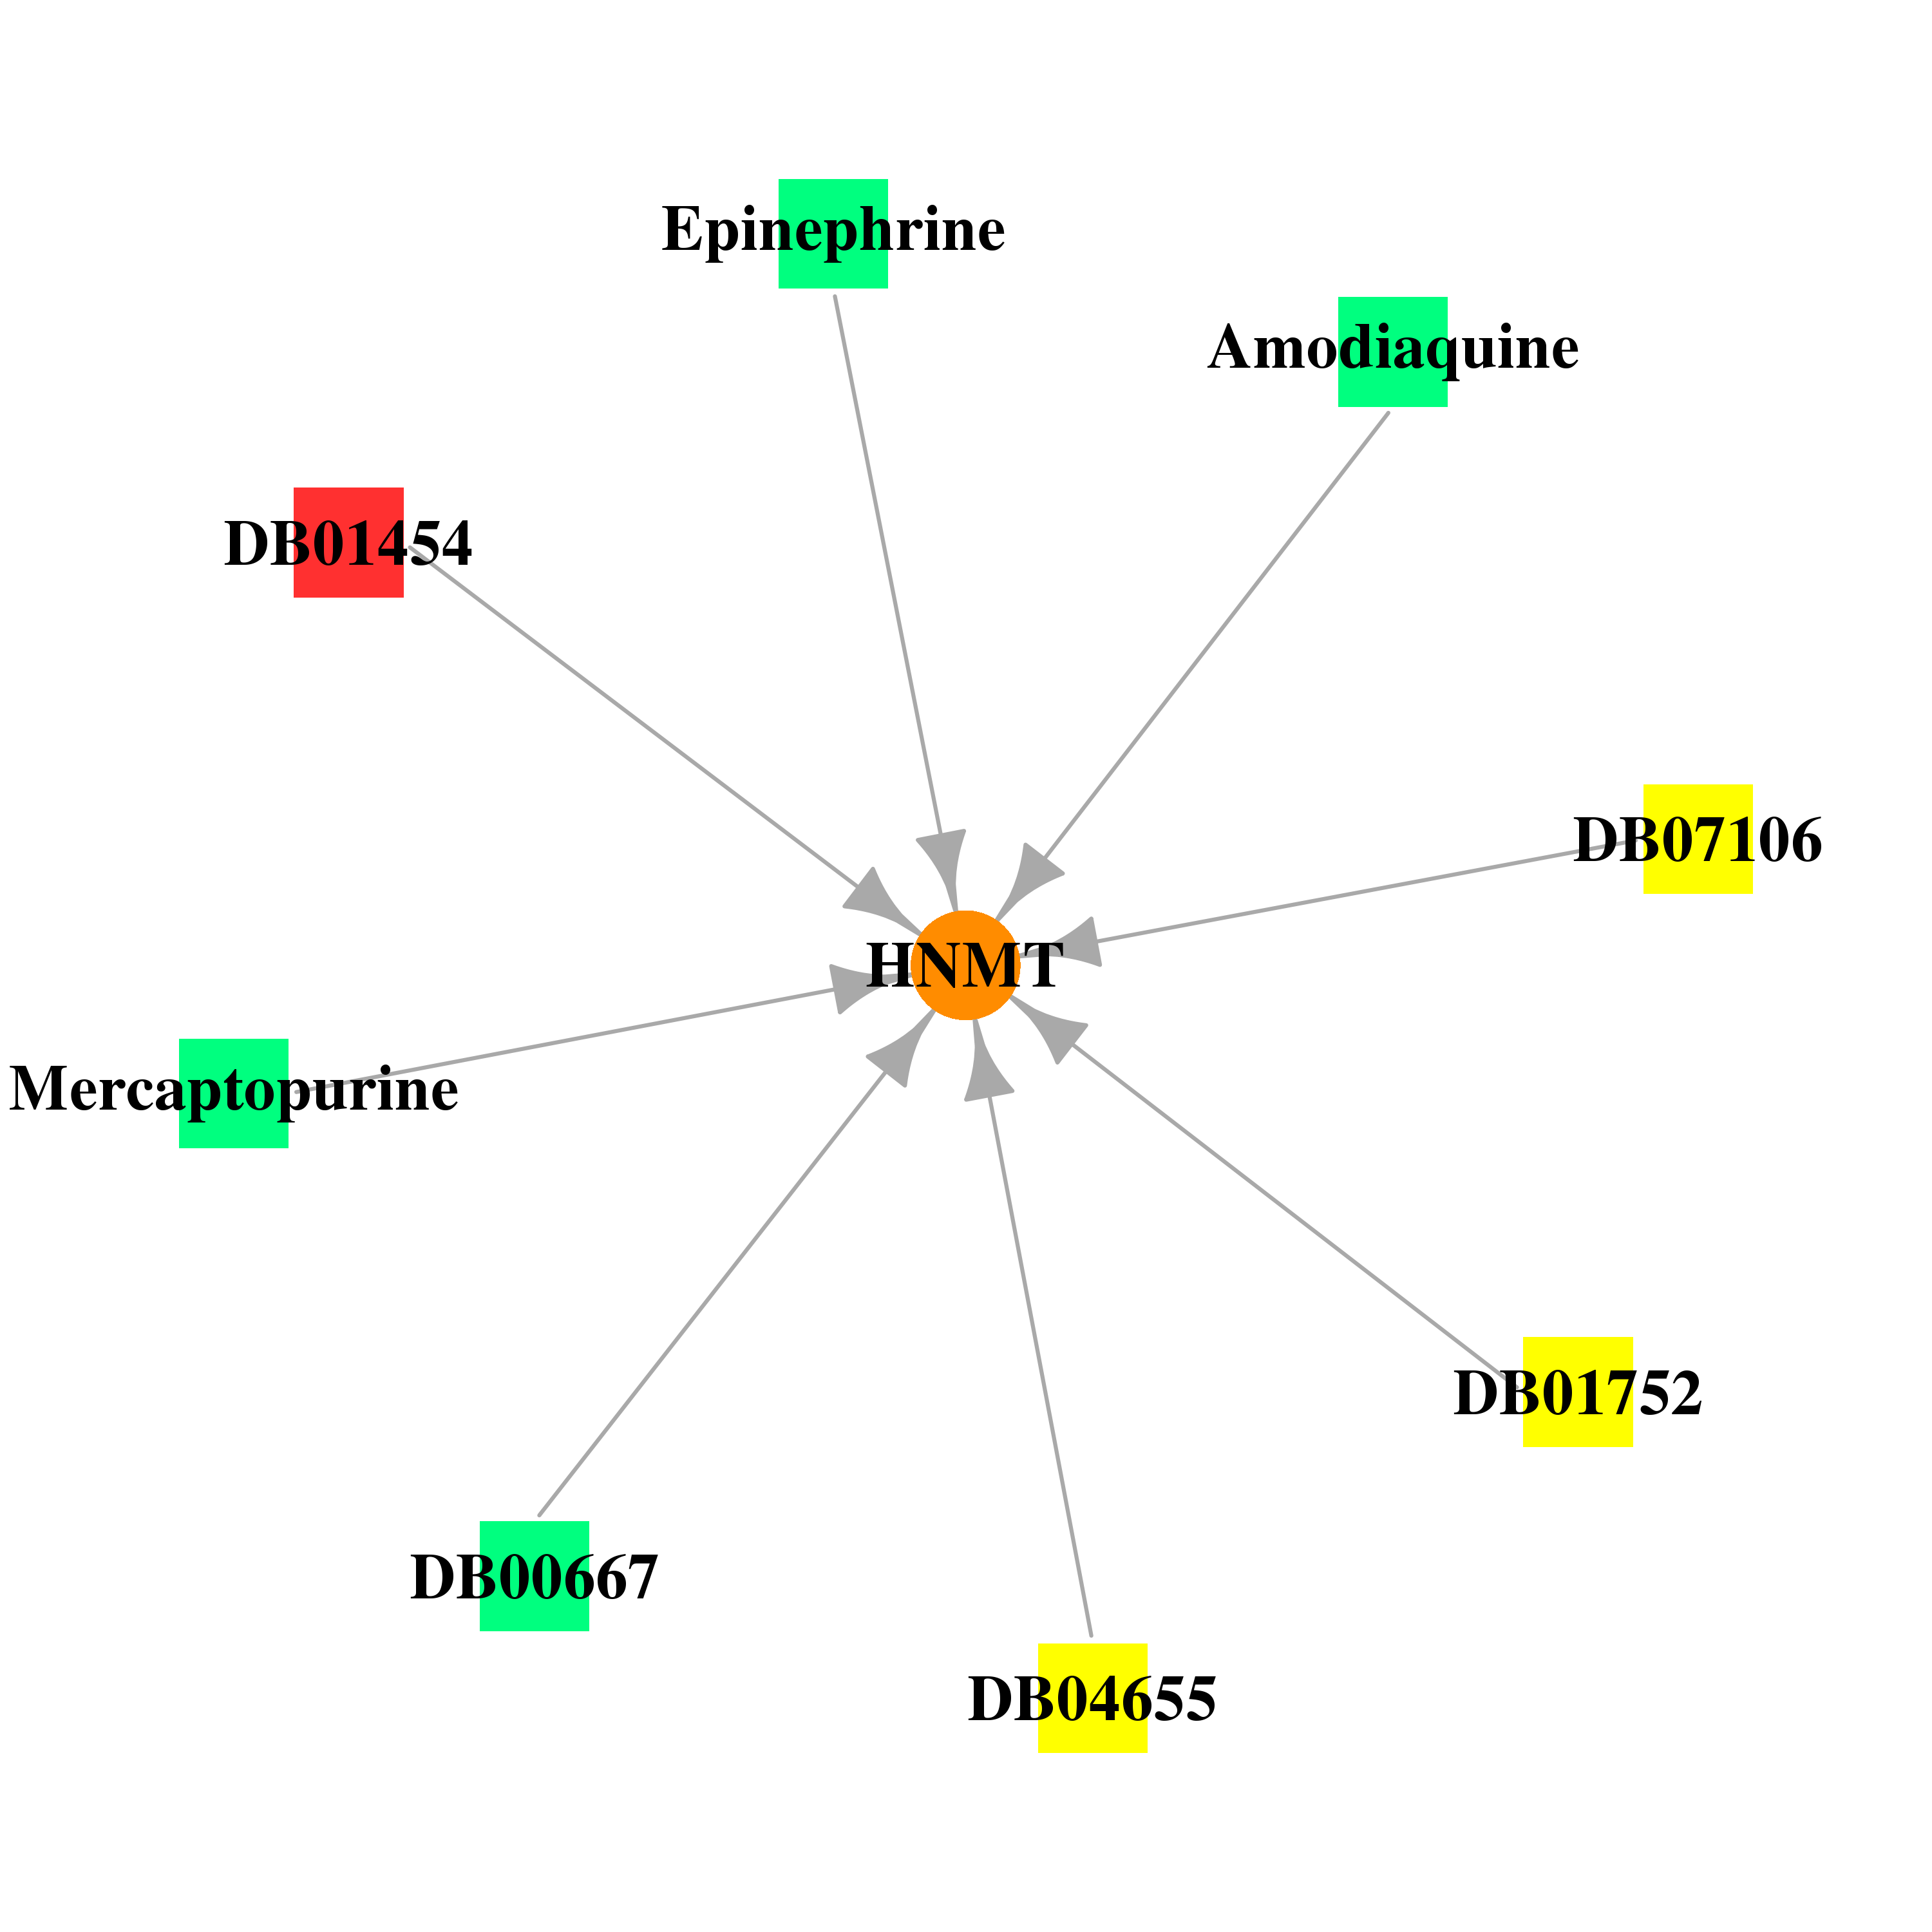
| * Gene Centered Interaction Network. |
 |
| * Drug Centered Interaction Network. |
| DrugBank ID | Target Name | Drug Groups | Generic Name | Drug Centered Network | Drug Structure |
| DB00613 | histamine N-methyltransferase | approved | Amodiaquine | 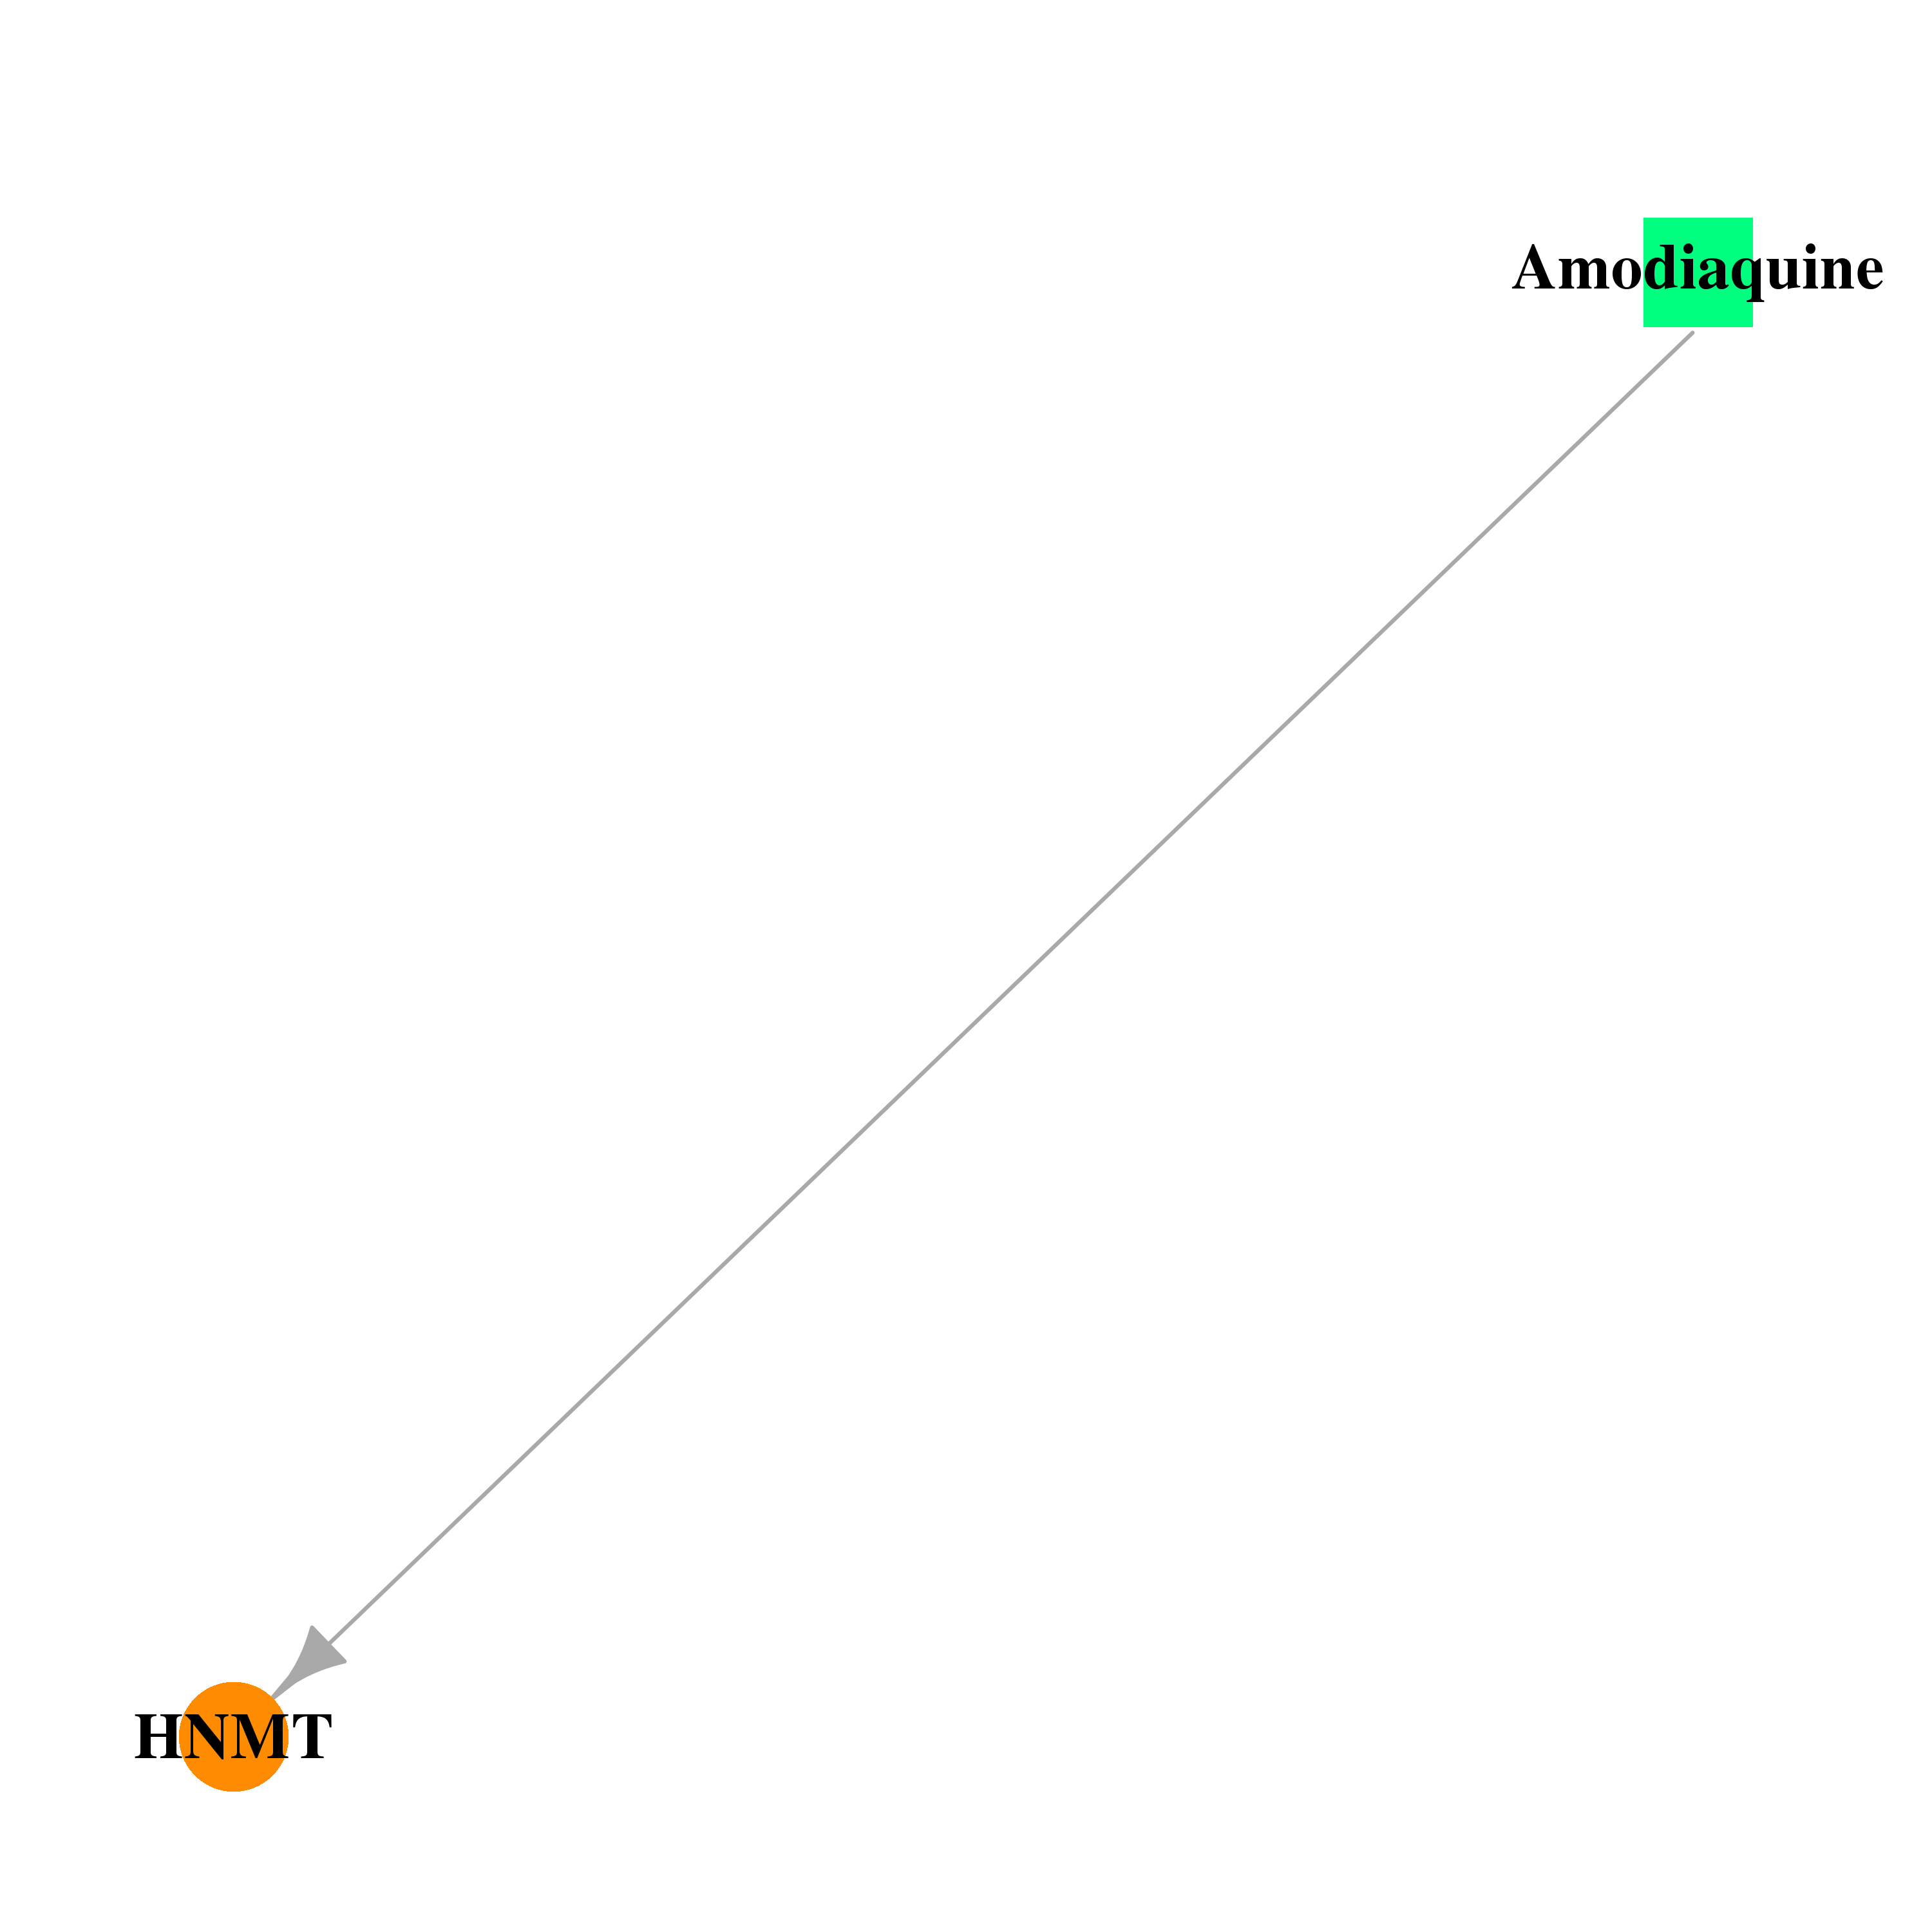 | 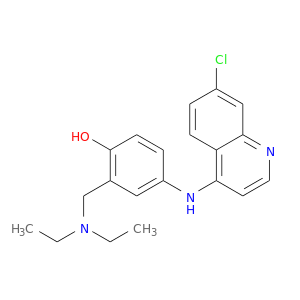 |
| DB01752 | histamine N-methyltransferase | experimental | S-Adenosyl-L-Homocysteine |  | 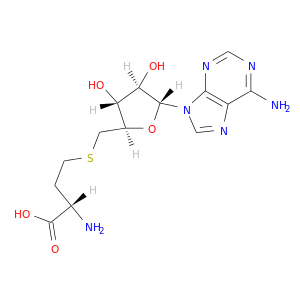 |
| DB04655 | histamine N-methyltransferase | experimental | METOPRINE, METHODICHLOROPHEN | 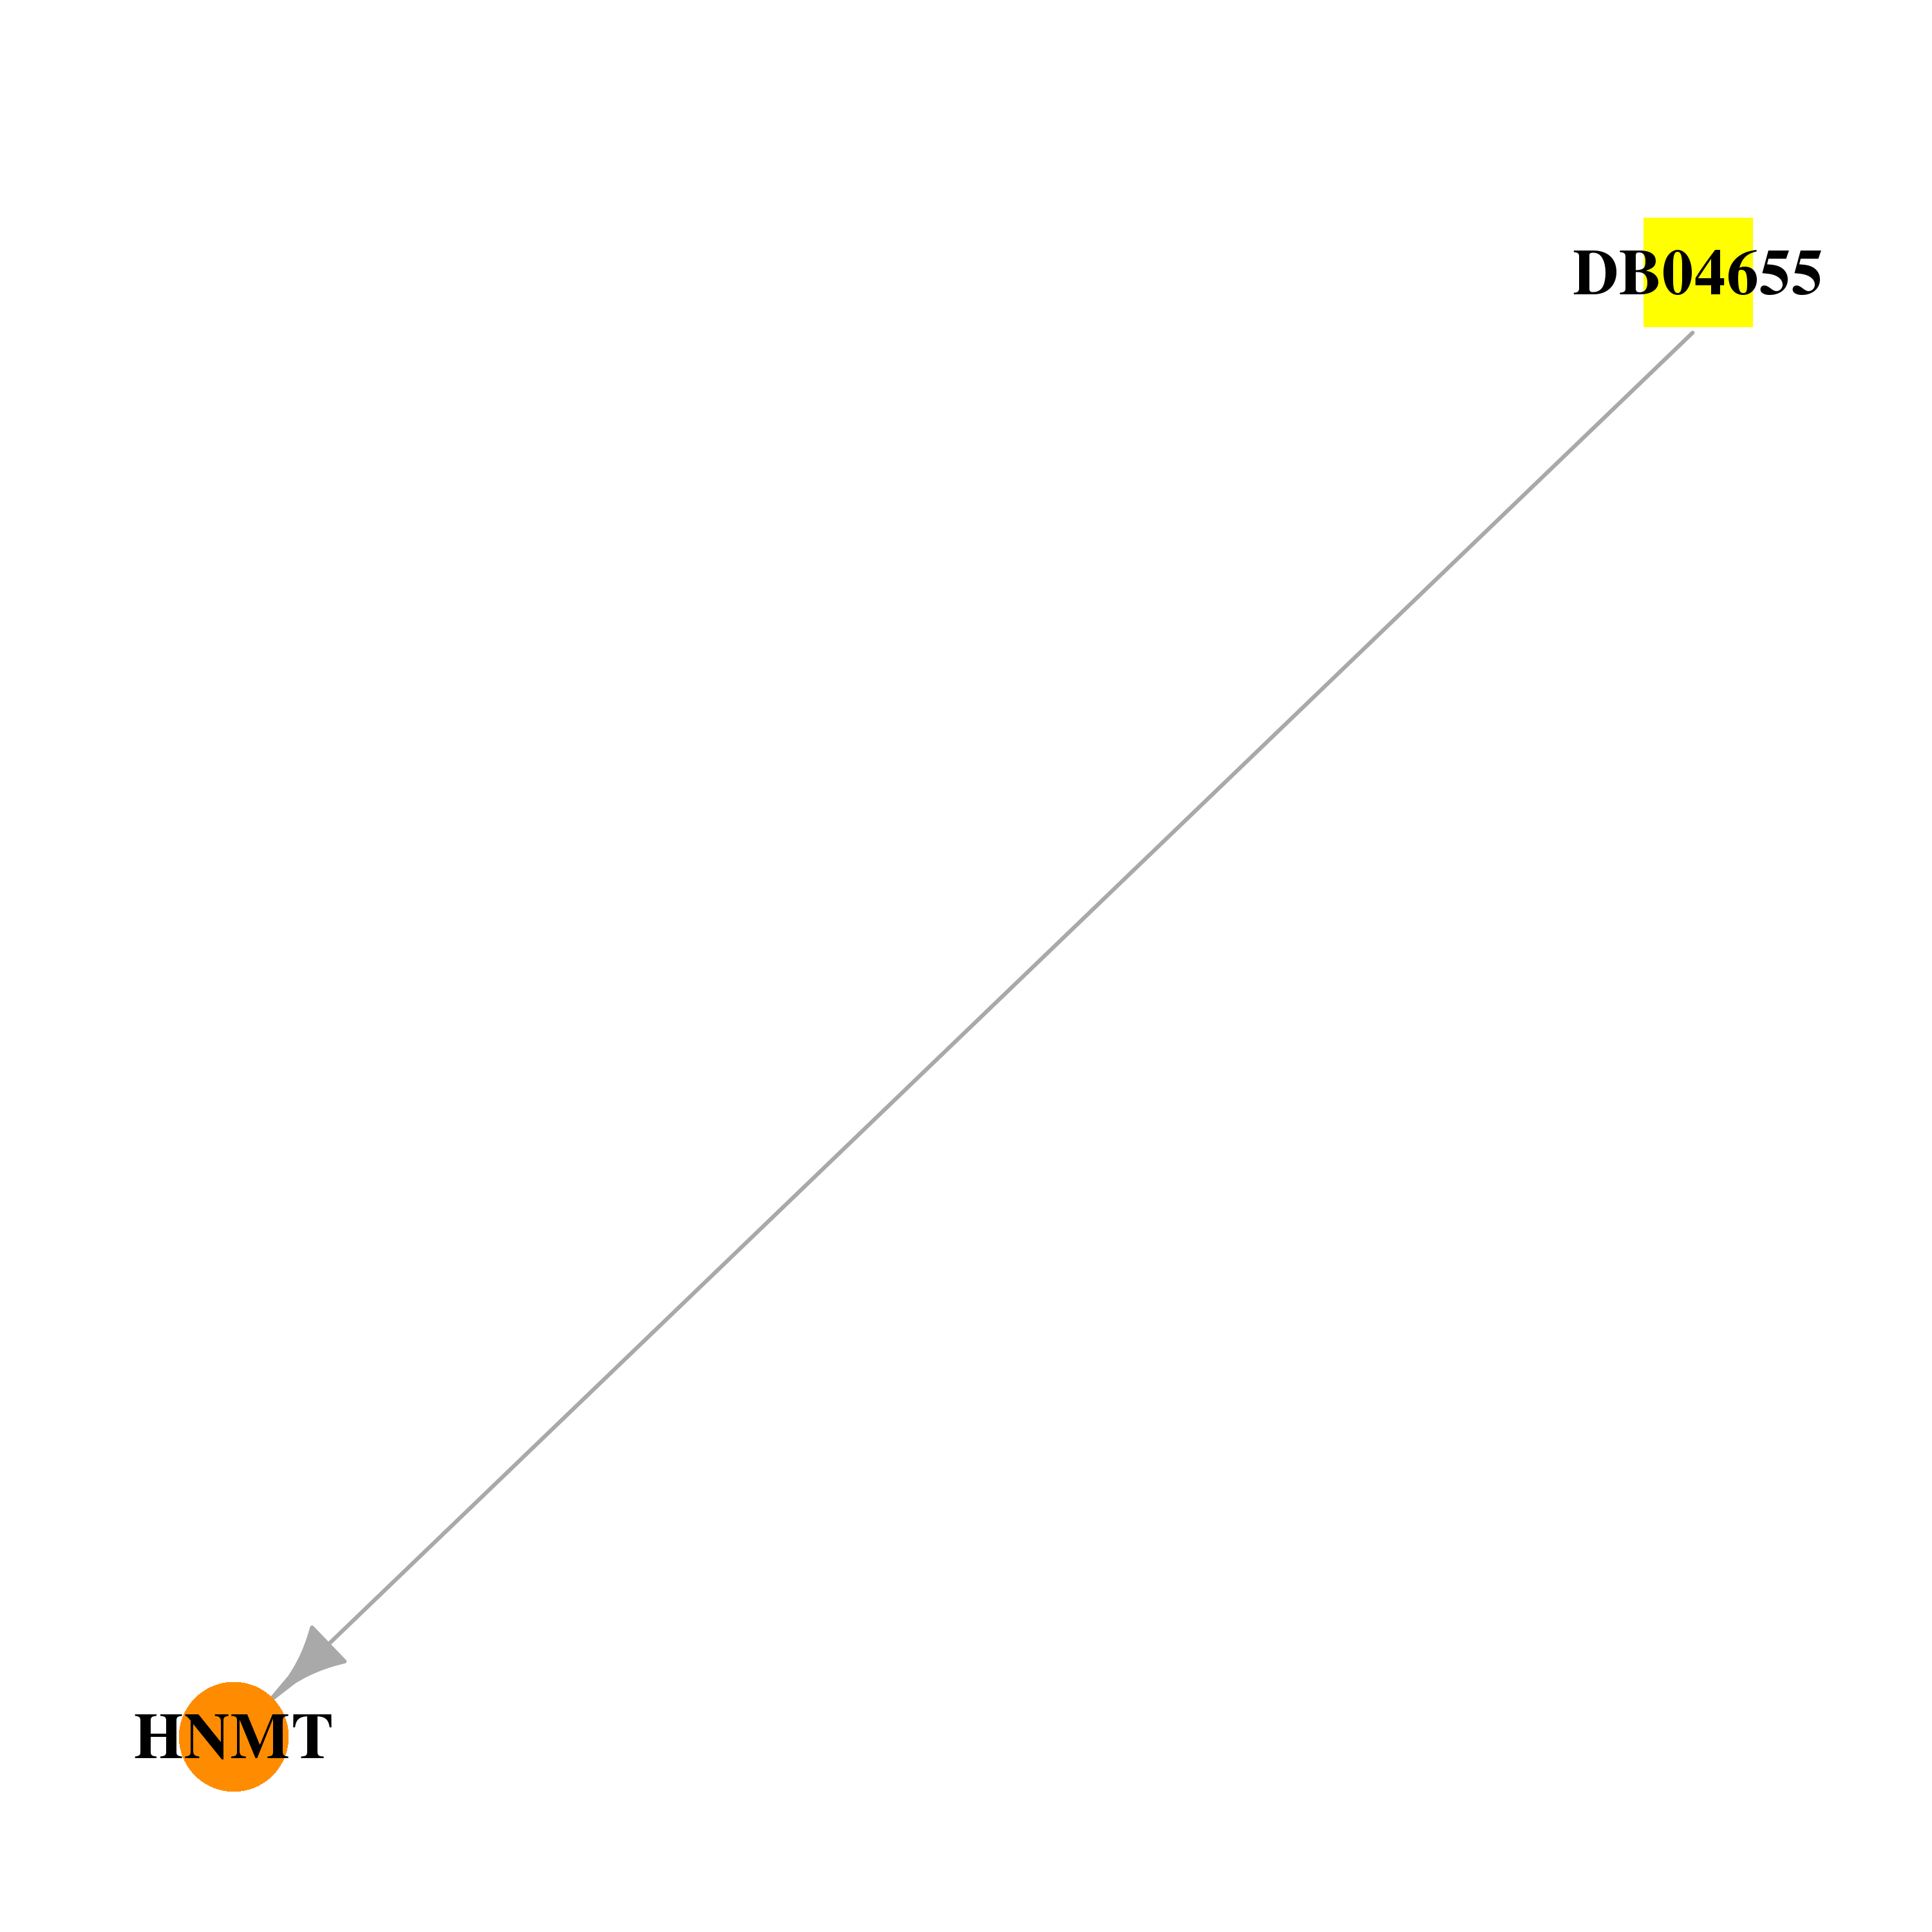 | 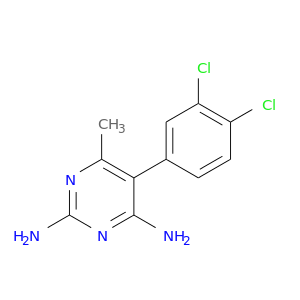 |
| DB07106 | histamine N-methyltransferase | experimental | 4-(DIMETHYLAMINO)BUTYL IMIDOTHIOCARBAMATE | 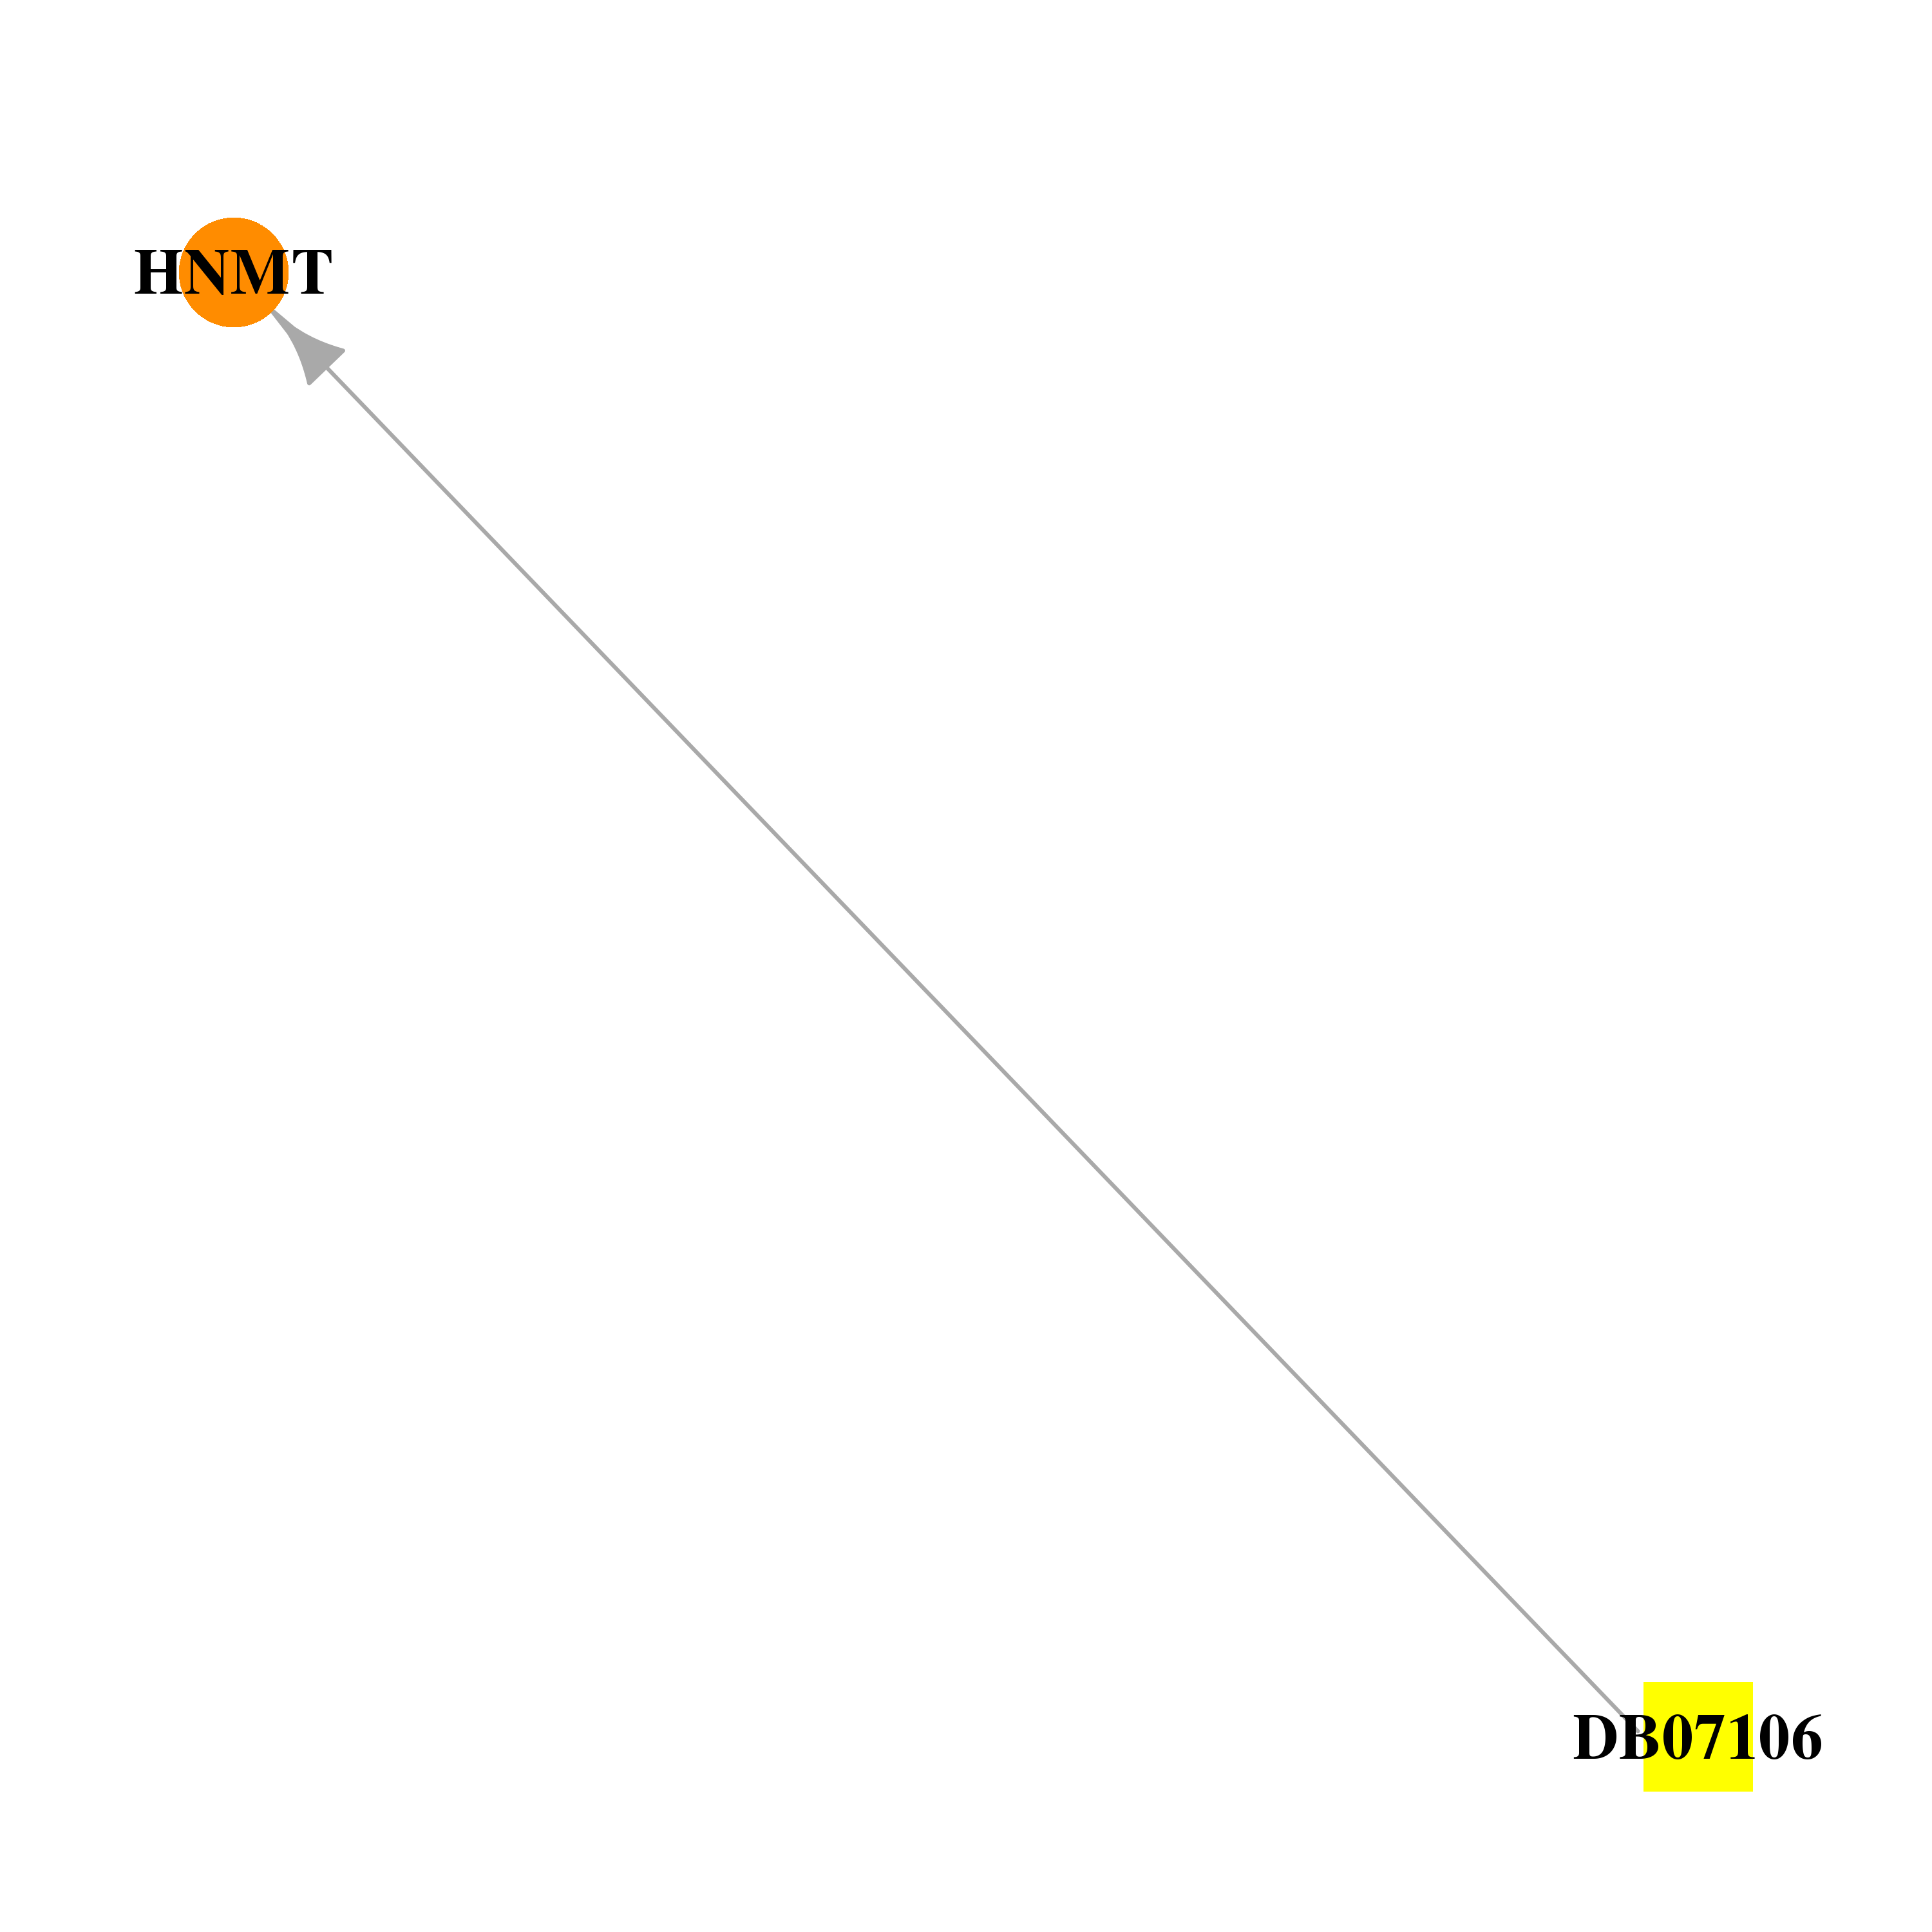 | 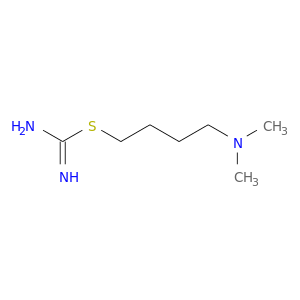 |
| DB01454 | histamine N-methyltransferase | illicit; experimental | 3,4-Methylenedioxymethamphetamine | 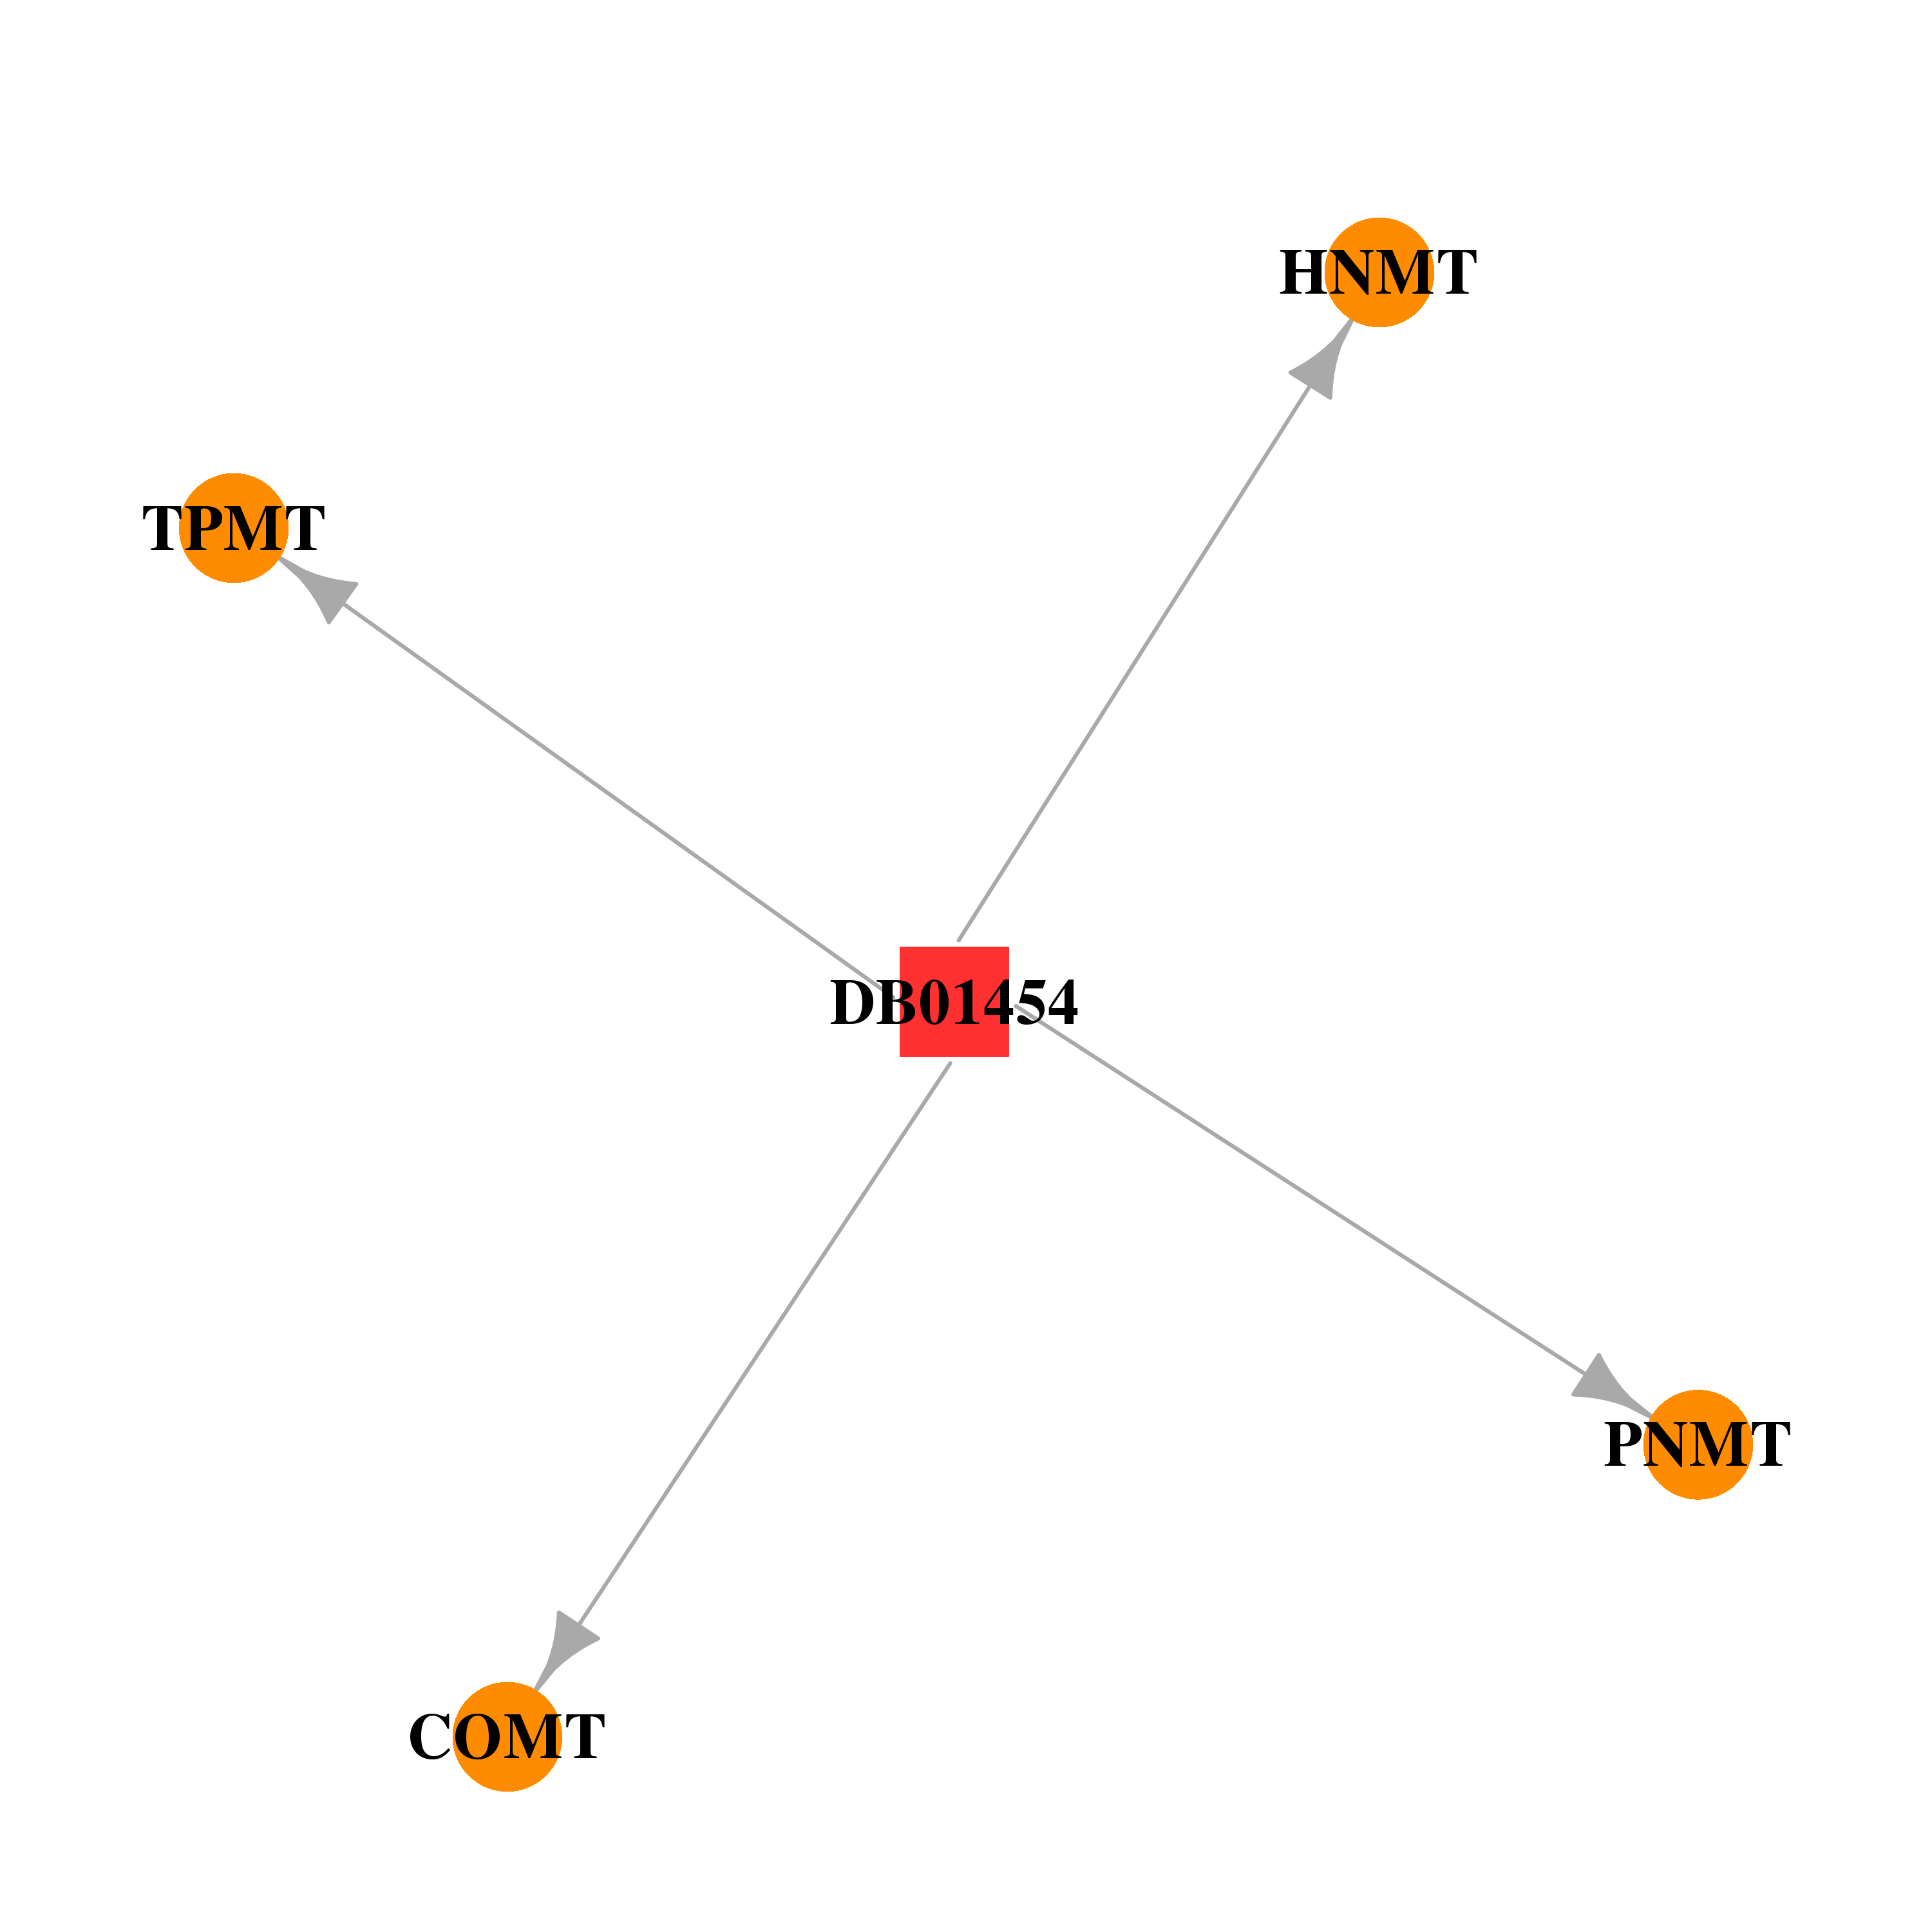 | 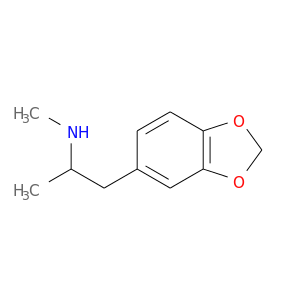 |
| DB00668 | histamine N-methyltransferase | approved | Epinephrine | 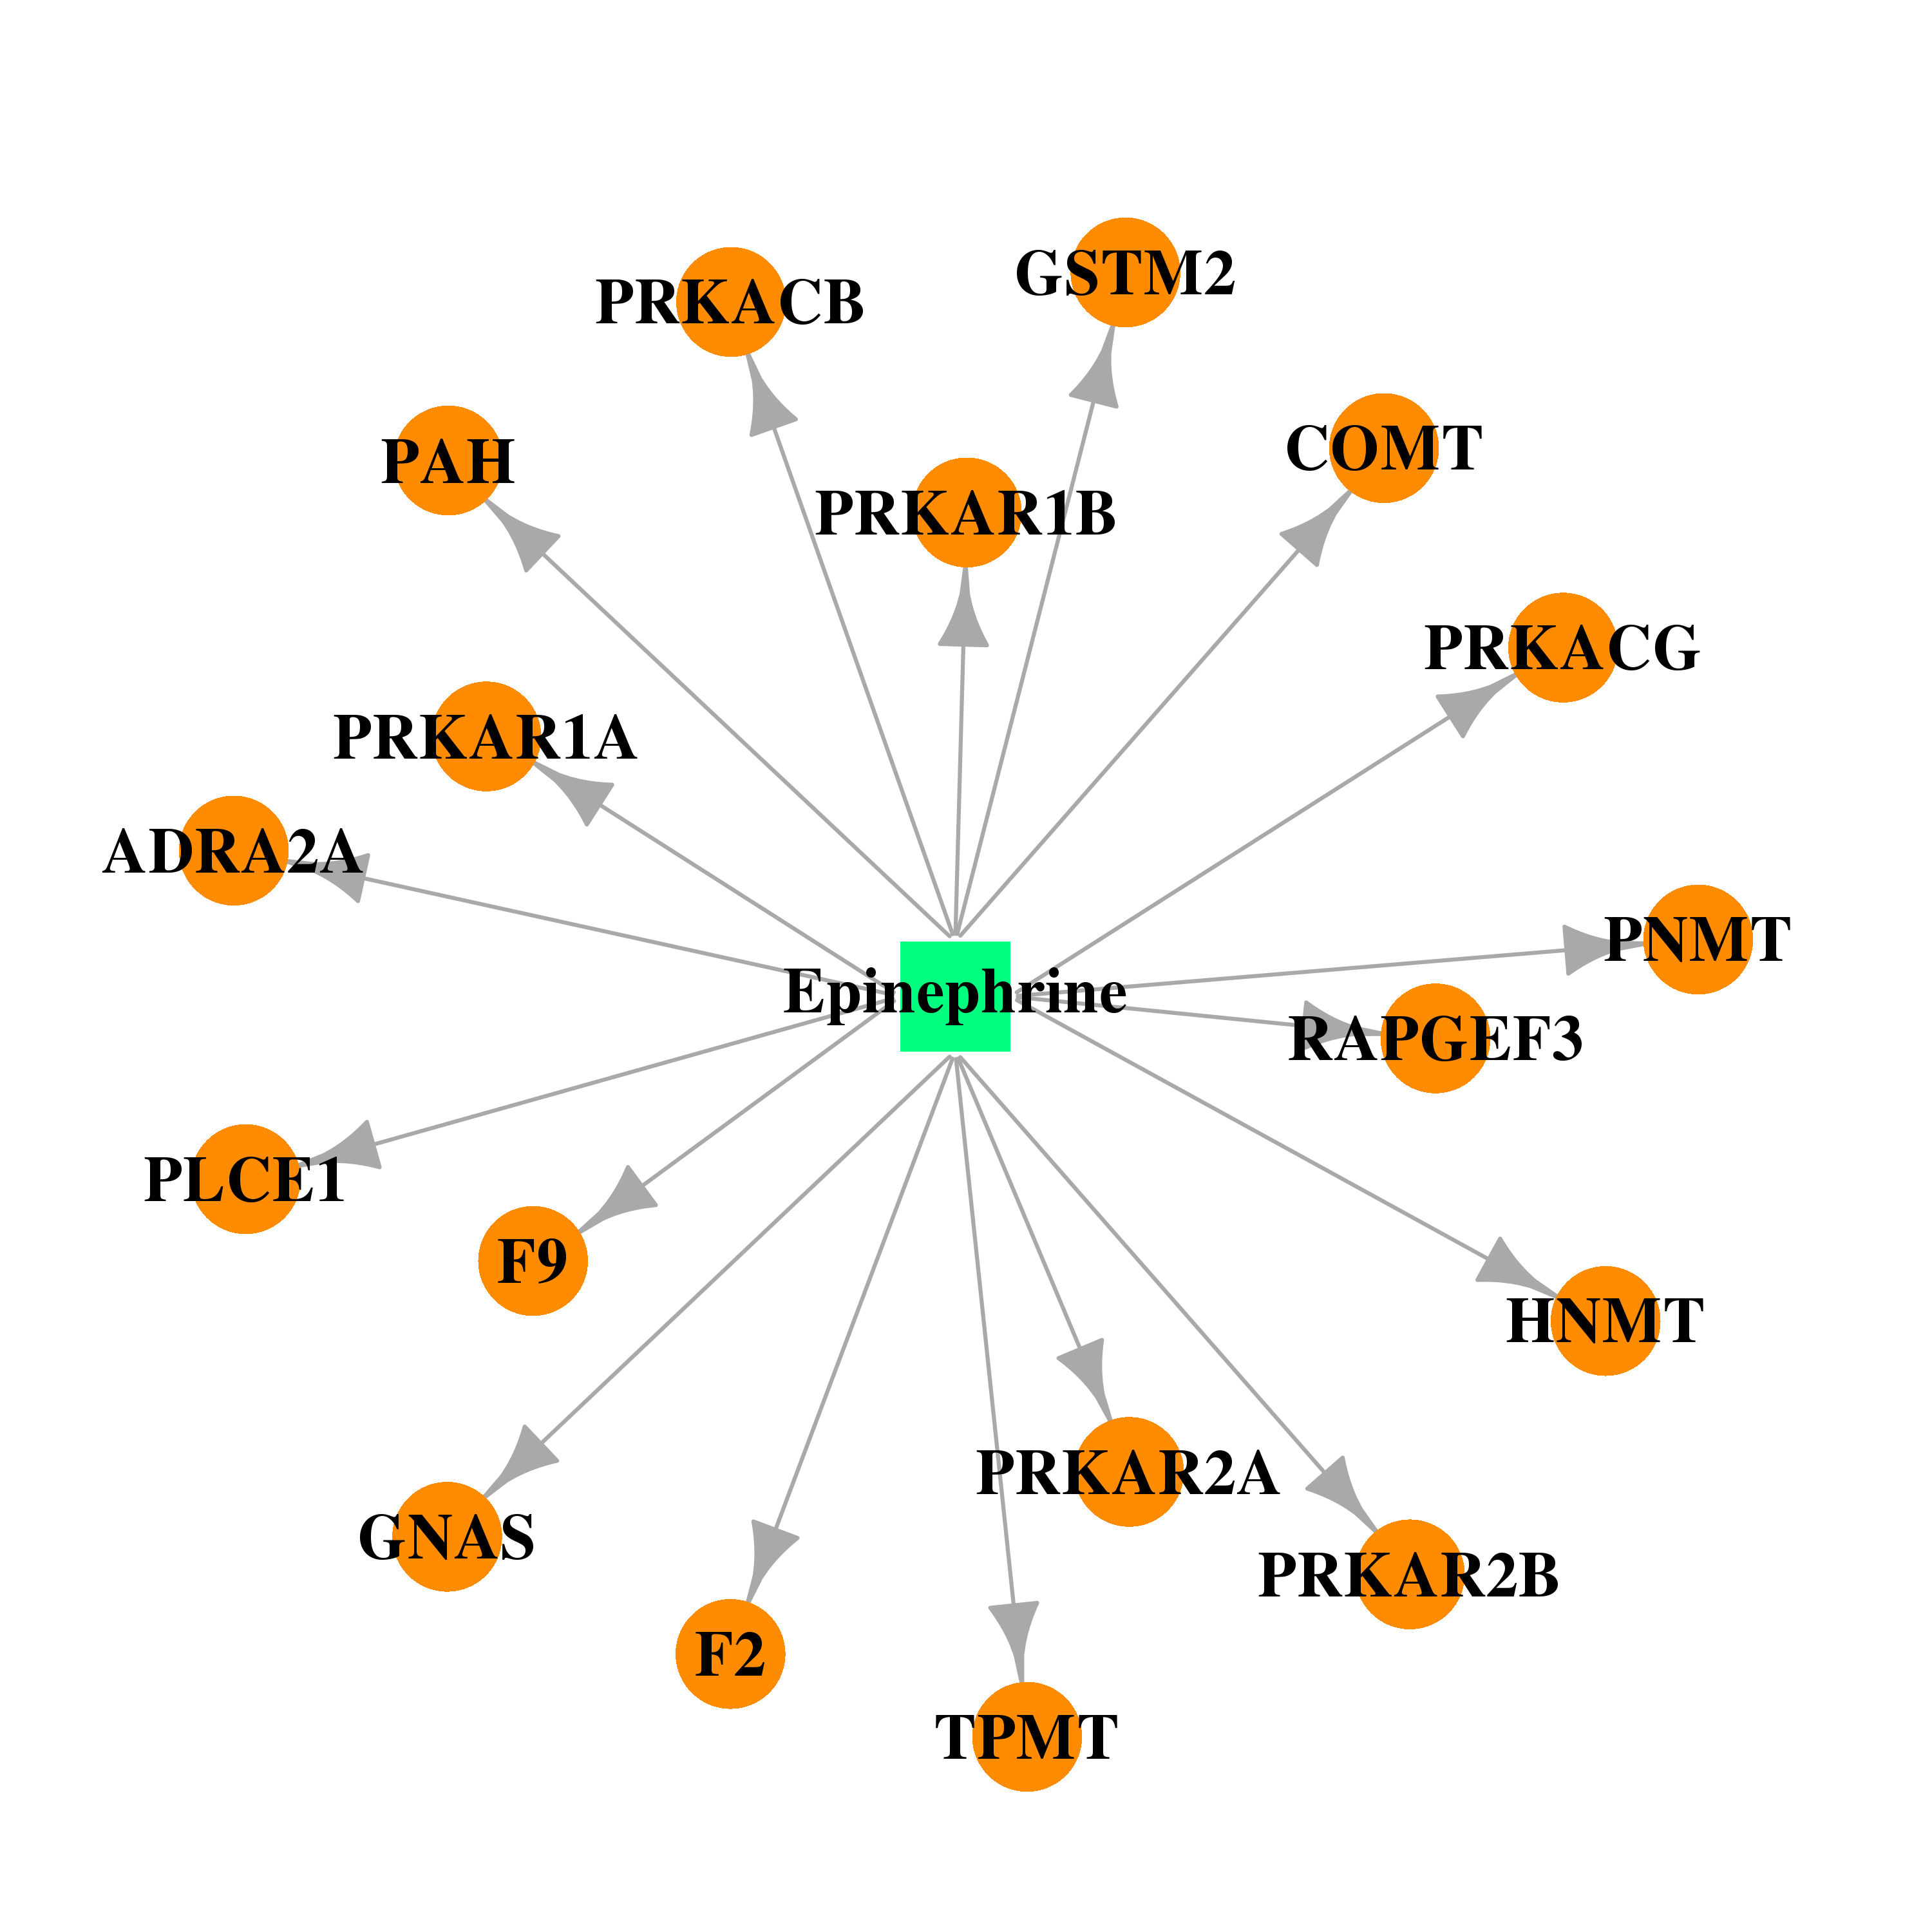 |  |
| DB01033 | histamine N-methyltransferase | approved | Mercaptopurine | 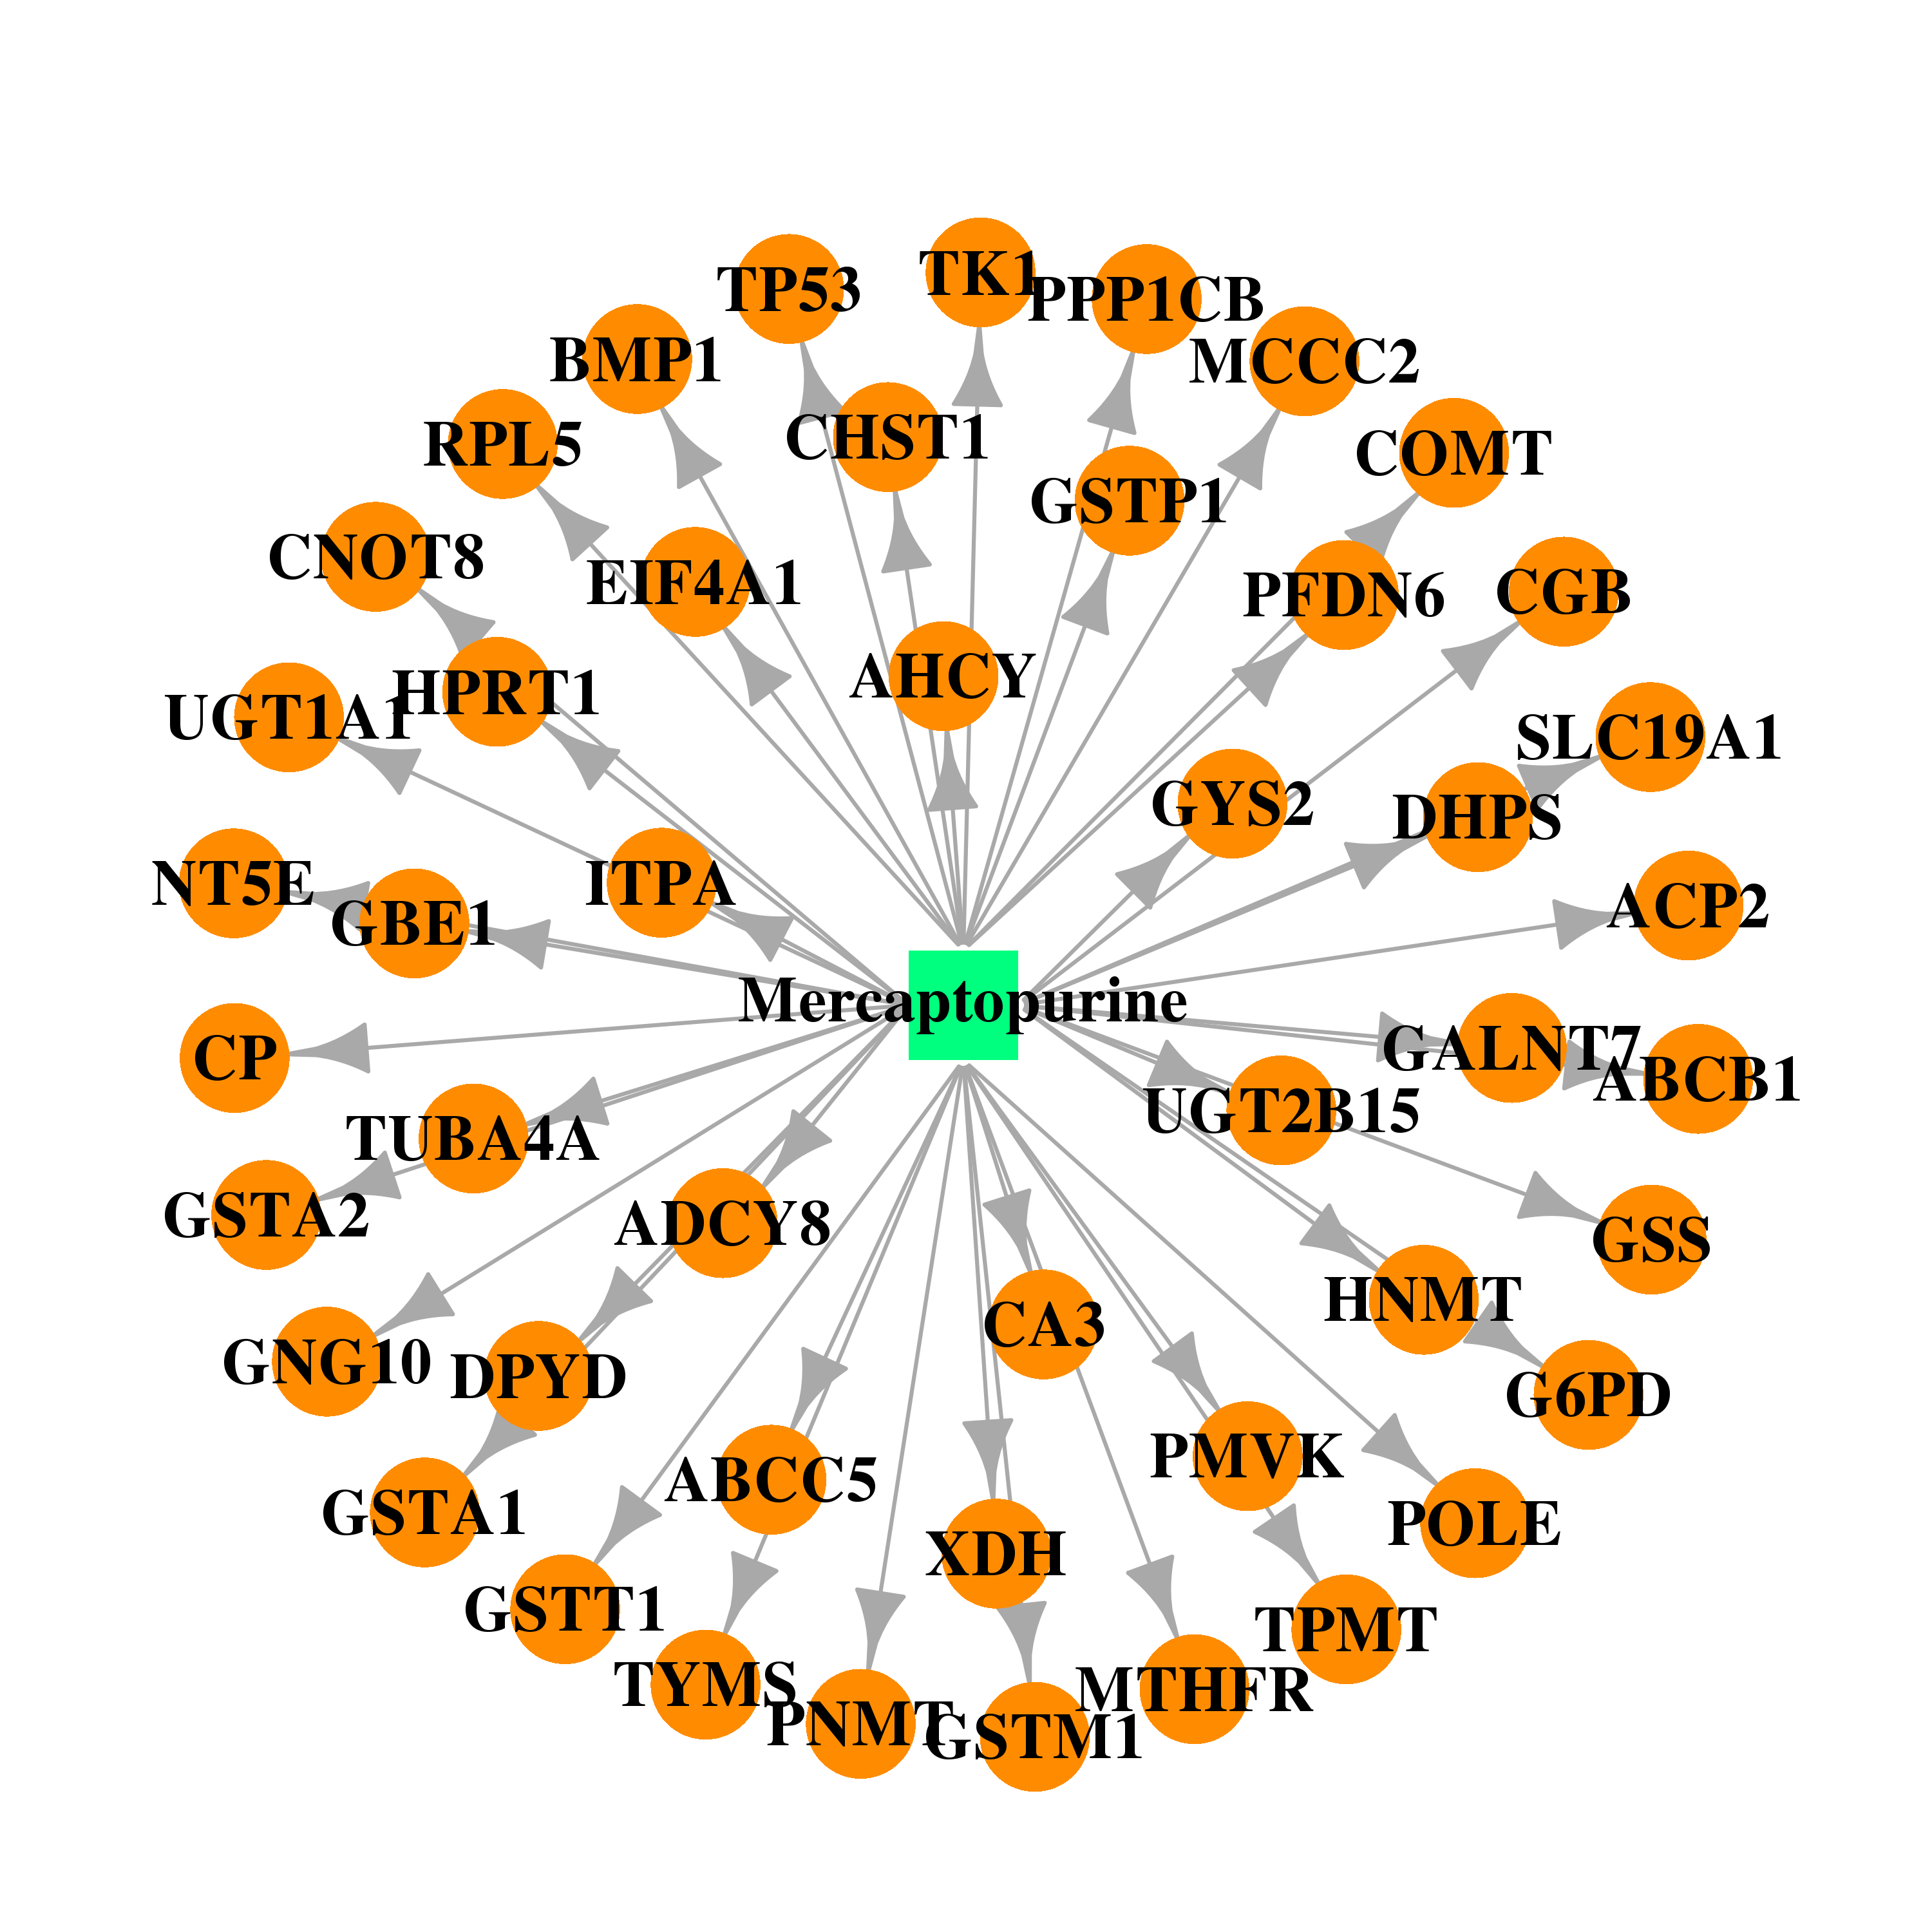 | 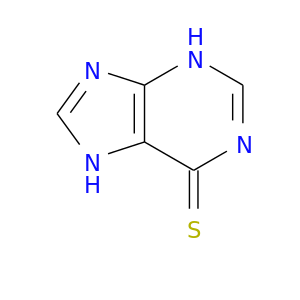 |
| DB00667 | histamine N-methyltransferase | approved | Histamine Phosphate | 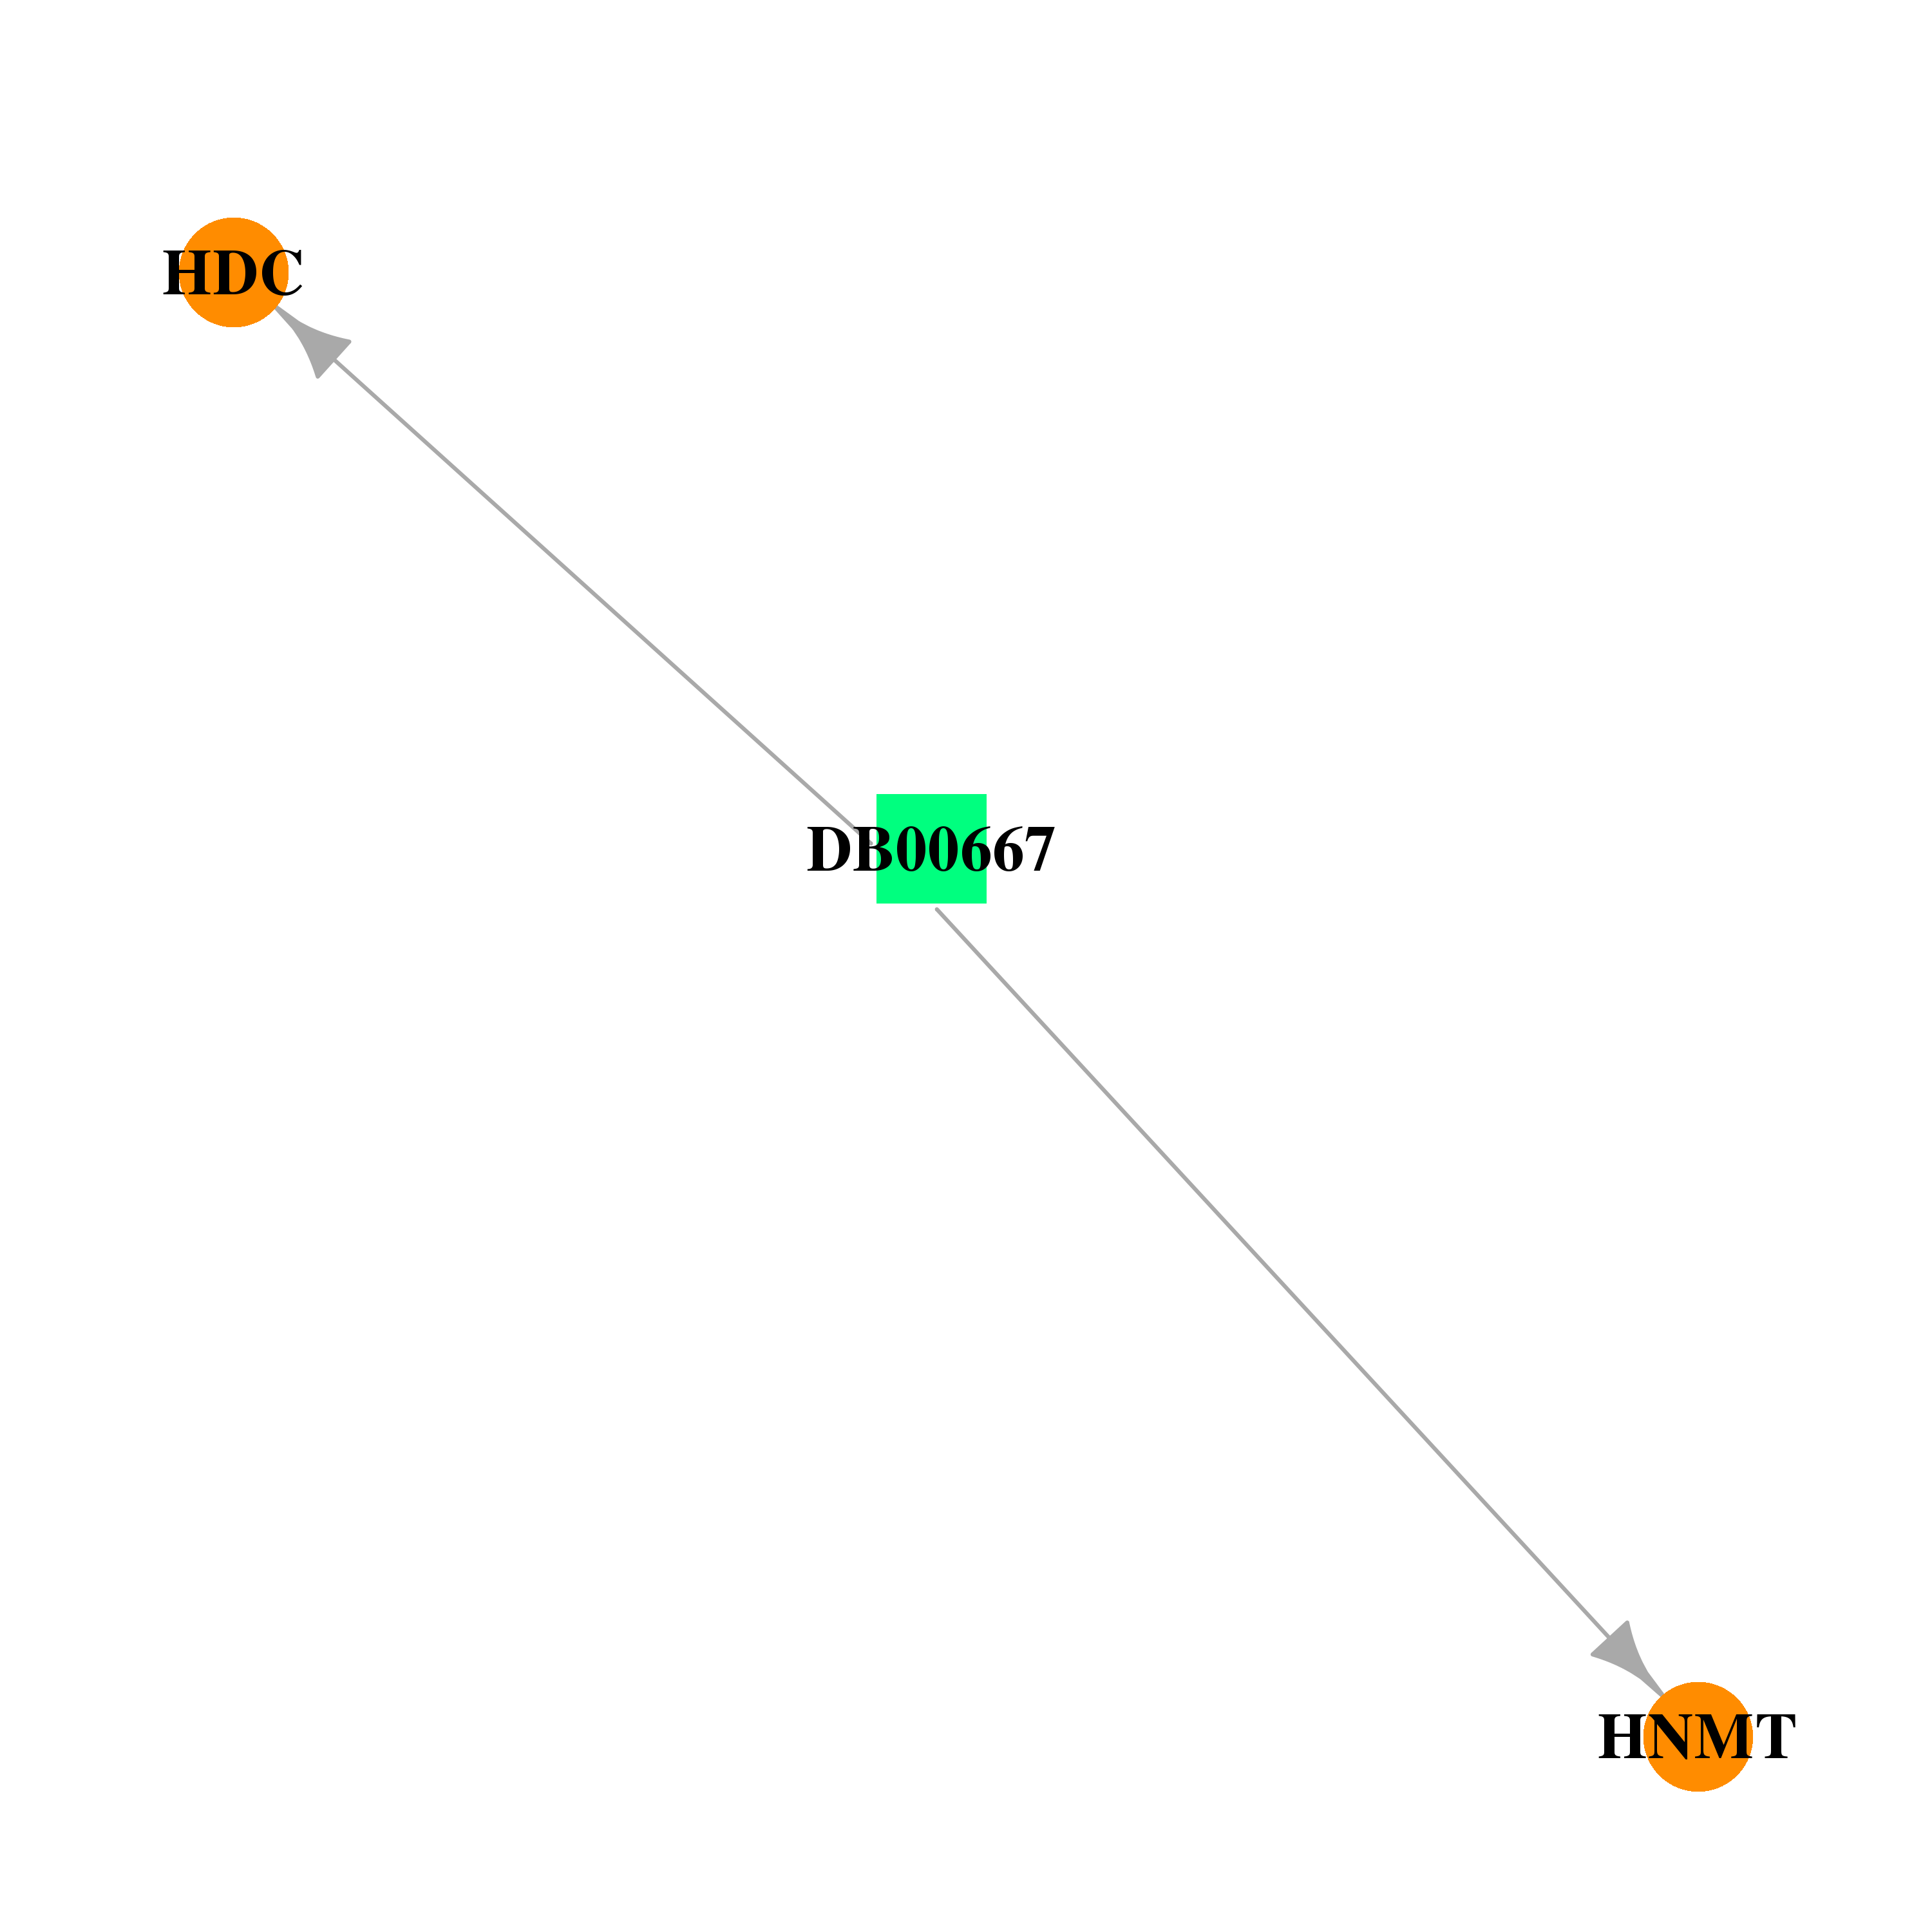 |  |
| Top |
| Cross referenced IDs for HNMT |
| * We obtained these cross-references from Uniprot database. It covers 150 different DBs, 18 categories. http://www.uniprot.org/help/cross_references_section |
: Open all cross reference information
|
Copyright © 2016-Present - The Univsersity of Texas Health Science Center at Houston @ |