|
||||||||||||||||||||
| |
| Phenotypic Information (metabolism pathway, cancer, disease, phenome) |
| |
| |
| Gene-Gene Network Information: Co-Expression Network, Interacting Genes & KEGG |
| |
|


| Gene Summary for DHRS4L2 |
| Basic gene info. | Gene symbol | DHRS4L2 |
| Gene name | dehydrogenase/reductase (SDR family) member 4 like 2 | |
| Synonyms | SDR25C3 | |
| Cytomap | UCSC genome browser: 14q11.2 | |
| Genomic location | chr14 :24458026-24475617 | |
| Type of gene | protein-coding | |
| RefGenes | NM_001193635.1, NM_001193636.1,NM_001193637.1,NM_198083.3, | |
| Ensembl id | ENSG00000187630 | |
| Description | NADP(H)-dependent retinol dehydrogenase/reductase short isoform-like proteindehydrogenase/reductase (SDR family) member 4 like 2A3dehydrogenase/reductase SDR family member 4-like 2short chain dehydrogenase/reductase family 25C, member 3 | |
| Modification date | 20141207 | |
| dbXrefs | MIM : 615196 | |
| HGNC : HGNC | ||
| Ensembl : ENSG00000187630 | ||
| HPRD : 10880 | ||
| Vega : OTTHUMG00000028778 | ||
| Protein | UniProt: go to UniProt's Cross Reference DB Table | |
| Expression | CleanEX: HS_DHRS4L2 | |
| BioGPS: 317749 | ||
| Gene Expression Atlas: ENSG00000187630 | ||
| The Human Protein Atlas: ENSG00000187630 | ||
| Pathway | NCI Pathway Interaction Database: DHRS4L2 | |
| KEGG: DHRS4L2 | ||
| REACTOME: DHRS4L2 | ||
| ConsensusPathDB | ||
| Pathway Commons: DHRS4L2 | ||
| Metabolism | MetaCyc: DHRS4L2 | |
| HUMANCyc: DHRS4L2 | ||
| Regulation | Ensembl's Regulation: ENSG00000187630 | |
| miRBase: chr14 :24,458,026-24,475,617 | ||
| TargetScan: NM_001193635 | ||
| cisRED: ENSG00000187630 | ||
| Context | iHOP: DHRS4L2 | |
| cancer metabolism search in PubMed: DHRS4L2 | ||
| UCL Cancer Institute: DHRS4L2 | ||
| Assigned class in ccmGDB | C | |
| Top |
| Phenotypic Information for DHRS4L2(metabolism pathway, cancer, disease, phenome) |
| Cancer | CGAP: DHRS4L2 |
| Familial Cancer Database: DHRS4L2 | |
| * This gene is included in those cancer gene databases. |
|
|
|
|
|
| . | ||||||||||||||
Oncogene 1 | Significant driver gene in | |||||||||||||||||||
| cf) number; DB name 1 Oncogene; http://nar.oxfordjournals.org/content/35/suppl_1/D721.long, 2 Tumor Suppressor gene; https://bioinfo.uth.edu/TSGene/, 3 Cancer Gene Census; http://www.nature.com/nrc/journal/v4/n3/abs/nrc1299.html, 4 CancerGenes; http://nar.oxfordjournals.org/content/35/suppl_1/D721.long, 5 Network of Cancer Gene; http://ncg.kcl.ac.uk/index.php, 1Therapeutic Vulnerabilities in Cancer; http://cbio.mskcc.org/cancergenomics/statius/ |
| KEGG_RETINOL_METABOLISM | |
| Mutations for DHRS4L2 |
| * Under tables are showing count per each tissue to give us broad intuition about tissue specific mutation patterns.You can go to the detailed page for each mutation database's web site. |
| There's no structural variation information in COSMIC data for this gene. |
| * From mRNA Sanger sequences, Chitars2.0 arranged chimeric transcripts. This table shows DHRS4L2 related fusion information. |
| ID | Head Gene | Tail Gene | Accession | Gene_a | qStart_a | qEnd_a | Chromosome_a | tStart_a | tEnd_a | Gene_a | qStart_a | qEnd_a | Chromosome_a | tStart_a | tEnd_a |
| Top |
| There's no copy number variation information in COSMIC data for this gene. |
| Top |
|
 |
| Top |
| Stat. for Non-Synonymous SNVs (# total SNVs=31) | (# total SNVs=10) |
 |  |
(# total SNVs=0) | (# total SNVs=0) |
| Top |
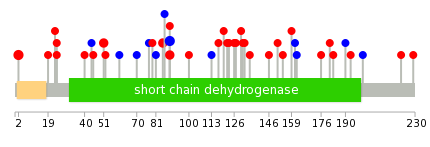
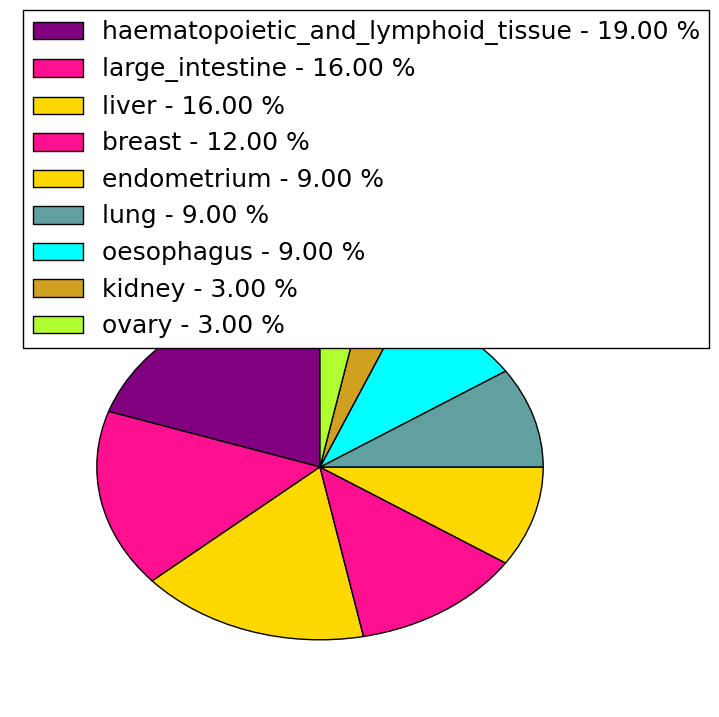
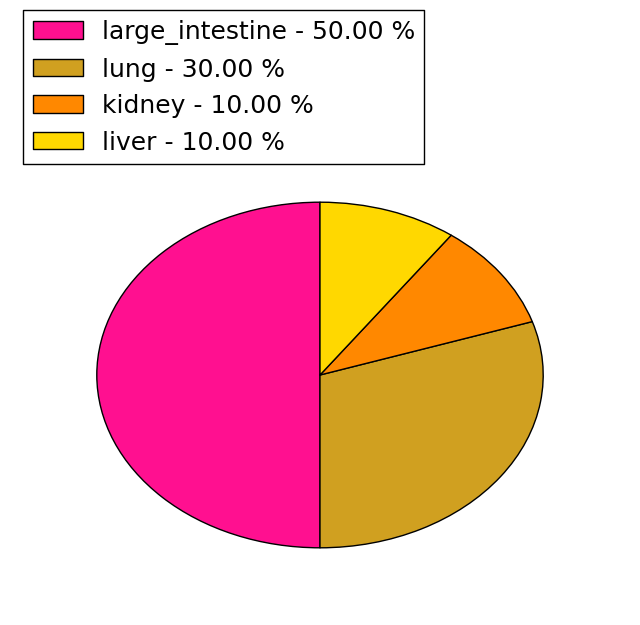
| * When you move the cursor on each content, you can see more deailed mutation information on the Tooltip. Those are primary_site,primary_histology,mutation(aa),pubmedID. |
| GRCh37 position | Mutation(aa) | Unique sampleID count |
| chr14:24459529-24459529 | p.H89Q | 4 |
| chr14:24458162-24458162 | p.Q2H | 3 |
| chr14:24459515-24459515 | p.G85S | 2 |
| chr14:24459528-24459528 | p.H89R | 2 |
| chr14:24459413-24459413 | p.R51C | 2 |
| chr14:24464303-24464303 | p.F123L | 1 |
| chr14:24458226-24458226 | p.M24L | 1 |
| chr14:24470241-24470241 | p.? | 1 |
| chr14:24459505-24459505 | p.L81L | 1 |
| chr14:24473567-24473567 | p.K229N | 1 |
| Top |
|
 |
| Point Mutation/ Tissue ID | 1 | 2 | 3 | 4 | 5 | 6 | 7 | 8 | 9 | 10 | 11 | 12 | 13 | 14 | 15 | 16 | 17 | 18 | 19 | 20 |
| # sample | 2 | 1 | 7 | 2 | 2 | 2 | 1 | 2 | 1 | 3 | ||||||||||
| # mutation | 2 | 1 | 5 | 2 | 2 | 2 | 1 | 2 | 1 | 3 | ||||||||||
| nonsynonymous SNV | 1 | 1 | 4 | 2 | 1 | 1 | 1 | 1 | 3 | |||||||||||
| synonymous SNV | 1 | 1 | 1 | 1 | 2 |
| cf) Tissue ID; Tissue type (1; BLCA[Bladder Urothelial Carcinoma], 2; BRCA[Breast invasive carcinoma], 3; CESC[Cervical squamous cell carcinoma and endocervical adenocarcinoma], 4; COAD[Colon adenocarcinoma], 5; GBM[Glioblastoma multiforme], 6; Glioma Low Grade, 7; HNSC[Head and Neck squamous cell carcinoma], 8; KICH[Kidney Chromophobe], 9; KIRC[Kidney renal clear cell carcinoma], 10; KIRP[Kidney renal papillary cell carcinoma], 11; LAML[Acute Myeloid Leukemia], 12; LUAD[Lung adenocarcinoma], 13; LUSC[Lung squamous cell carcinoma], 14; OV[Ovarian serous cystadenocarcinoma ], 15; PAAD[Pancreatic adenocarcinoma], 16; PRAD[Prostate adenocarcinoma], 17; SKCM[Skin Cutaneous Melanoma], 18:STAD[Stomach adenocarcinoma], 19:THCA[Thyroid carcinoma], 20:UCEC[Uterine Corpus Endometrial Carcinoma]) |
| Top |
| * We represented just top 10 SNVs. When you move the cursor on each content, you can see more deailed mutation information on the Tooltip. Those are primary_site, primary_histology, mutation(aa), pubmedID. |
| Genomic Position | Mutation(aa) | Unique sampleID count |
| chr14:24459529 | p.H89H,DHRS4L2 | 4 |
| chr14:24459498 | p.E79G,DHRS4L2 | 2 |
| chr14:24459528 | p.H89R,DHRS4L2 | 2 |
| chr14:24459472 | p.R58Q,DHRS4L2 | 1 |
| chr14:24470139 | p.P39S,DHRS4L2 | 1 |
| chr14:24470602 | p.M24L | 1 |
| chr14:24459505 | p.N41S,DHRS4L2 | 1 |
| chr14:24470609 | p.M24I | 1 |
| chr14:24470629 | p.L48L,DHRS4L2 | 1 |
| chr14:24470661 | p.G45D,DHRS4L2 | 1 |
| * Copy number data were extracted from TCGA using R package TCGA-Assembler. The URLs of all public data files on TCGA DCC data server were gathered on Jan-05-2015. Function ProcessCNAData in TCGA-Assembler package was used to obtain gene-level copy number value which is calculated as the average copy number of the genomic region of a gene. |
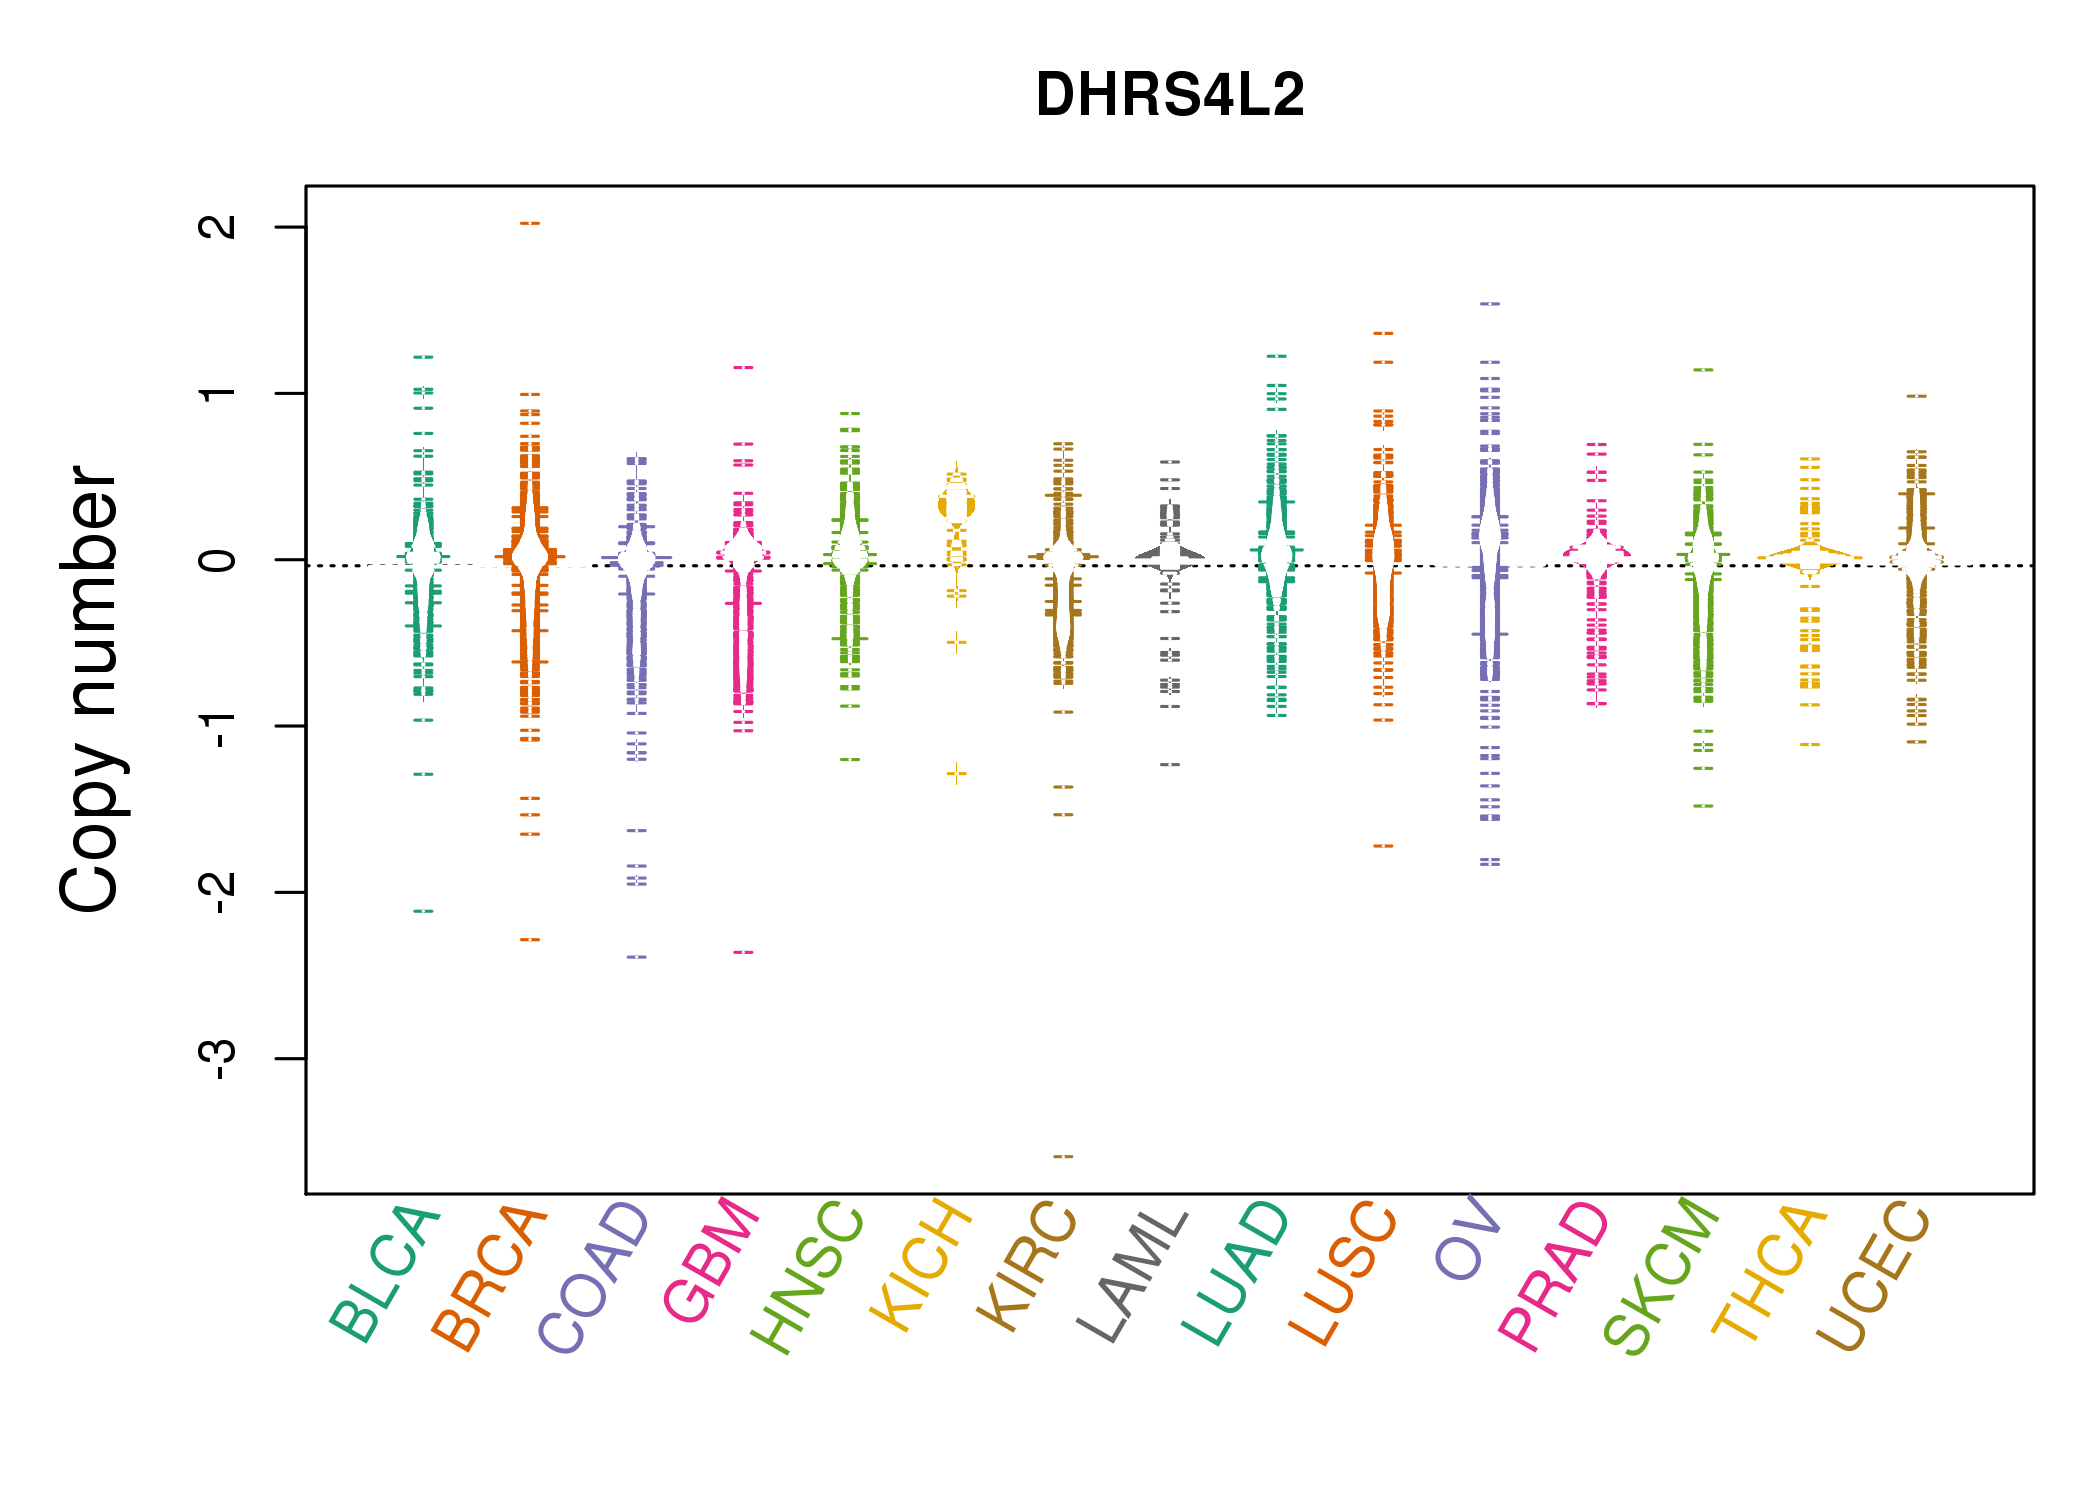 |
| cf) Tissue ID[Tissue type]: BLCA[Bladder Urothelial Carcinoma], BRCA[Breast invasive carcinoma], CESC[Cervical squamous cell carcinoma and endocervical adenocarcinoma], COAD[Colon adenocarcinoma], GBM[Glioblastoma multiforme], Glioma Low Grade, HNSC[Head and Neck squamous cell carcinoma], KICH[Kidney Chromophobe], KIRC[Kidney renal clear cell carcinoma], KIRP[Kidney renal papillary cell carcinoma], LAML[Acute Myeloid Leukemia], LUAD[Lung adenocarcinoma], LUSC[Lung squamous cell carcinoma], OV[Ovarian serous cystadenocarcinoma ], PAAD[Pancreatic adenocarcinoma], PRAD[Prostate adenocarcinoma], SKCM[Skin Cutaneous Melanoma], STAD[Stomach adenocarcinoma], THCA[Thyroid carcinoma], UCEC[Uterine Corpus Endometrial Carcinoma] |
| Top |
| Gene Expression for DHRS4L2 |
| * CCLE gene expression data were extracted from CCLE_Expression_Entrez_2012-10-18.res: Gene-centric RMA-normalized mRNA expression data. |
 |
| * Normalized gene expression data of RNASeqV2 was extracted from TCGA using R package TCGA-Assembler. The URLs of all public data files on TCGA DCC data server were gathered at Jan-05-2015. Only eight cancer types have enough normal control samples for differential expression analysis. (t test, adjusted p<0.05 (using Benjamini-Hochberg FDR)) |
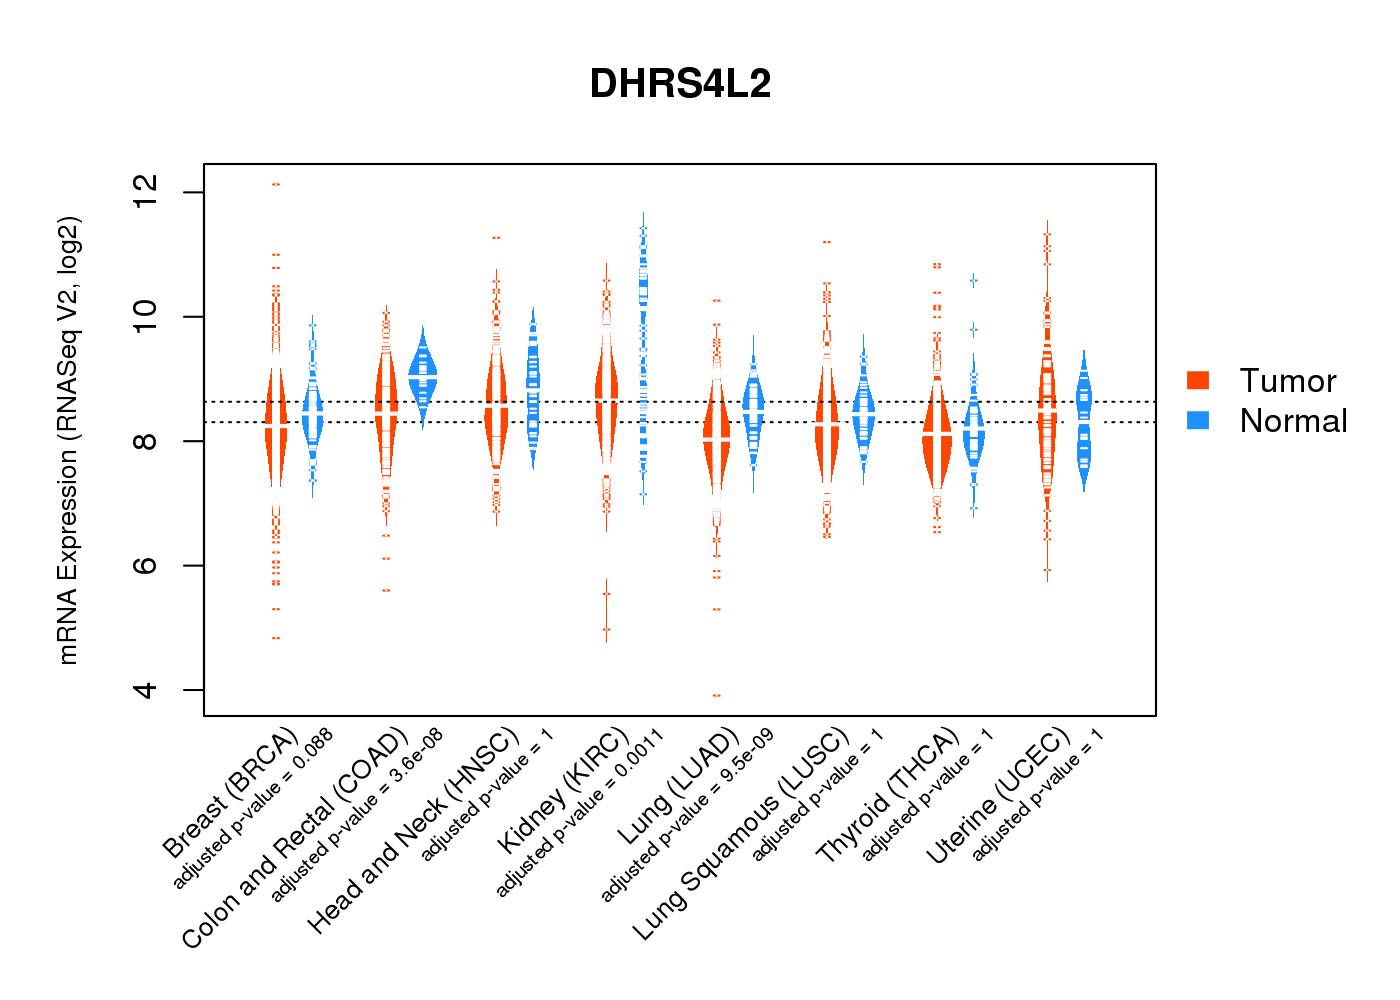 |
| Top |
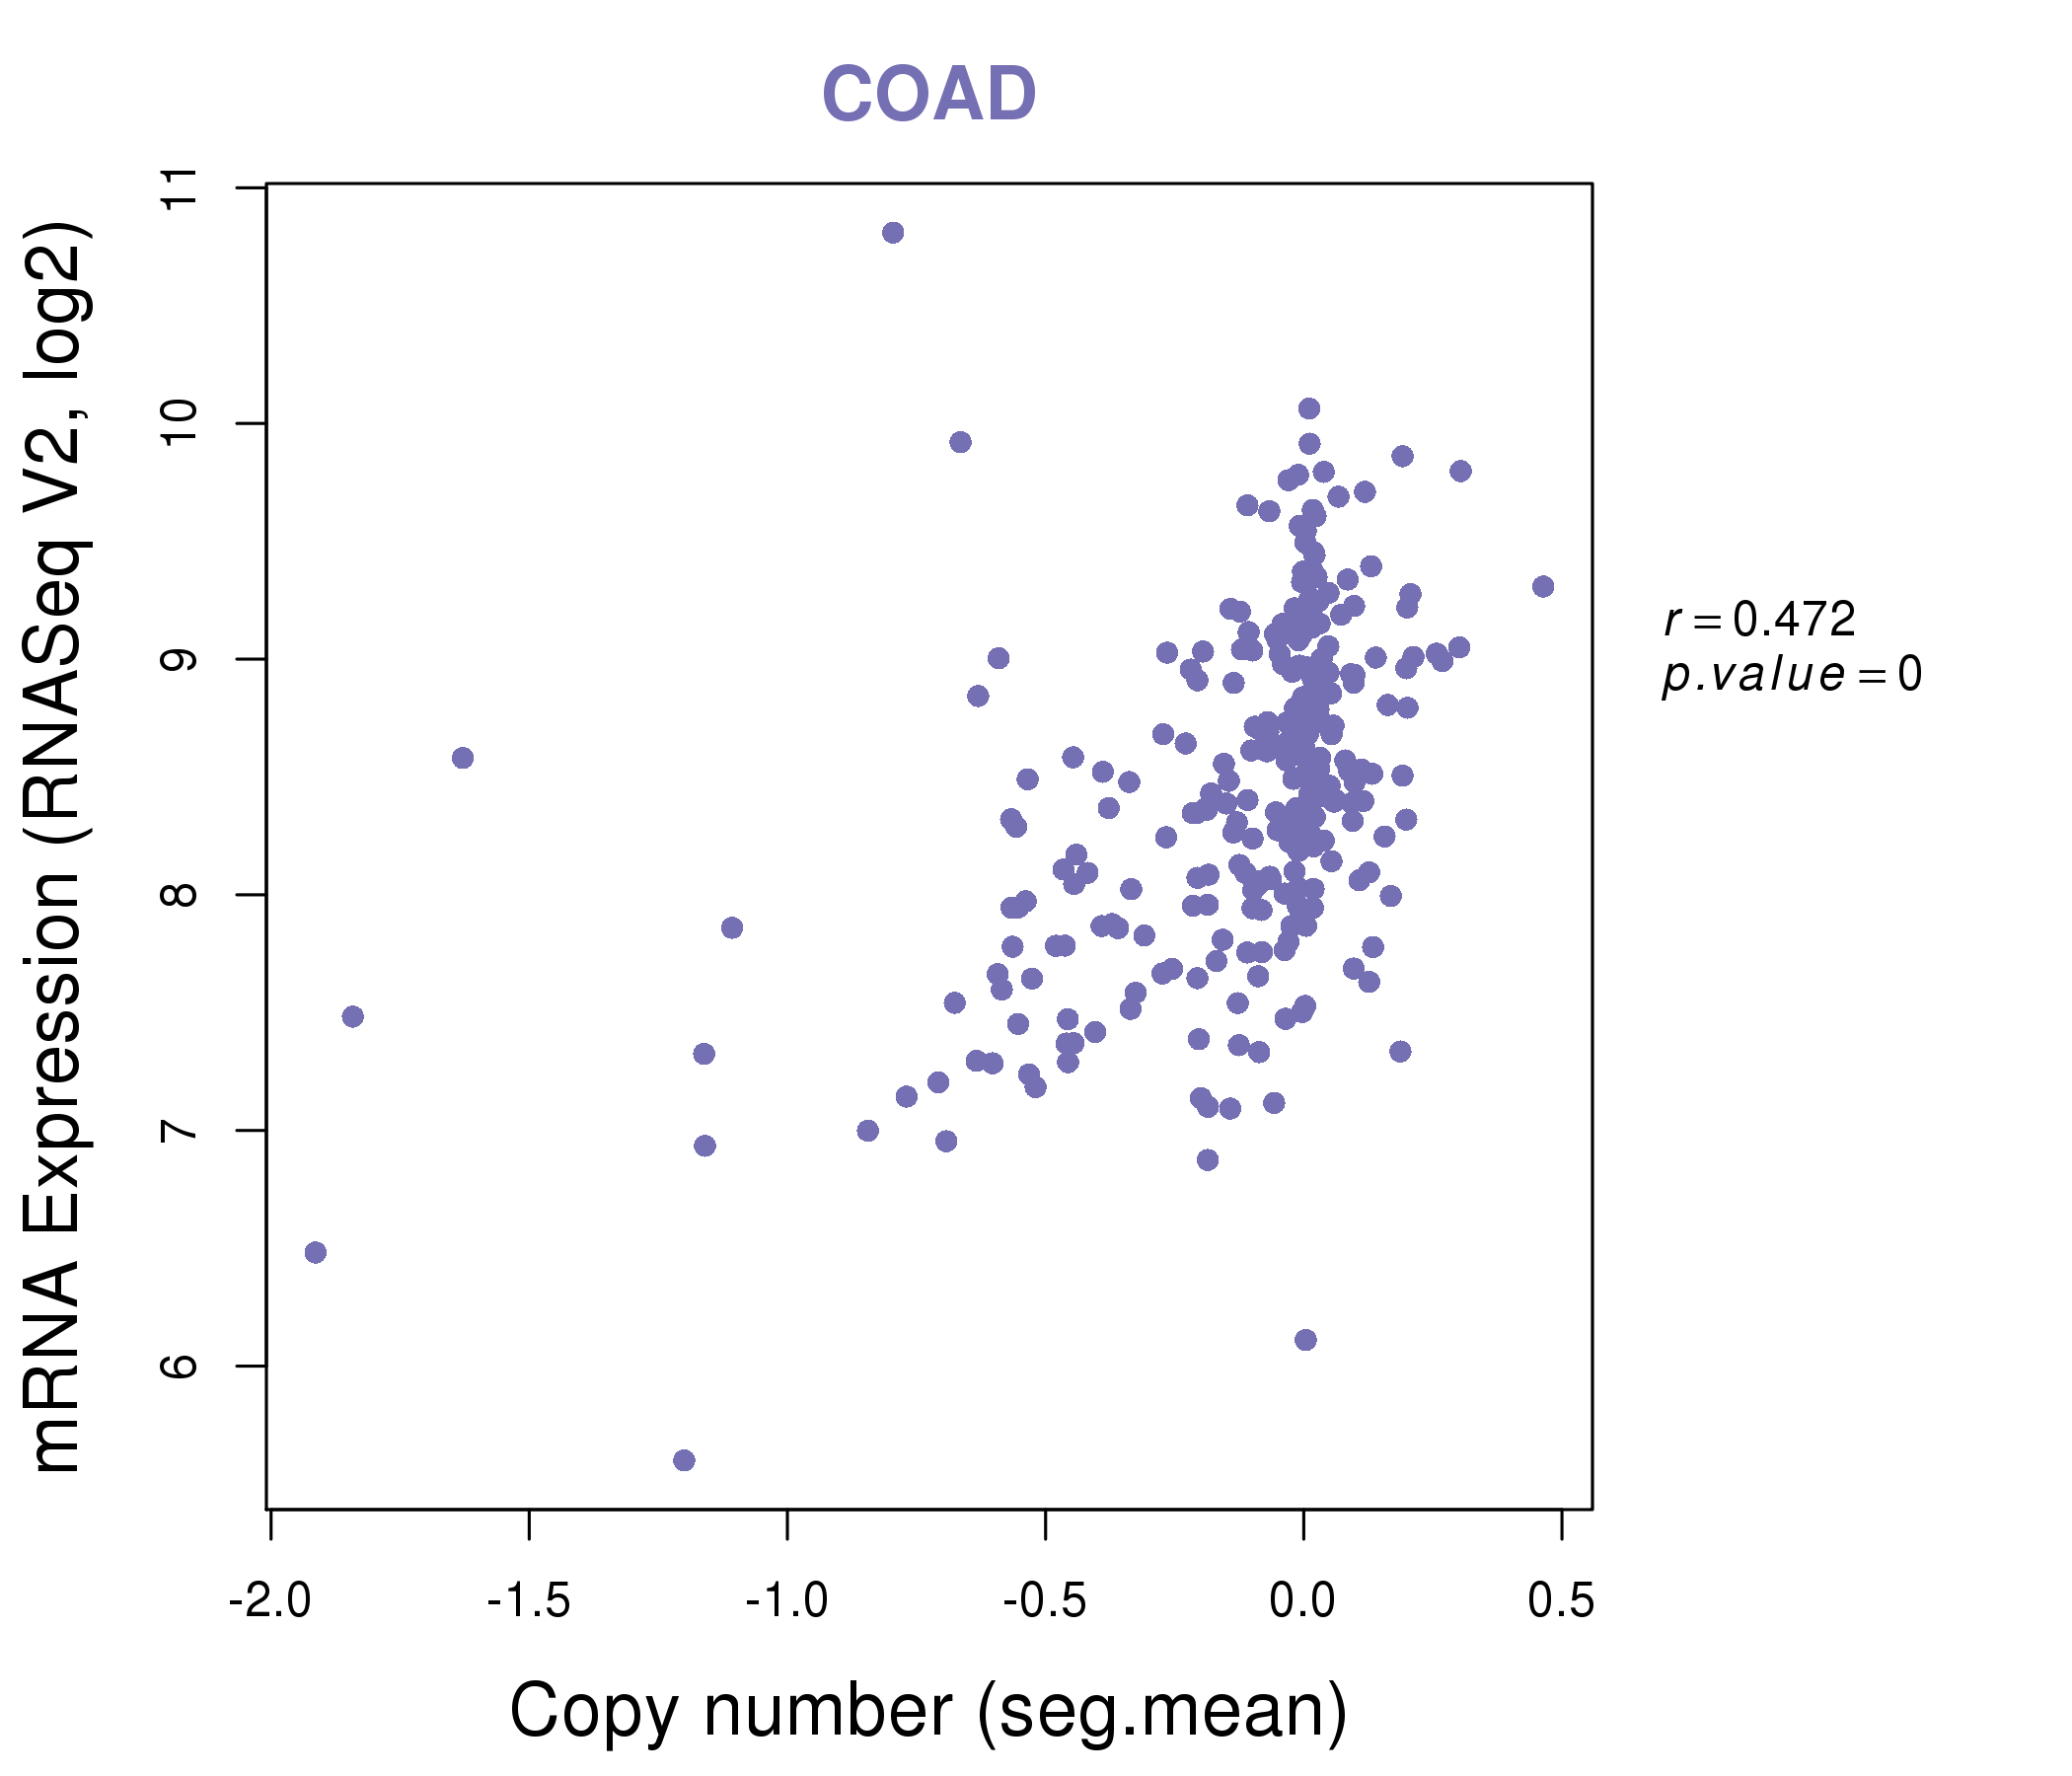
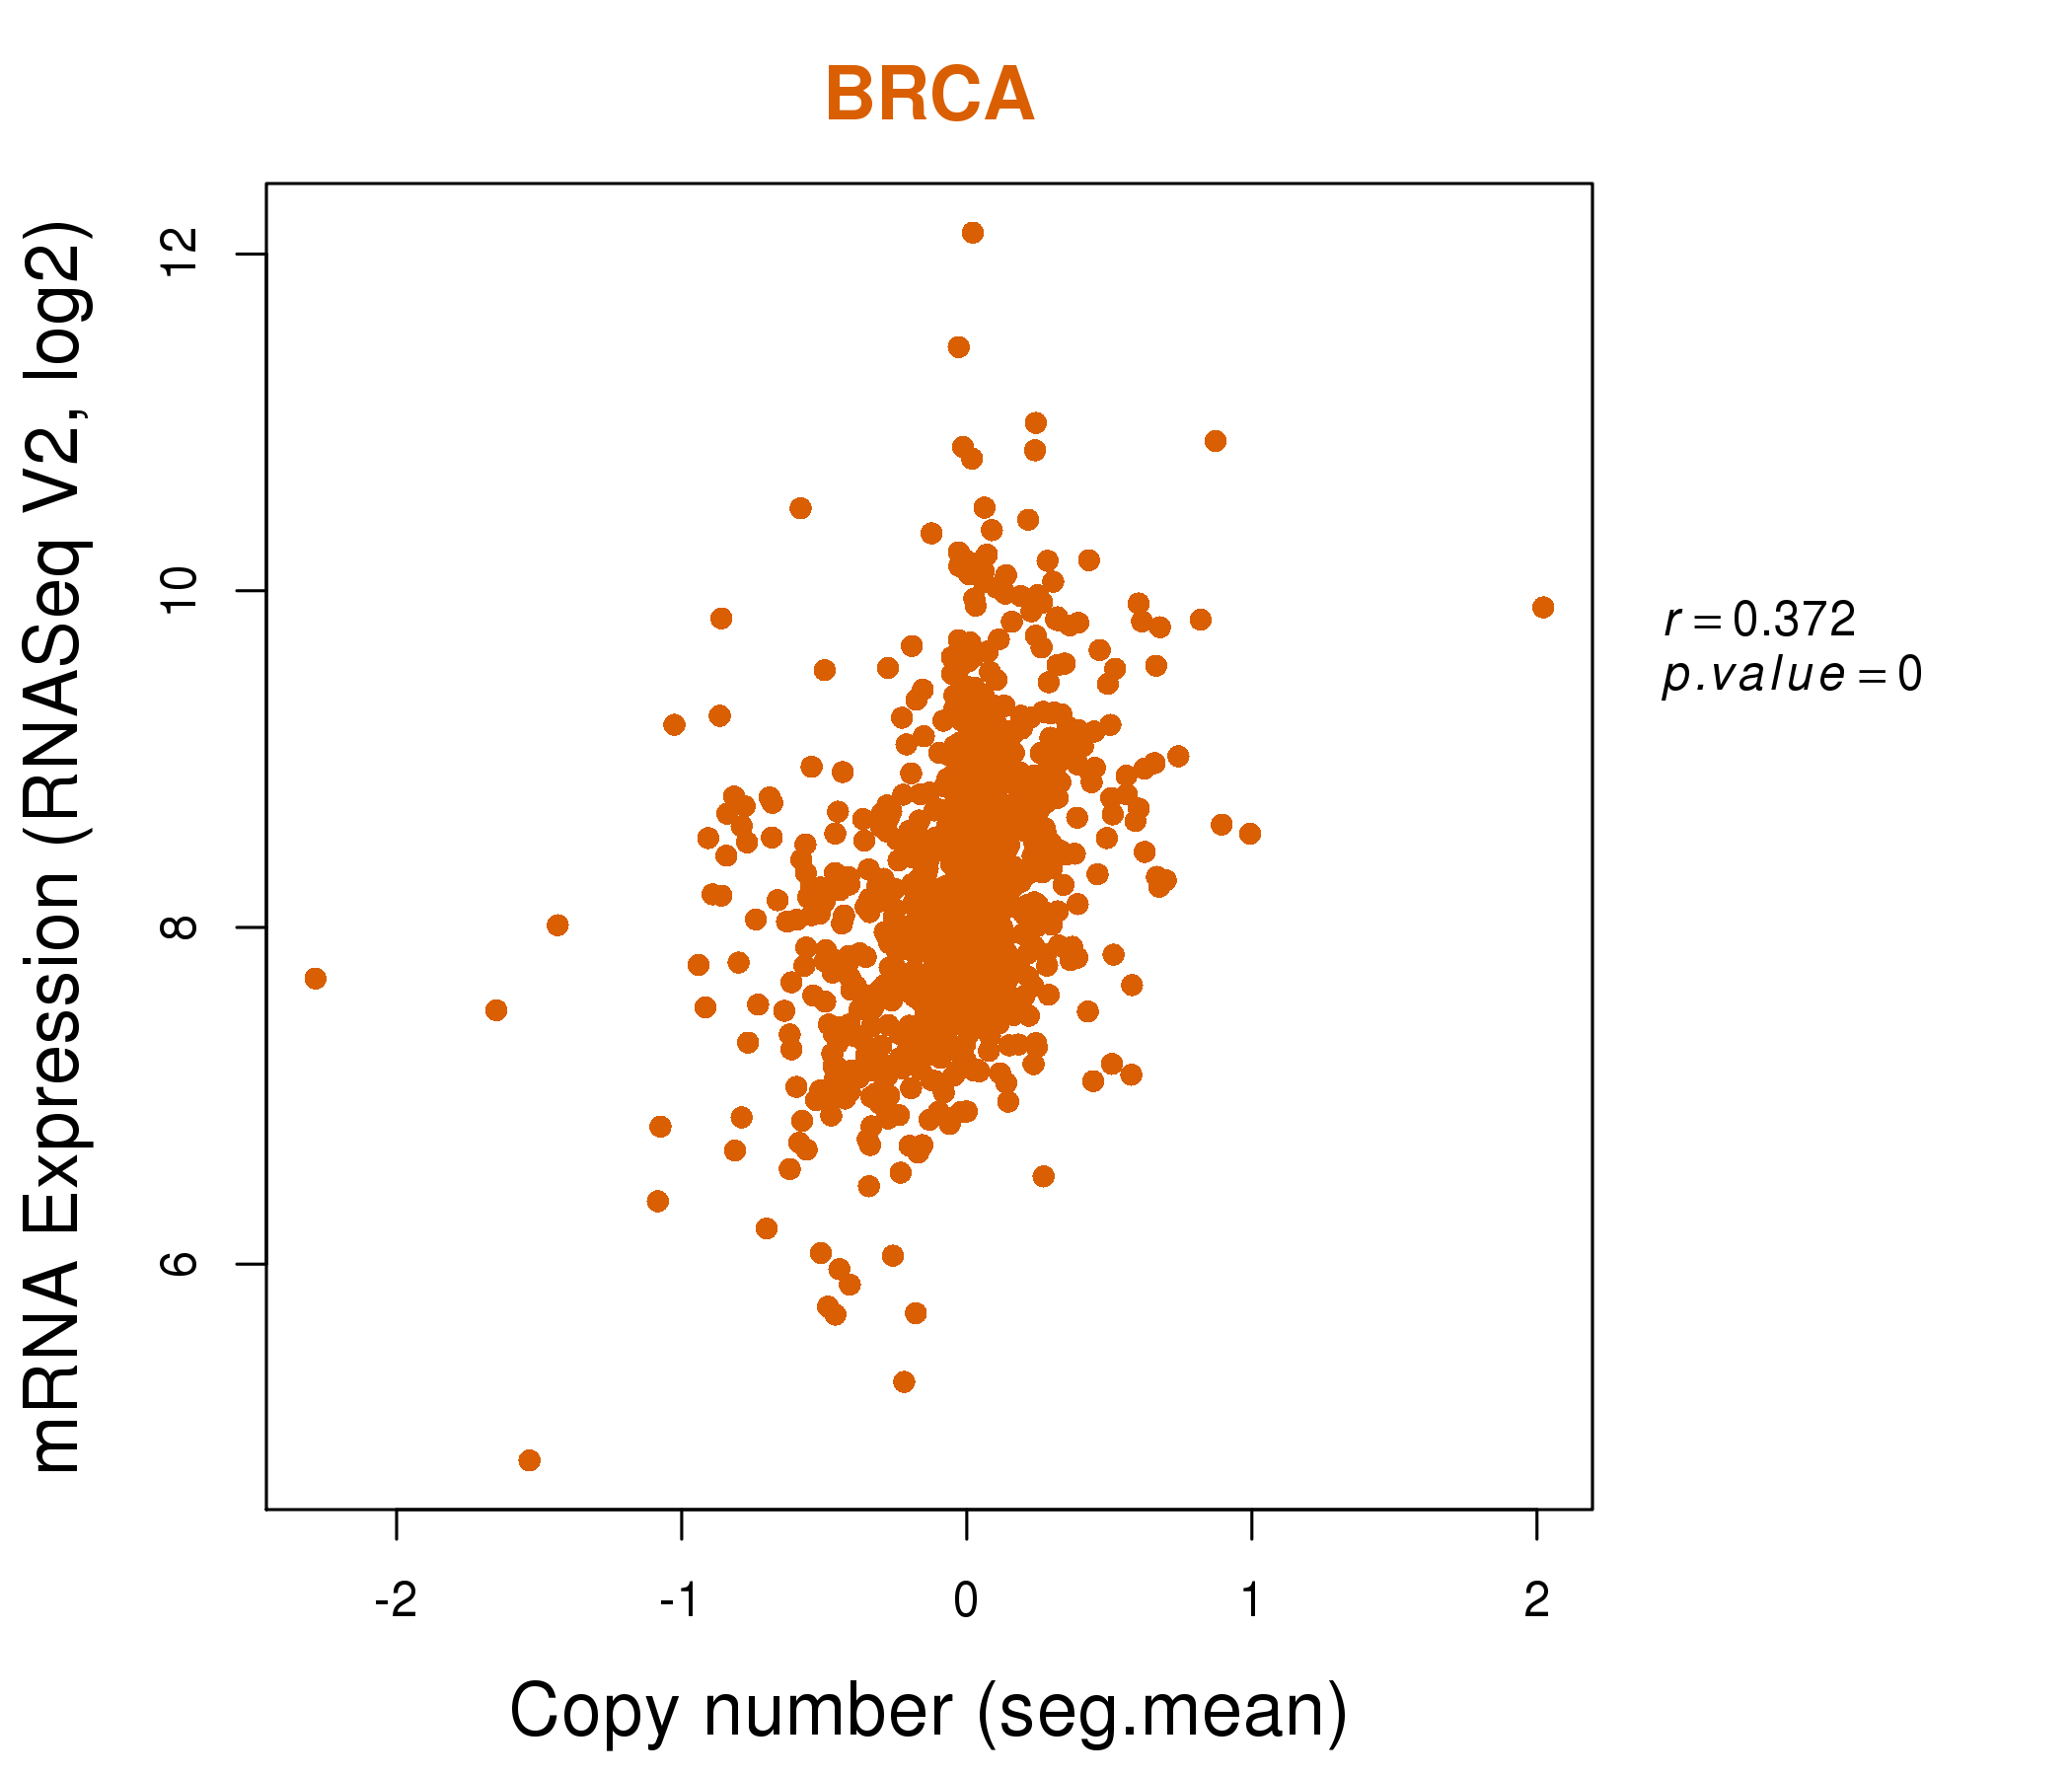
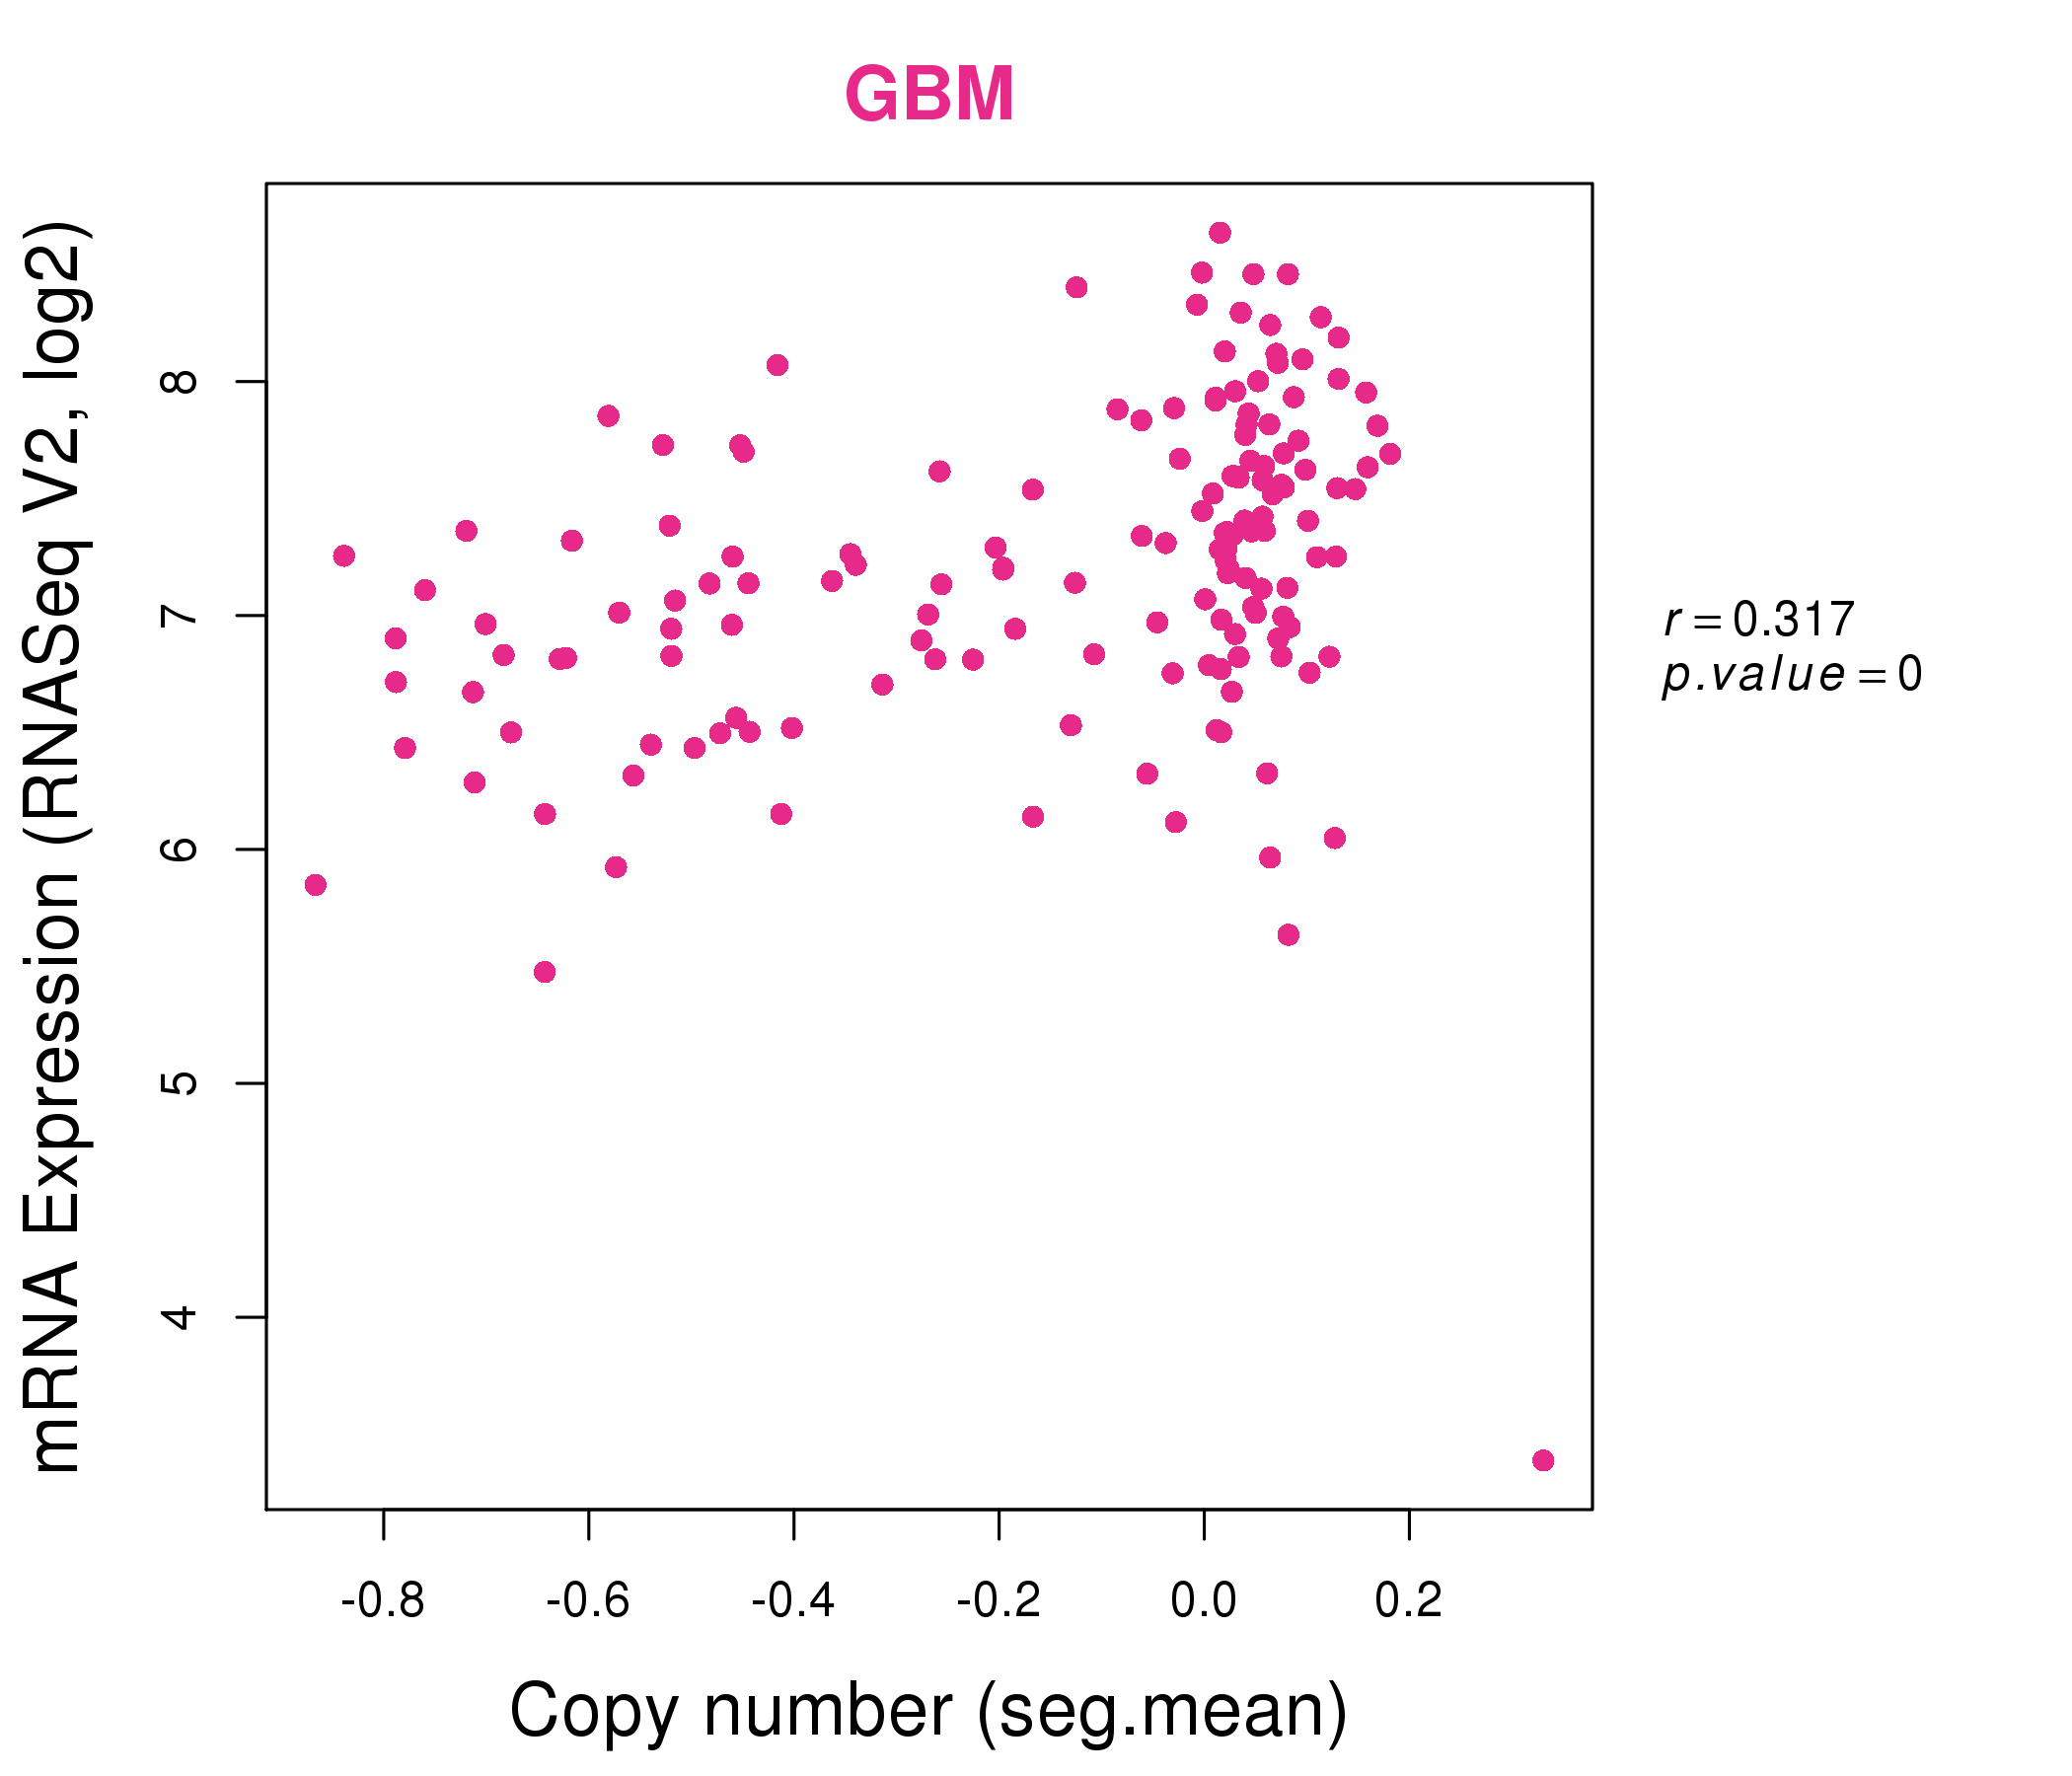
| * This plots show the correlation between CNV and gene expression. |
: Open all plots for all cancer types
 |
|
 |
|
| Top |
| Gene-Gene Network Information |
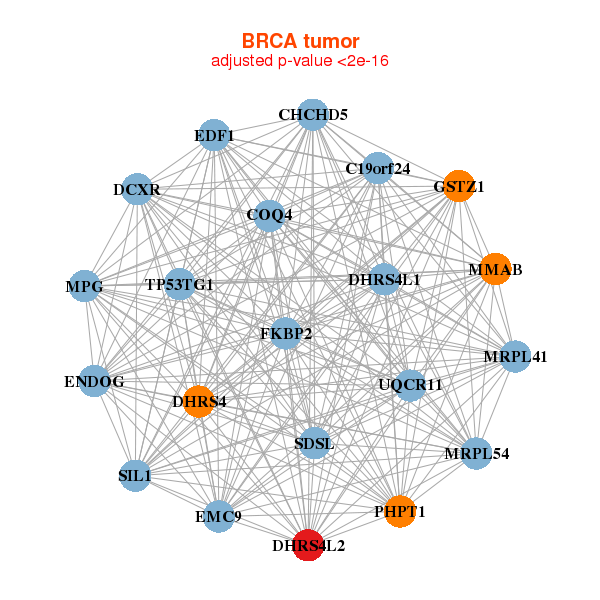
| * Co-Expression network figures were drawn using R package igraph. Only the top 20 genes with the highest correlations were shown. Red circle: input gene, orange circle: cell metabolism gene, sky circle: other gene |
: Open all plots for all cancer types
 |
| ||||
| C19orf24,CHCHD5,COQ4,DCXR,DHRS4,DHRS4L1,DHRS4L2, EDF1,ENDOG,EMC9,FKBP2,GSTZ1,MMAB,MPG, MRPL41,MRPL54,PHPT1,SDSL,SIL1,TP53TG1,UQCR11 | AUP1,AURKAIP1,ELP6,CHMP2A,DDRGK1,DHRS4,DHRS4L2, IDH3G,MEA1,MED11,MRPL28,NAA10,NUDC,PMVK, PSMD13,PSMD9,RAB1B,SPR,TEX264,TMEM147,TMEM187 | ||||
 |
| ||||
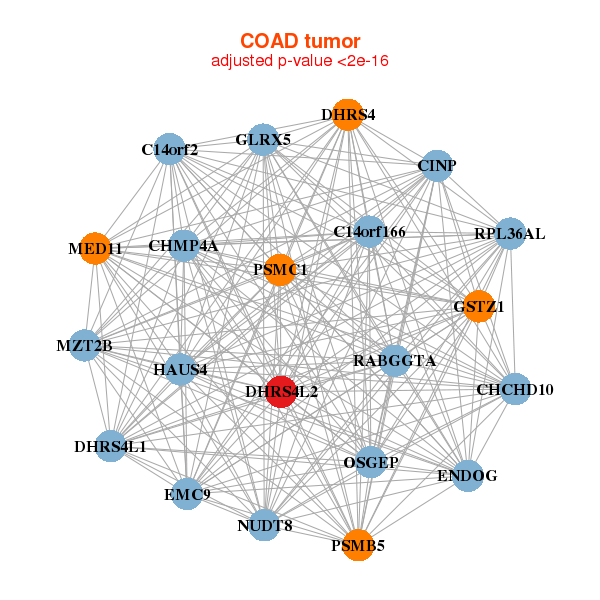
| C14orf166,C14orf2,CHCHD10,CHMP4A,CINP,DHRS4,DHRS4L1, DHRS4L2,ENDOG,MZT2B,EMC9,GLRX5,GSTZ1,HAUS4, MED11,NUDT8,OSGEP,PSMB5,PSMC1,RABGGTA,RPL36AL | ACY3,AKR1A1,CLDN15,CRIP1,CYP2J2,DAK,DDC, DHRS4L2,F11,FBP1,GCHFR,MMEL1,MS4A15,OTC, PRSS1,SLC25A15,SLC37A4,TIGD3,TMEM92,PRSS3P2,TTC36 |
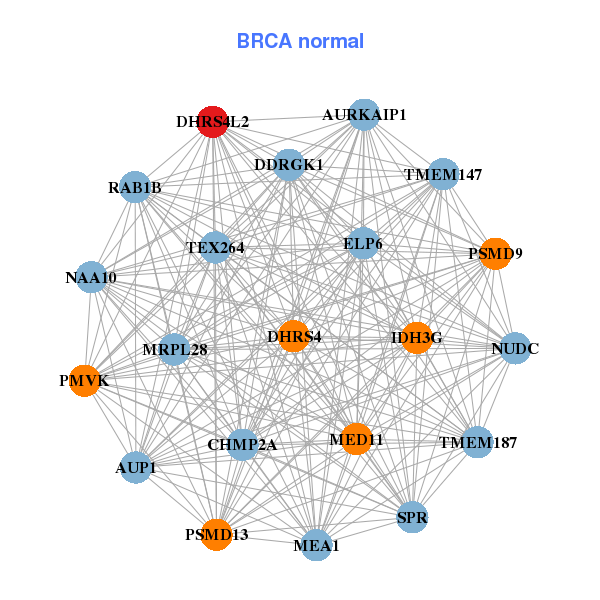
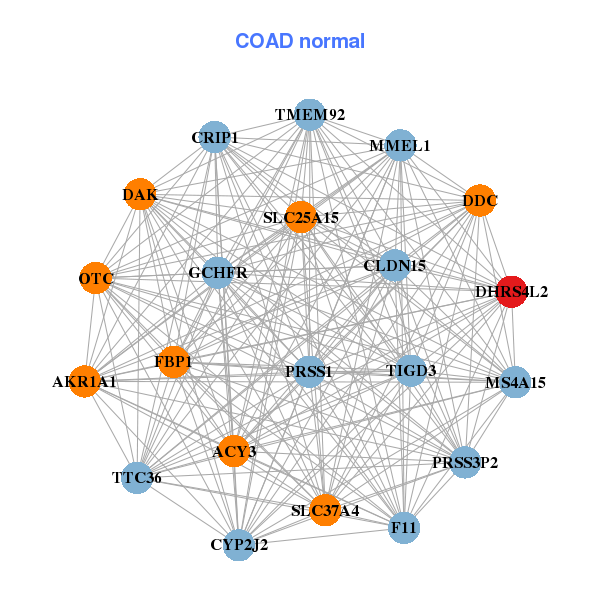
| * Co-Expression network figures were drawn using R package igraph. Only the top 20 genes with the highest correlations were shown. Red circle: input gene, orange circle: cell metabolism gene, sky circle: other gene |
: Open all plots for all cancer types
| Top |
: Open all interacting genes' information including KEGG pathway for all interacting genes from DAVID
| Top |
| Pharmacological Information for DHRS4L2 |
| DB Category | DB Name | DB's ID and Url link |
| * Gene Centered Interaction Network. |
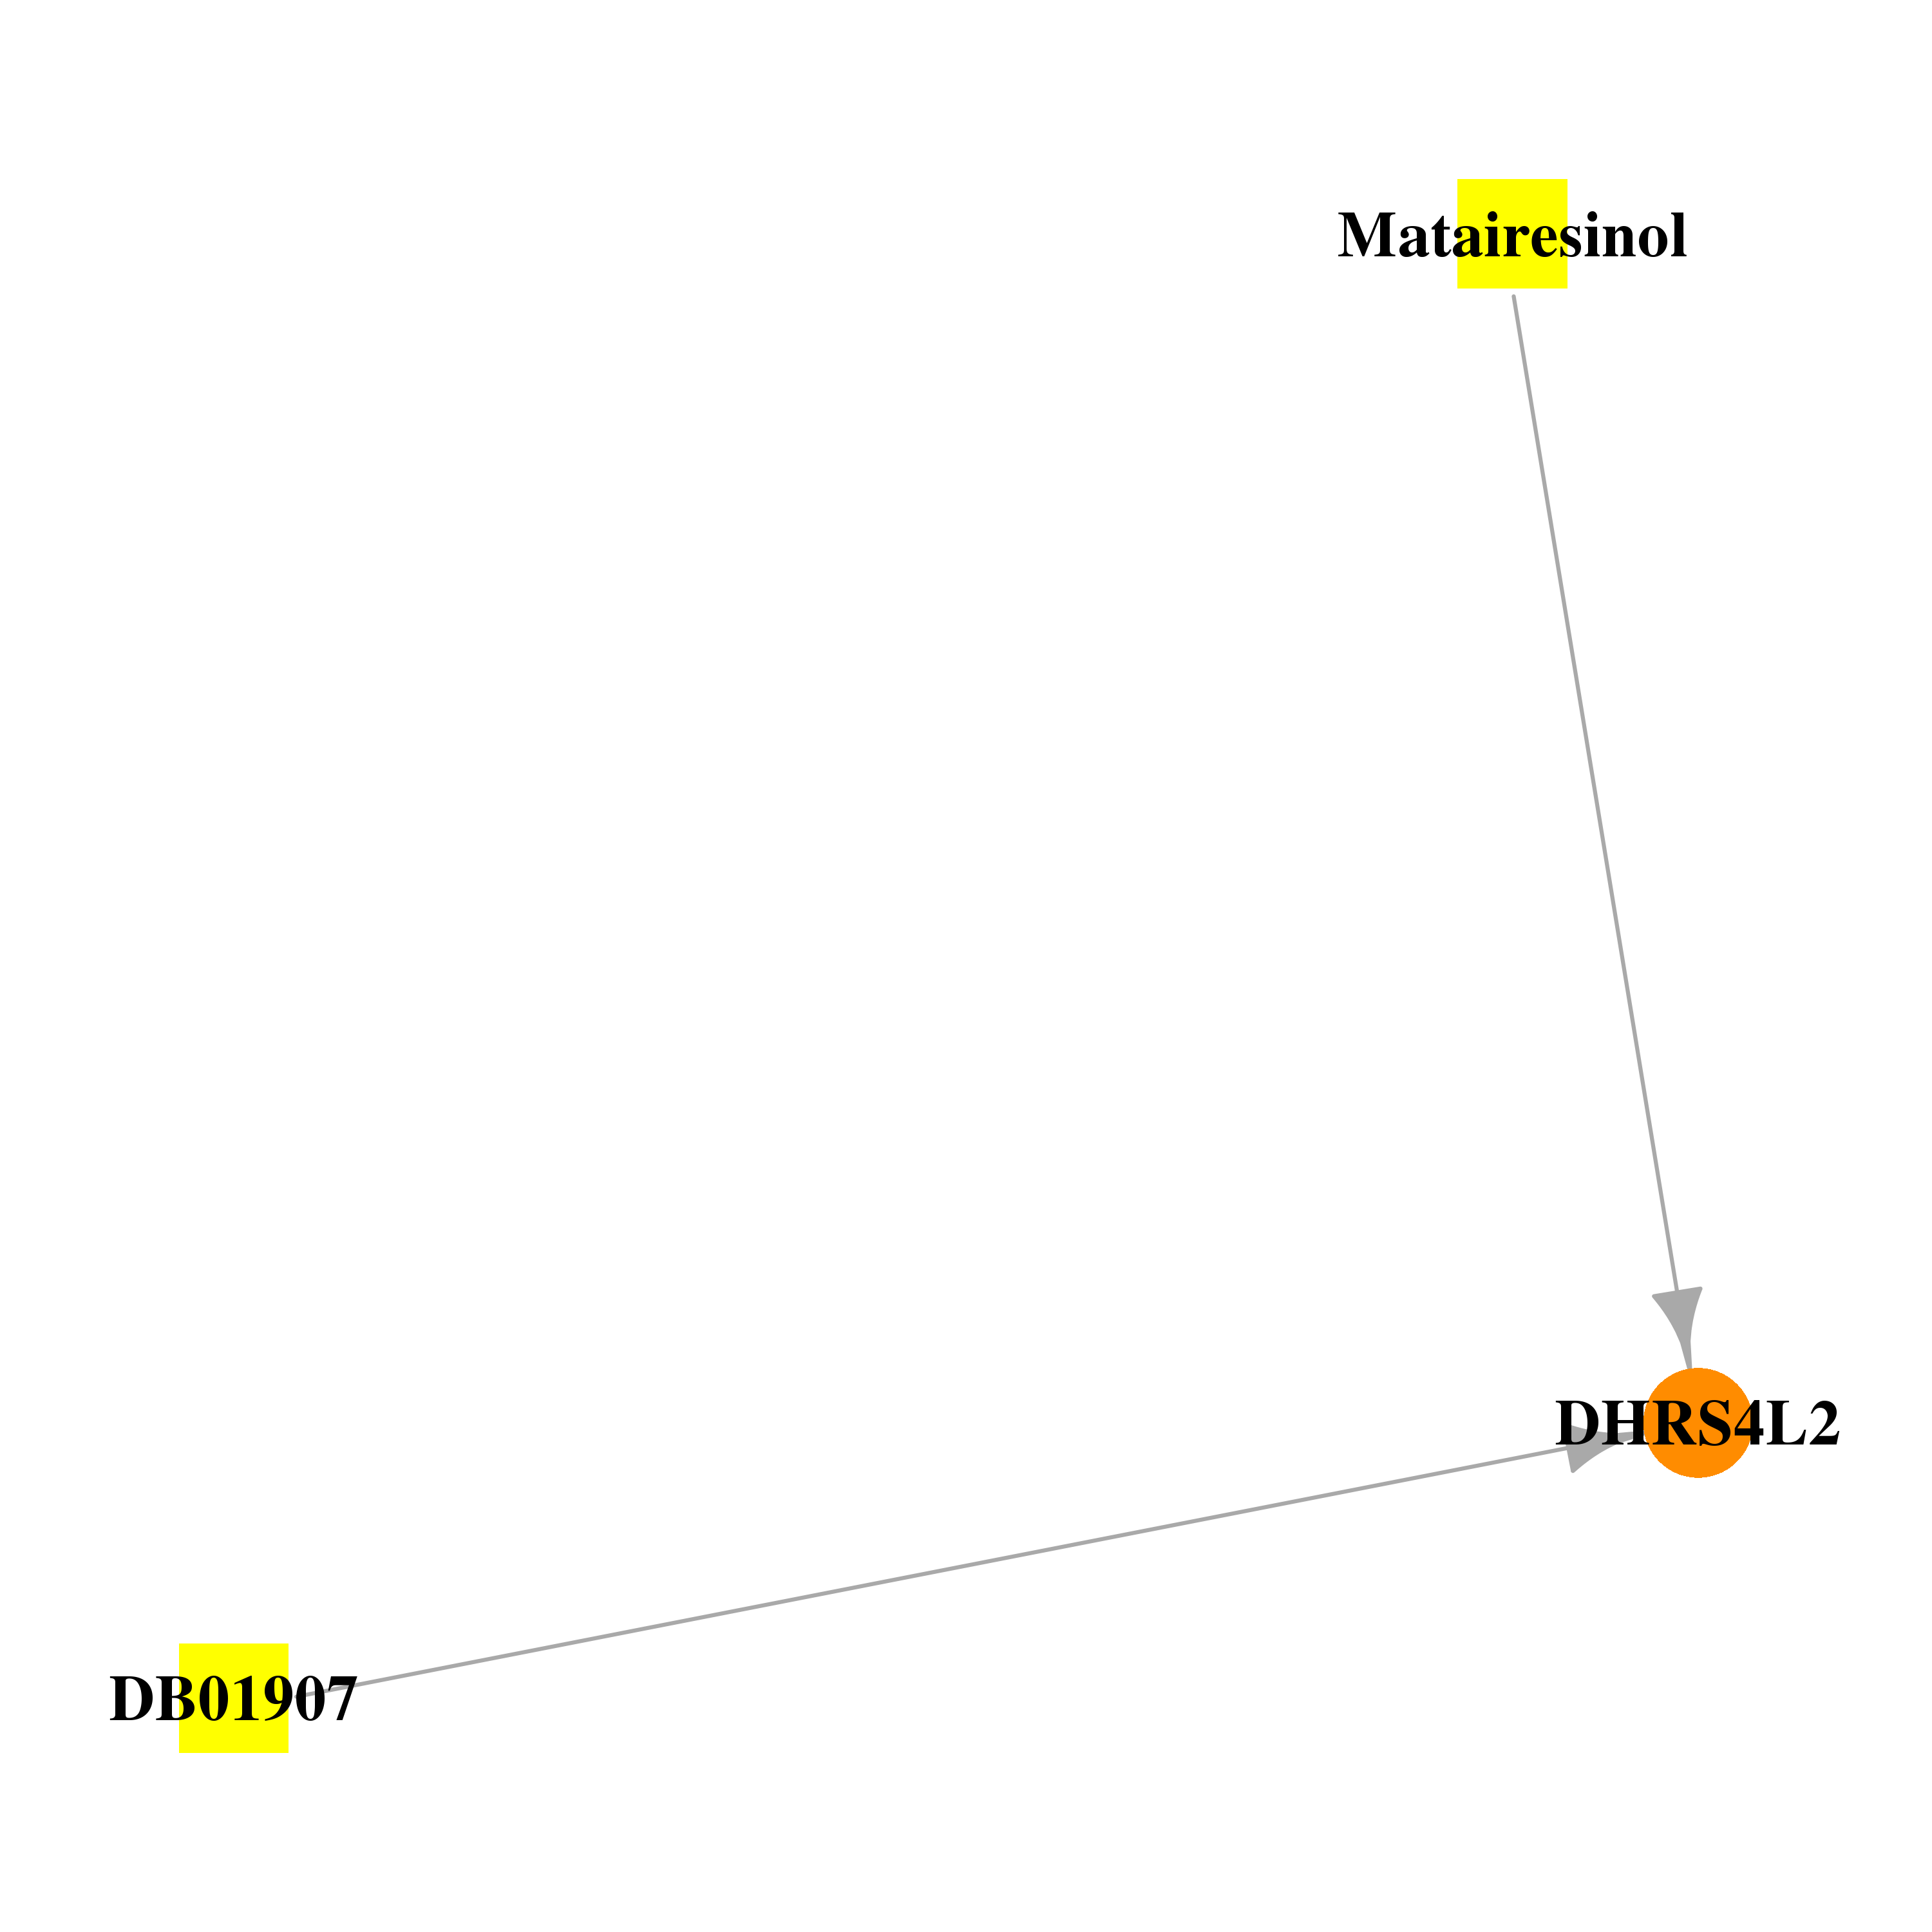 |
| * Drug Centered Interaction Network. |
| DrugBank ID | Target Name | Drug Groups | Generic Name | Drug Centered Network | Drug Structure |
| DB01907 | dehydrogenase/reductase (SDR family) member 4 like 2 | experimental | Nicotinamide-Adenine-Dinucleotide | 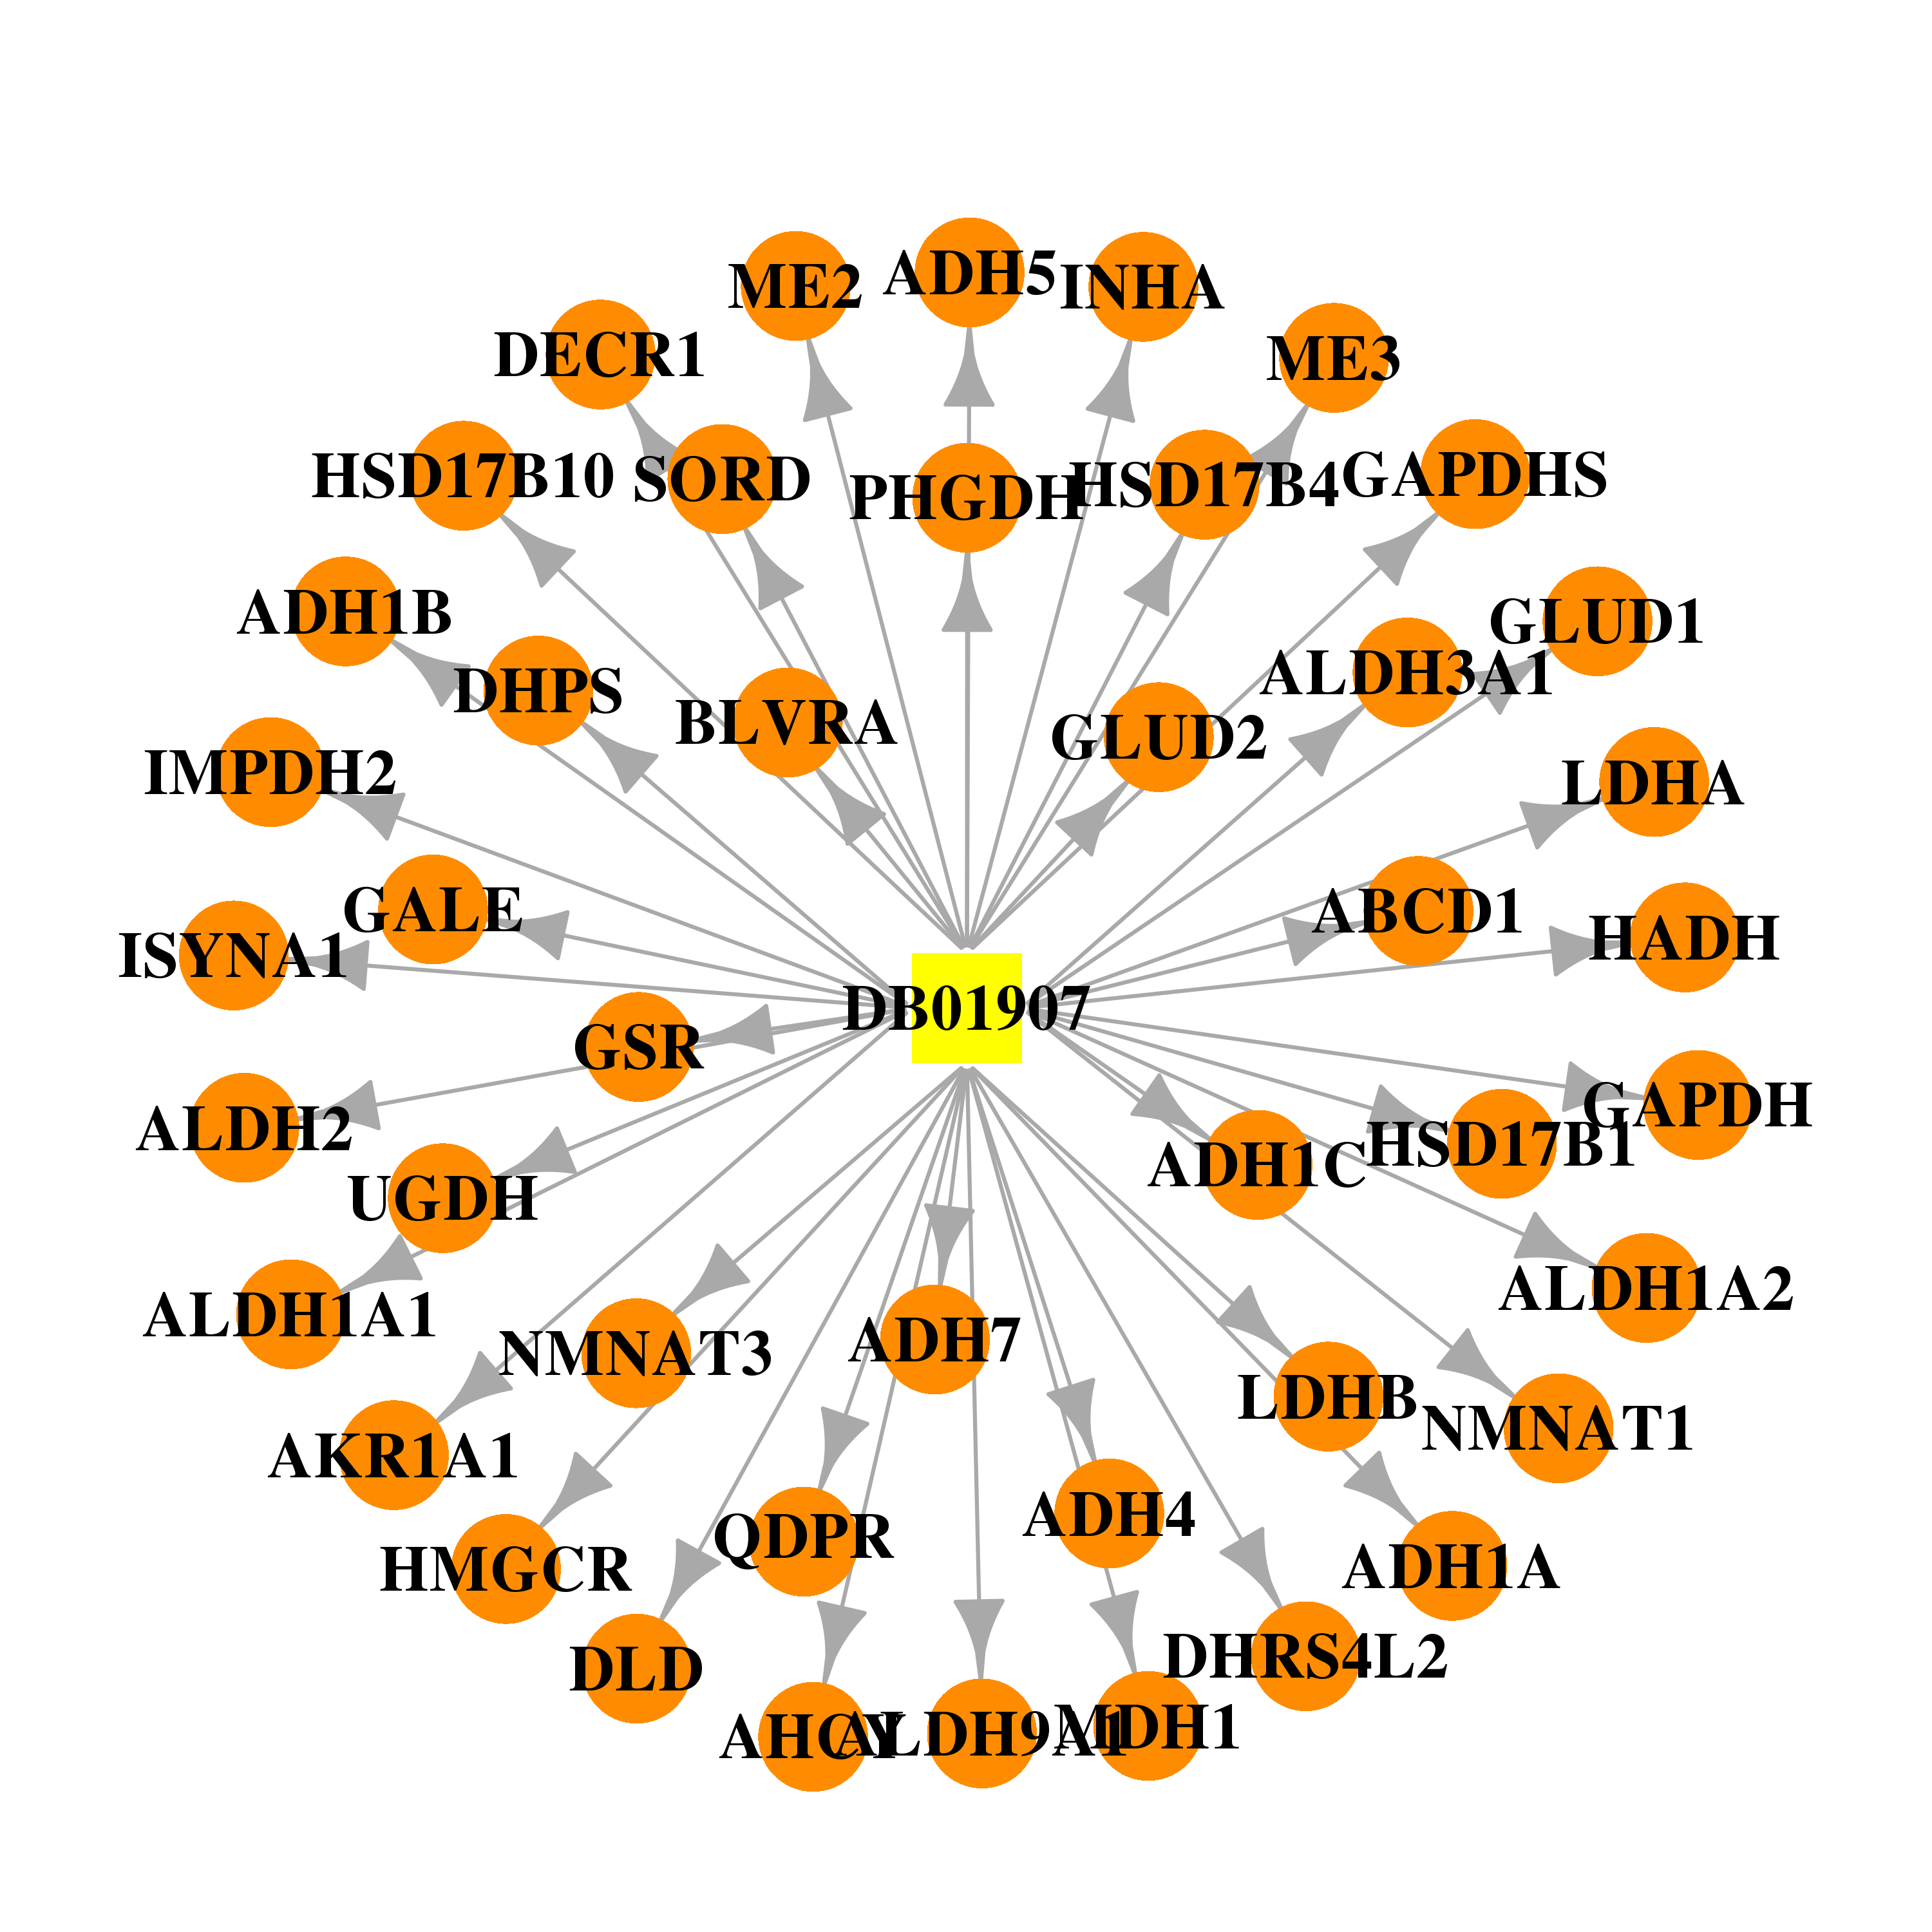 | 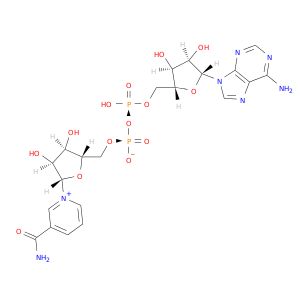 |
| DB04200 | dehydrogenase/reductase (SDR family) member 4 like 2 | experimental | Matairesinol | 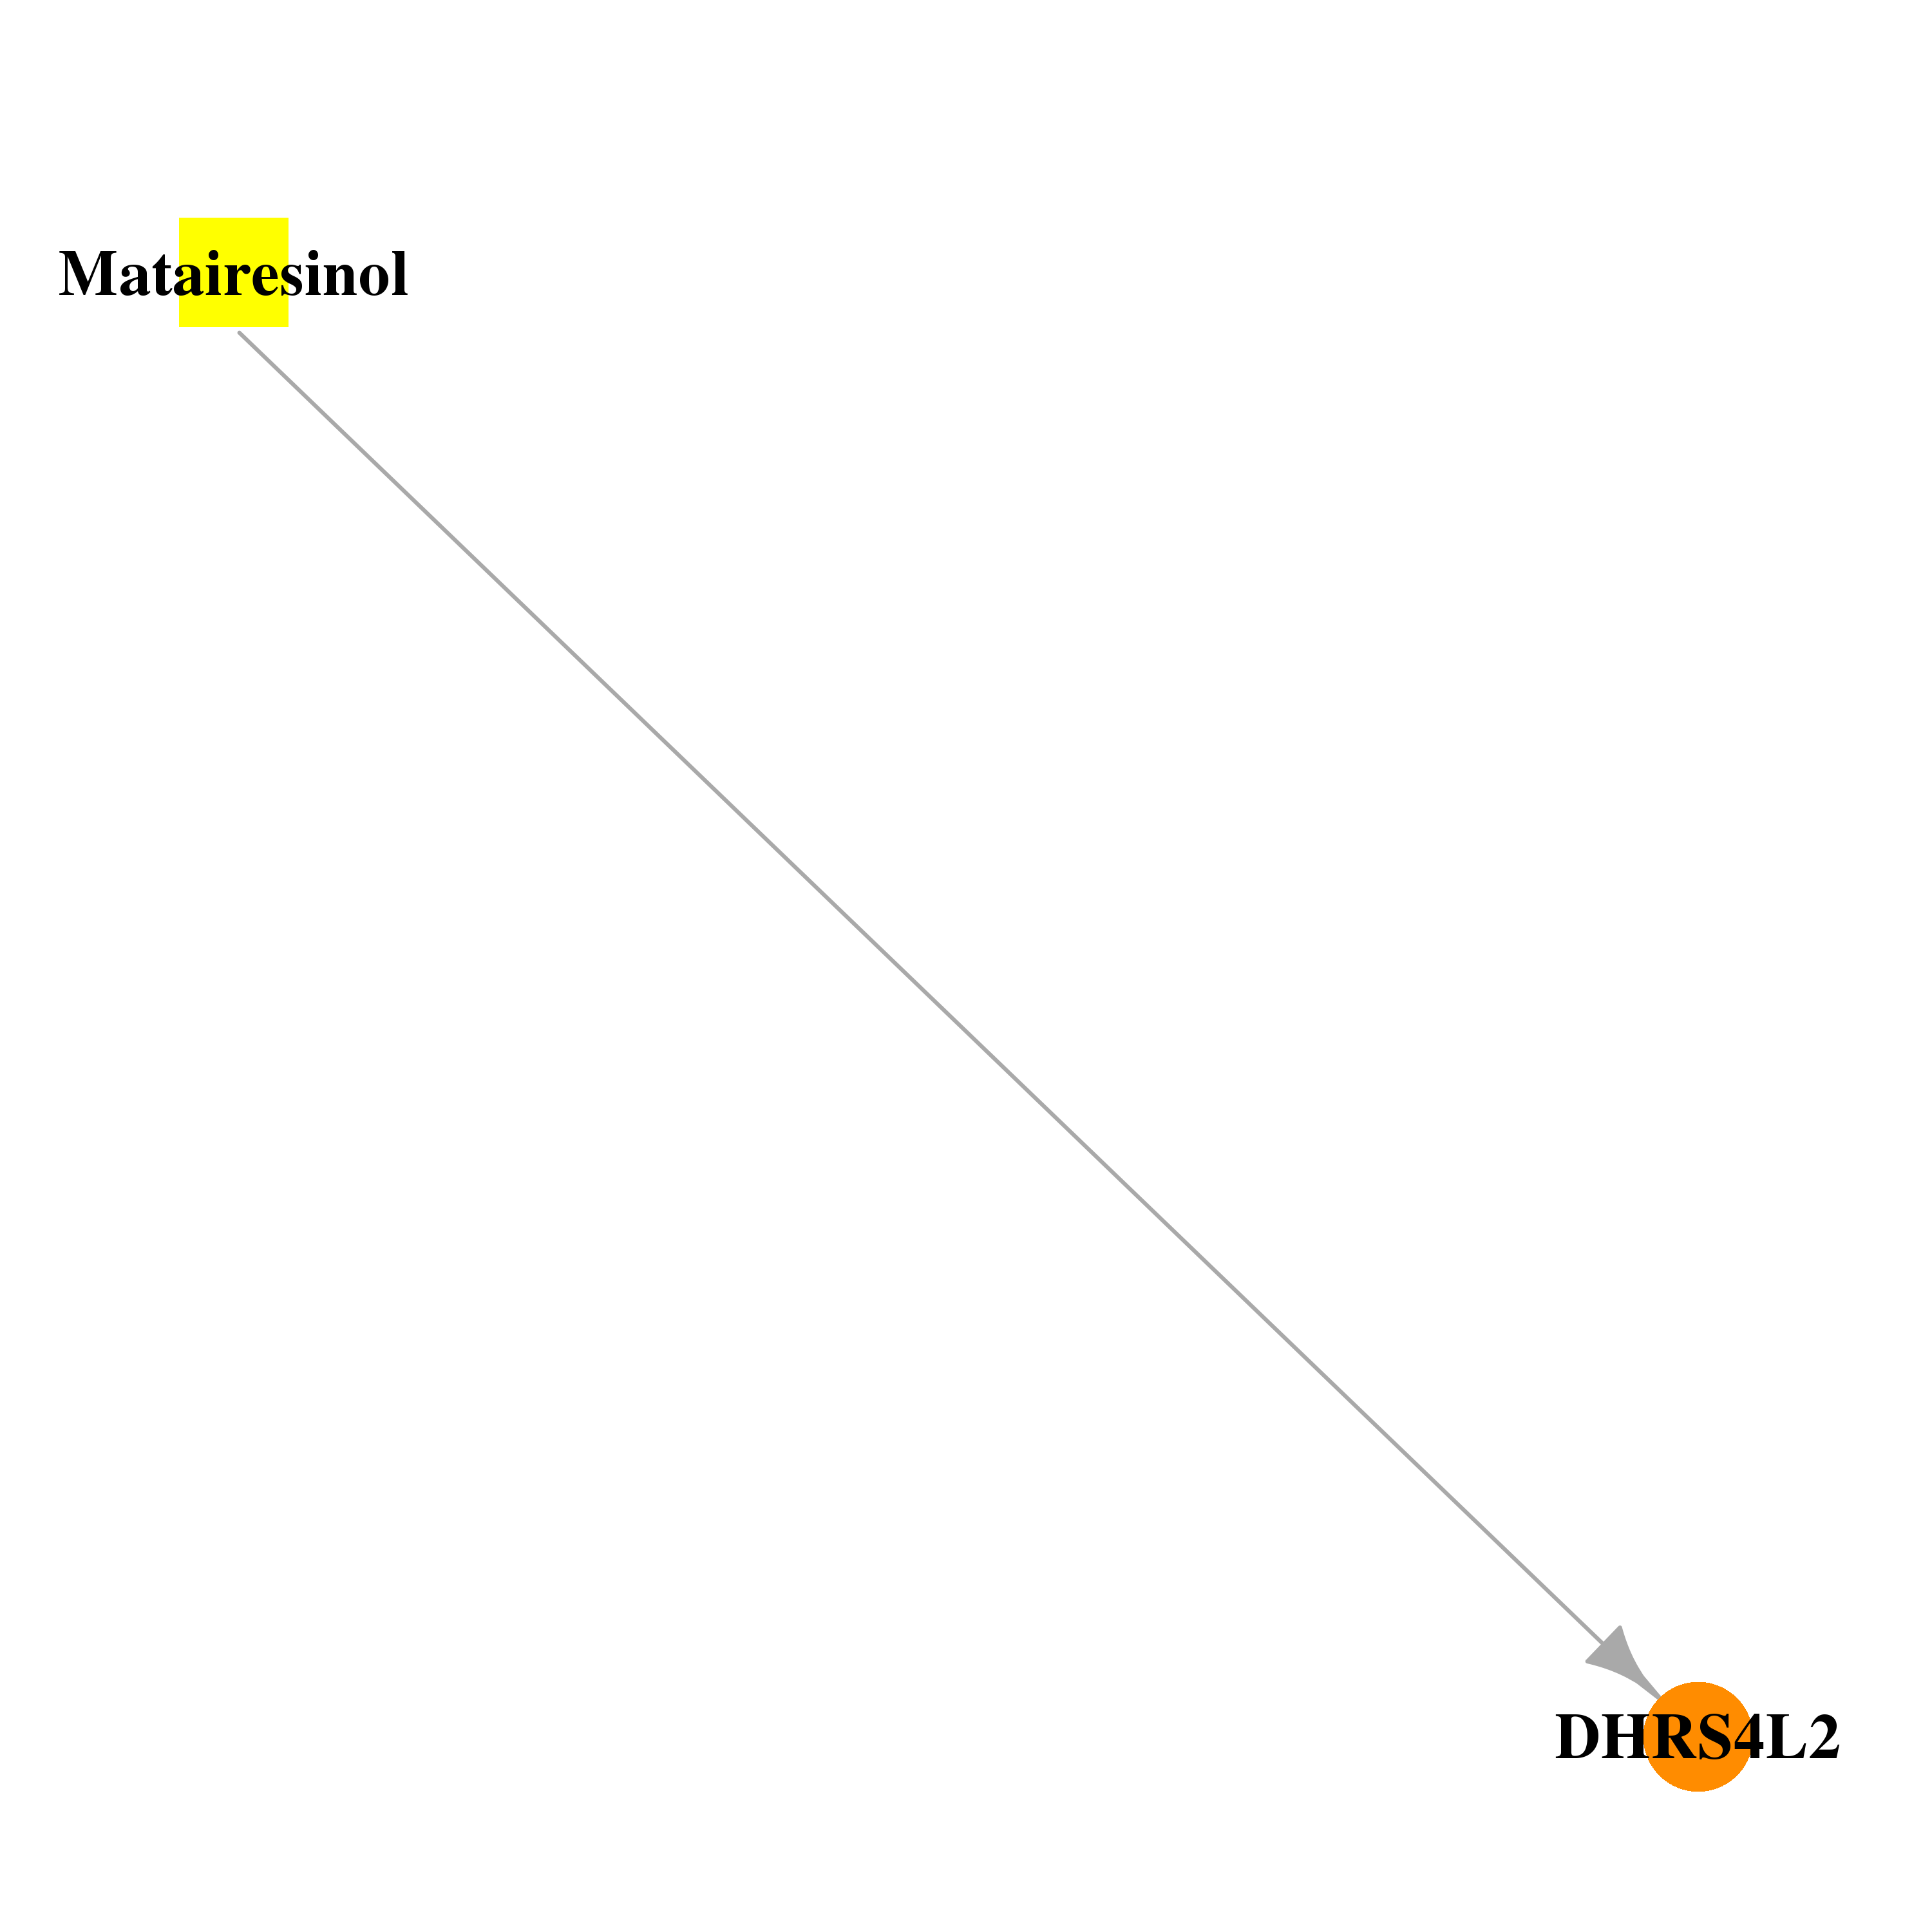 | 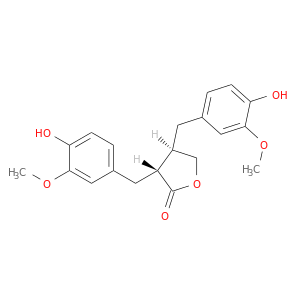 |
| Top |
| Cross referenced IDs for DHRS4L2 |
| * We obtained these cross-references from Uniprot database. It covers 150 different DBs, 18 categories. http://www.uniprot.org/help/cross_references_section |
: Open all cross reference information
|
Copyright © 2016-Present - The Univsersity of Texas Health Science Center at Houston @ |