|
||||||||||||||||||||||||||||||||||||||||||||||||||||||||||||||||||||||||||||||||||||||||||||||||||||||||||||||||||||||||||||||||||||||||||||||||||||||||||||||||||||||||||||||||||||||||||||||||||||||||||||||||||||||||||||||||||||||||||||||||||||||||||||||||||||||||||||||||||||||||||||||||||||||||||||||||||||||||||
| |
| Phenotypic Information (metabolism pathway, cancer, disease, phenome) |
| |
| |
| Gene-Gene Network Information: Co-Expression Network, Interacting Genes & KEGG |
| |
|


| Gene Summary for HNRNPD |
| Top |
| Phenotypic Information for HNRNPD(metabolism pathway, cancer, disease, phenome) |
| Cancer | CGAP: HNRNPD |
| Familial Cancer Database: HNRNPD | |
| * This gene is included in those cancer gene databases. |
|
|
|
|
|
| . | ||||||||||||||||||||||||||||||||||||||||||||||||||||||||||||||||||||||||||||||||||||||||||||||||||||||||||||||||||||||||||||||||||||||||||||||||||||||||||||||||||||||||||||||||||||||||||||||||||||||||||||||||||||||||||||||||||||||||||||||||||||||||||||||||||||||||||||||||||||||||||||||||||||||||||||||||||||
Oncogene 1 | Significant driver gene in | |||||||||||||||||||||||||||||||||||||||||||||||||||||||||||||||||||||||||||||||||||||||||||||||||||||||||||||||||||||||||||||||||||||||||||||||||||||||||||||||||||||||||||||||||||||||||||||||||||||||||||||||||||||||||||||||||||||||||||||||||||||||||||||||||||||||||||||||||||||||||||||||||||||||||||||||||||||||||
| cf) number; DB name 1 Oncogene; http://nar.oxfordjournals.org/content/35/suppl_1/D721.long, 2 Tumor Suppressor gene; https://bioinfo.uth.edu/TSGene/, 3 Cancer Gene Census; http://www.nature.com/nrc/journal/v4/n3/abs/nrc1299.html, 4 CancerGenes; http://nar.oxfordjournals.org/content/35/suppl_1/D721.long, 5 Network of Cancer Gene; http://ncg.kcl.ac.uk/index.php, 1Therapeutic Vulnerabilities in Cancer; http://cbio.mskcc.org/cancergenomics/statius/ |
| REACTOME_METABOLISM_OF_MRNA REACTOME_METABOLISM_OF_RNA | |
| OMIM | 601324; gene. 601324; gene. |
| Orphanet | |
| Disease | KEGG Disease: HNRNPD |
| MedGen: HNRNPD (Human Medical Genetics with Condition) | |
| ClinVar: HNRNPD | |
| Phenotype | MGI: HNRNPD (International Mouse Phenotyping Consortium) |
| PhenomicDB: HNRNPD | |
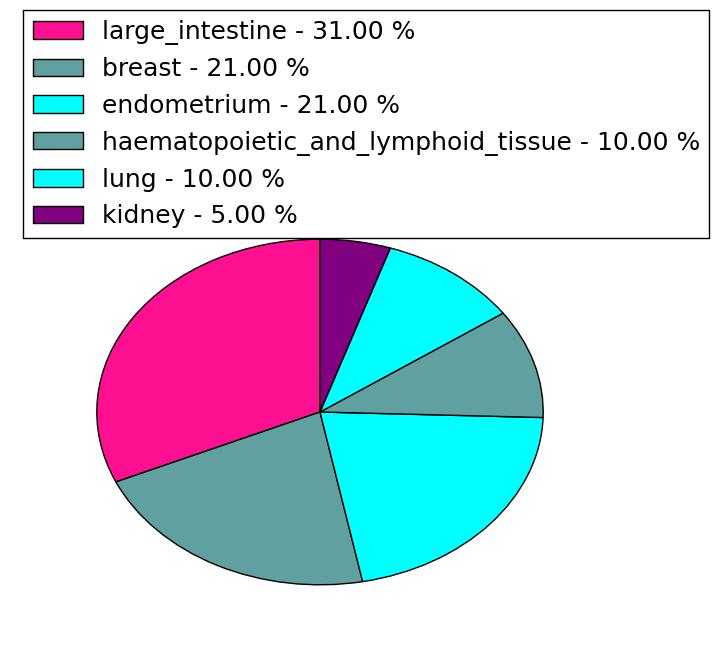
| Mutations for HNRNPD |
| * Under tables are showing count per each tissue to give us broad intuition about tissue specific mutation patterns.You can go to the detailed page for each mutation database's web site. |
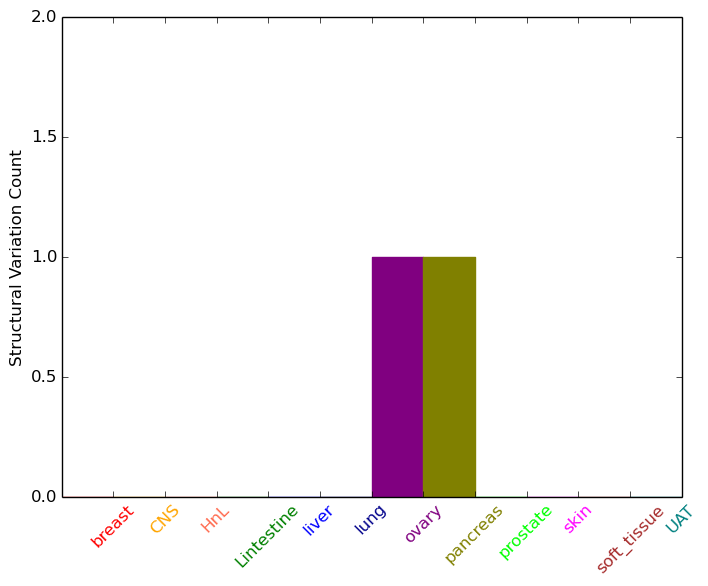
| - Statistics for Tissue and Mutation type | Top |
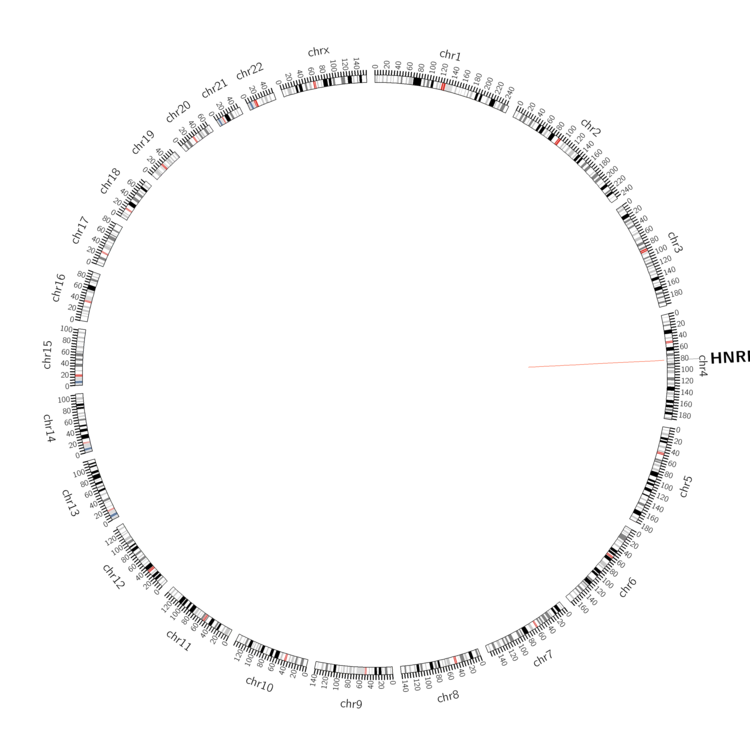 |
| - For Inter-chromosomal Variations |
| There's no inter-chromosomal structural variation. |
| - For Intra-chromosomal Variations |
| * Intra-chromosomal variantions includes 'intrachromosomal amplicon to amplicon', 'intrachromosomal amplicon to non-amplified dna', 'intrachromosomal deletion', 'intrachromosomal fold-back inversion', 'intrachromosomal inversion', 'intrachromosomal tandem duplication', 'Intrachromosomal unknown type', 'intrachromosomal with inverted orientation', 'intrachromosomal with non-inverted orientation'. |
 |
| Sample | Symbol_a | Chr_a | Start_a | End_a | Symbol_b | Chr_b | Start_b | End_b |
| ovary | HNRNPD | chr4 | 83285904 | 83285924 | HNRNPD | chr4 | 83285965 | 83285985 |
| pancreas | HNRNPD | chr4 | 83282561 | 83282581 | chr4 | 83295541 | 83295561 |
| cf) Tissue number; Tissue name (1;Breast, 2;Central_nervous_system, 3;Haematopoietic_and_lymphoid_tissue, 4;Large_intestine, 5;Liver, 6;Lung, 7;Ovary, 8;Pancreas, 9;Prostate, 10;Skin, 11;Soft_tissue, 12;Upper_aerodigestive_tract) |
| * From mRNA Sanger sequences, Chitars2.0 arranged chimeric transcripts. This table shows HNRNPD related fusion information. |
| ID | Head Gene | Tail Gene | Accession | Gene_a | qStart_a | qEnd_a | Chromosome_a | tStart_a | tEnd_a | Gene_a | qStart_a | qEnd_a | Chromosome_a | tStart_a | tEnd_a |
| BF096106 | NFE2L2 | 16 | 213 | 2 | 178096309 | 178096506 | HNRNPD | 209 | 575 | 4 | 83275272 | 83278599 | |
| BE646088 | HNRNPD | 17 | 136 | 4 | 83275139 | 83275258 | VAMP2 | 134 | 339 | 17 | 8063452 | 8063657 | |
| AA010774 | LAMB2 | 1 | 183 | 3 | 49162488 | 49162755 | HNRNPD | 180 | 232 | 4 | 83275291 | 83275343 | |
| DA569517 | RILPL2 | 1 | 613 | 12 | 123907633 | 123921017 | HNRNPD | 613 | 761 | 4 | 83280731 | 83294626 | |
| BU632297 | NHP2L1 | 19 | 171 | 22 | 42070813 | 42070965 | HNRNPD | 170 | 646 | 4 | 83278036 | 83280793 | |
| DB050538 | HNRNPD | 1 | 96 | 4 | 83295053 | 83295148 | ELL | 93 | 567 | 19 | 18554825 | 18555299 | |
| BM835099 | HNRNPD | 1 | 282 | 4 | 83294848 | 83295133 | NOL6 | 276 | 447 | 9 | 33465827 | 33466171 | |
| BF096260 | PDCD10 | 337 | 359 | 3 | 167446609 | 167446632 | HNRNPD | 350 | 625 | 4 | 83276455 | 83277976 | |
| BF805251 | PPDPF | 1 | 142 | 20 | 62152884 | 62153103 | HNRNPD | 133 | 360 | 4 | 83278003 | 83279861 | |
| BE935692 | GRHL2 | 51 | 76 | 8 | 102629161 | 102629189 | HNRNPD | 61 | 241 | 4 | 83284033 | 83284211 | |
| BF096098 | PDCD10 | 337 | 359 | 3 | 167446609 | 167446632 | HNRNPD | 350 | 625 | 4 | 83276455 | 83277976 | |
| BG999638 | HNRNPD | 5 | 318 | 4 | 83293008 | 83293322 | HNRNPD | 305 | 448 | 4 | 83284057 | 83284200 | |
| BG988244 | HNRNPD | 4 | 291 | 4 | 83275185 | 83275470 | TMEM67 | 292 | 518 | 8 | 94828925 | 94829151 | |
| DA845763 | RASGRF1 | 1 | 242 | 15 | 79296310 | 79298561 | HNRNPD | 227 | 563 | 4 | 83294752 | 83295087 | |
| BF805263 | PPDPF | 12 | 142 | 20 | 62152884 | 62153092 | HNRNPD | 133 | 360 | 4 | 83278003 | 83279861 | |
| Top |
| Mutation type/ Tissue ID | brca | cns | cerv | endome | haematopo | kidn | Lintest | liver | lung | ns | ovary | pancre | prost | skin | stoma | thyro | urina | |||
| Total # sample | 1 | |||||||||||||||||||
| GAIN (# sample) | 1 | |||||||||||||||||||
| LOSS (# sample) |
| cf) Tissue ID; Tissue type (1; Breast, 2; Central_nervous_system, 3; Cervix, 4; Endometrium, 5; Haematopoietic_and_lymphoid_tissue, 6; Kidney, 7; Large_intestine, 8; Liver, 9; Lung, 10; NS, 11; Ovary, 12; Pancreas, 13; Prostate, 14; Skin, 15; Stomach, 16; Thyroid, 17; Urinary_tract) |
| Top |
|
 |
| Top |
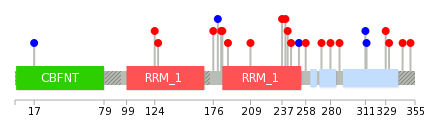
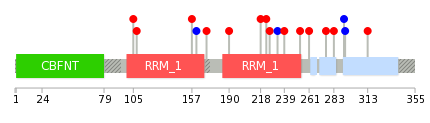
| Stat. for Non-Synonymous SNVs (# total SNVs=19) | (# total SNVs=5) |
 |  |
(# total SNVs=1) | (# total SNVs=0) |
 |
| Top |
| * When you move the cursor on each content, you can see more deailed mutation information on the Tooltip. Those are primary_site,primary_histology,mutation(aa),pubmedID. |
| GRCh37 position | Mutation(aa) | Unique sampleID count |
| chr4:83278594-83278594 | p.E209* | 2 |
| chr4:83276503-83276503 | p.S351N | 1 |
| chr4:83278046-83278046 | p.C252C | 1 |
| chr4:83279893-83279893 | p.P180P | 1 |
| chr4:83276523-83276523 | p.R344S | 1 |
| chr4:83278485-83278485 | p.H245R | 1 |
| chr4:83279905-83279905 | p.K176N | 1 |
| chr4:83277695-83277695 | p.Y332C | 1 |
| chr4:83278493-83278493 | p.K242N | 1 |
| chr4:83280638-83280638 | p.E149* | 1 |
| Top |
|
 |
| Point Mutation/ Tissue ID | 1 | 2 | 3 | 4 | 5 | 6 | 7 | 8 | 9 | 10 | 11 | 12 | 13 | 14 | 15 | 16 | 17 | 18 | 19 | 20 |
| # sample | 1 | 1 | 6 | 1 | 2 | 1 | 1 | 5 | ||||||||||||
| # mutation | 1 | 1 | 6 | 1 | 2 | 1 | 1 | 5 | ||||||||||||
| nonsynonymous SNV | 1 | 1 | 5 | 1 | 1 | 1 | 4 | |||||||||||||
| synonymous SNV | 1 | 1 | 1 | 1 |
| cf) Tissue ID; Tissue type (1; BLCA[Bladder Urothelial Carcinoma], 2; BRCA[Breast invasive carcinoma], 3; CESC[Cervical squamous cell carcinoma and endocervical adenocarcinoma], 4; COAD[Colon adenocarcinoma], 5; GBM[Glioblastoma multiforme], 6; Glioma Low Grade, 7; HNSC[Head and Neck squamous cell carcinoma], 8; KICH[Kidney Chromophobe], 9; KIRC[Kidney renal clear cell carcinoma], 10; KIRP[Kidney renal papillary cell carcinoma], 11; LAML[Acute Myeloid Leukemia], 12; LUAD[Lung adenocarcinoma], 13; LUSC[Lung squamous cell carcinoma], 14; OV[Ovarian serous cystadenocarcinoma ], 15; PAAD[Pancreatic adenocarcinoma], 16; PRAD[Prostate adenocarcinoma], 17; SKCM[Skin Cutaneous Melanoma], 18:STAD[Stomach adenocarcinoma], 19:THCA[Thyroid carcinoma], 20:UCEC[Uterine Corpus Endometrial Carcinoma]) |
| Top |
| * We represented just top 10 SNVs. When you move the cursor on each content, you can see more deailed mutation information on the Tooltip. Those are primary_site, primary_histology, mutation(aa), pubmedID. |
| Genomic Position | Mutation(aa) | Unique sampleID count |
| chr4:83276503 | p.T108I,HNRNPD | 1 |
| chr4:83278508 | p.S283N,HNRNPD | 1 |
| chr4:83276523 | p.V105I,HNRNPD | 1 |
| chr4:83278594 | p.R276S,HNRNPD | 1 |
| chr4:83277695 | p.Y313C,HNRNPD | 1 |
| chr4:83279868 | p.Y293Y,HNRNPD | 1 |
| chr4:83277754 | p.G292G,HNRNPD | 1 |
| chr4:83279893 | p.R261C,HNRNPD | 1 |
| chr4:83277757 | p.R253K,HNRNPD | 1 |
| chr4:83279905 | p.M239V,HNRNPD | 1 |
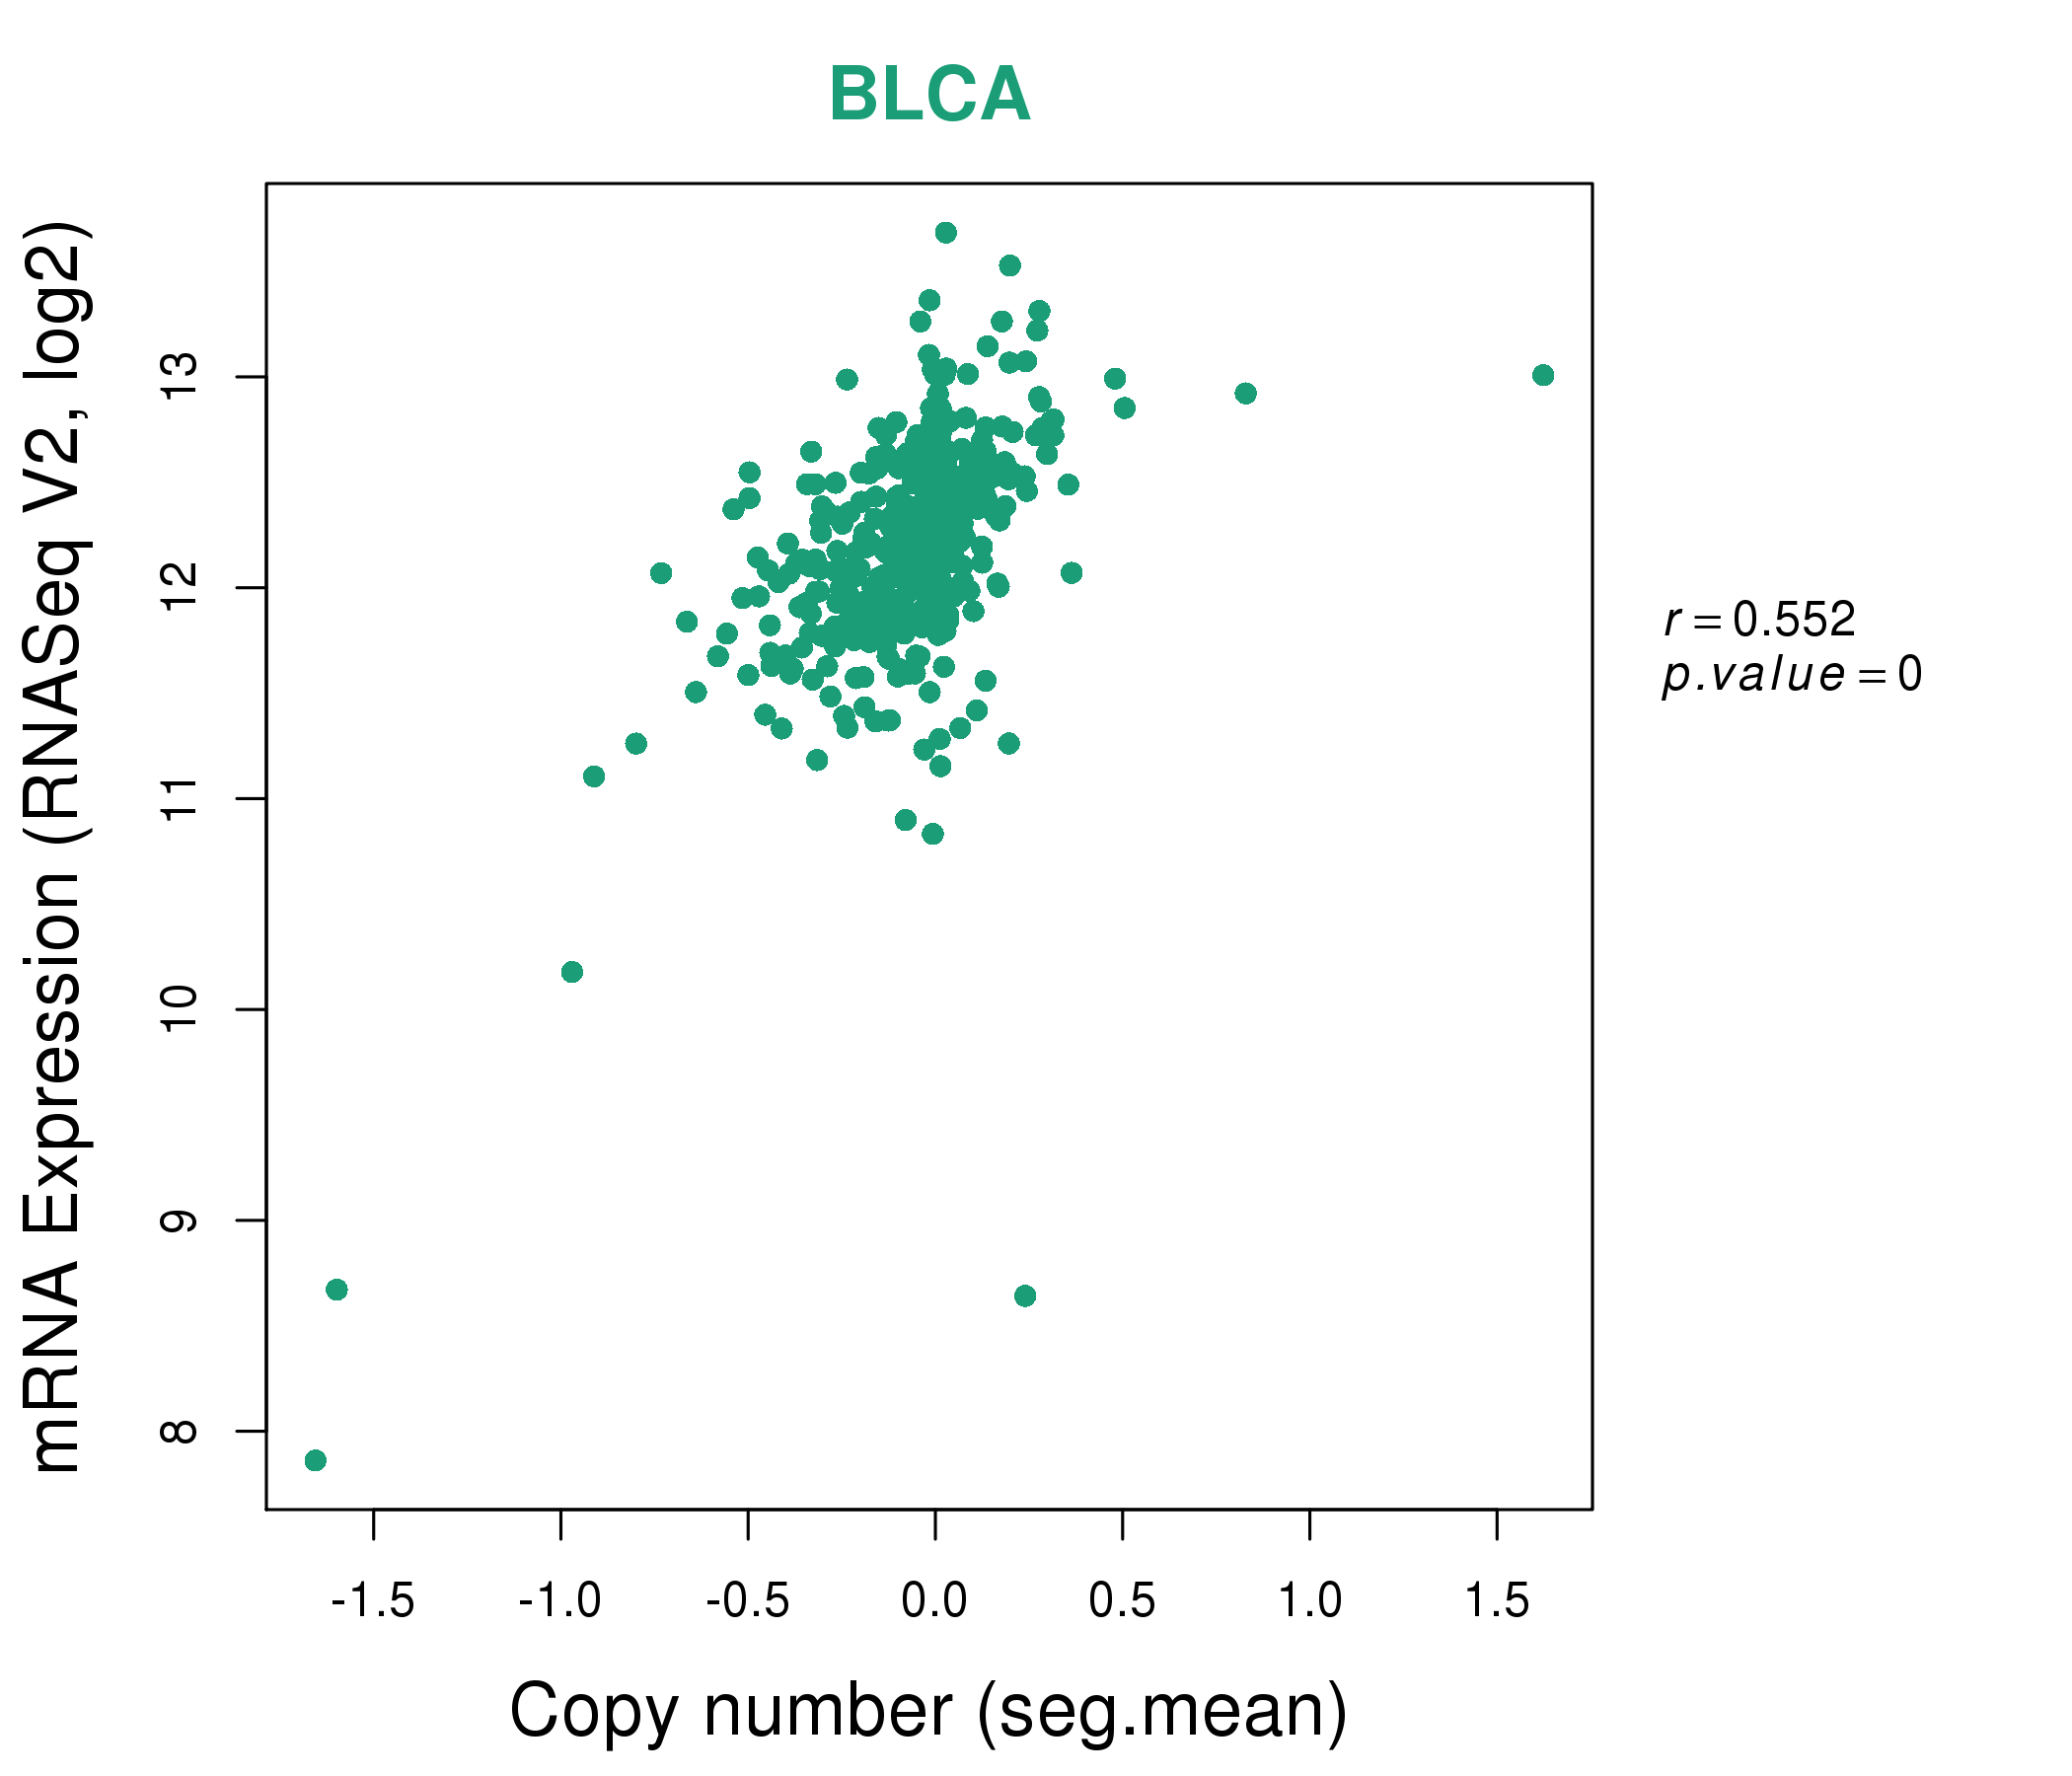
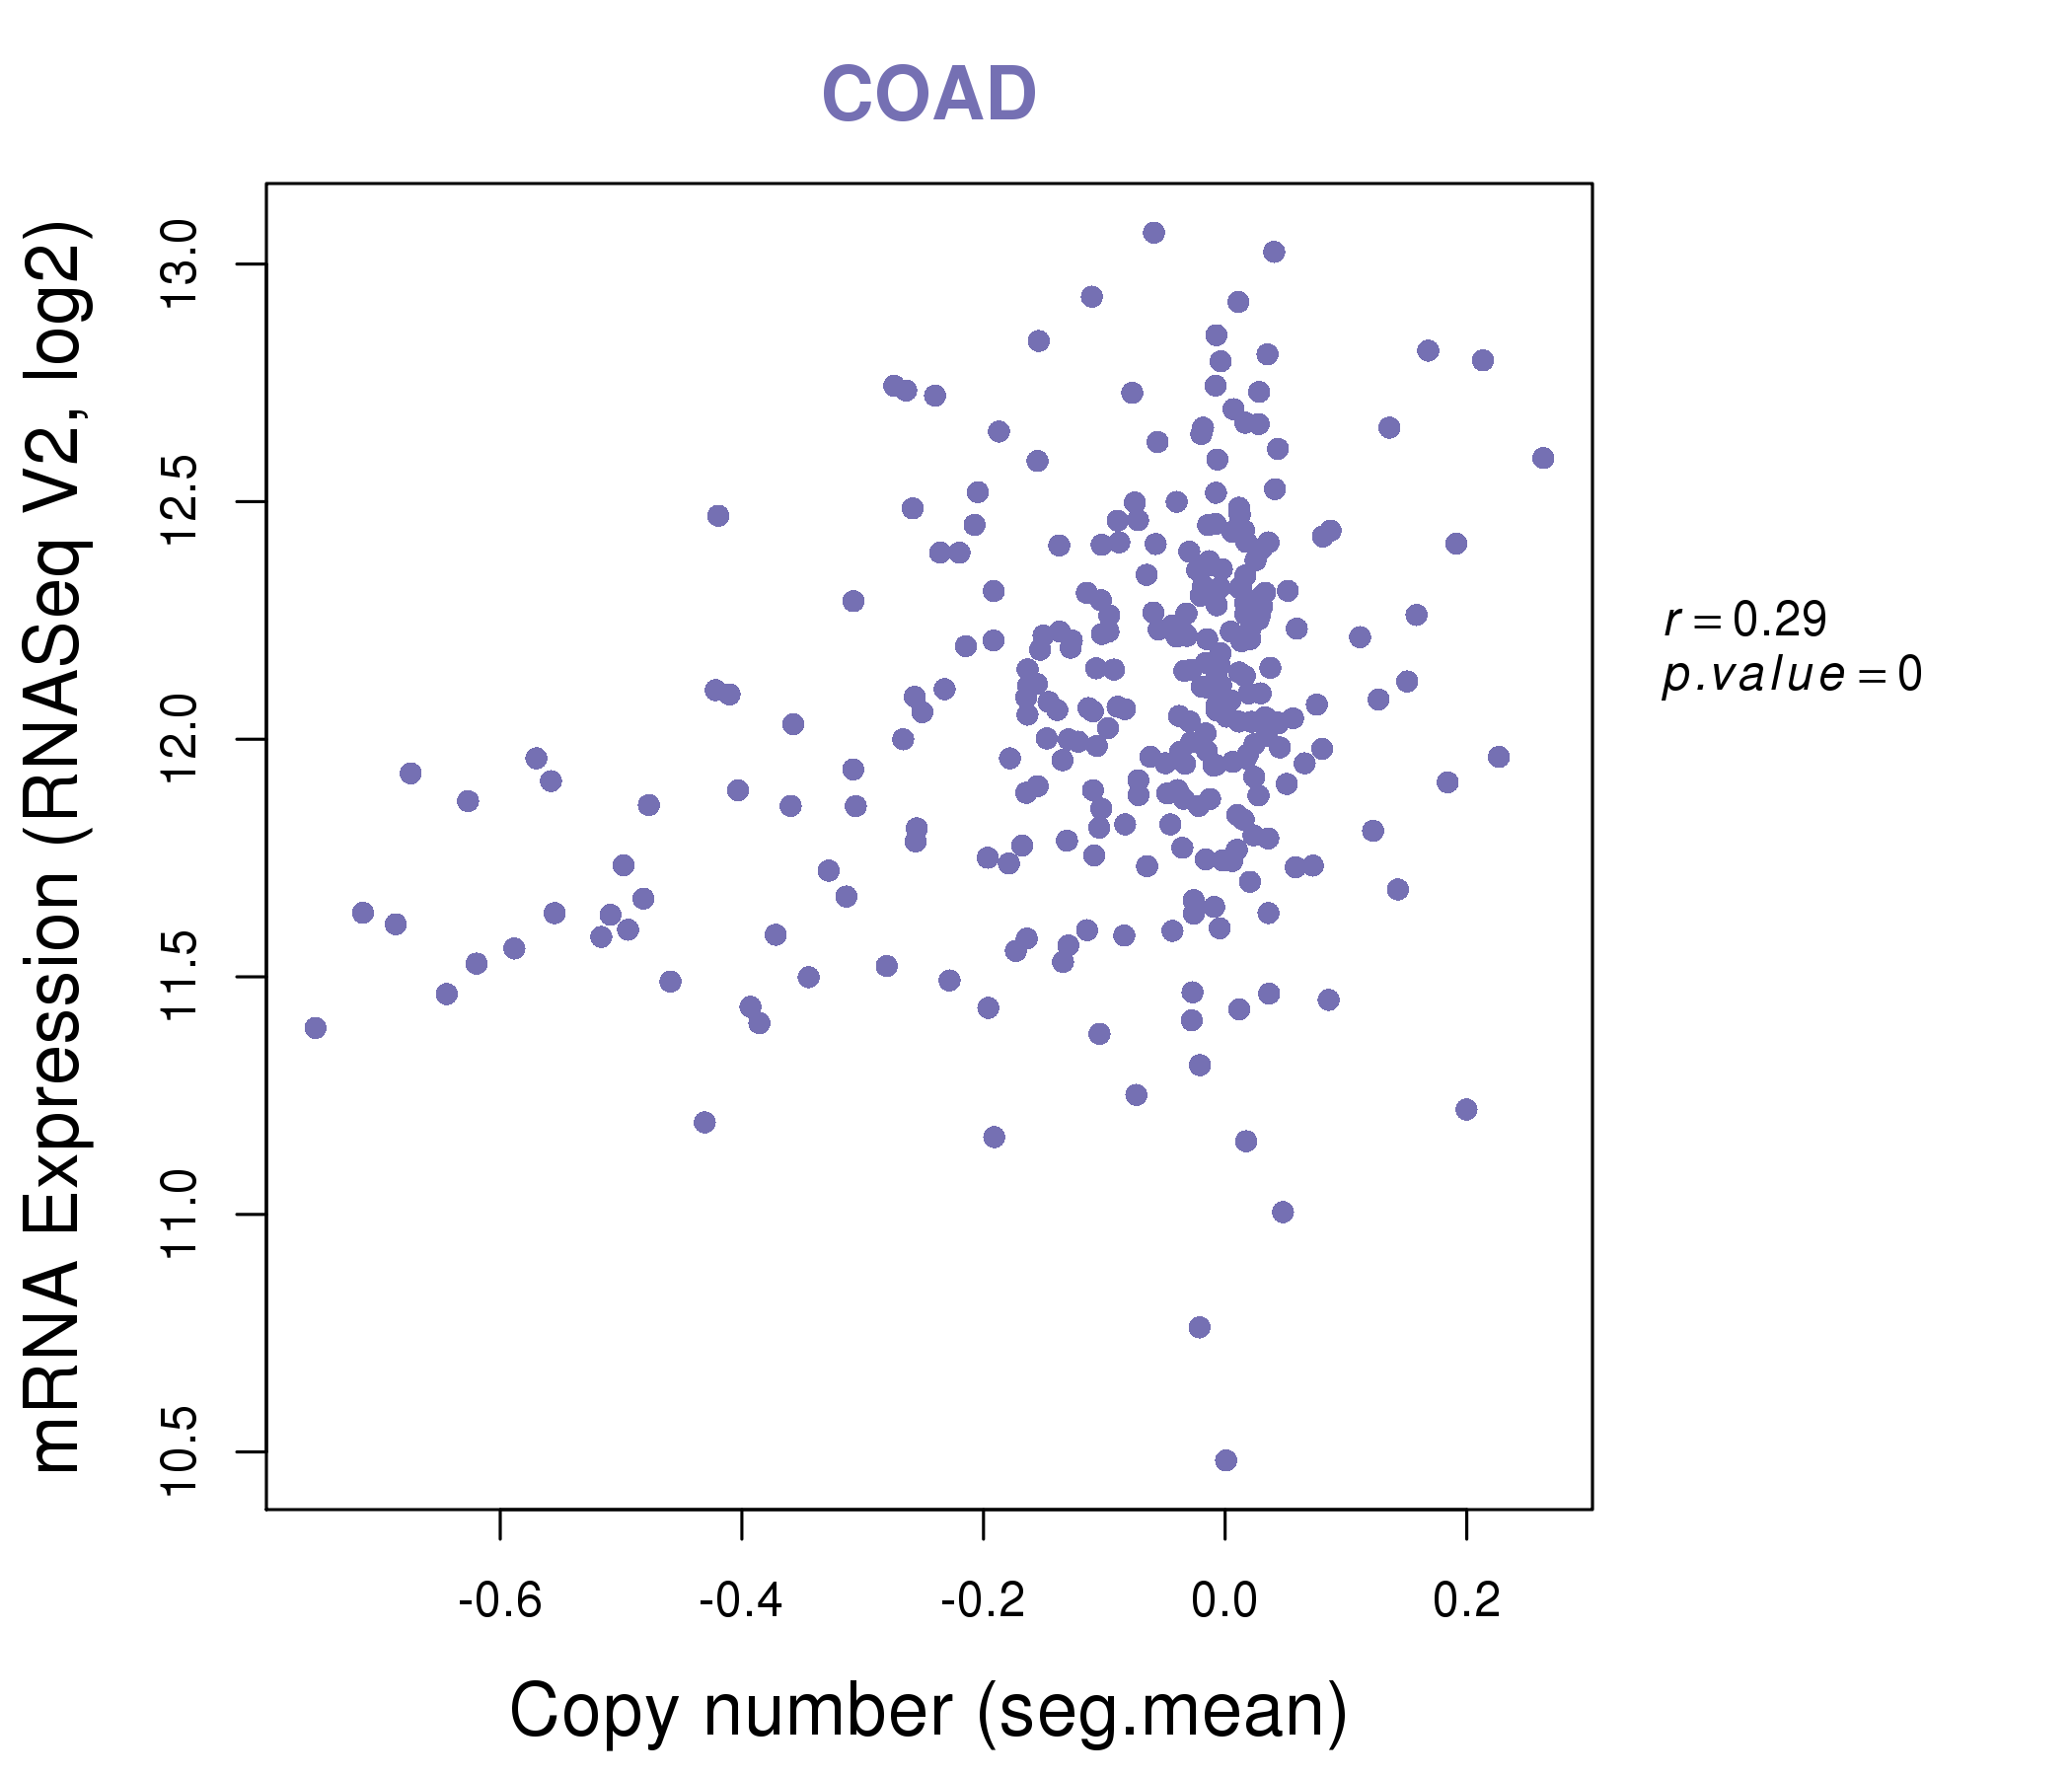
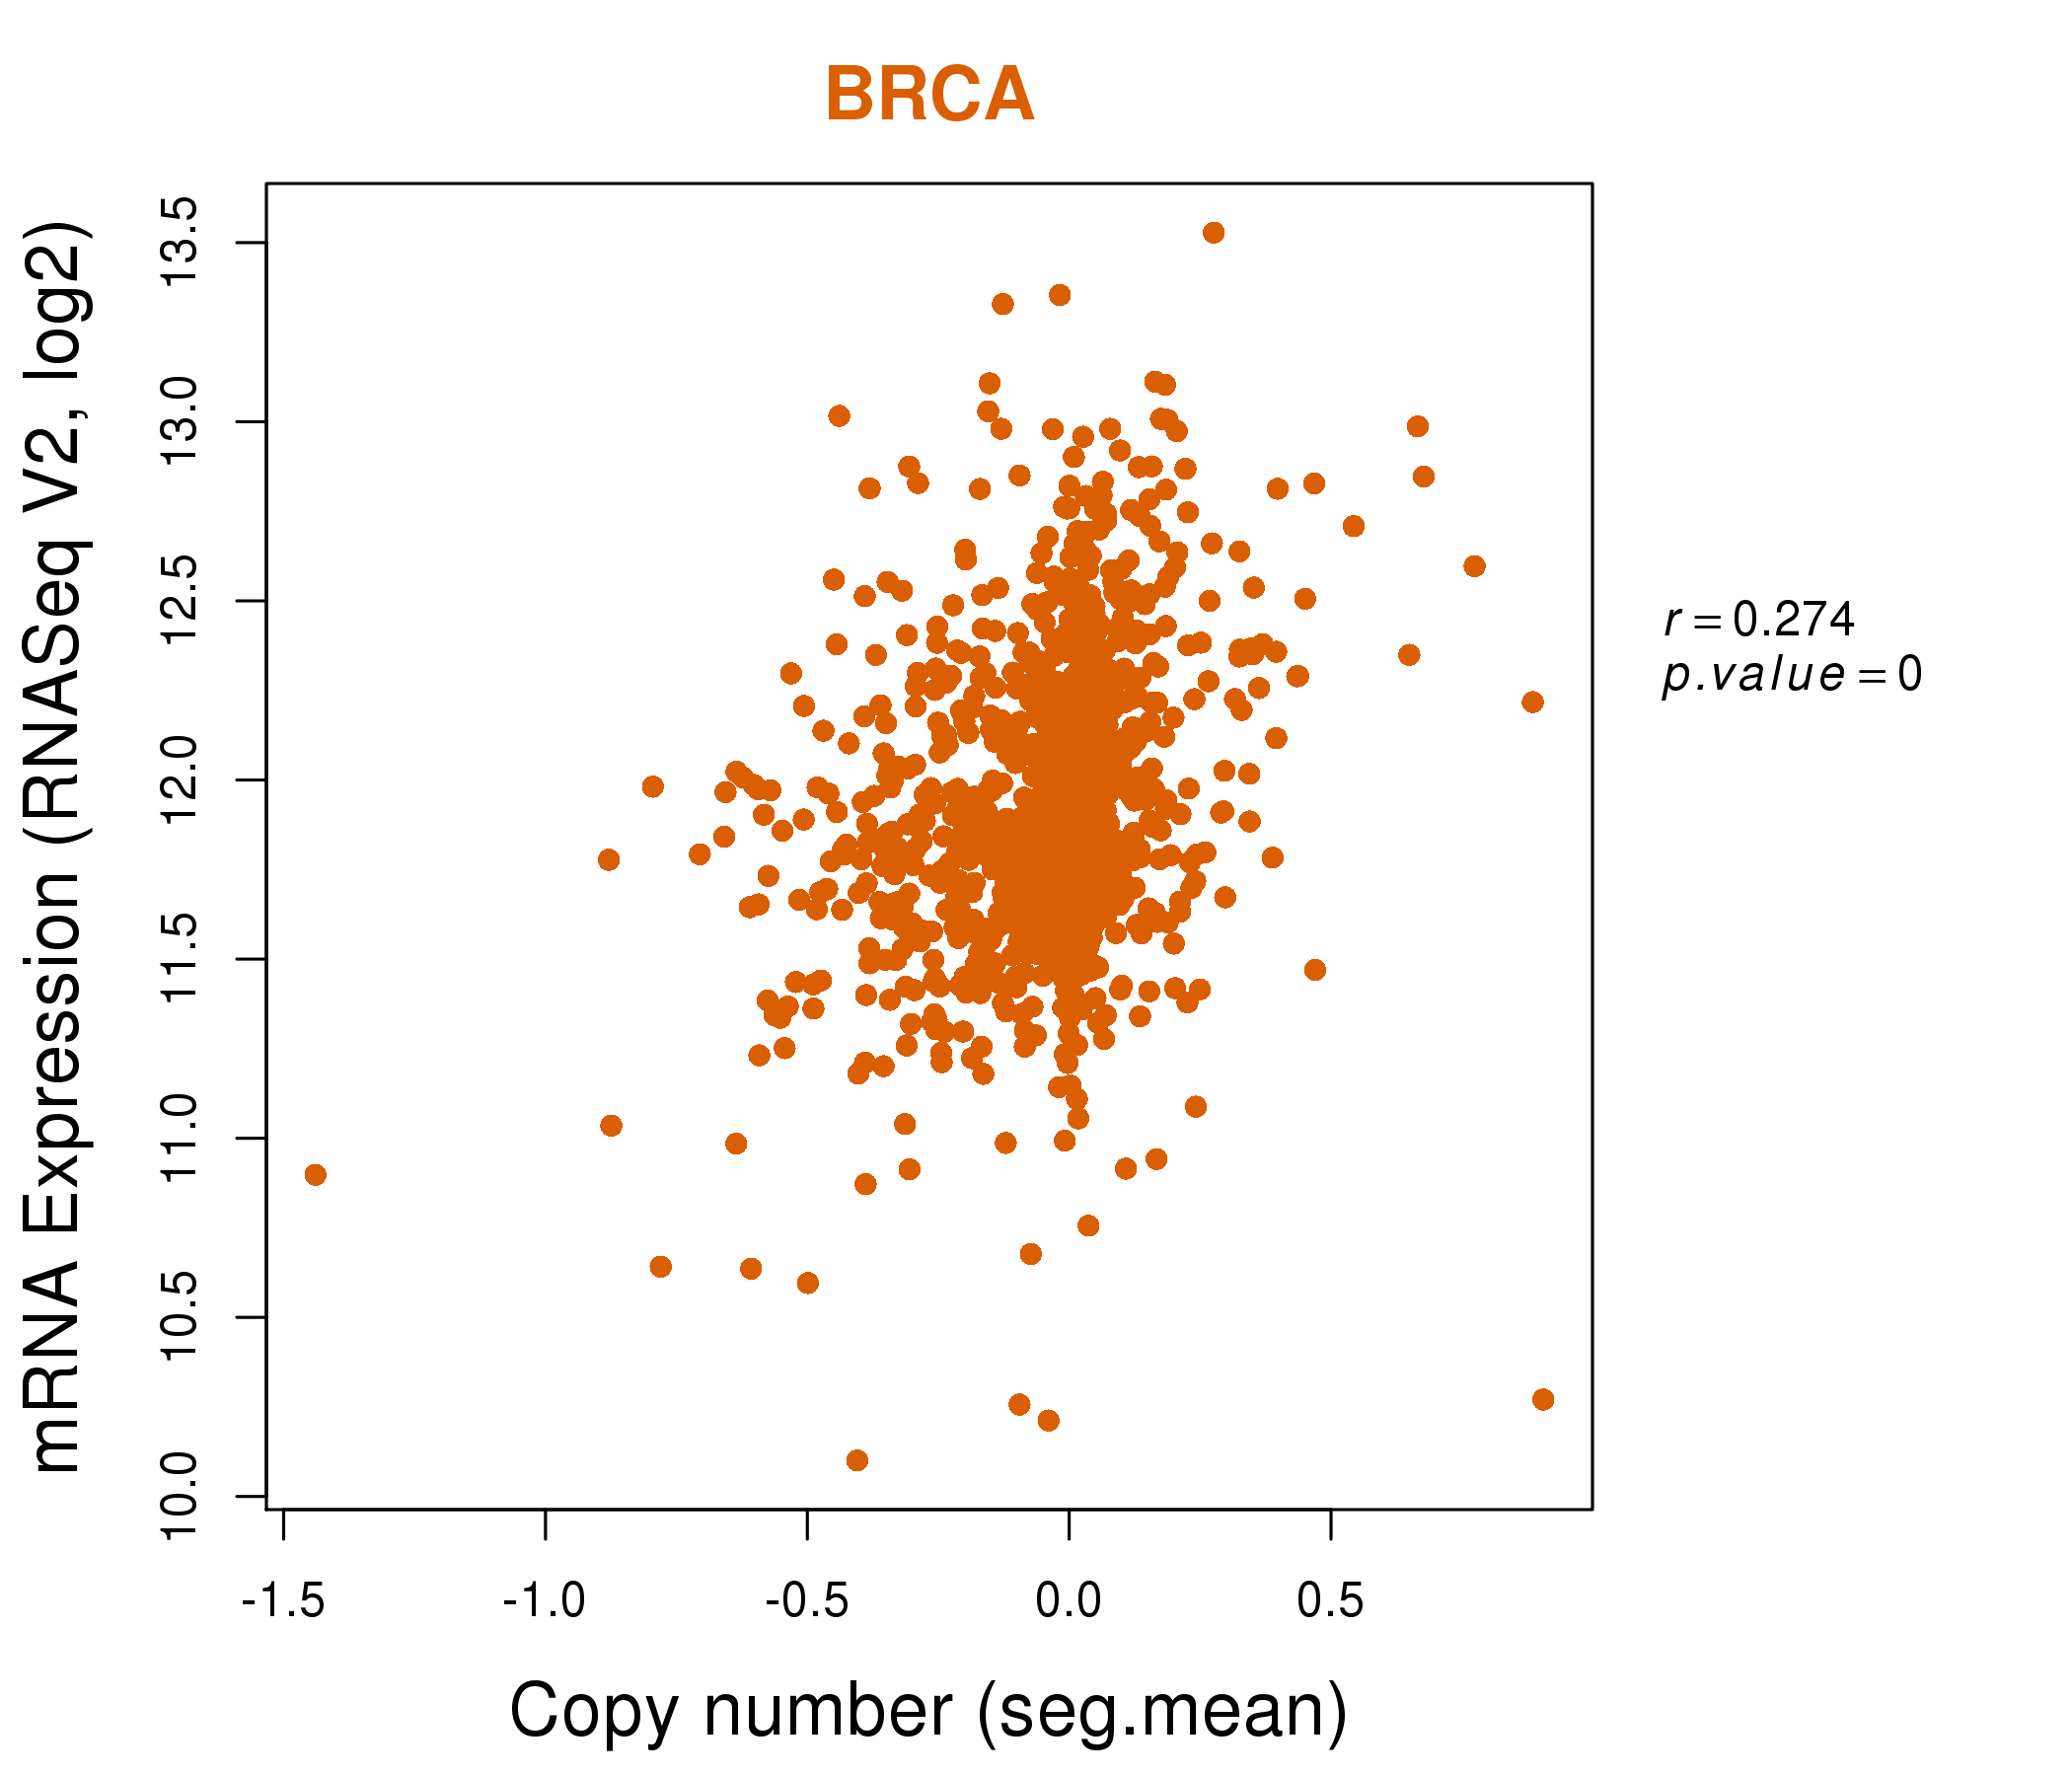
| * Copy number data were extracted from TCGA using R package TCGA-Assembler. The URLs of all public data files on TCGA DCC data server were gathered on Jan-05-2015. Function ProcessCNAData in TCGA-Assembler package was used to obtain gene-level copy number value which is calculated as the average copy number of the genomic region of a gene. |
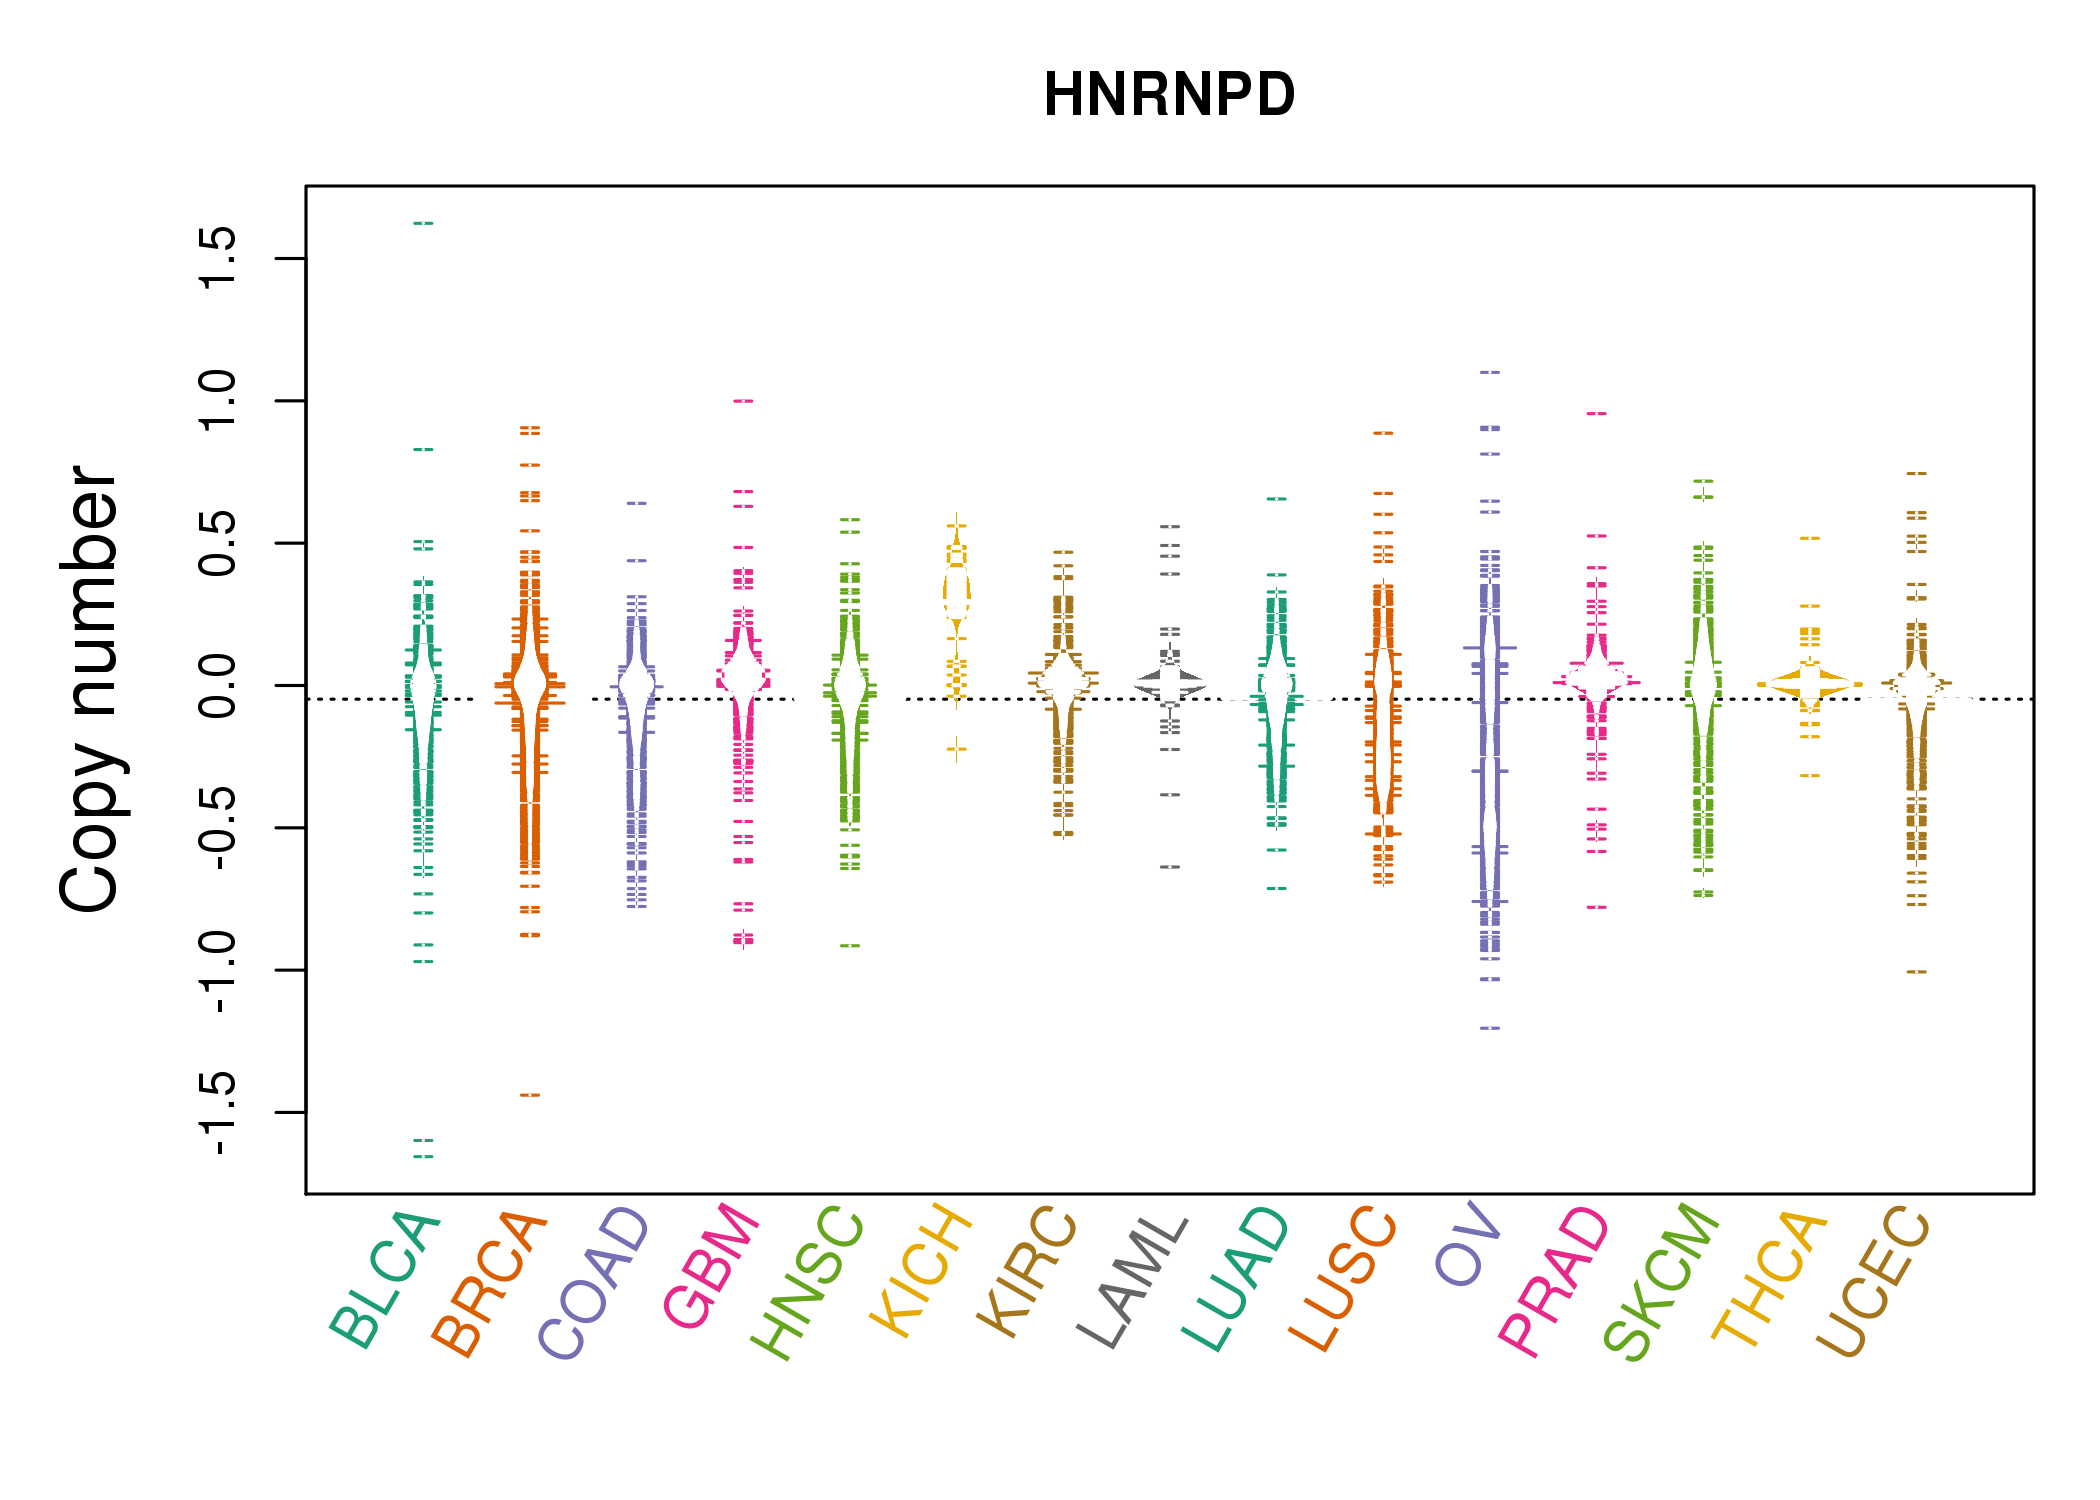 |
| cf) Tissue ID[Tissue type]: BLCA[Bladder Urothelial Carcinoma], BRCA[Breast invasive carcinoma], CESC[Cervical squamous cell carcinoma and endocervical adenocarcinoma], COAD[Colon adenocarcinoma], GBM[Glioblastoma multiforme], Glioma Low Grade, HNSC[Head and Neck squamous cell carcinoma], KICH[Kidney Chromophobe], KIRC[Kidney renal clear cell carcinoma], KIRP[Kidney renal papillary cell carcinoma], LAML[Acute Myeloid Leukemia], LUAD[Lung adenocarcinoma], LUSC[Lung squamous cell carcinoma], OV[Ovarian serous cystadenocarcinoma ], PAAD[Pancreatic adenocarcinoma], PRAD[Prostate adenocarcinoma], SKCM[Skin Cutaneous Melanoma], STAD[Stomach adenocarcinoma], THCA[Thyroid carcinoma], UCEC[Uterine Corpus Endometrial Carcinoma] |
| Top |
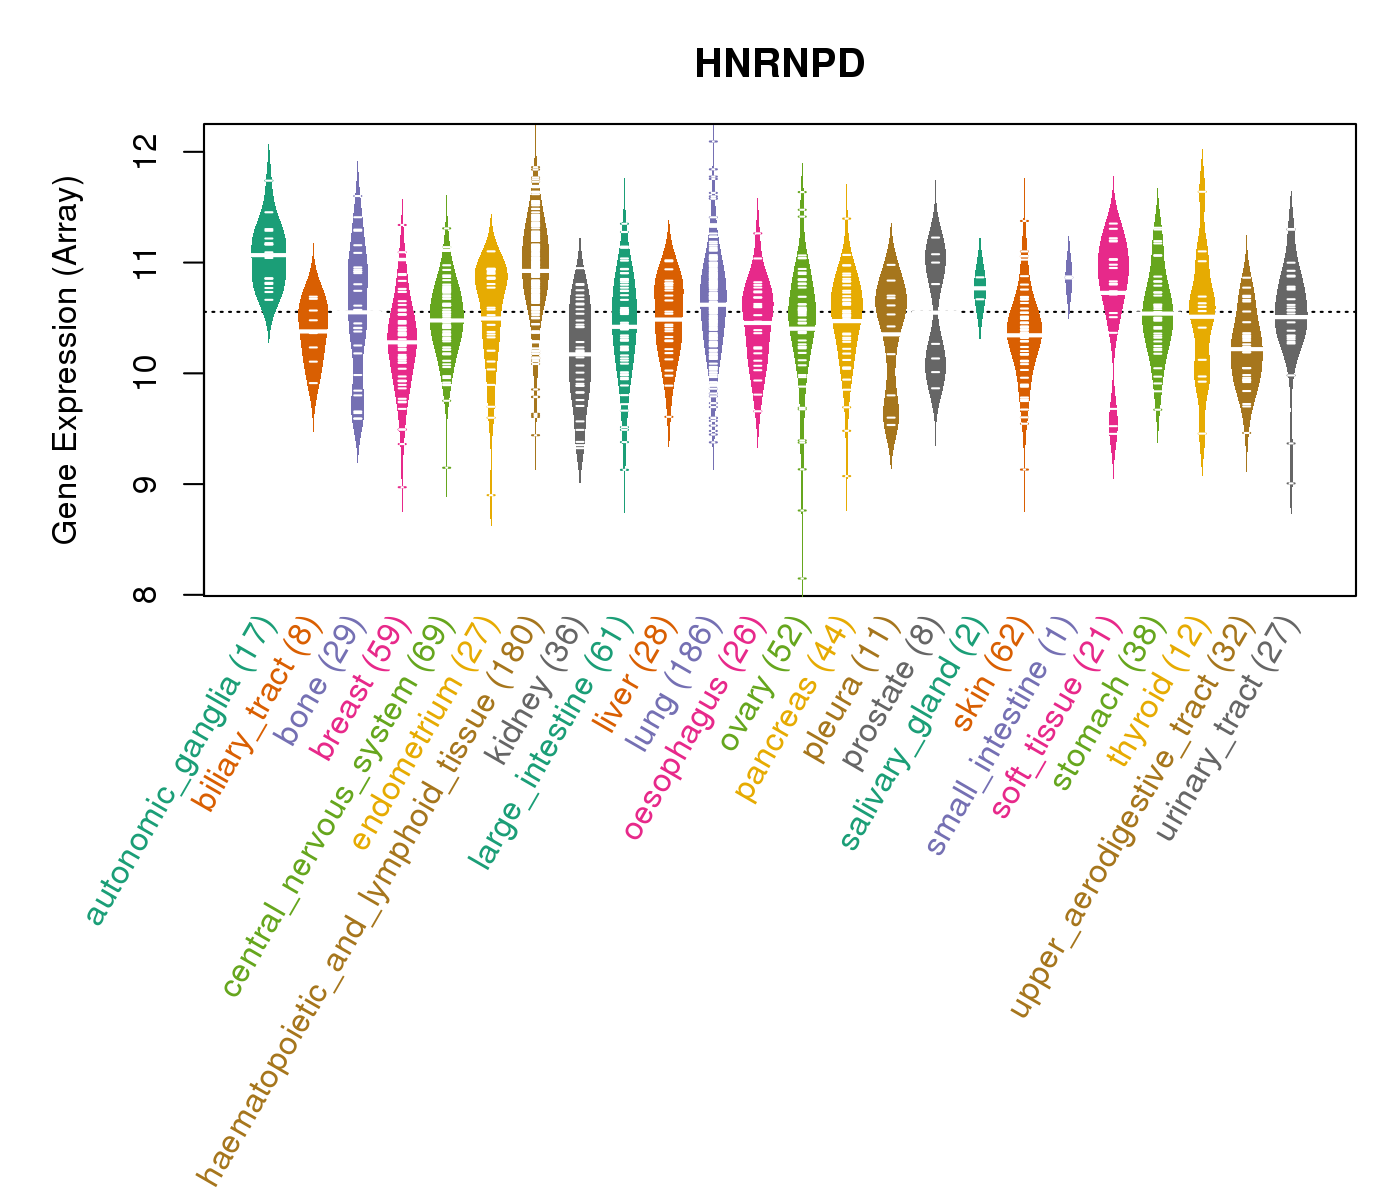
| Gene Expression for HNRNPD |
| * CCLE gene expression data were extracted from CCLE_Expression_Entrez_2012-10-18.res: Gene-centric RMA-normalized mRNA expression data. |
 |
| * Normalized gene expression data of RNASeqV2 was extracted from TCGA using R package TCGA-Assembler. The URLs of all public data files on TCGA DCC data server were gathered at Jan-05-2015. Only eight cancer types have enough normal control samples for differential expression analysis. (t test, adjusted p<0.05 (using Benjamini-Hochberg FDR)) |
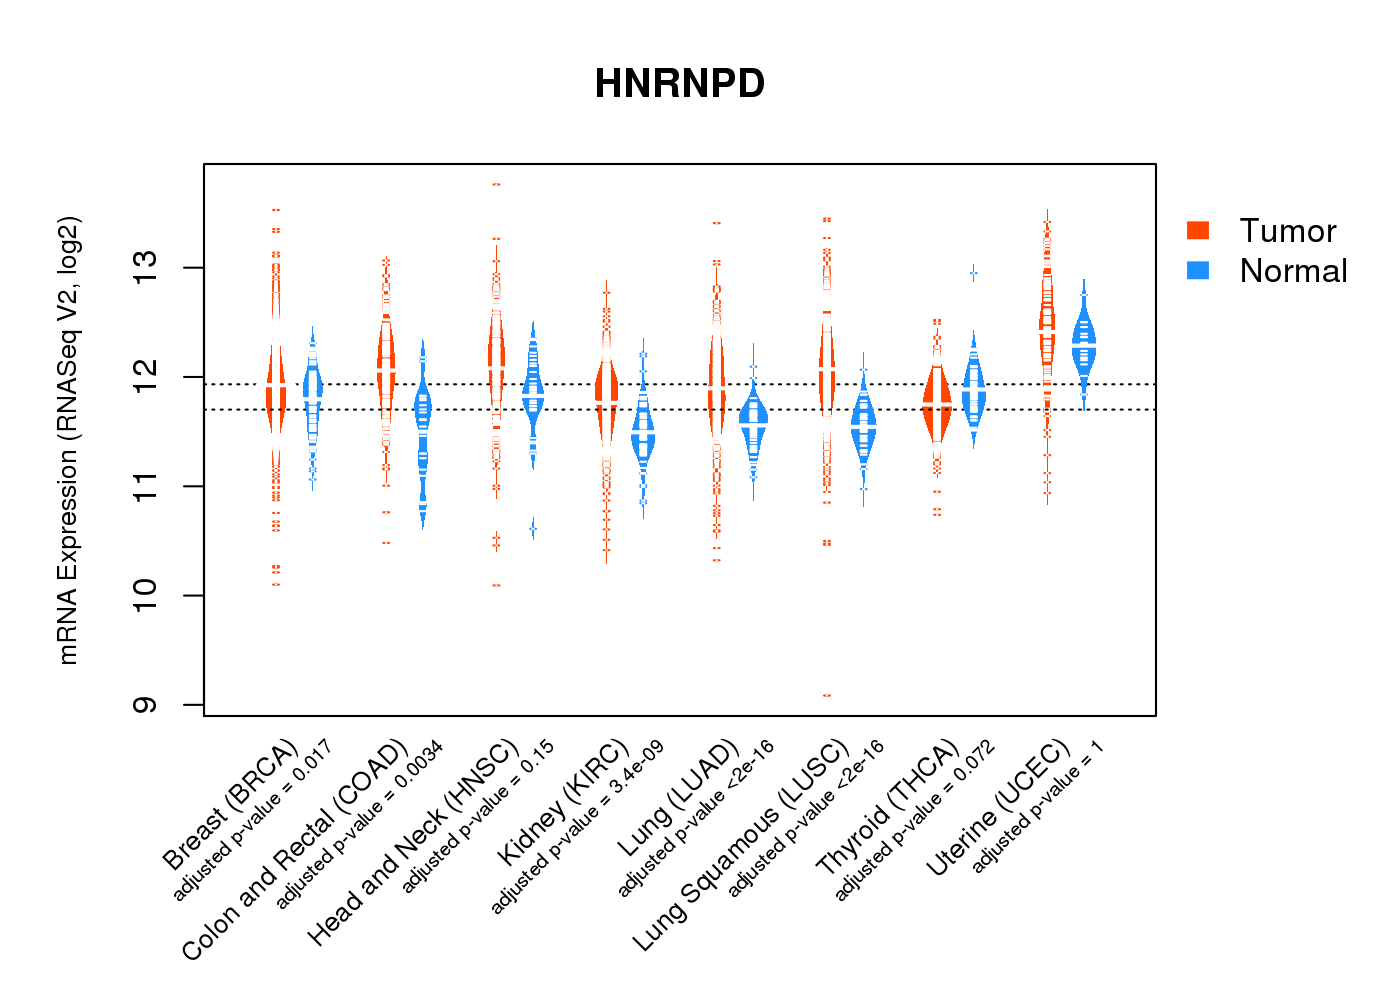 |
| Top |
| * This plots show the correlation between CNV and gene expression. |
: Open all plots for all cancer types
 |
|
 |
|

| Top |
| Gene-Gene Network Information |
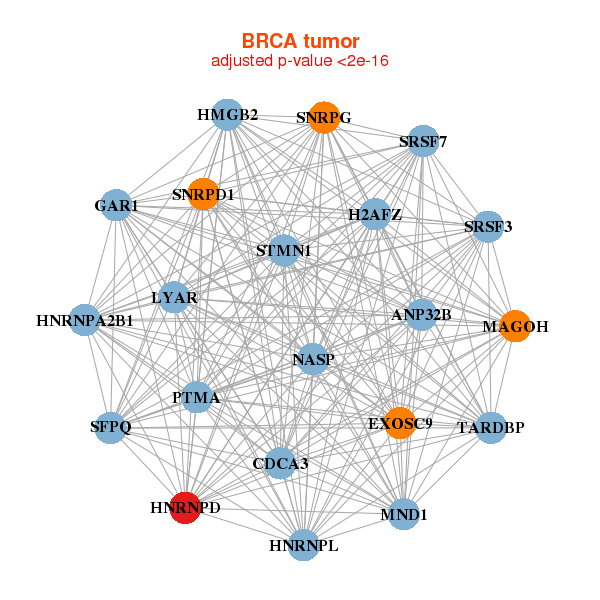
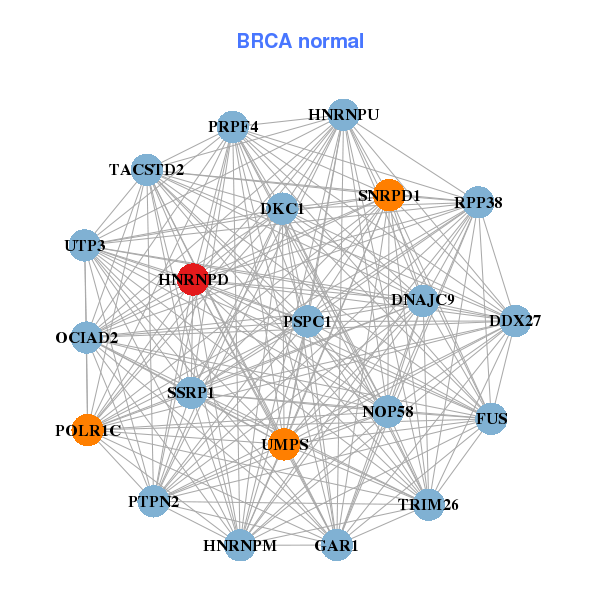
| * Co-Expression network figures were drawn using R package igraph. Only the top 20 genes with the highest correlations were shown. Red circle: input gene, orange circle: cell metabolism gene, sky circle: other gene |
: Open all plots for all cancer types
 |
|
| ANP32B,CDCA3,EXOSC9,GAR1,H2AFZ,HMGB2,HNRNPA2B1, HNRNPD,HNRNPL,LYAR,MAGOH,MND1,NASP,PTMA, SFPQ,SRSF3,SRSF7,SNRPD1,SNRPG,STMN1,TARDBP | DDX27,DKC1,DNAJC9,FUS,GAR1,HNRNPD,HNRNPM, HNRNPU,NOP58,OCIAD2,POLR1C,PRPF4,PSPC1,PTPN2, RPP38,SNRPD1,SSRP1,TACSTD2,TRIM26,UMPS,UTP3 |
 |
|
| EWSR1,FEN1,FUS,HMGB2,HNRNPA2B1,HNRNPA3,HNRNPD, HNRNPR,HNRNPU,HNRNPDL,KPNB1,NASP,NCAPH,NCL, PAICS,PLK4,SFPQ,SRSF1,SNRPA,TAF15,TARDBP | BMS1,DDX46,DHX29,DHX9,EIF4G1,ELAVL1,EWSR1, FTSJ3,FUS,HNRNPA3,HNRNPD,HNRNPM,HNRNPR,HNRNPU, NCL,NUP188,SLC7A1,SRRM1,SYNCRIP,TAF15,TARDBP |
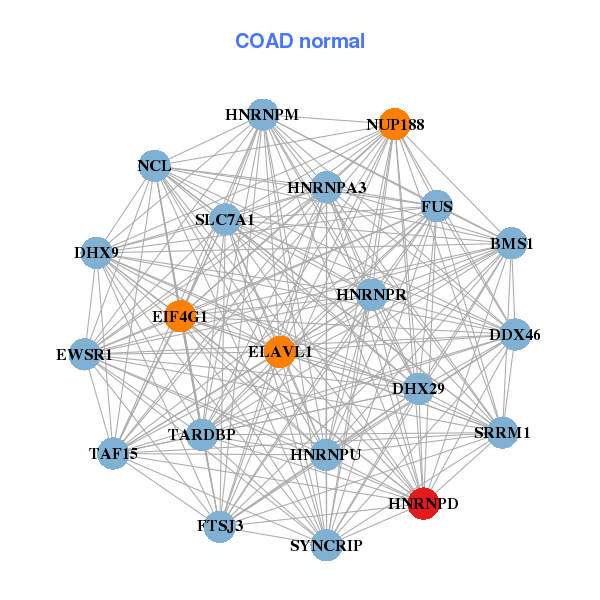
| * Co-Expression network figures were drawn using R package igraph. Only the top 20 genes with the highest correlations were shown. Red circle: input gene, orange circle: cell metabolism gene, sky circle: other gene |
: Open all plots for all cancer types
| Top |
: Open all interacting genes' information including KEGG pathway for all interacting genes from DAVID
| Top |
| Pharmacological Information for HNRNPD |
| There's no related Drug. |
| Top |
| Cross referenced IDs for HNRNPD |
| * We obtained these cross-references from Uniprot database. It covers 150 different DBs, 18 categories. http://www.uniprot.org/help/cross_references_section |
: Open all cross reference information
|
Copyright © 2016-Present - The Univsersity of Texas Health Science Center at Houston @ |