|
||||||||||||||||||||||||||||||||||||||||||||||||||||||||||||||||||||||||||||||||||||||||||||||||||||||||||||||||||||||||||||||||||||||||||||||||||||||||||||||||||||||||||||||||||||||||||||||||||||||||||||||||||||||||||||||||||||||||||||||||||||||||||||||||||||||||||||||||||||||||||||||||||||||||||||||||||||||||||||||||||||||||||||||||||||||||||||||||||||||||
| |
| Phenotypic Information (metabolism pathway, cancer, disease, phenome) |
| |
| |
| Gene-Gene Network Information: Co-Expression Network, Interacting Genes & KEGG |
| |
|


| Gene Summary for HPD |
| Top |
| Phenotypic Information for HPD(metabolism pathway, cancer, disease, phenome) |
| Cancer | CGAP: HPD |
| Familial Cancer Database: HPD | |
| * This gene is included in those cancer gene databases. |
|
|
|
|
|
| . | ||||||||||||||||||||||||||||||||||||||||||||||||||||||||||||||||||||||||||||||||||||||||||||||||||||||||||||||||||||||||||||||||||||||||||||||||||||||||||||||||||||||||||||||||||||||||||||||||||||||||||||||||||||||||||||||||||||||||||||||||||||||||||||||||||||||||||||||||||||||||||||||||||||||||||||||||||||||||||||||||||||||||||||||||||||||||||||||||||
Oncogene 1 | Significant driver gene in UCEC 6, | |||||||||||||||||||||||||||||||||||||||||||||||||||||||||||||||||||||||||||||||||||||||||||||||||||||||||||||||||||||||||||||||||||||||||||||||||||||||||||||||||||||||||||||||||||||||||||||||||||||||||||||||||||||||||||||||||||||||||||||||||||||||||||||||||||||||||||||||||||||||||||||||||||||||||||||||||||||||||||||||||||||||||||||||||||||||||||||||||||||||
| cf) number; DB name 1 Oncogene; http://nar.oxfordjournals.org/content/35/suppl_1/D721.long, 2 Tumor Suppressor gene; https://bioinfo.uth.edu/TSGene/, 3 Cancer Gene Census; http://www.nature.com/nrc/journal/v4/n3/abs/nrc1299.html, 4 CancerGenes; http://nar.oxfordjournals.org/content/35/suppl_1/D721.long, 5 Network of Cancer Gene; http://ncg.kcl.ac.uk/index.php, 6 http://www.nature.com/nature/journal/v497/n7447/full/nature12113.html, 7Therapeutic Vulnerabilities in Cancer; http://cbio.mskcc.org/cancergenomics/statius/ |
| KEGG_TYROSINE_METABOLISM KEGG_PHENYLALANINE_METABOLISM REACTOME_METABOLISM_OF_AMINO_ACIDS_AND_DERIVATIVES | |
| OMIM | 140350; phenotype. 276710; phenotype. 609695; gene. |
| Orphanet | 2118; Hawkinsinuria. 69723; Tyrosinemia type 3. |
| Disease | KEGG Disease: HPD |
| MedGen: HPD (Human Medical Genetics with Condition) | |
| ClinVar: HPD | |
| Phenotype | MGI: HPD (International Mouse Phenotyping Consortium) |
| PhenomicDB: HPD | |
| Mutations for HPD |
| * Under tables are showing count per each tissue to give us broad intuition about tissue specific mutation patterns.You can go to the detailed page for each mutation database's web site. |
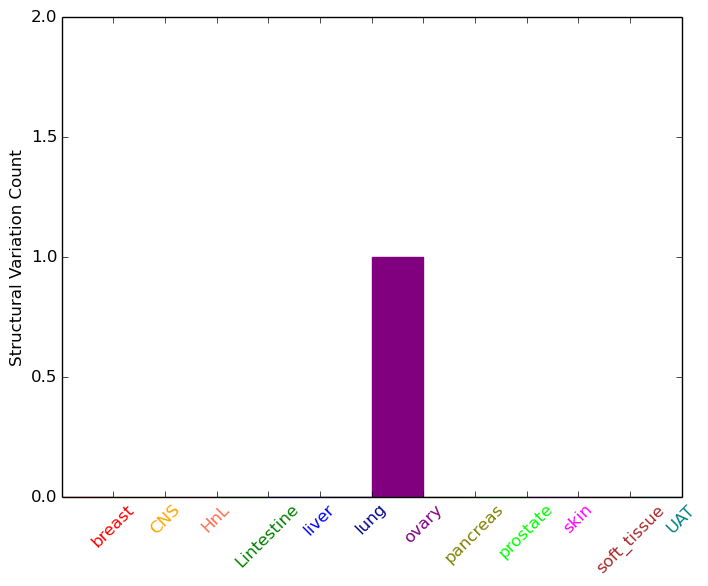
| - Statistics for Tissue and Mutation type | Top |
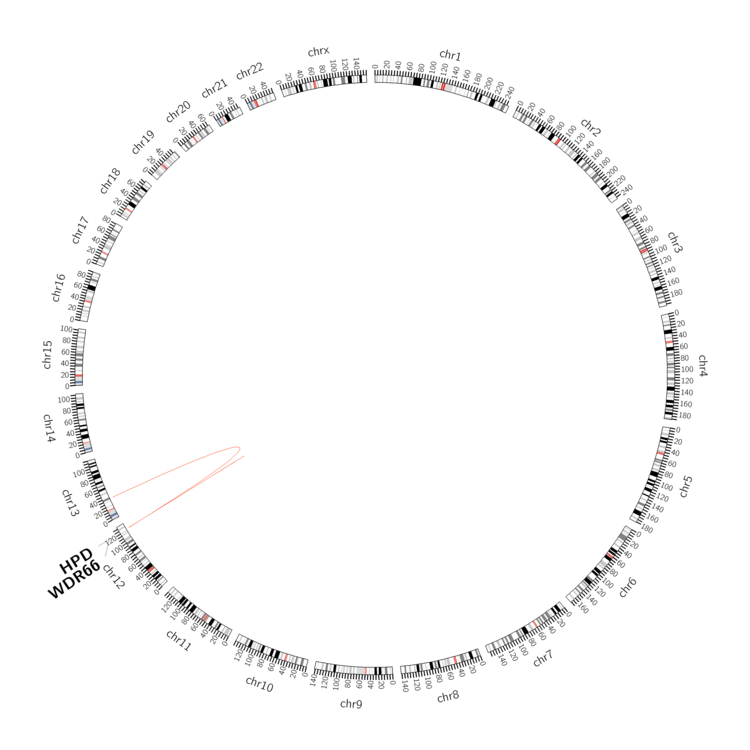 |
| - For Inter-chromosomal Variations |
| * Inter-chromosomal variantions includes 'interchromosomal amplicon to amplicon', 'interchromosomal amplicon to non-amplified dna', 'interchromosomal insertion', 'Interchromosomal unknown type'. |
 |
| - For Intra-chromosomal Variations |
| * Intra-chromosomal variantions includes 'intrachromosomal amplicon to amplicon', 'intrachromosomal amplicon to non-amplified dna', 'intrachromosomal deletion', 'intrachromosomal fold-back inversion', 'intrachromosomal inversion', 'intrachromosomal tandem duplication', 'Intrachromosomal unknown type', 'intrachromosomal with inverted orientation', 'intrachromosomal with non-inverted orientation'. |
 |
| Sample | Symbol_a | Chr_a | Start_a | End_a | Symbol_b | Chr_b | Start_b | End_b |
| breast | HPD | chr12 | 122319869 | 122319869 | chr13 | 37166332 | 37166332 | |
| ovary | HPD | chr12 | 122306411 | 122306431 | WDR66 | chr12 | 122391042 | 122391062 |
| cf) Tissue number; Tissue name (1;Breast, 2;Central_nervous_system, 3;Haematopoietic_and_lymphoid_tissue, 4;Large_intestine, 5;Liver, 6;Lung, 7;Ovary, 8;Pancreas, 9;Prostate, 10;Skin, 11;Soft_tissue, 12;Upper_aerodigestive_tract) |
| * From mRNA Sanger sequences, Chitars2.0 arranged chimeric transcripts. This table shows HPD related fusion information. |
| ID | Head Gene | Tail Gene | Accession | Gene_a | qStart_a | qEnd_a | Chromosome_a | tStart_a | tEnd_a | Gene_a | qStart_a | qEnd_a | Chromosome_a | tStart_a | tEnd_a |
| BP348274 | HPD | 1 | 382 | 12 | 122277581 | 122296765 | HPD | 381 | 582 | 12 | 122287652 | 122294294 | |
| CD614163 | ADAM19 | 1 | 58 | 5 | 156907912 | 156907969 | HPD | 59 | 740 | 12 | 122285045 | 122296745 | |
| Top |
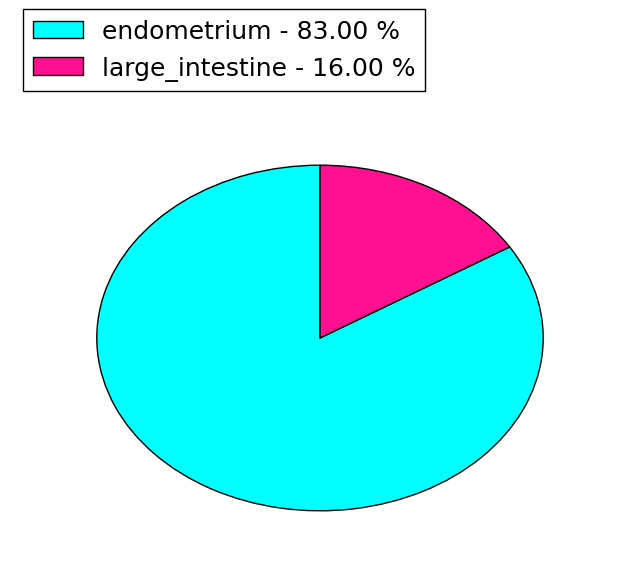
| Mutation type/ Tissue ID | brca | cns | cerv | endome | haematopo | kidn | Lintest | liver | lung | ns | ovary | pancre | prost | skin | stoma | thyro | urina | |||
| Total # sample | 1 | 1 | ||||||||||||||||||
| GAIN (# sample) | 1 | 1 | ||||||||||||||||||
| LOSS (# sample) |
| cf) Tissue ID; Tissue type (1; Breast, 2; Central_nervous_system, 3; Cervix, 4; Endometrium, 5; Haematopoietic_and_lymphoid_tissue, 6; Kidney, 7; Large_intestine, 8; Liver, 9; Lung, 10; NS, 11; Ovary, 12; Pancreas, 13; Prostate, 14; Skin, 15; Stomach, 16; Thyroid, 17; Urinary_tract) |
| Top |
|
 |
| Top |
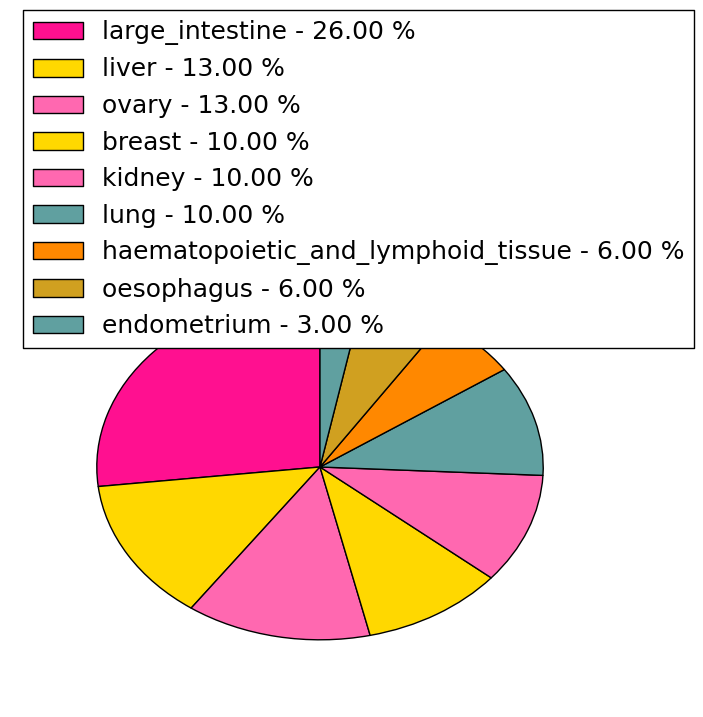
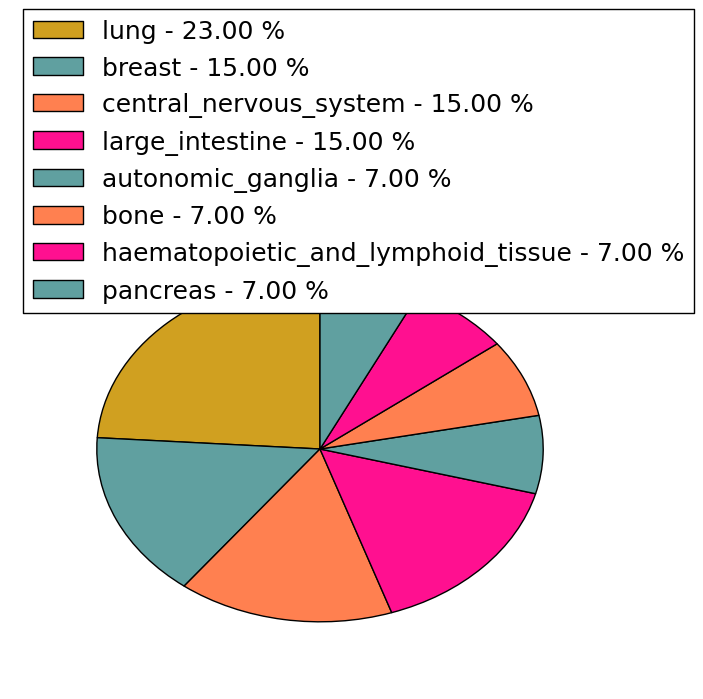
| Stat. for Non-Synonymous SNVs (# total SNVs=30) | (# total SNVs=13) |
 |  |
(# total SNVs=6) | (# total SNVs=0) |
 |
| Top |
| * When you move the cursor on each content, you can see more deailed mutation information on the Tooltip. Those are primary_site,primary_histology,mutation(aa),pubmedID. |
| GRCh37 position | Mutation(aa) | Unique sampleID count |
| chr12:122281717-122281718 | p.G285fs*30 | 6 |
| chr12:122292680-122292680 | p.A115T | 2 |
| chr12:122292681-122292681 | p.G114G | 2 |
| chr12:122277840-122277840 | p.Q357* | 2 |
| chr12:122294305-122294305 | p.G83G | 2 |
| chr12:122286961-122286961 | p.M180I | 1 |
| chr12:122296617-122296617 | p.T2T | 1 |
| chr12:122281642-122281642 | p.V310L | 1 |
| chr12:122284768-122284768 | p.A277A | 1 |
| chr12:122295239-122295239 | p.G65R | 1 |
| Top |
|
 |
| Point Mutation/ Tissue ID | 1 | 2 | 3 | 4 | 5 | 6 | 7 | 8 | 9 | 10 | 11 | 12 | 13 | 14 | 15 | 16 | 17 | 18 | 19 | 20 |
| # sample | 3 | 3 | 6 | 1 | 2 | 1 | 1 | 5 | 2 | 2 | 6 | 2 | 1 | 1 | ||||||
| # mutation | 3 | 3 | 6 | 1 | 2 | 1 | 1 | 6 | 2 | 2 | 7 | 2 | 1 | 1 | ||||||
| nonsynonymous SNV | 2 | 1 | 4 | 1 | 1 | 1 | 2 | 2 | 2 | 5 | 2 | 1 | 1 | |||||||
| synonymous SNV | 1 | 2 | 2 | 1 | 1 | 4 | 2 |
| cf) Tissue ID; Tissue type (1; BLCA[Bladder Urothelial Carcinoma], 2; BRCA[Breast invasive carcinoma], 3; CESC[Cervical squamous cell carcinoma and endocervical adenocarcinoma], 4; COAD[Colon adenocarcinoma], 5; GBM[Glioblastoma multiforme], 6; Glioma Low Grade, 7; HNSC[Head and Neck squamous cell carcinoma], 8; KICH[Kidney Chromophobe], 9; KIRC[Kidney renal clear cell carcinoma], 10; KIRP[Kidney renal papillary cell carcinoma], 11; LAML[Acute Myeloid Leukemia], 12; LUAD[Lung adenocarcinoma], 13; LUSC[Lung squamous cell carcinoma], 14; OV[Ovarian serous cystadenocarcinoma ], 15; PAAD[Pancreatic adenocarcinoma], 16; PRAD[Prostate adenocarcinoma], 17; SKCM[Skin Cutaneous Melanoma], 18:STAD[Stomach adenocarcinoma], 19:THCA[Thyroid carcinoma], 20:UCEC[Uterine Corpus Endometrial Carcinoma]) |
| Top |
| * We represented just top 10 SNVs. When you move the cursor on each content, you can see more deailed mutation information on the Tooltip. Those are primary_site, primary_histology, mutation(aa), pubmedID. |
| Genomic Position | Mutation(aa) | Unique sampleID count |
| chr12:122294305 | p.G83G,HPD | 2 |
| chr12:122294236 | p.E254K,HPD | 1 |
| chr12:122281721 | p.Q108K,HPD | 1 |
| chr12:122287620 | p.A244A,HPD | 1 |
| chr12:122294280 | p.I106I,HPD | 1 |
| chr12:122284777 | p.T219T,HPD | 1 |
| chr12:122292611 | p.G92R,HPD | 1 |
| chr12:122284813 | p.P189T,HPD | 1 |
| chr12:122292638 | p.M180I,HPD | 1 |
| chr12:122295239 | p.G65R,HPD | 1 |
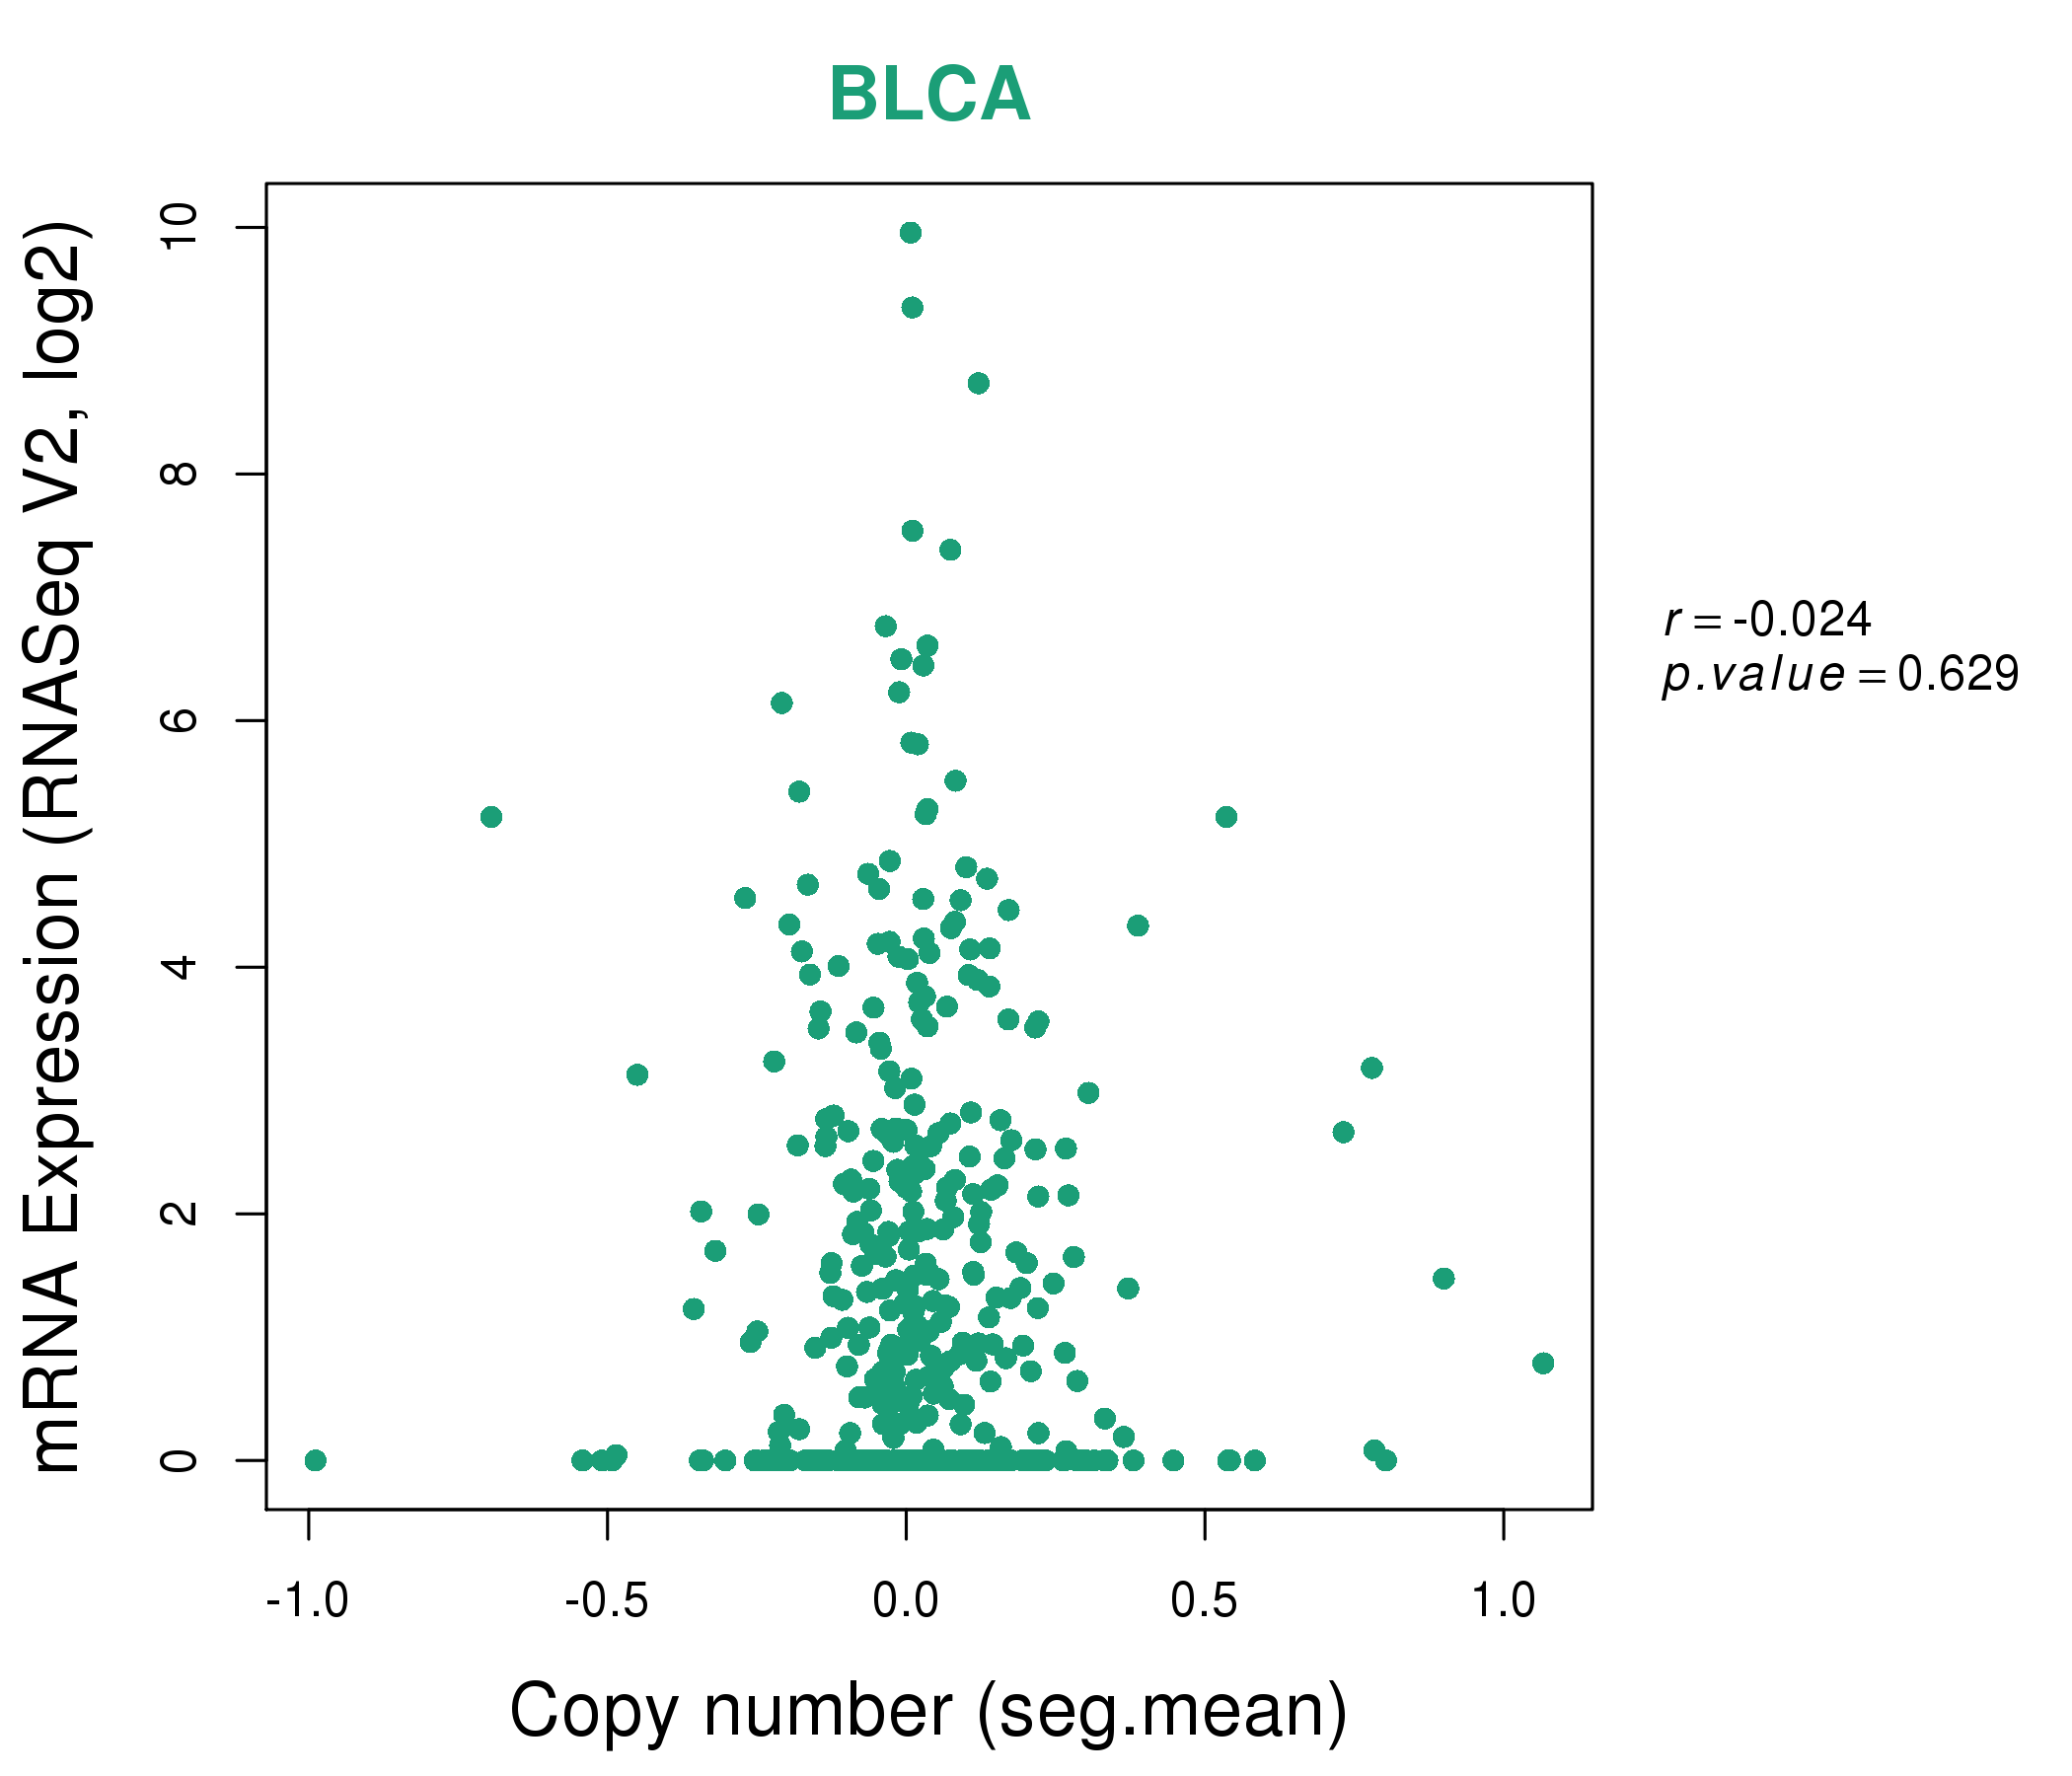
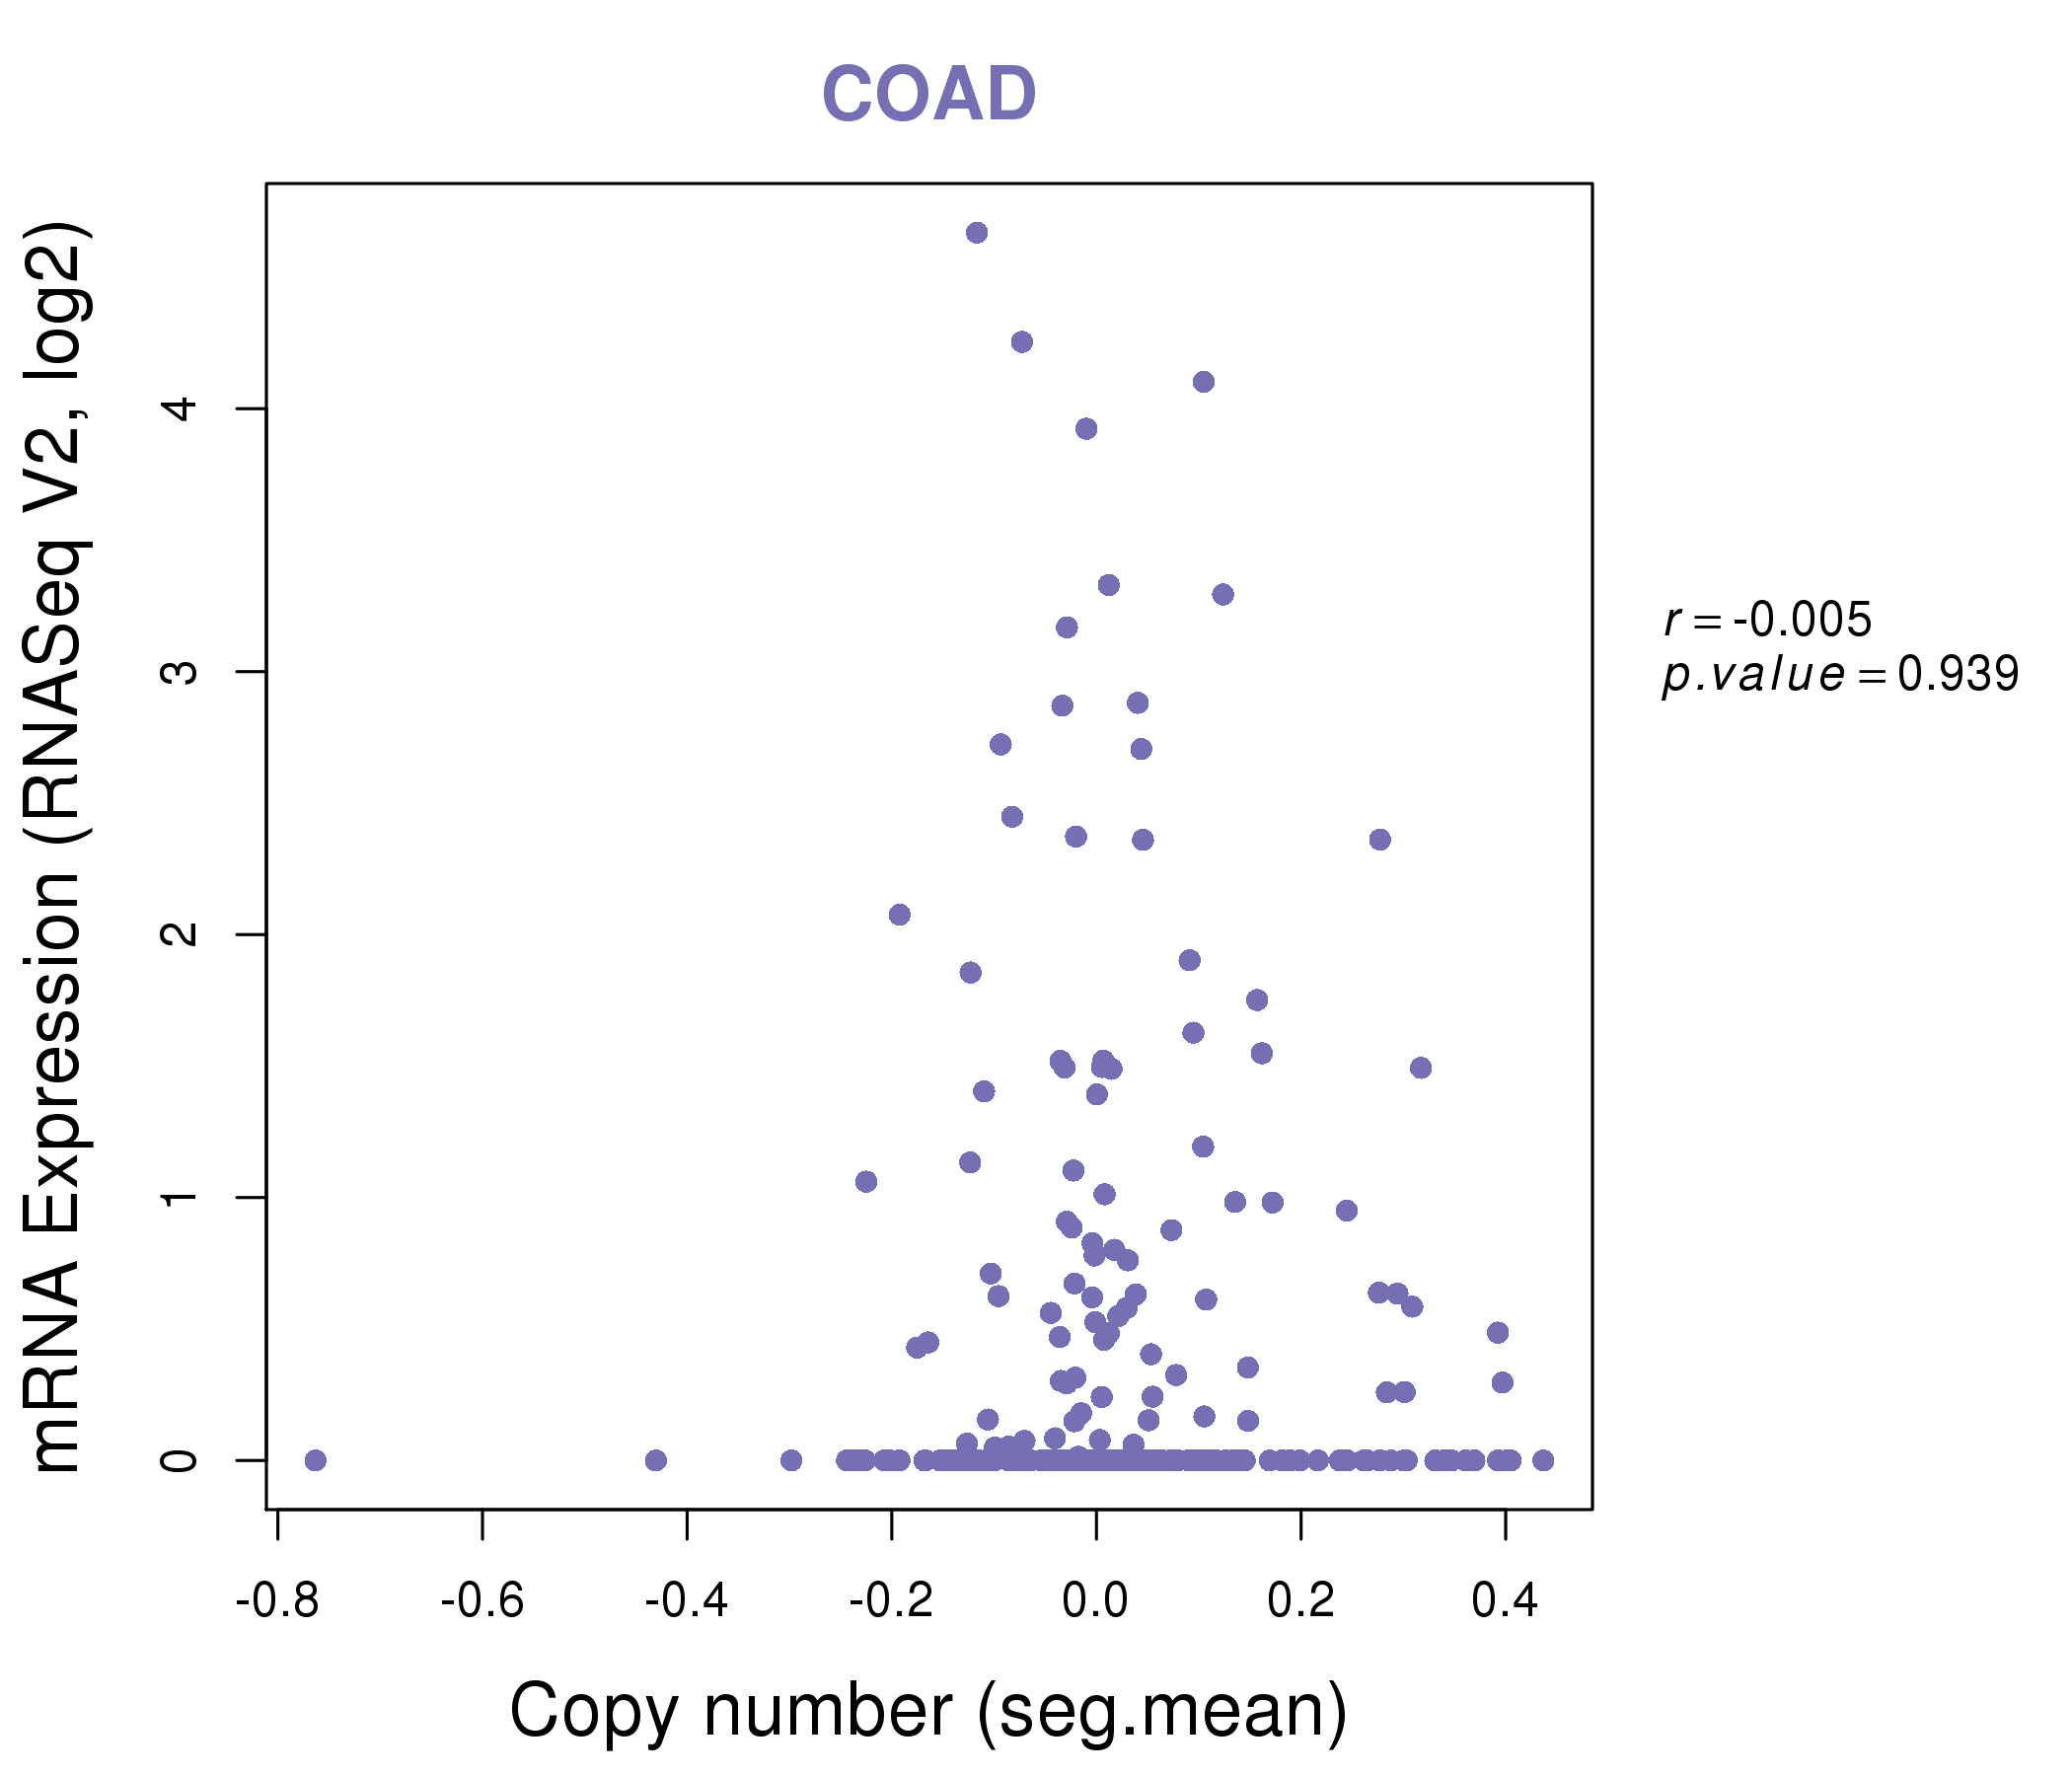
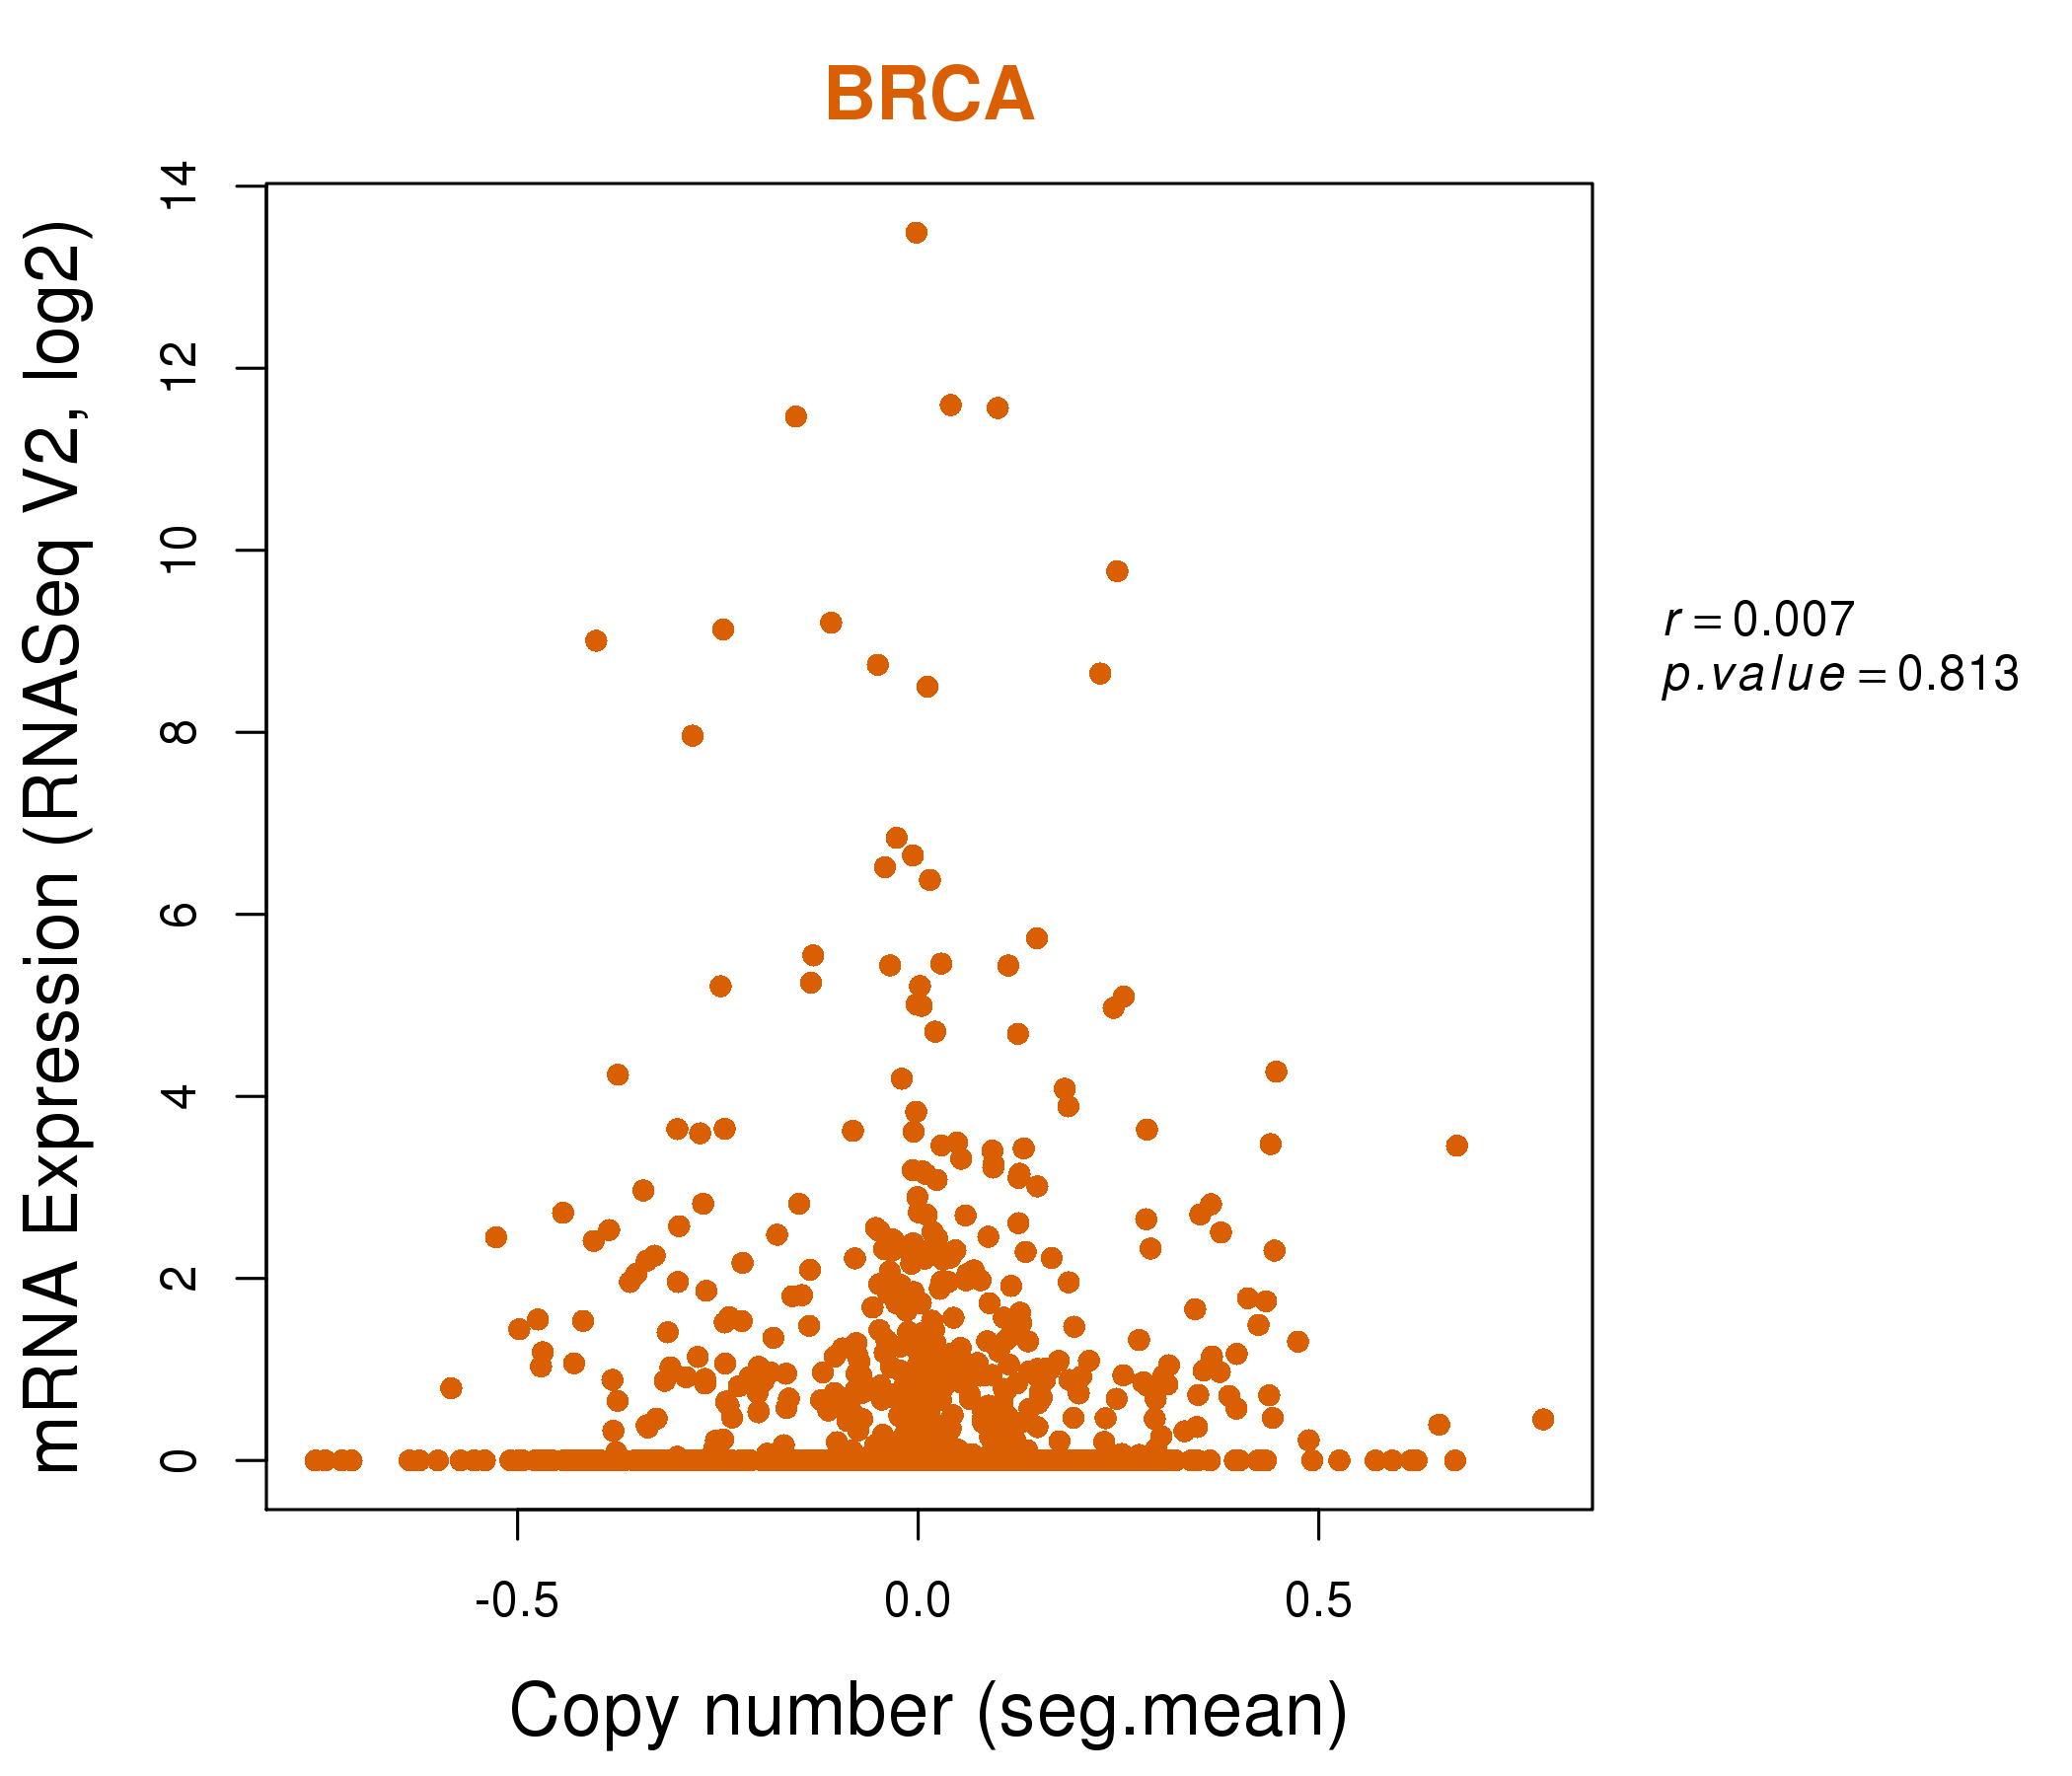
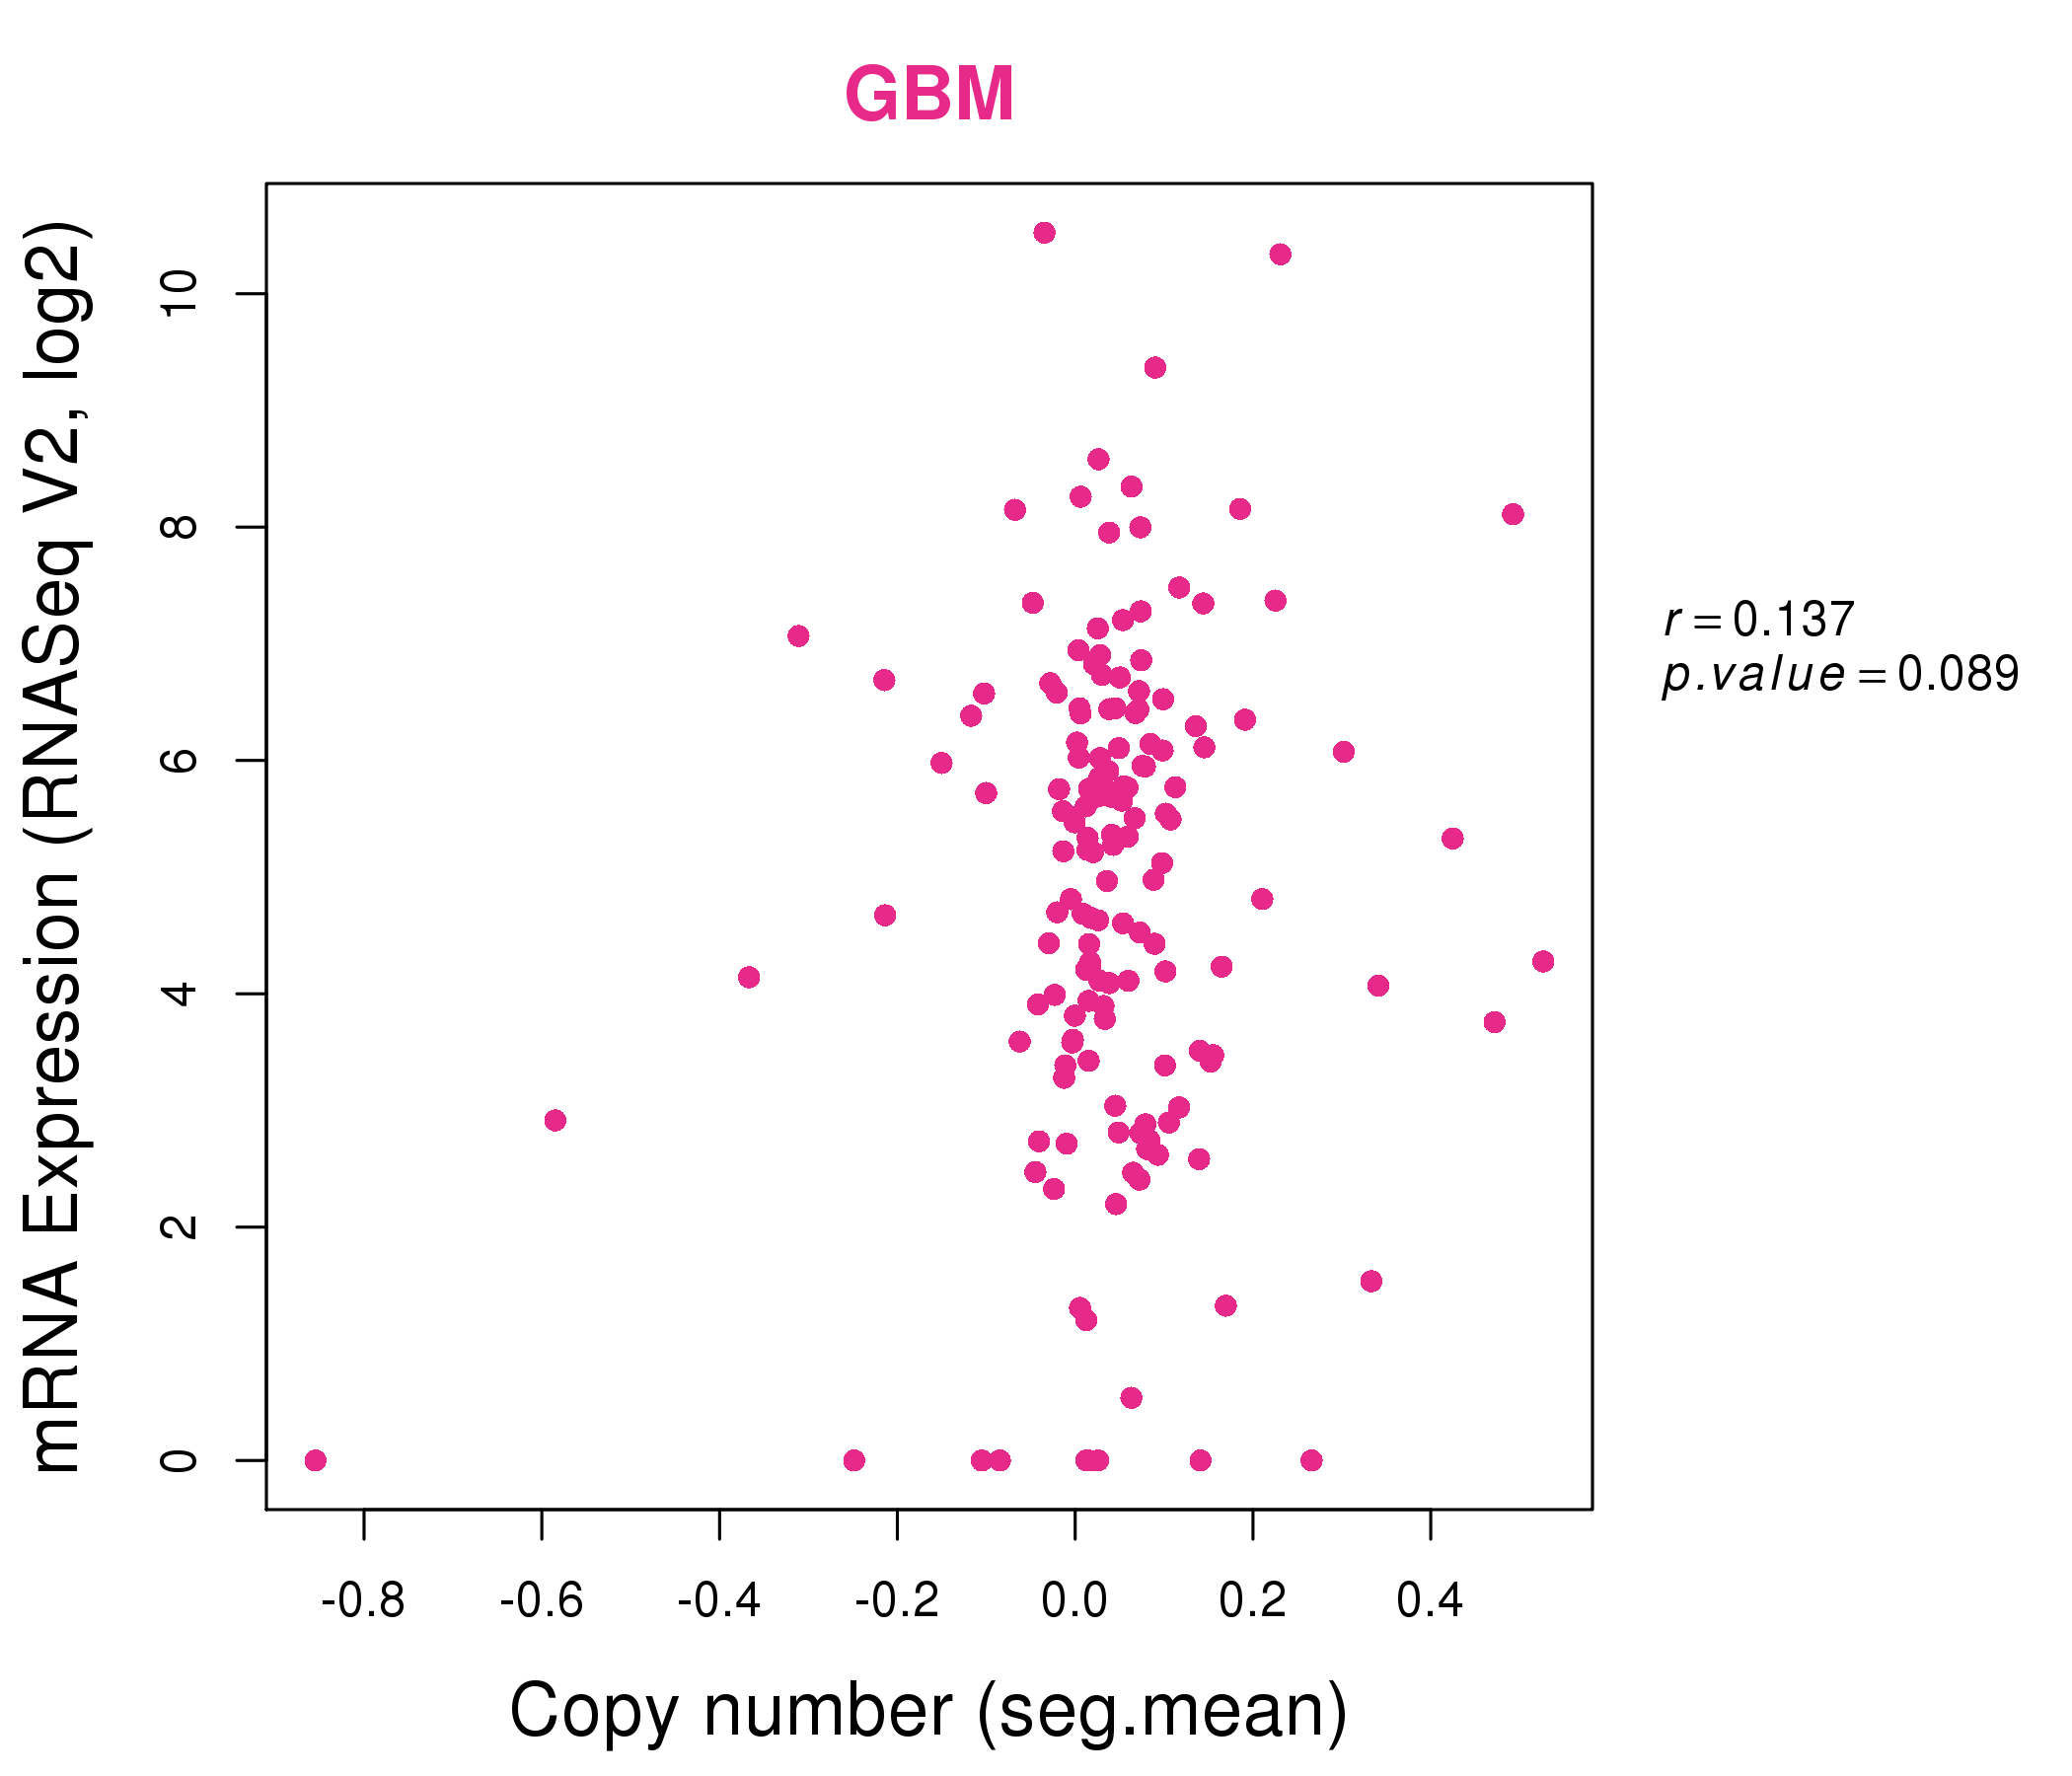
| * Copy number data were extracted from TCGA using R package TCGA-Assembler. The URLs of all public data files on TCGA DCC data server were gathered on Jan-05-2015. Function ProcessCNAData in TCGA-Assembler package was used to obtain gene-level copy number value which is calculated as the average copy number of the genomic region of a gene. |
 |
| cf) Tissue ID[Tissue type]: BLCA[Bladder Urothelial Carcinoma], BRCA[Breast invasive carcinoma], CESC[Cervical squamous cell carcinoma and endocervical adenocarcinoma], COAD[Colon adenocarcinoma], GBM[Glioblastoma multiforme], Glioma Low Grade, HNSC[Head and Neck squamous cell carcinoma], KICH[Kidney Chromophobe], KIRC[Kidney renal clear cell carcinoma], KIRP[Kidney renal papillary cell carcinoma], LAML[Acute Myeloid Leukemia], LUAD[Lung adenocarcinoma], LUSC[Lung squamous cell carcinoma], OV[Ovarian serous cystadenocarcinoma ], PAAD[Pancreatic adenocarcinoma], PRAD[Prostate adenocarcinoma], SKCM[Skin Cutaneous Melanoma], STAD[Stomach adenocarcinoma], THCA[Thyroid carcinoma], UCEC[Uterine Corpus Endometrial Carcinoma] |
| Top |
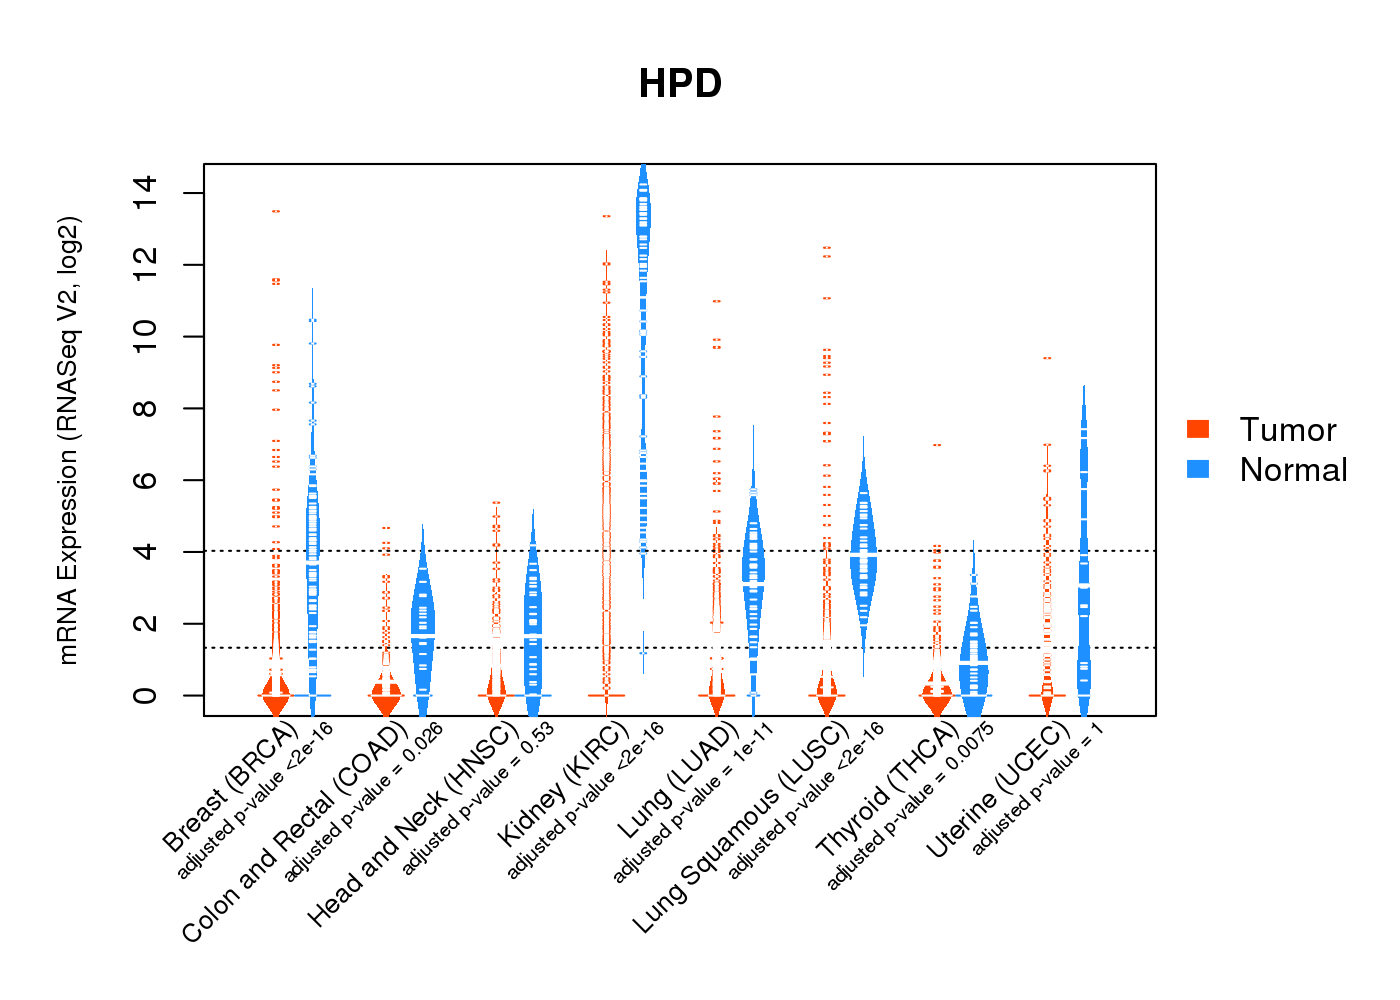
| Gene Expression for HPD |
| * CCLE gene expression data were extracted from CCLE_Expression_Entrez_2012-10-18.res: Gene-centric RMA-normalized mRNA expression data. |
 |
| * Normalized gene expression data of RNASeqV2 was extracted from TCGA using R package TCGA-Assembler. The URLs of all public data files on TCGA DCC data server were gathered at Jan-05-2015. Only eight cancer types have enough normal control samples for differential expression analysis. (t test, adjusted p<0.05 (using Benjamini-Hochberg FDR)) |
 |
| Top |
| * This plots show the correlation between CNV and gene expression. |
: Open all plots for all cancer types
 |
|
 |
|
| Top |
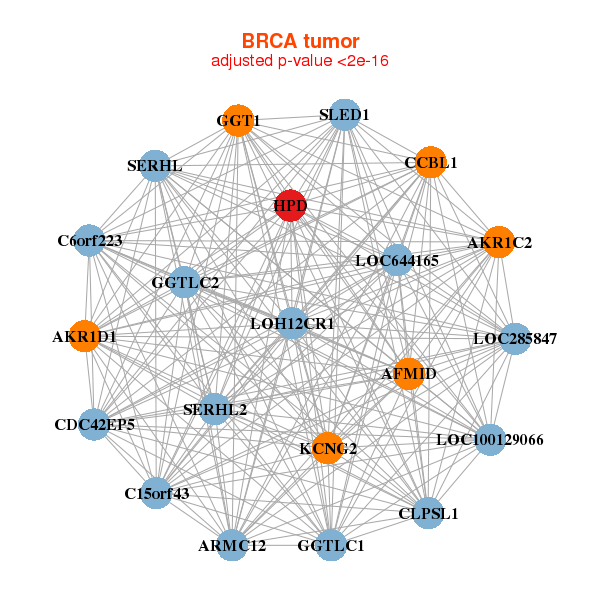
| Gene-Gene Network Information |
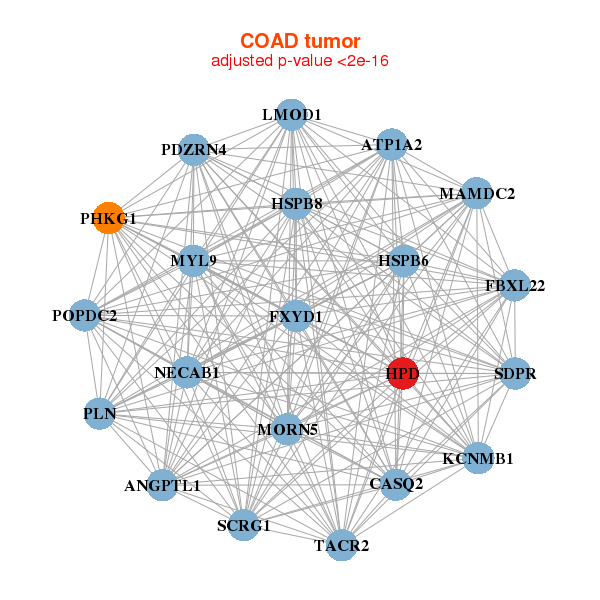
| * Co-Expression network figures were drawn using R package igraph. Only the top 20 genes with the highest correlations were shown. Red circle: input gene, orange circle: cell metabolism gene, sky circle: other gene |
: Open all plots for all cancer types
 |
| ||||
| AFMID,AKR1C2,AKR1D1,C15orf43,CLPSL1,C6orf223,ARMC12, CCBL1,CDC42EP5,GGT1,GGTLC1,GGTLC2,HPD,KCNG2, LOC100129066,LOC285847,LOC644165,LOH12CR1,SERHL2,SERHL,SLED1 | AADAT,APOD,CTNNA2,DHRS2,F9,GGTLC2,GSTM5, GUSB,HAAO,HIST1H2AE,HIST1H2BG,HPD,HSD3B2,LST-3TM12, NAT2,OR4D10,PPEF1,SERHL,SPINK8,SULT1C3,UGT2B10 | ||||
 |
| ||||
| ANGPTL1,ATP1A2,CASQ2,FBXL22,FXYD1,HPD,HSPB6, HSPB8,KCNMB1,LMOD1,MAMDC2,MORN5,MYL9,NECAB1, PDZRN4,PHKG1,PLN,POPDC2,SCRG1,SDPR,TACR2 | AFM,C3P1,CYP2E1,DNAJB8,FGA,FGB,FGG, HPD,KIR3DP1,KRTAP4-11,KRTAP5-3,LECT2,LOC100129935,MBL2, LINC00160,OR1N1,PAGE4,SERPINC1 |
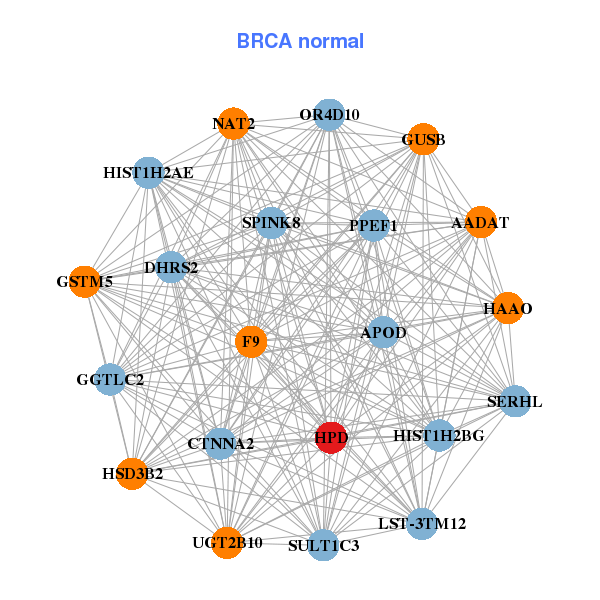
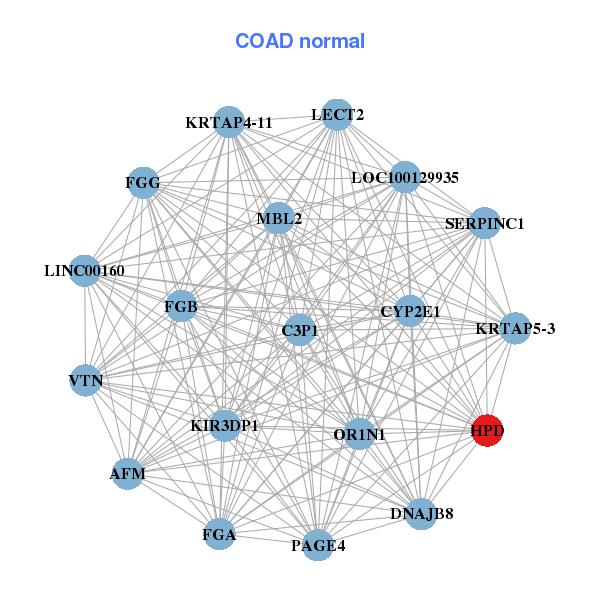
| * Co-Expression network figures were drawn using R package igraph. Only the top 20 genes with the highest correlations were shown. Red circle: input gene, orange circle: cell metabolism gene, sky circle: other gene |
: Open all plots for all cancer types
| Top |
: Open all interacting genes' information including KEGG pathway for all interacting genes from DAVID
| Top |
| Pharmacological Information for HPD |
| DB Category | DB Name | DB's ID and Url link |
| Chemistry | ChEMBL | CHEMBL1861; -. |
| Organism-specific databases | PharmGKB | PA29420; -. |
| Organism-specific databases | CTD | 3242; -. |
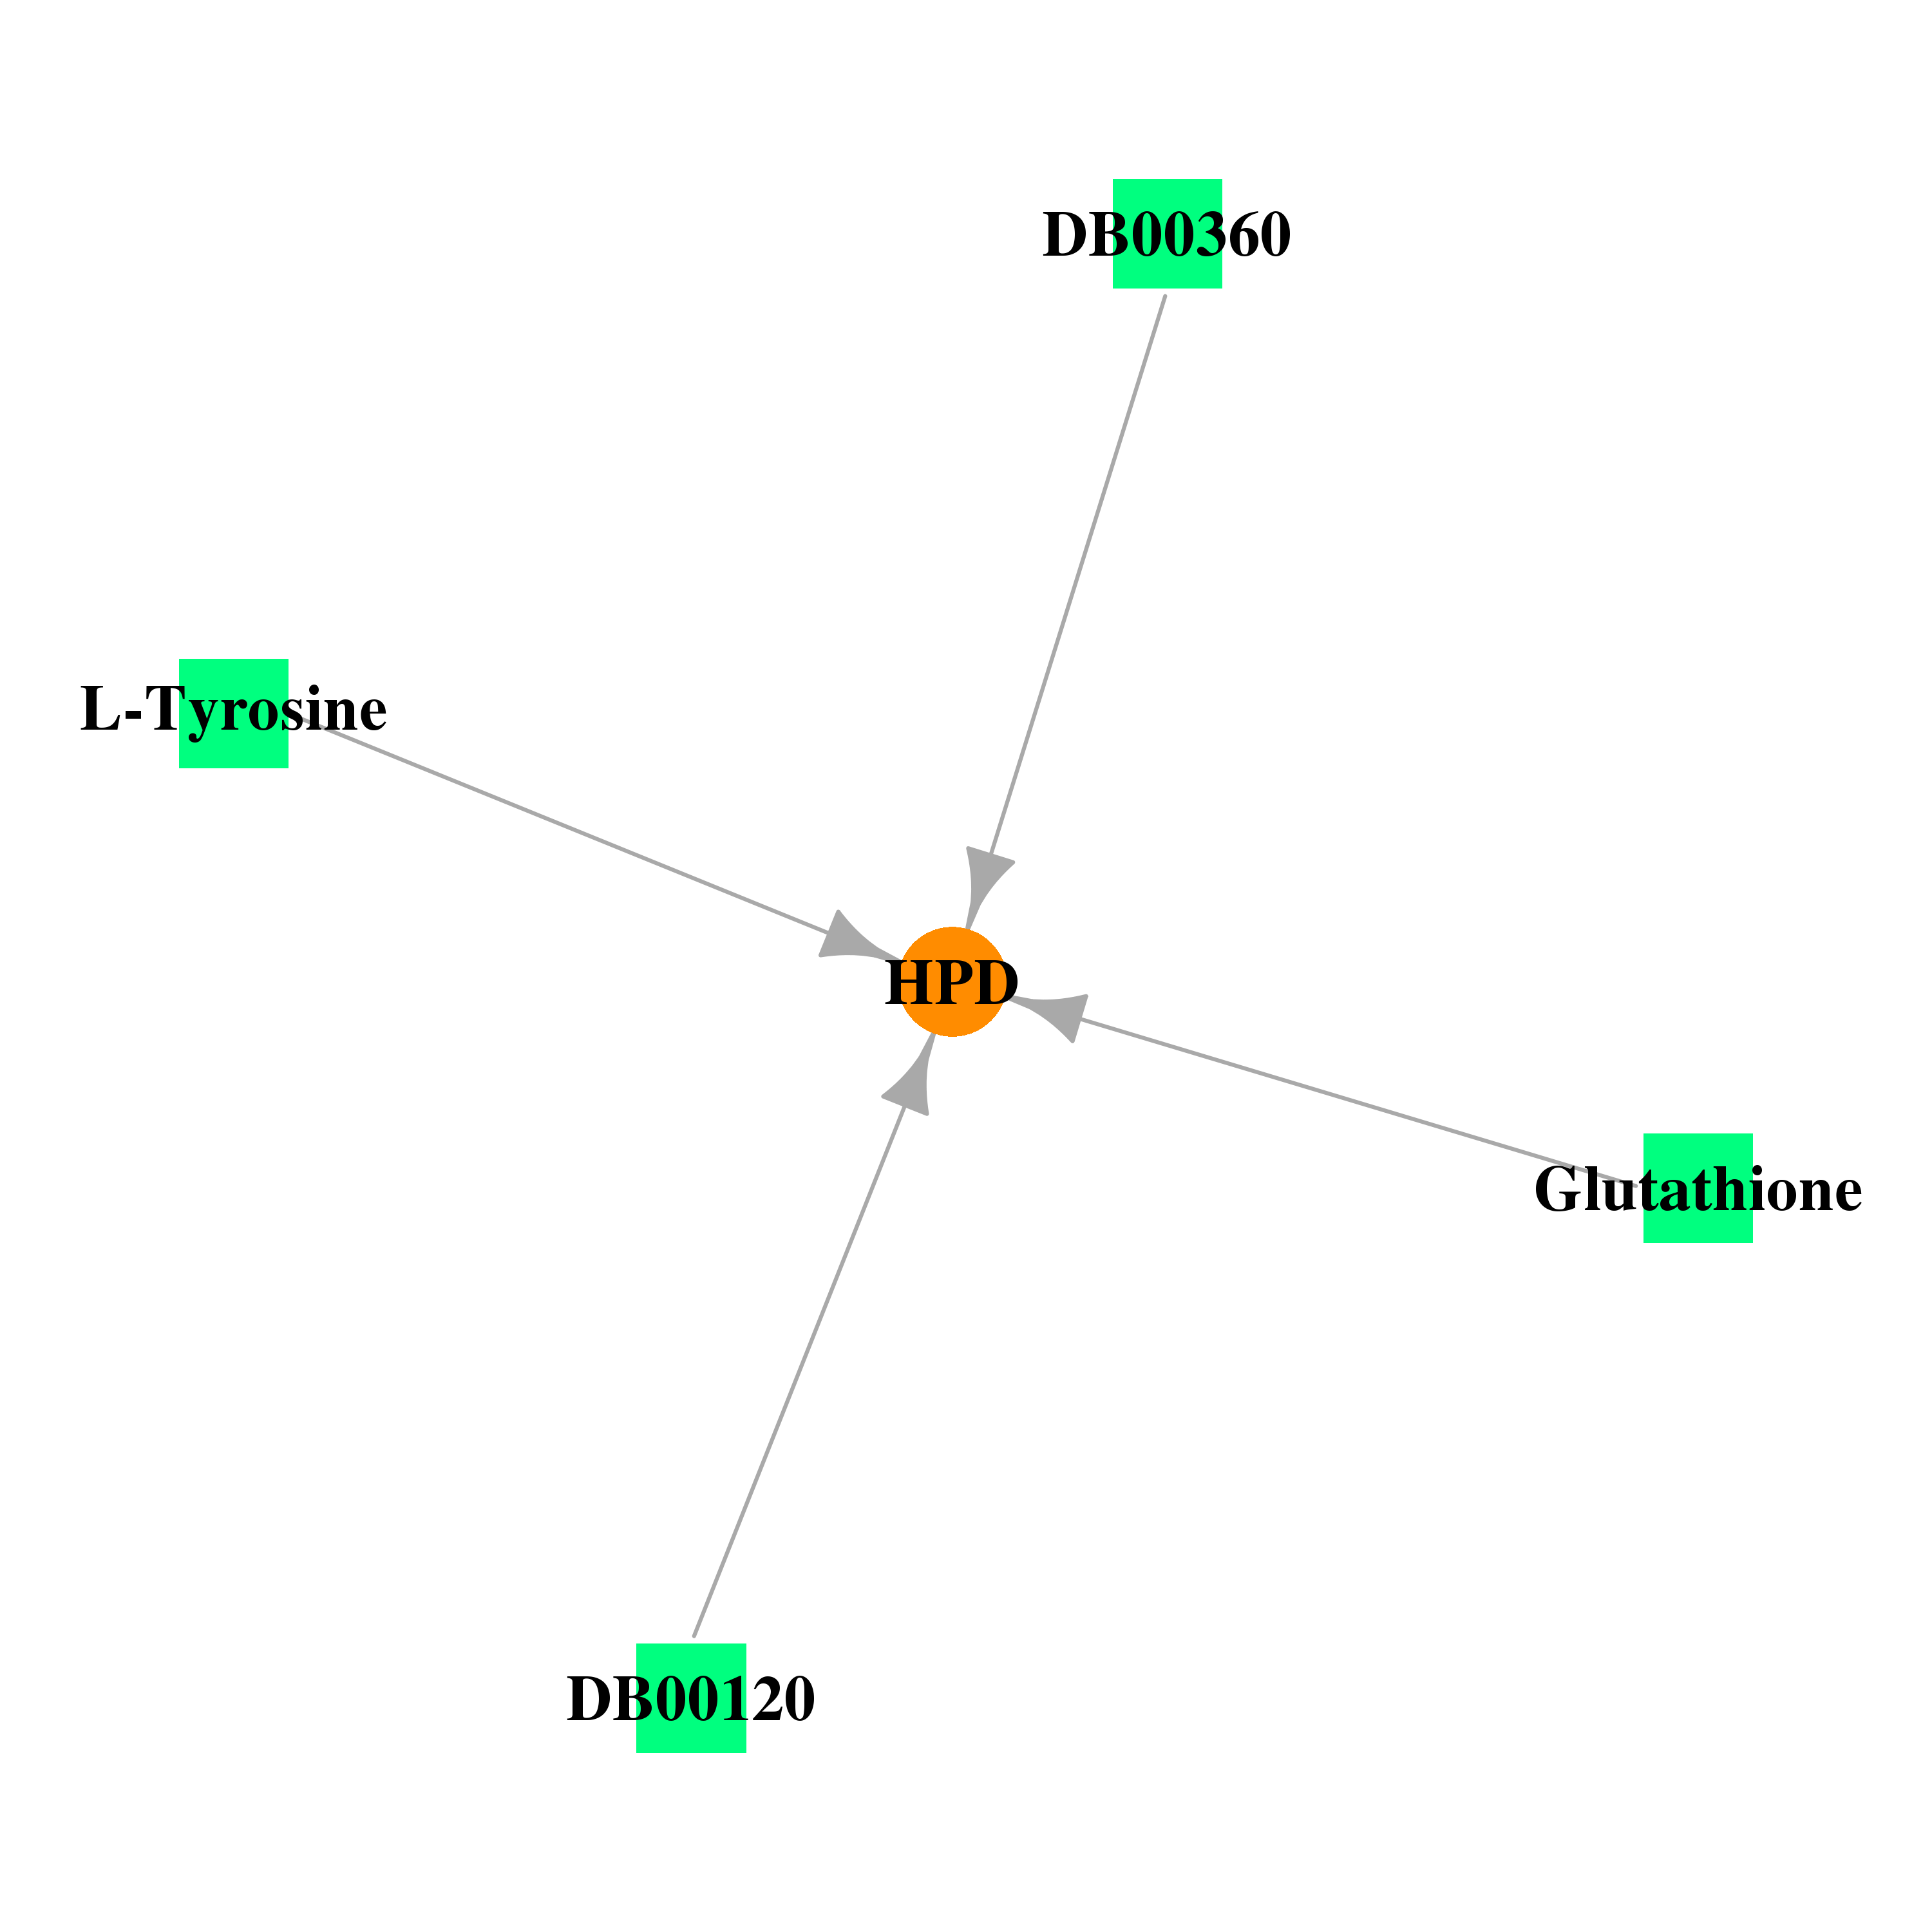
| * Gene Centered Interaction Network. |
 |
| * Drug Centered Interaction Network. |
| DrugBank ID | Target Name | Drug Groups | Generic Name | Drug Centered Network | Drug Structure |
| DB00143 | 4-hydroxyphenylpyruvate dioxygenase | approved; nutraceutical | Glutathione |  |  |
| DB00120 | 4-hydroxyphenylpyruvate dioxygenase | approved; nutraceutical | L-Phenylalanine | 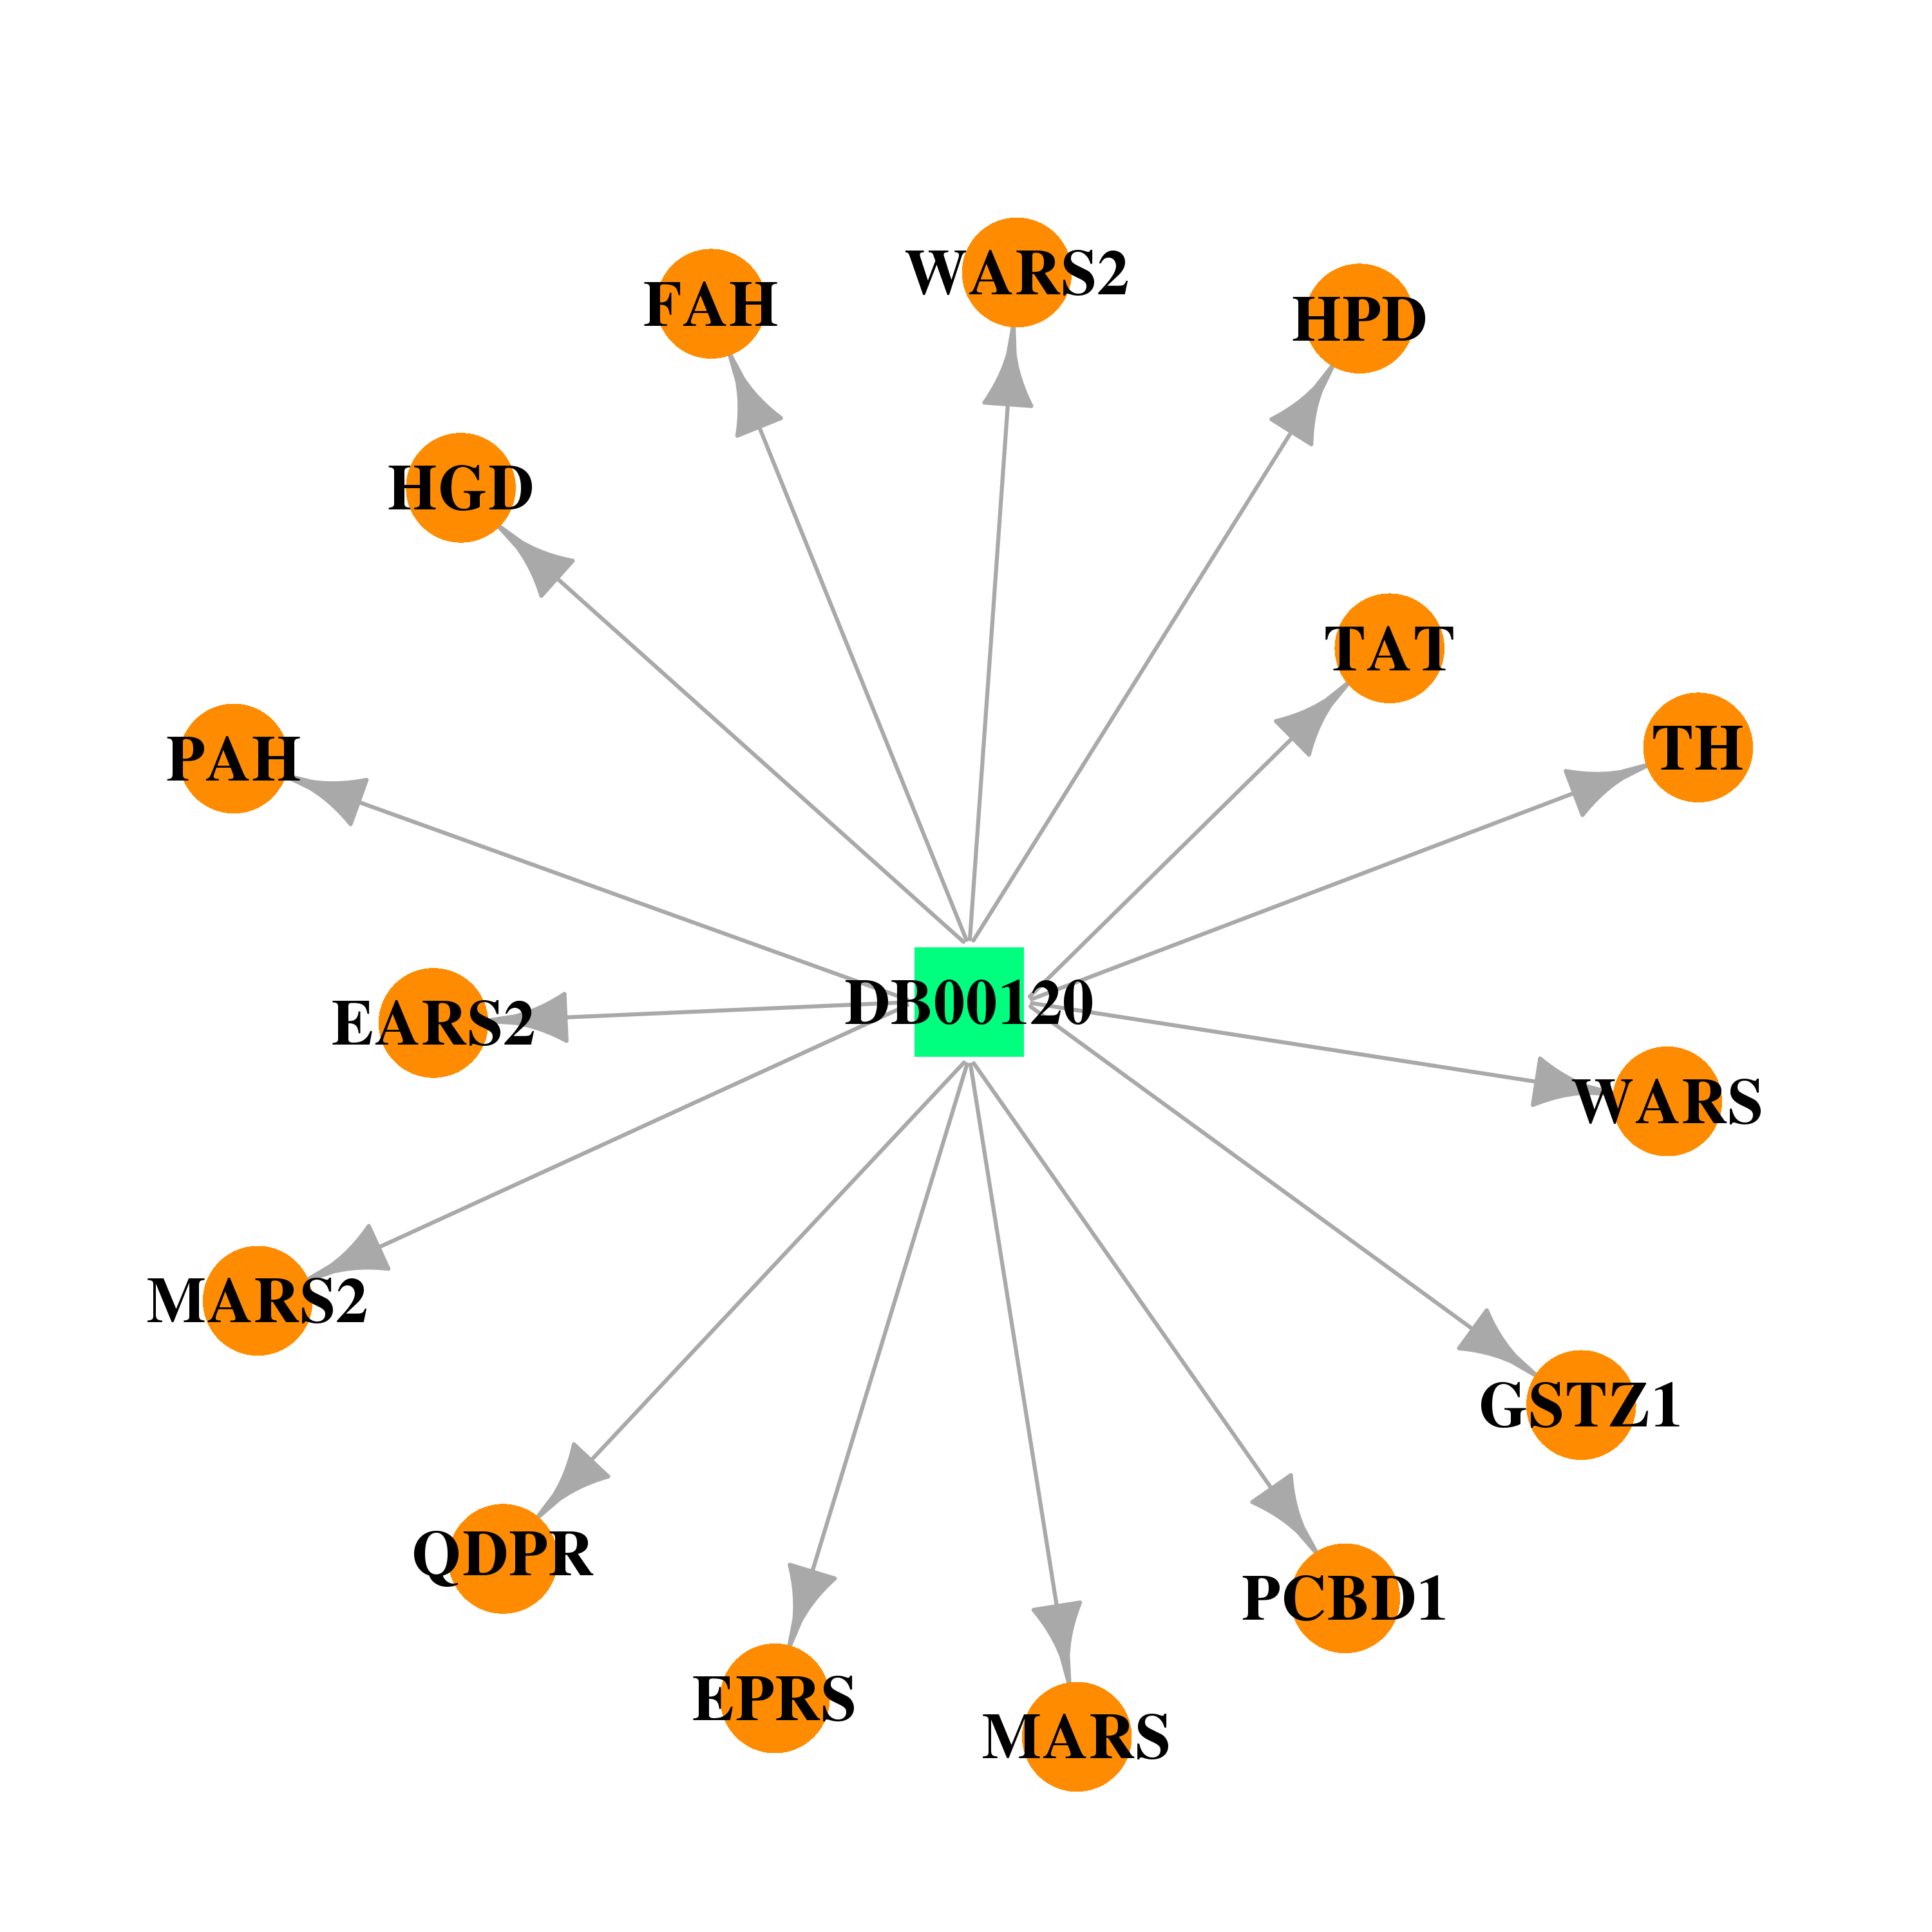 |  |
| DB00135 | 4-hydroxyphenylpyruvate dioxygenase | approved; nutraceutical | L-Tyrosine |  |  |
| DB00360 | 4-hydroxyphenylpyruvate dioxygenase | approved; investigational | Tetrahydrobiopterin | 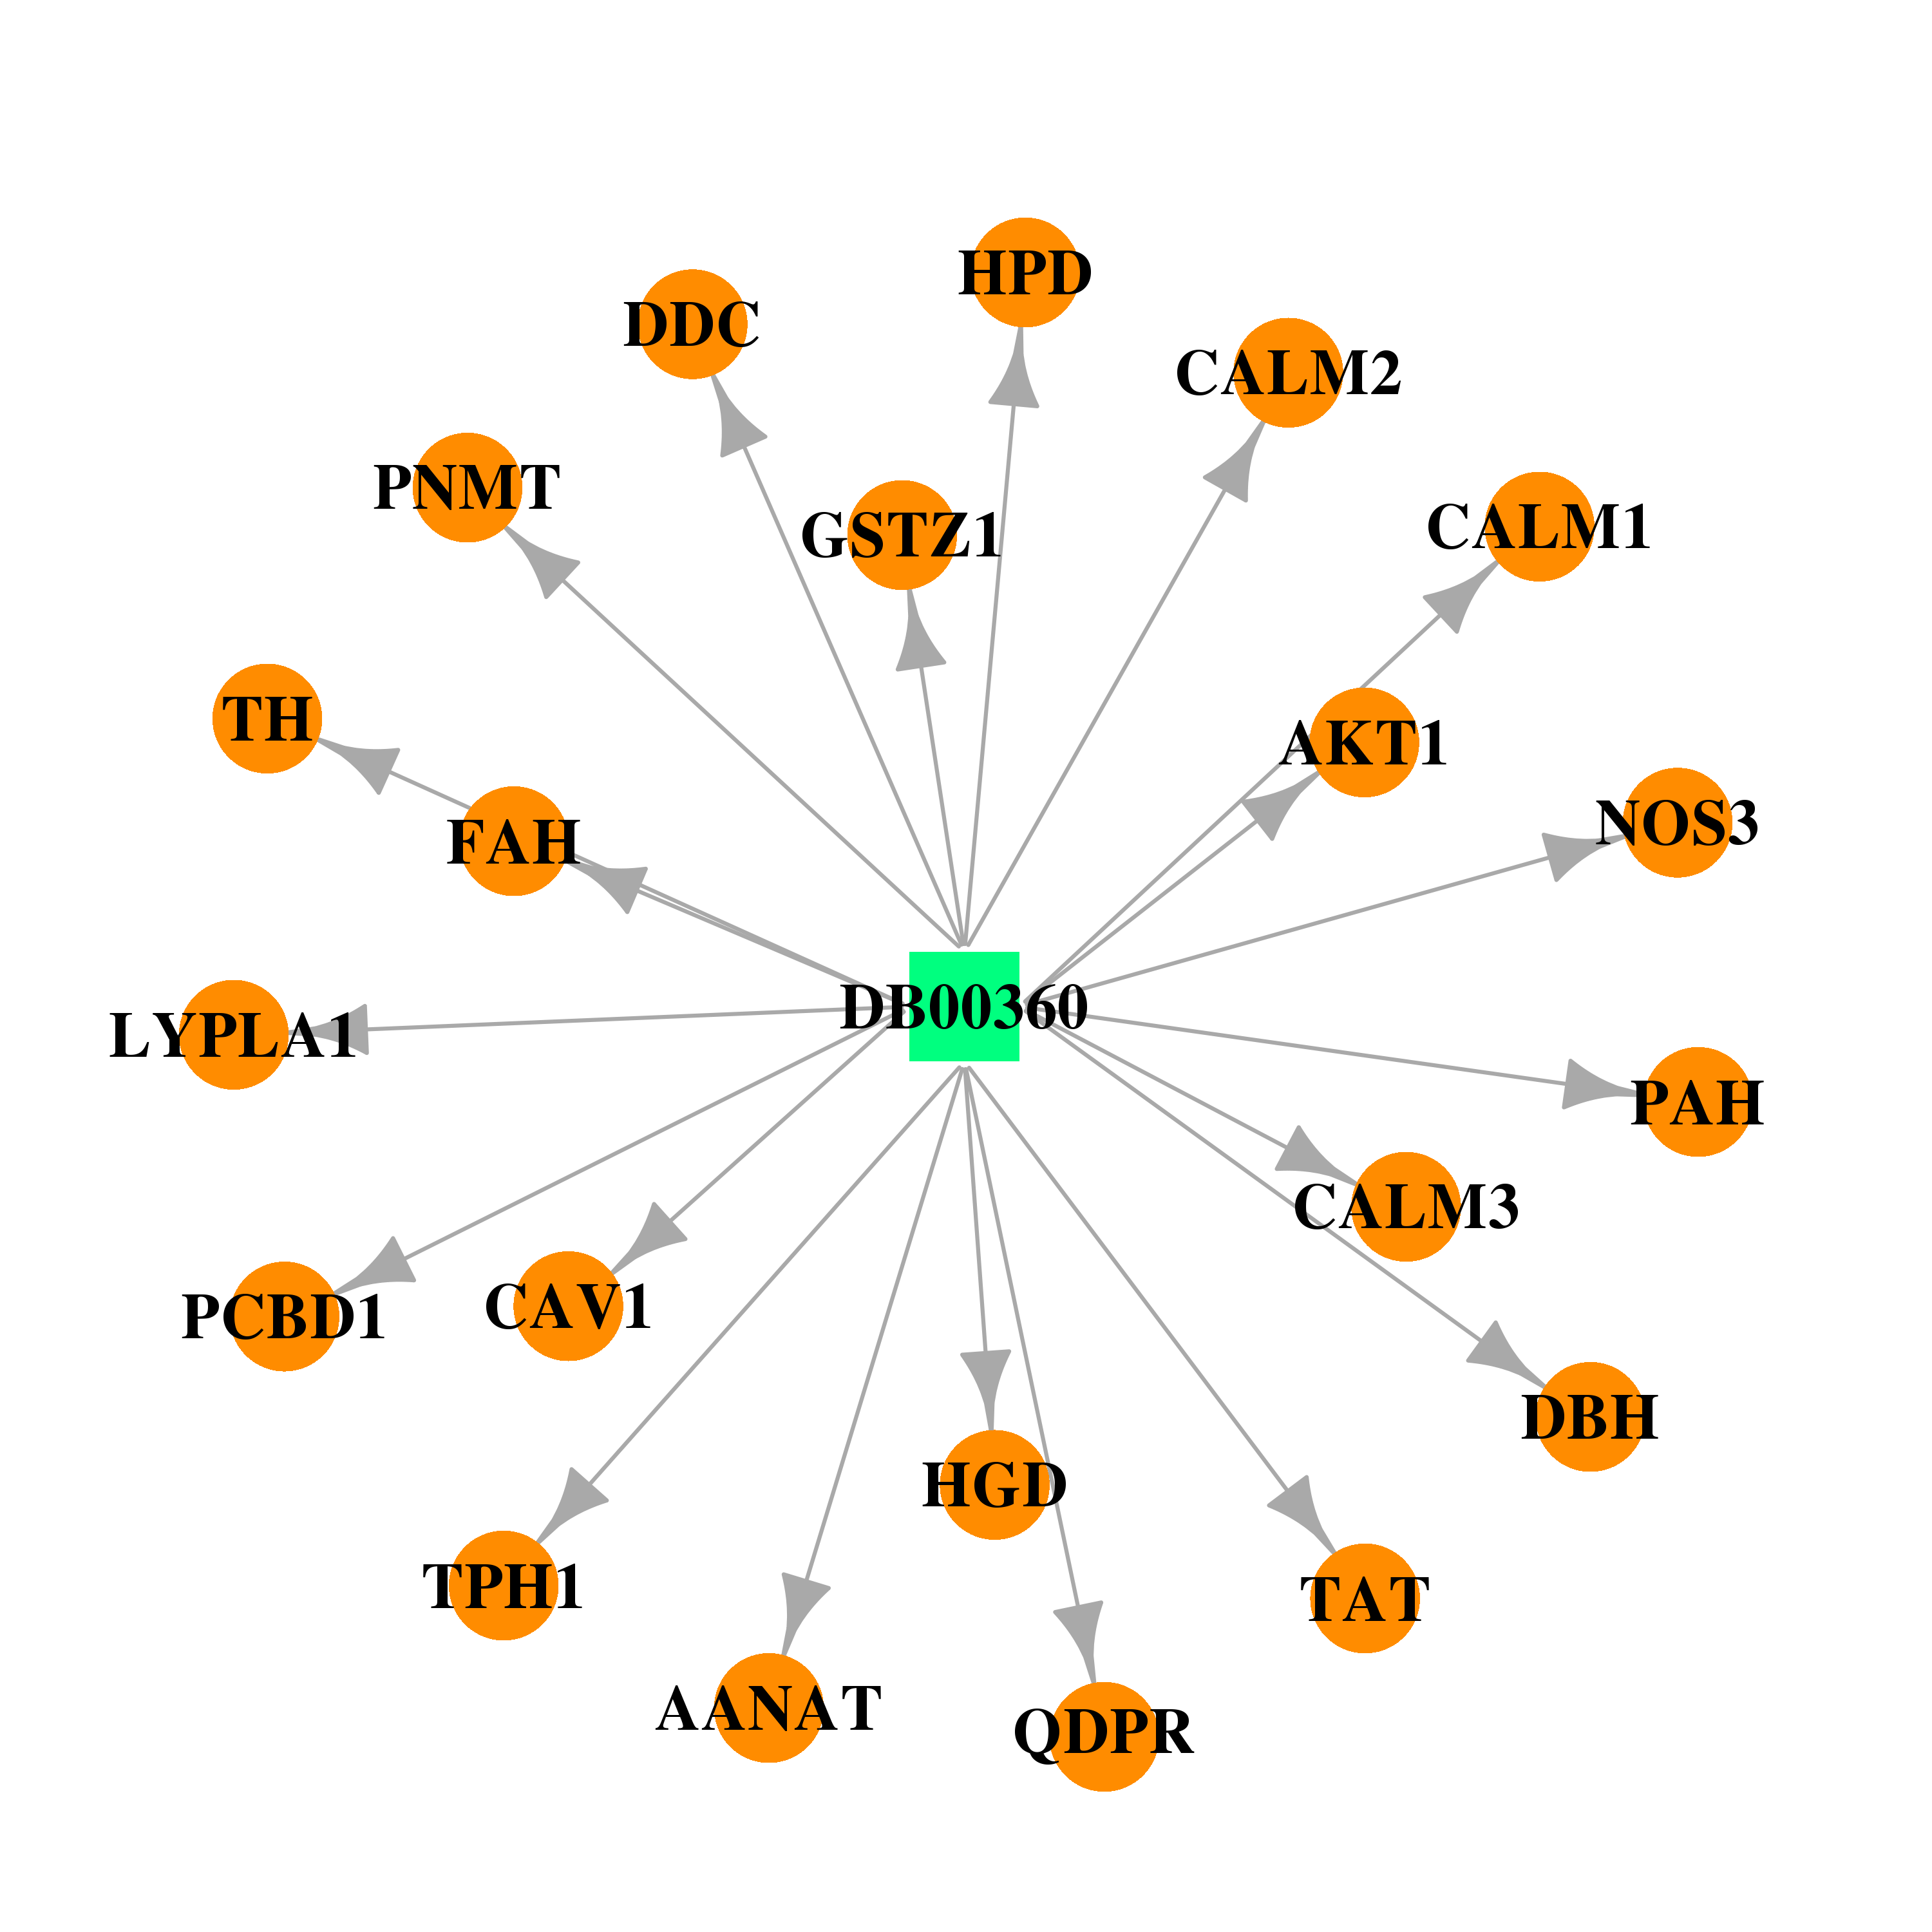 | 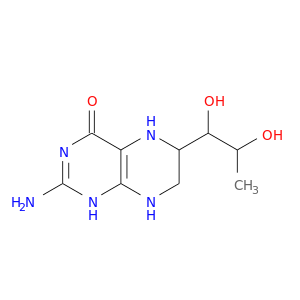 |
| Top |
| Cross referenced IDs for HPD |
| * We obtained these cross-references from Uniprot database. It covers 150 different DBs, 18 categories. http://www.uniprot.org/help/cross_references_section |
: Open all cross reference information
|
Copyright © 2016-Present - The Univsersity of Texas Health Science Center at Houston @ |