|
||||||||||||||||||||
| |
| Phenotypic Information (metabolism pathway, cancer, disease, phenome) |
| |
| |
| Gene-Gene Network Information: Co-Expression Network, Interacting Genes & KEGG |
| |
|


| Gene Summary for HPRT1 |
| Top |
| Phenotypic Information for HPRT1(metabolism pathway, cancer, disease, phenome) |
| Cancer | CGAP: HPRT1 |
| Familial Cancer Database: HPRT1 | |
| * This gene is included in those cancer gene databases. |
|
|
|
|
|
| . | ||||||||||||||
Oncogene 1 | Significant driver gene in | |||||||||||||||||||
| cf) number; DB name 1 Oncogene; http://nar.oxfordjournals.org/content/35/suppl_1/D721.long, 2 Tumor Suppressor gene; https://bioinfo.uth.edu/TSGene/, 3 Cancer Gene Census; http://www.nature.com/nrc/journal/v4/n3/abs/nrc1299.html, 4 CancerGenes; http://nar.oxfordjournals.org/content/35/suppl_1/D721.long, 5 Network of Cancer Gene; http://ncg.kcl.ac.uk/index.php, 1Therapeutic Vulnerabilities in Cancer; http://cbio.mskcc.org/cancergenomics/statius/ |
| KEGG_PURINE_METABOLISM KEGG_DRUG_METABOLISM_OTHER_ENZYMES REACTOME_METABOLISM_OF_NUCLEOTIDES REACTOME_PURINE_METABOLISM | |
| OMIM | 300322; phenotype. 300323; phenotype. 308000; gene. |
| Orphanet | 510; Lesch-Nyhan syndrome. 79233; Hypoxanthine guanine phosphoribosyltransferase partial deficiency. |
| Disease | KEGG Disease: HPRT1 |
| MedGen: HPRT1 (Human Medical Genetics with Condition) | |
| ClinVar: HPRT1 | |
| Phenotype | MGI: HPRT1 (International Mouse Phenotyping Consortium) |
| PhenomicDB: HPRT1 | |
| Mutations for HPRT1 |
| * Under tables are showing count per each tissue to give us broad intuition about tissue specific mutation patterns.You can go to the detailed page for each mutation database's web site. |
| There's no structural variation information in COSMIC data for this gene. |
| * From mRNA Sanger sequences, Chitars2.0 arranged chimeric transcripts. This table shows HPRT1 related fusion information. |
| ID | Head Gene | Tail Gene | Accession | Gene_a | qStart_a | qEnd_a | Chromosome_a | tStart_a | tEnd_a | Gene_a | qStart_a | qEnd_a | Chromosome_a | tStart_a | tEnd_a |
| BE180729 | SLC25A38 | 11 | 100 | 3 | 39433057 | 39433380 | HPRT1 | 99 | 179 | X | 133609267 | 133609347 | |
| AW889771 | HPRT1 | 12 | 294 | X | 133634320 | 133634600 | PRH1-PRR4 | 285 | 616 | 12 | 11069957 | 11070289 | |
| BE467833 | HPRT1 | 2 | 361 | X | 133634339 | 133634698 | HNRPDL | 356 | 492 | 4 | 83349432 | 83349569 | |
| Top |
| There's no copy number variation information in COSMIC data for this gene. |
| Top |
|
 |
| Top |
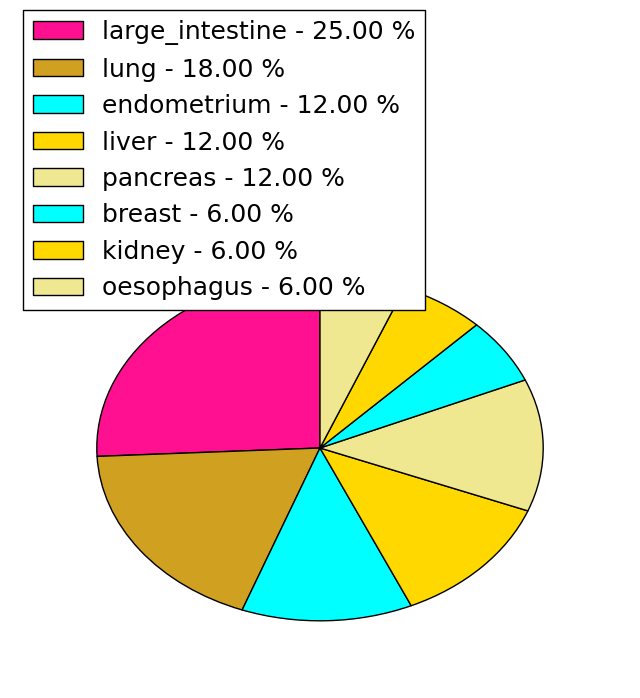
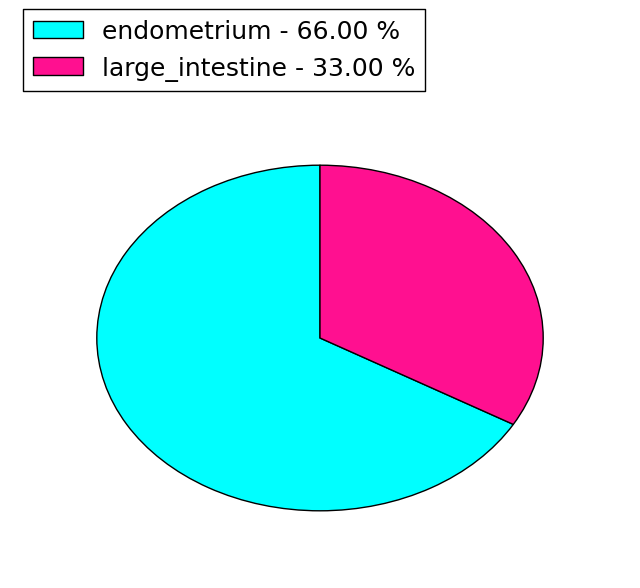
| Stat. for Non-Synonymous SNVs (# total SNVs=16) | (# total SNVs=3) |
 |  |
(# total SNVs=0) | (# total SNVs=0) |
| Top |
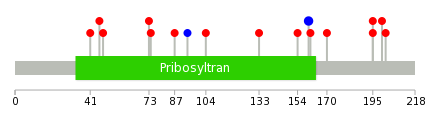
| * When you move the cursor on each content, you can see more deailed mutation information on the Tooltip. Those are primary_site,primary_histology,mutation(aa),pubmedID. |
| GRCh37 position | Mutation(aa) | Unique sampleID count |
| chr23:133627615-133627615 | p.V160V | 2 |
| chr23:133609298-133609298 | p.F74L | 1 |
| chr23:133632689-133632689 | p.Y195C | 1 |
| chr23:133609336-133609336 | p.R87I | 1 |
| chr23:133632704-133632704 | p.R200M | 1 |
| chr23:133609358-133609358 | p.P94P | 1 |
| chr23:133632710-133632710 | p.L202S | 1 |
| chr23:133609387-133609387 | p.S104I | 1 |
| chr23:133620531-133620531 | p.G119* | 1 |
| chr23:133624231-133624231 | p.V133A | 1 |
| Top |
|
 |
| Point Mutation/ Tissue ID | 1 | 2 | 3 | 4 | 5 | 6 | 7 | 8 | 9 | 10 | 11 | 12 | 13 | 14 | 15 | 16 | 17 | 18 | 19 | 20 |
| # sample | 3 | 1 | 1 | 1 | 1 | 3 | ||||||||||||||
| # mutation | 3 | 1 | 1 | 1 | 1 | 3 | ||||||||||||||
| nonsynonymous SNV | 2 | 1 | 1 | 1 | 1 | 2 | ||||||||||||||
| synonymous SNV | 1 | 1 |
| cf) Tissue ID; Tissue type (1; BLCA[Bladder Urothelial Carcinoma], 2; BRCA[Breast invasive carcinoma], 3; CESC[Cervical squamous cell carcinoma and endocervical adenocarcinoma], 4; COAD[Colon adenocarcinoma], 5; GBM[Glioblastoma multiforme], 6; Glioma Low Grade, 7; HNSC[Head and Neck squamous cell carcinoma], 8; KICH[Kidney Chromophobe], 9; KIRC[Kidney renal clear cell carcinoma], 10; KIRP[Kidney renal papillary cell carcinoma], 11; LAML[Acute Myeloid Leukemia], 12; LUAD[Lung adenocarcinoma], 13; LUSC[Lung squamous cell carcinoma], 14; OV[Ovarian serous cystadenocarcinoma ], 15; PAAD[Pancreatic adenocarcinoma], 16; PRAD[Prostate adenocarcinoma], 17; SKCM[Skin Cutaneous Melanoma], 18:STAD[Stomach adenocarcinoma], 19:THCA[Thyroid carcinoma], 20:UCEC[Uterine Corpus Endometrial Carcinoma]) |
| Top |
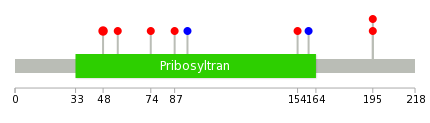
| * We represented just top 10 SNVs. When you move the cursor on each content, you can see more deailed mutation information on the Tooltip. Those are primary_site, primary_histology, mutation(aa), pubmedID. |
| Genomic Position | Mutation(aa) | Unique sampleID count |
| chrX:133609219 | p.R48H | 2 |
| chrX:133609358 | p.Y195N | 1 |
| chrX:133627595 | p.Y195C | 1 |
| chrX:133627615 | p.E56D | 1 |
| chrX:133632688 | p.F74L | 1 |
| chrX:133632689 | p.R87I | 1 |
| chrX:133609244 | p.P94P | 1 |
| chrX:133609298 | p.N154H | 1 |
| chrX:133609336 | p.V160V | 1 |
| * Copy number data were extracted from TCGA using R package TCGA-Assembler. The URLs of all public data files on TCGA DCC data server were gathered on Jan-05-2015. Function ProcessCNAData in TCGA-Assembler package was used to obtain gene-level copy number value which is calculated as the average copy number of the genomic region of a gene. |
 |
| cf) Tissue ID[Tissue type]: BLCA[Bladder Urothelial Carcinoma], BRCA[Breast invasive carcinoma], CESC[Cervical squamous cell carcinoma and endocervical adenocarcinoma], COAD[Colon adenocarcinoma], GBM[Glioblastoma multiforme], Glioma Low Grade, HNSC[Head and Neck squamous cell carcinoma], KICH[Kidney Chromophobe], KIRC[Kidney renal clear cell carcinoma], KIRP[Kidney renal papillary cell carcinoma], LAML[Acute Myeloid Leukemia], LUAD[Lung adenocarcinoma], LUSC[Lung squamous cell carcinoma], OV[Ovarian serous cystadenocarcinoma ], PAAD[Pancreatic adenocarcinoma], PRAD[Prostate adenocarcinoma], SKCM[Skin Cutaneous Melanoma], STAD[Stomach adenocarcinoma], THCA[Thyroid carcinoma], UCEC[Uterine Corpus Endometrial Carcinoma] |
| Top |
| Gene Expression for HPRT1 |
| * CCLE gene expression data were extracted from CCLE_Expression_Entrez_2012-10-18.res: Gene-centric RMA-normalized mRNA expression data. |
 |
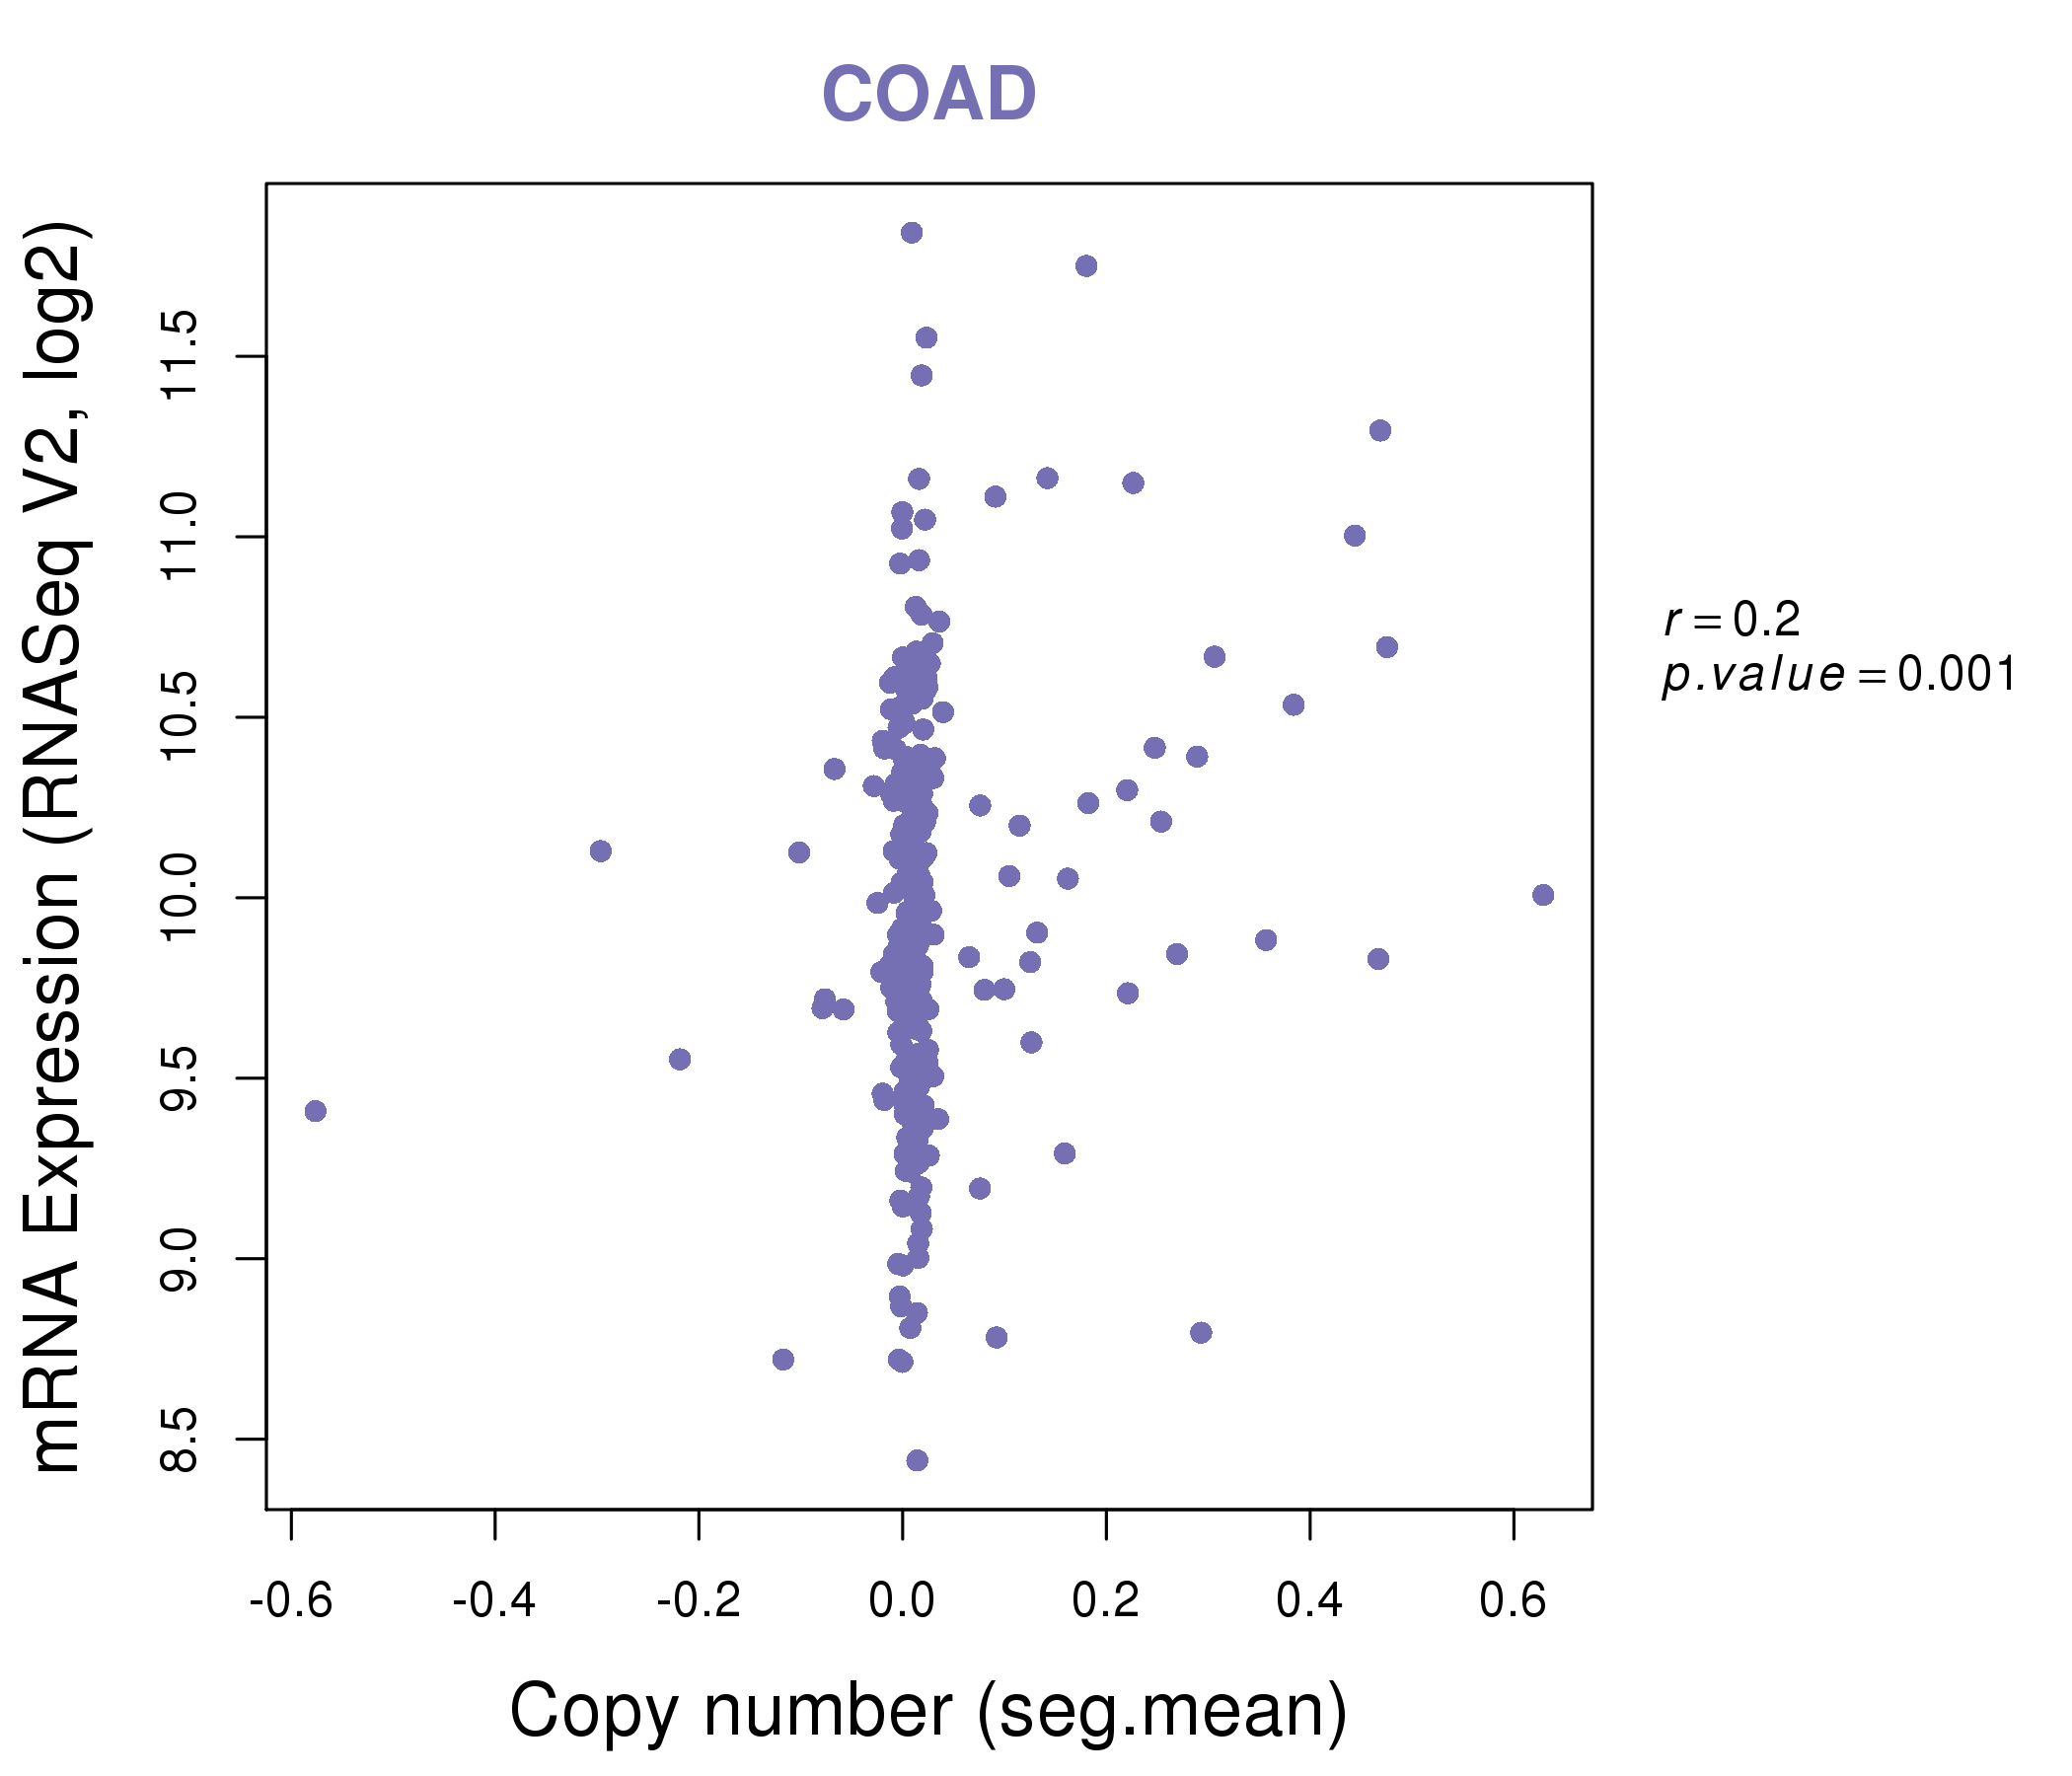
| * Normalized gene expression data of RNASeqV2 was extracted from TCGA using R package TCGA-Assembler. The URLs of all public data files on TCGA DCC data server were gathered at Jan-05-2015. Only eight cancer types have enough normal control samples for differential expression analysis. (t test, adjusted p<0.05 (using Benjamini-Hochberg FDR)) |
 |
| Top |
| * This plots show the correlation between CNV and gene expression. |
: Open all plots for all cancer types
 |
|
 |
|


| Top |
| Gene-Gene Network Information |
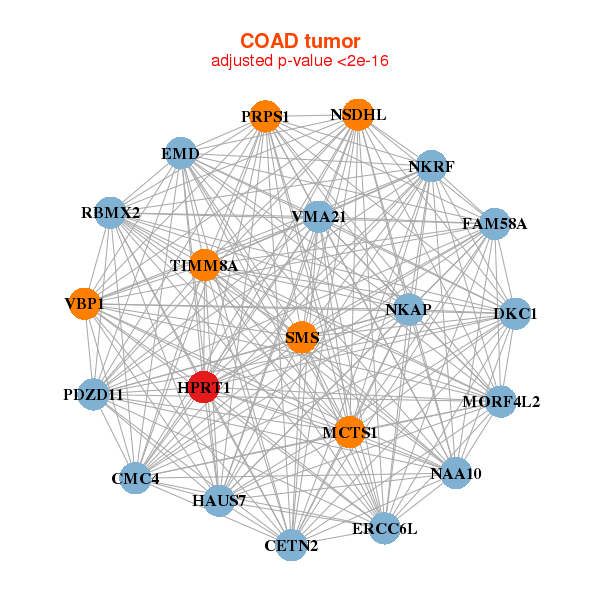
| * Co-Expression network figures were drawn using R package igraph. Only the top 20 genes with the highest correlations were shown. Red circle: input gene, orange circle: cell metabolism gene, sky circle: other gene |
: Open all plots for all cancer types
 |
| ||||
| ATP5C1,CCDC58,CDCA3,CKS2,FAM127B,HPRT1,LOC401397, MRPL3,NKRF,NUP37,C7orf73,PTTG1,RHEB,SKA1, SNRPG,SSBP1,TIMM8A,TPX2,VBP1,VMA21,VRK1 | CISD2,EBPL,EEF1E1,H3F3A,HMGN4,HPRT1,HSBP1, IQCK,LOC653566,LYSMD2,MPZL2,OSTC,C7orf73,PPA2, PPIL1,RPL22L1,SNRPE,TMEM14A,TMEM9B,UTP18,YWHAQ | ||||
 |
| ||||
| CETN2,DKC1,EMD,ERCC6L,FAM58A,HAUS7,HPRT1, MCTS1,MORF4L2,CMC4,NAA10,NKAP,NKRF,NSDHL, PDZD11,PRPS1,RBMX2,SMS,TIMM8A,VBP1,VMA21 | AK2,CMC2,C1QBP,CHAC2,HPRT1,HSPA14,HSPE1, KIAA0391,MRPL42,MRPL47,MRPS28,MYCBP,NDUFA12,NDUFAB1, POP5,PPA2,PPIA,RBBP8,SLC25A17,UCHL3,YWHAE |
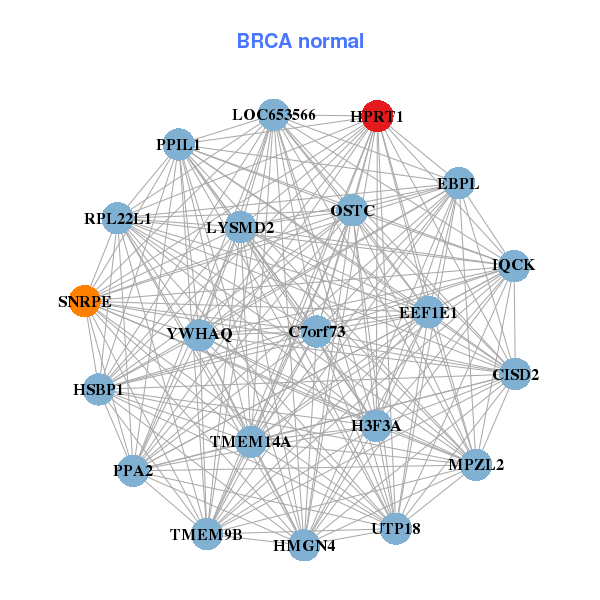
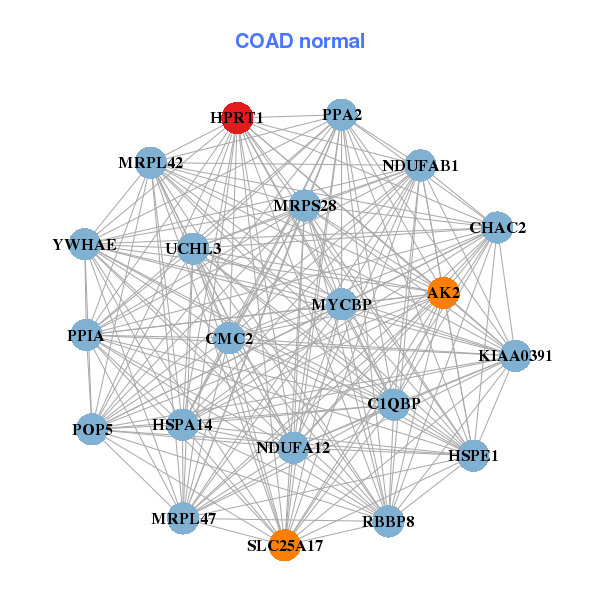
| * Co-Expression network figures were drawn using R package igraph. Only the top 20 genes with the highest correlations were shown. Red circle: input gene, orange circle: cell metabolism gene, sky circle: other gene |
: Open all plots for all cancer types
| Top |
: Open all interacting genes' information including KEGG pathway for all interacting genes from DAVID
| Top |
| Pharmacological Information for HPRT1 |
| DB Category | DB Name | DB's ID and Url link |
| Chemistry | BindingDB | P00492; -. |
| Chemistry | ChEMBL | CHEMBL2360; -. |
| Organism-specific databases | PharmGKB | PA29427; -. |
| Organism-specific databases | CTD | 3251; -. |
| * Gene Centered Interaction Network. |
 |
| * Drug Centered Interaction Network. |
| DrugBank ID | Target Name | Drug Groups | Generic Name | Drug Centered Network | Drug Structure |
| DB00993 | hypoxanthine phosphoribosyltransferase 1 | approved | Azathioprine |  |  |
| DB01033 | hypoxanthine phosphoribosyltransferase 1 | approved | Mercaptopurine | 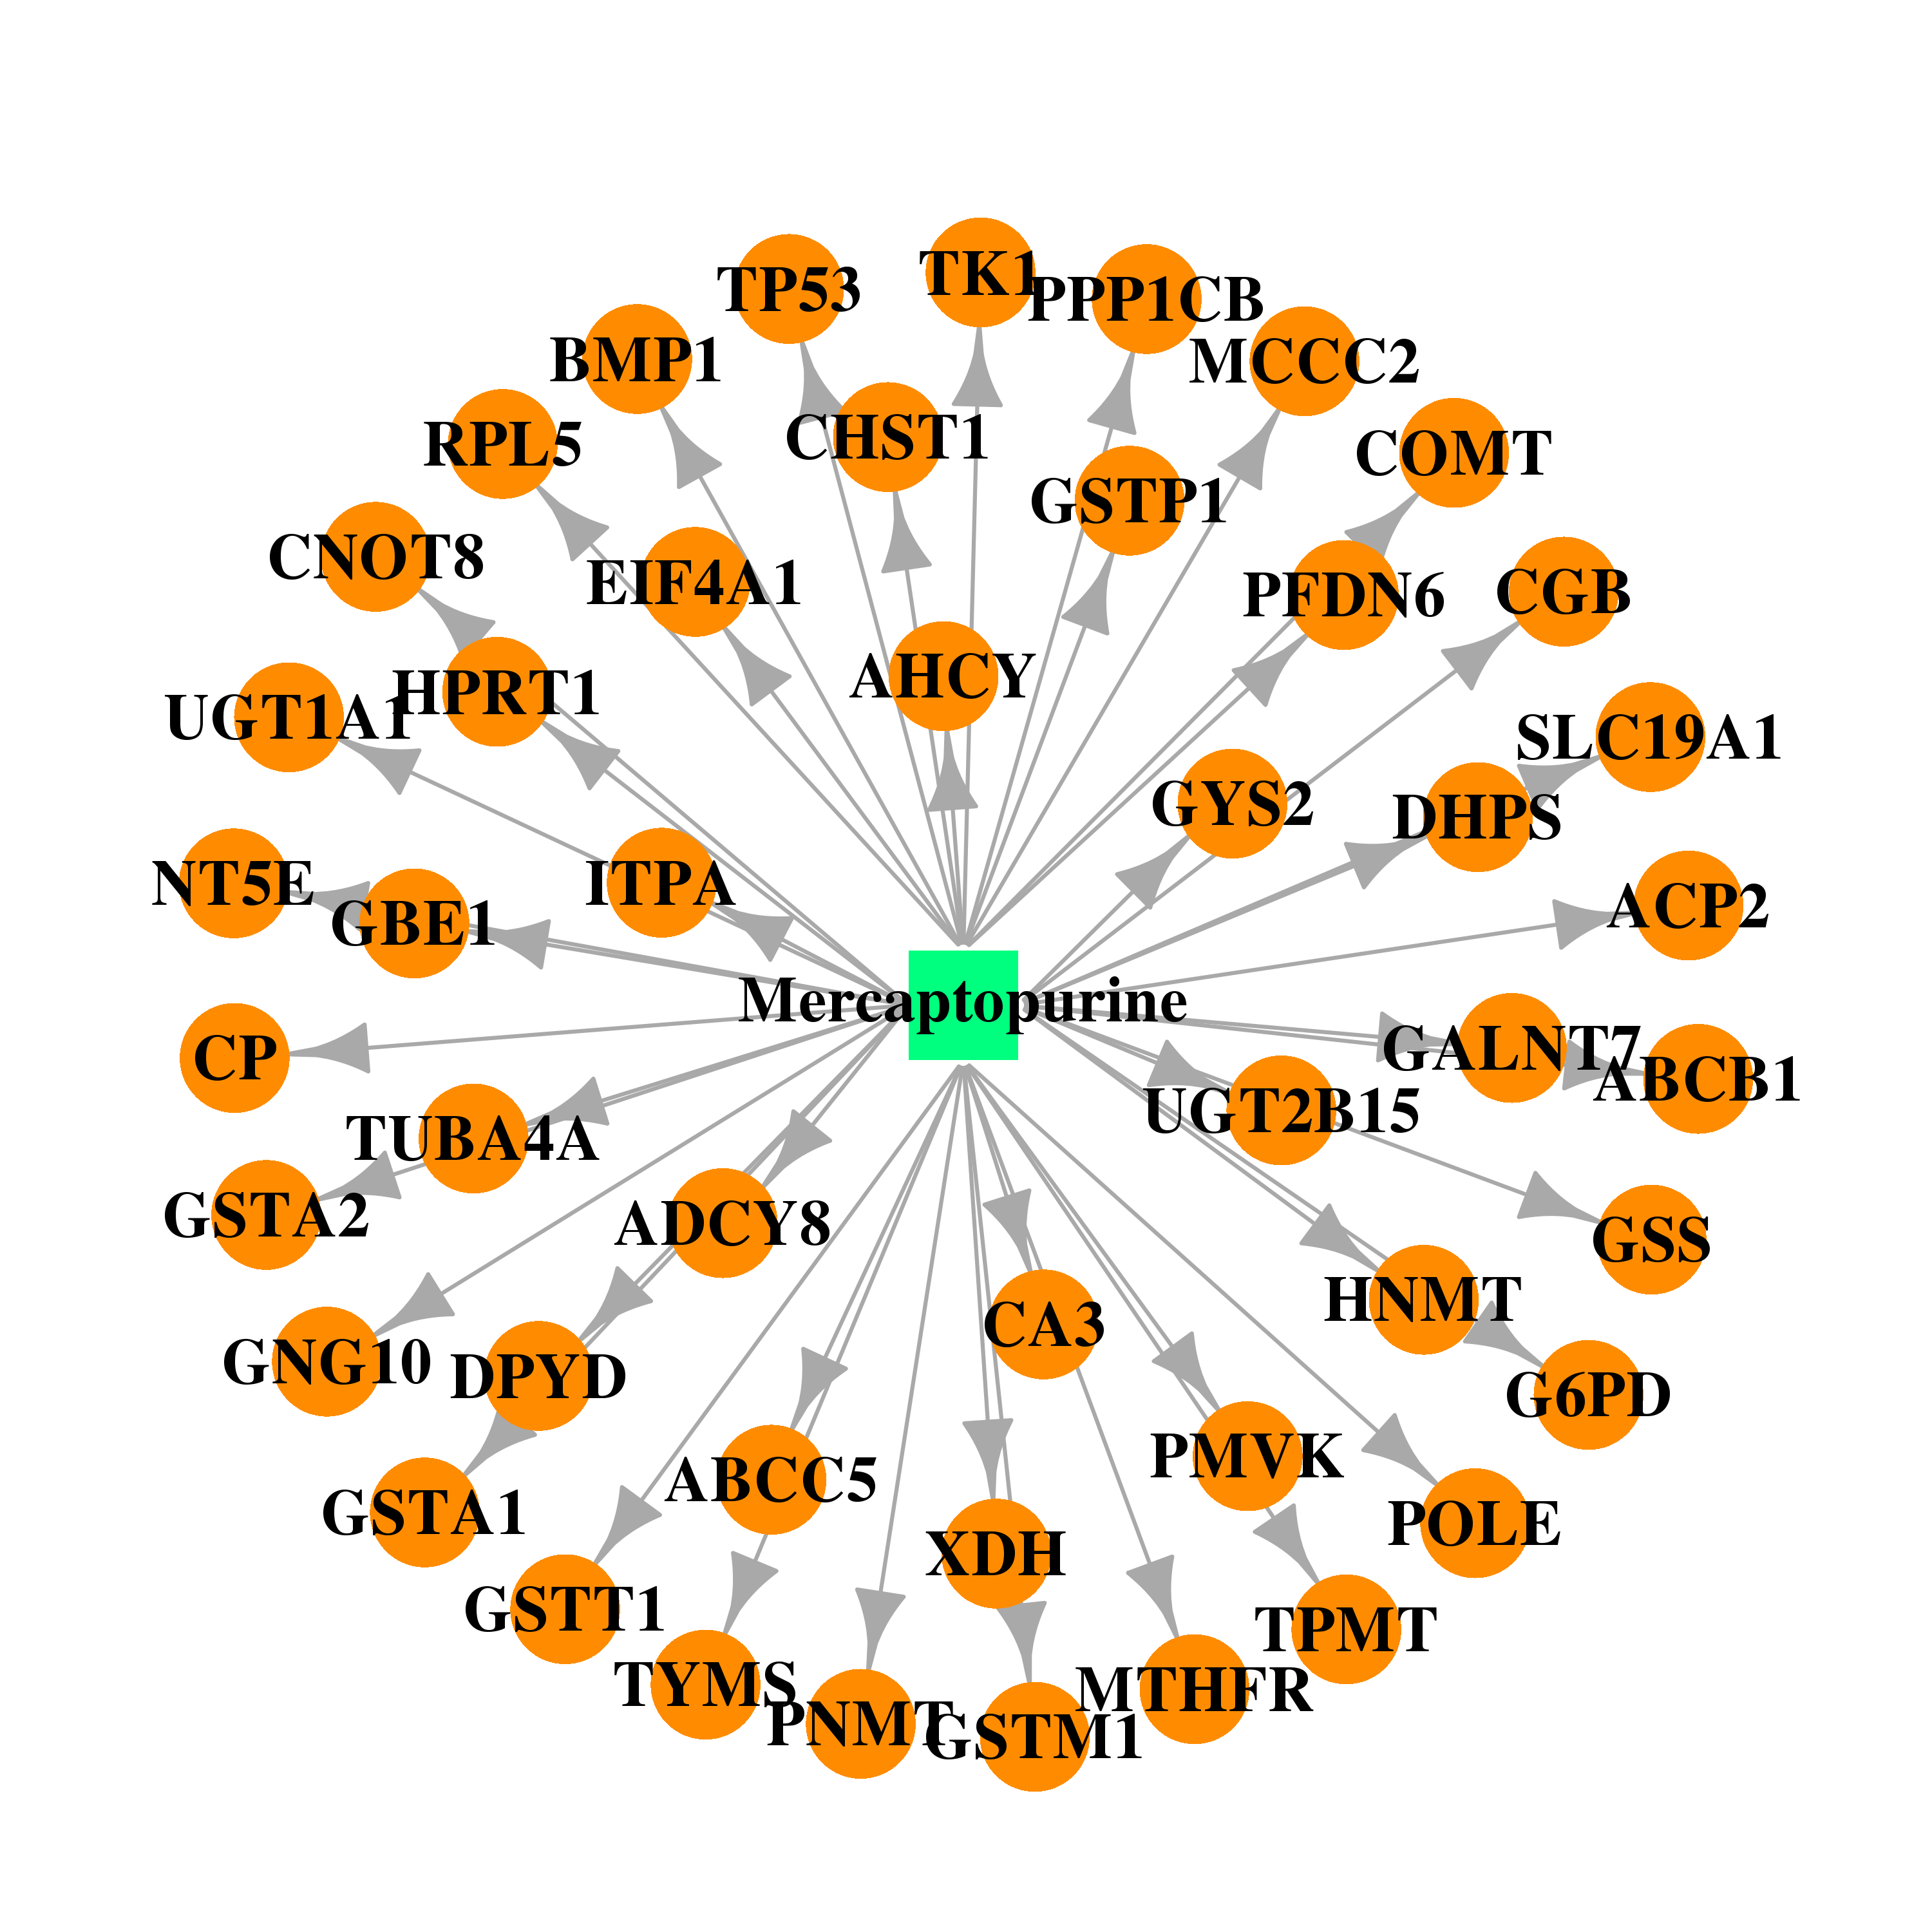 | 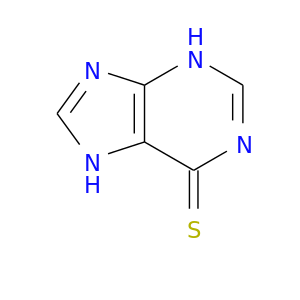 |
| DB01632 | hypoxanthine phosphoribosyltransferase 1 | experimental | Alpha-Phosphoribosylpyrophosphoric Acid |  | 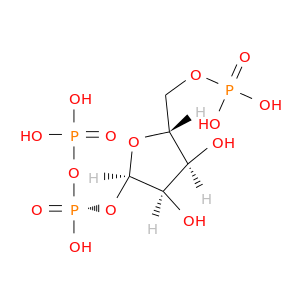 |
| DB02212 | hypoxanthine phosphoribosyltransferase 1 | experimental | Pyrophosphate 2- | 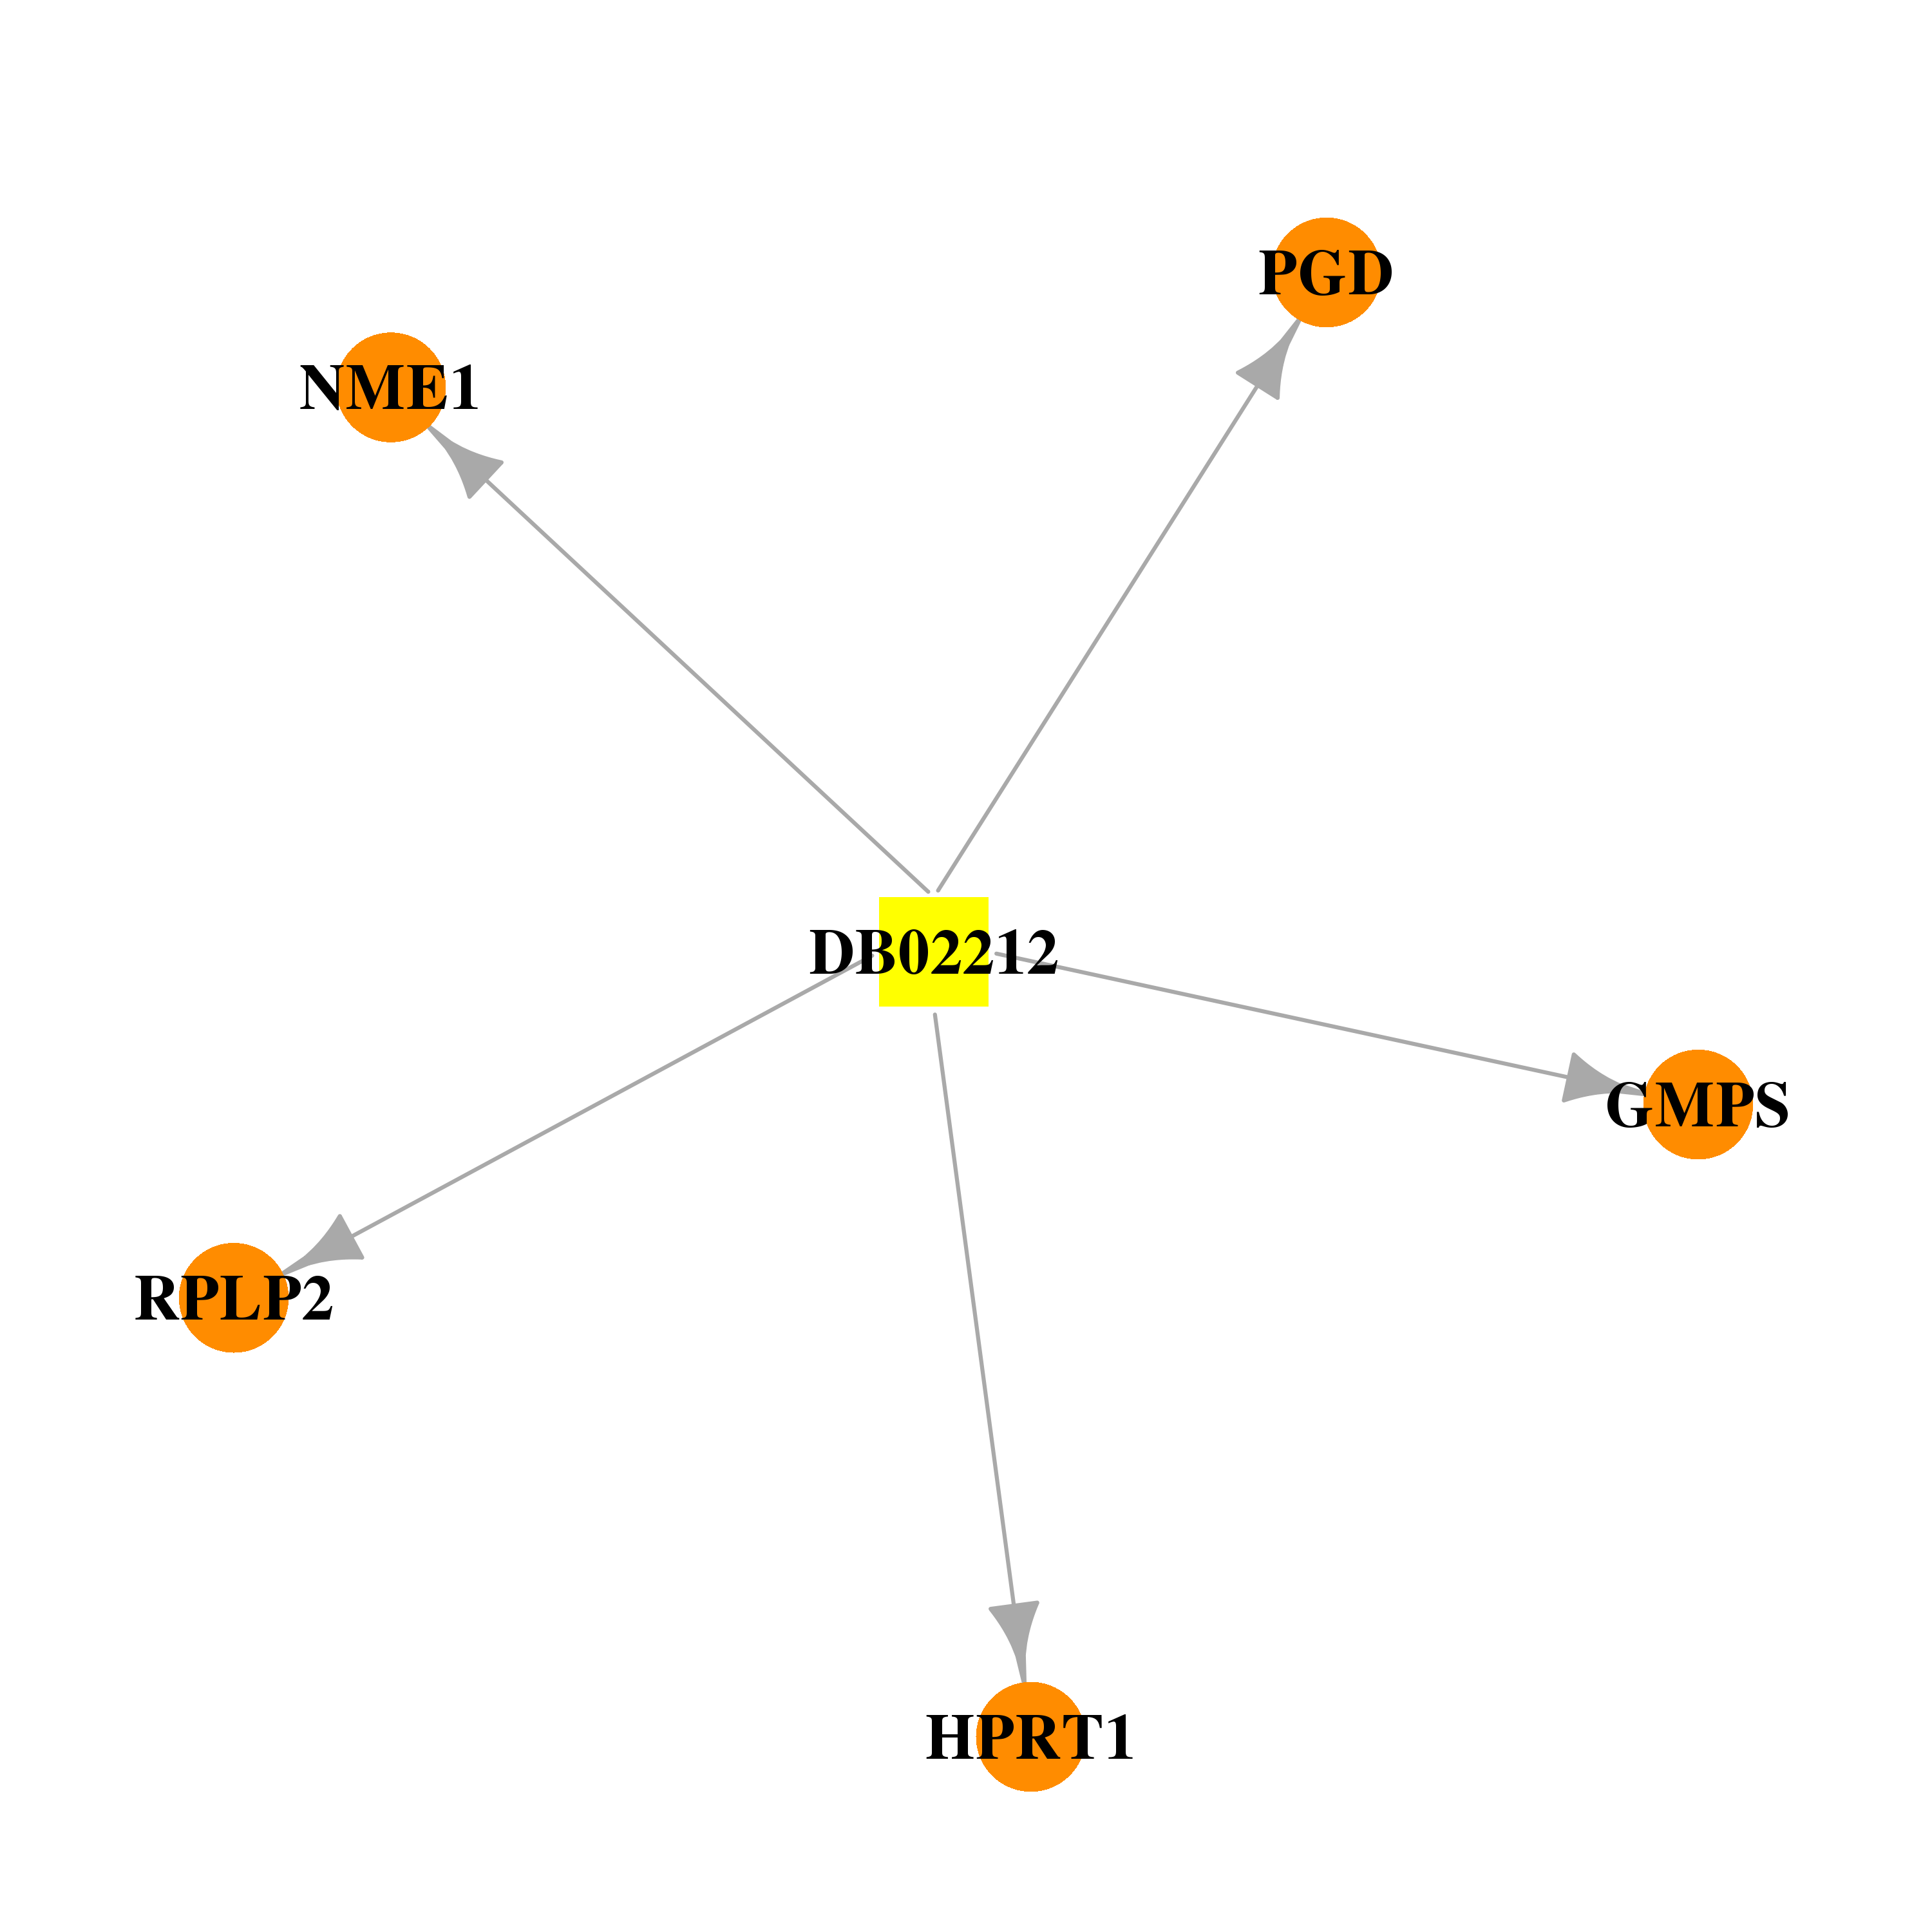 |  |
| DB02309 | hypoxanthine phosphoribosyltransferase 1 | experimental | 5--Monophosphate-9-Beta-D-Ribofuranosyl Xanthine |  |  |
| DB03153 | hypoxanthine phosphoribosyltransferase 1 | experimental | 3h-Pyrazolo[4,3-D]Pyrimidin-7-Ol | 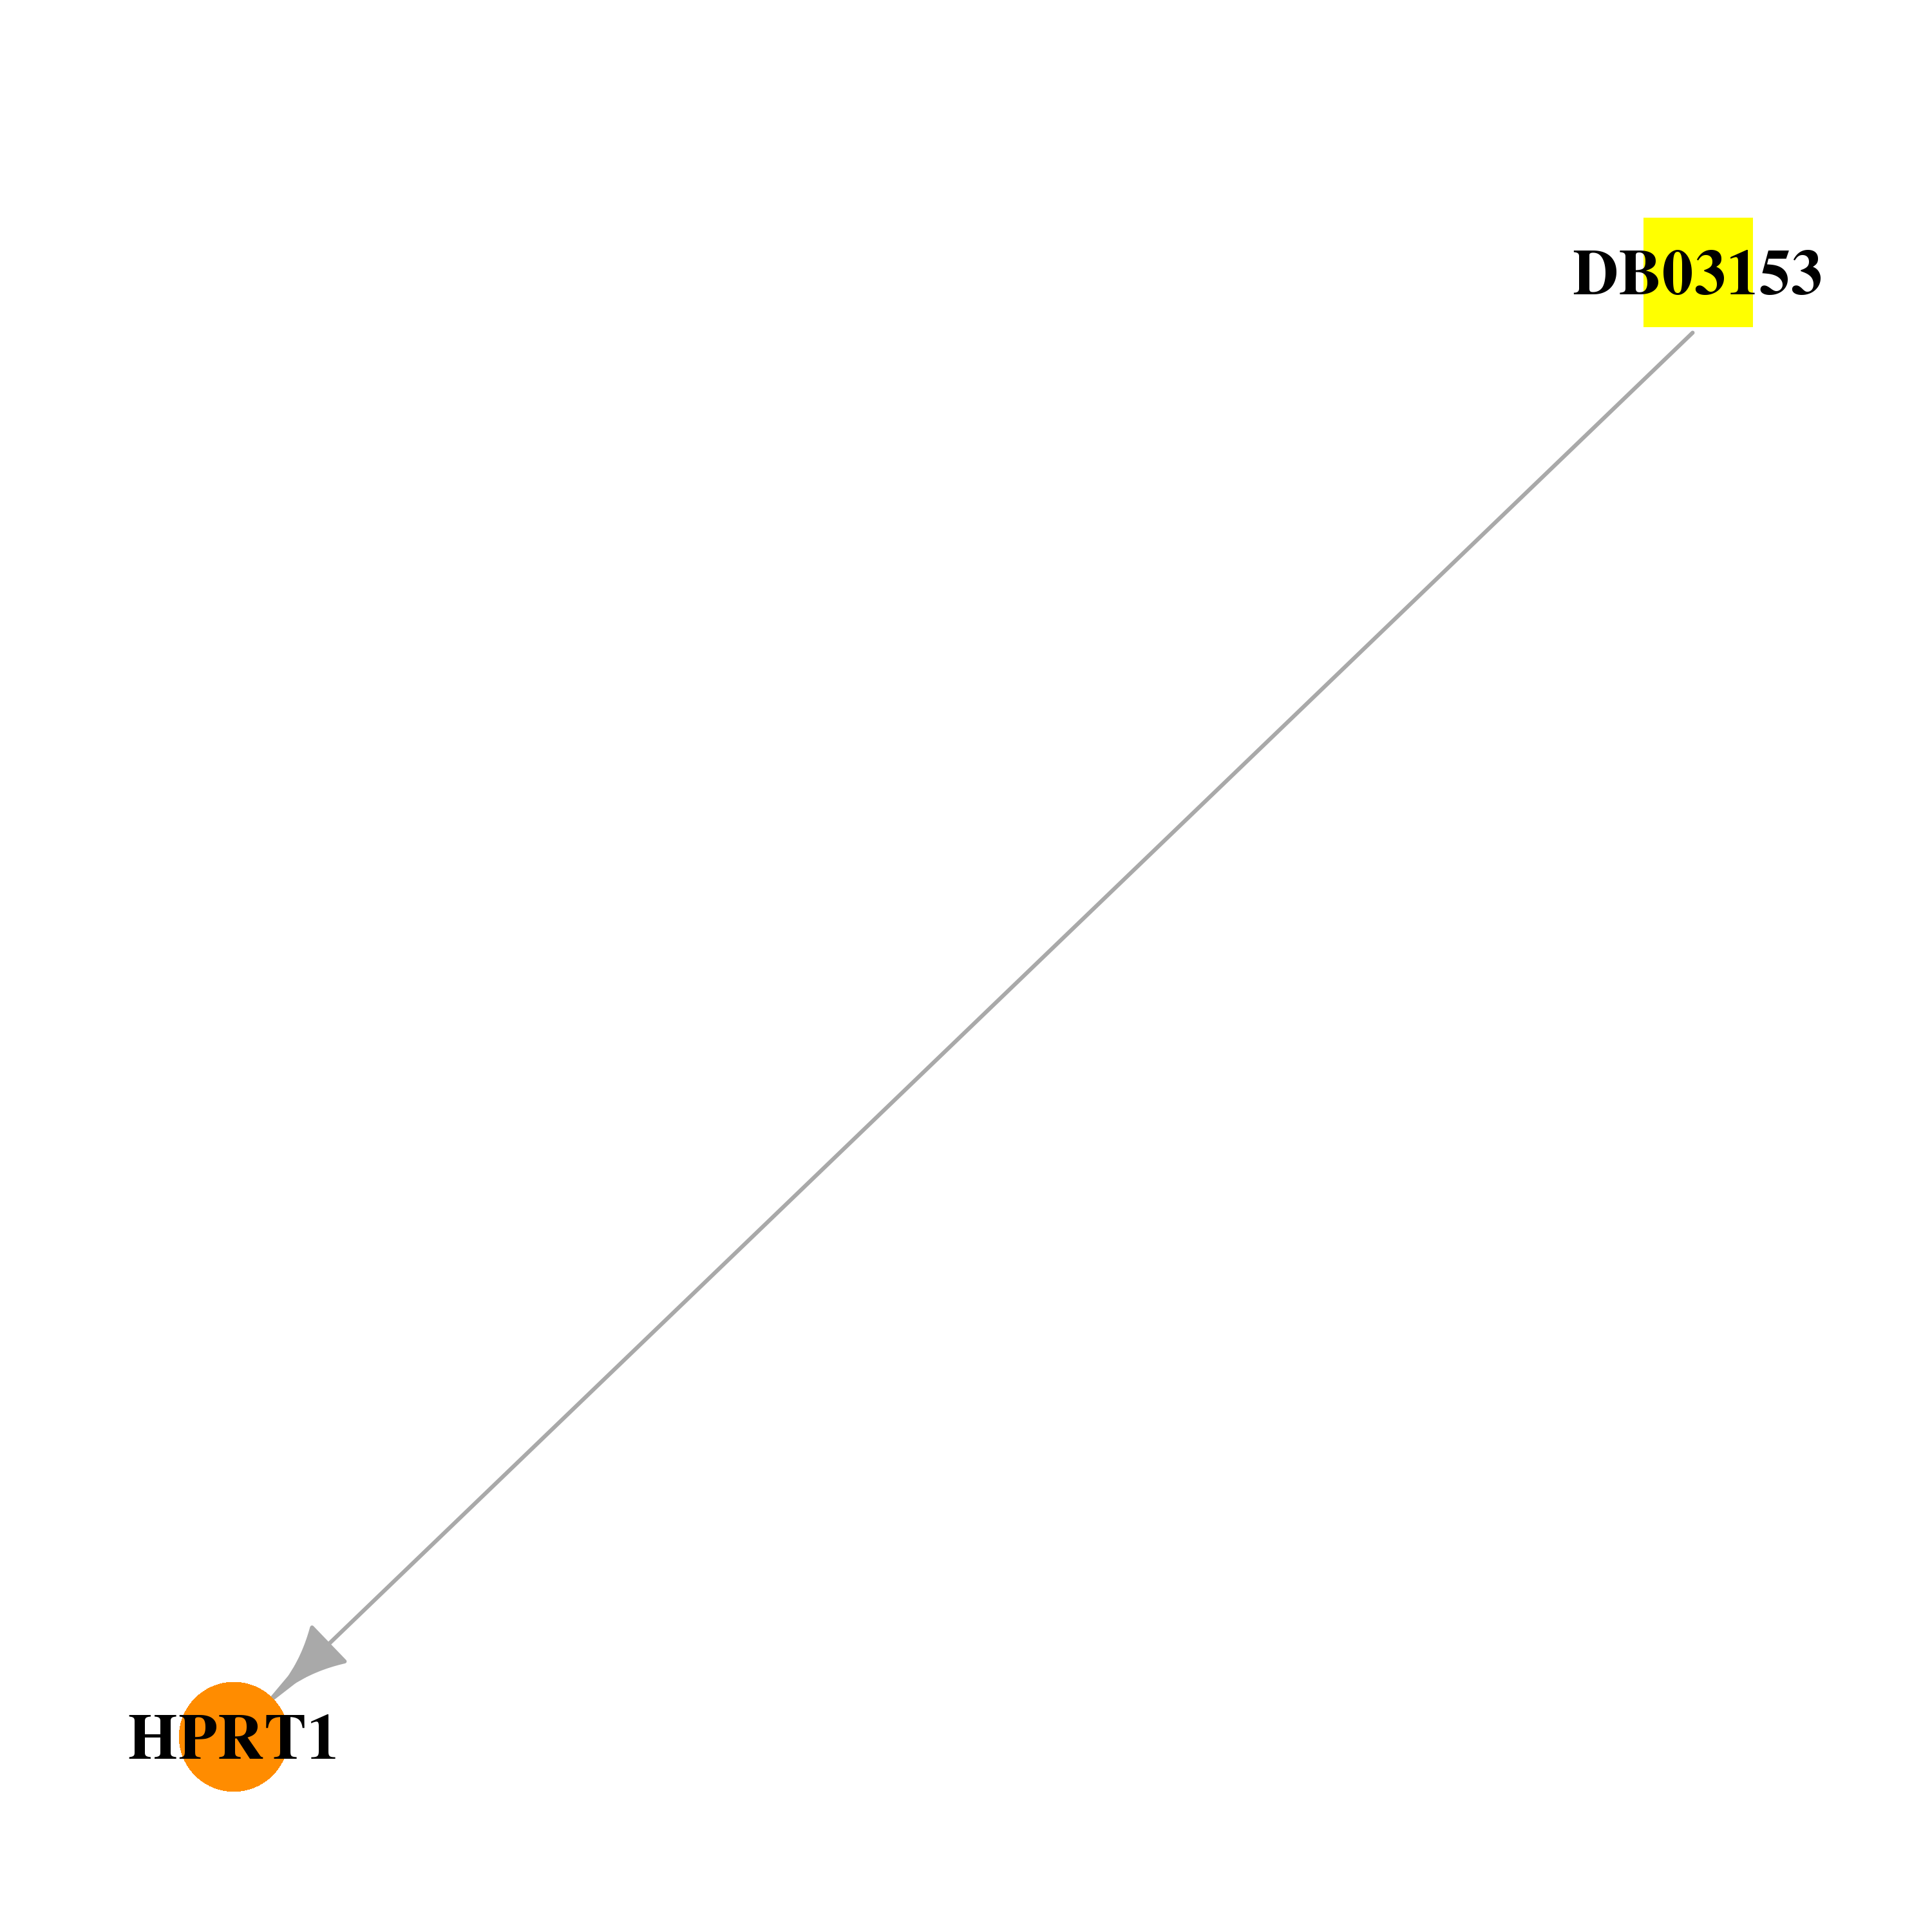 |  |
| DB04356 | hypoxanthine phosphoribosyltransferase 1 | experimental | 9-Deazaguanine | 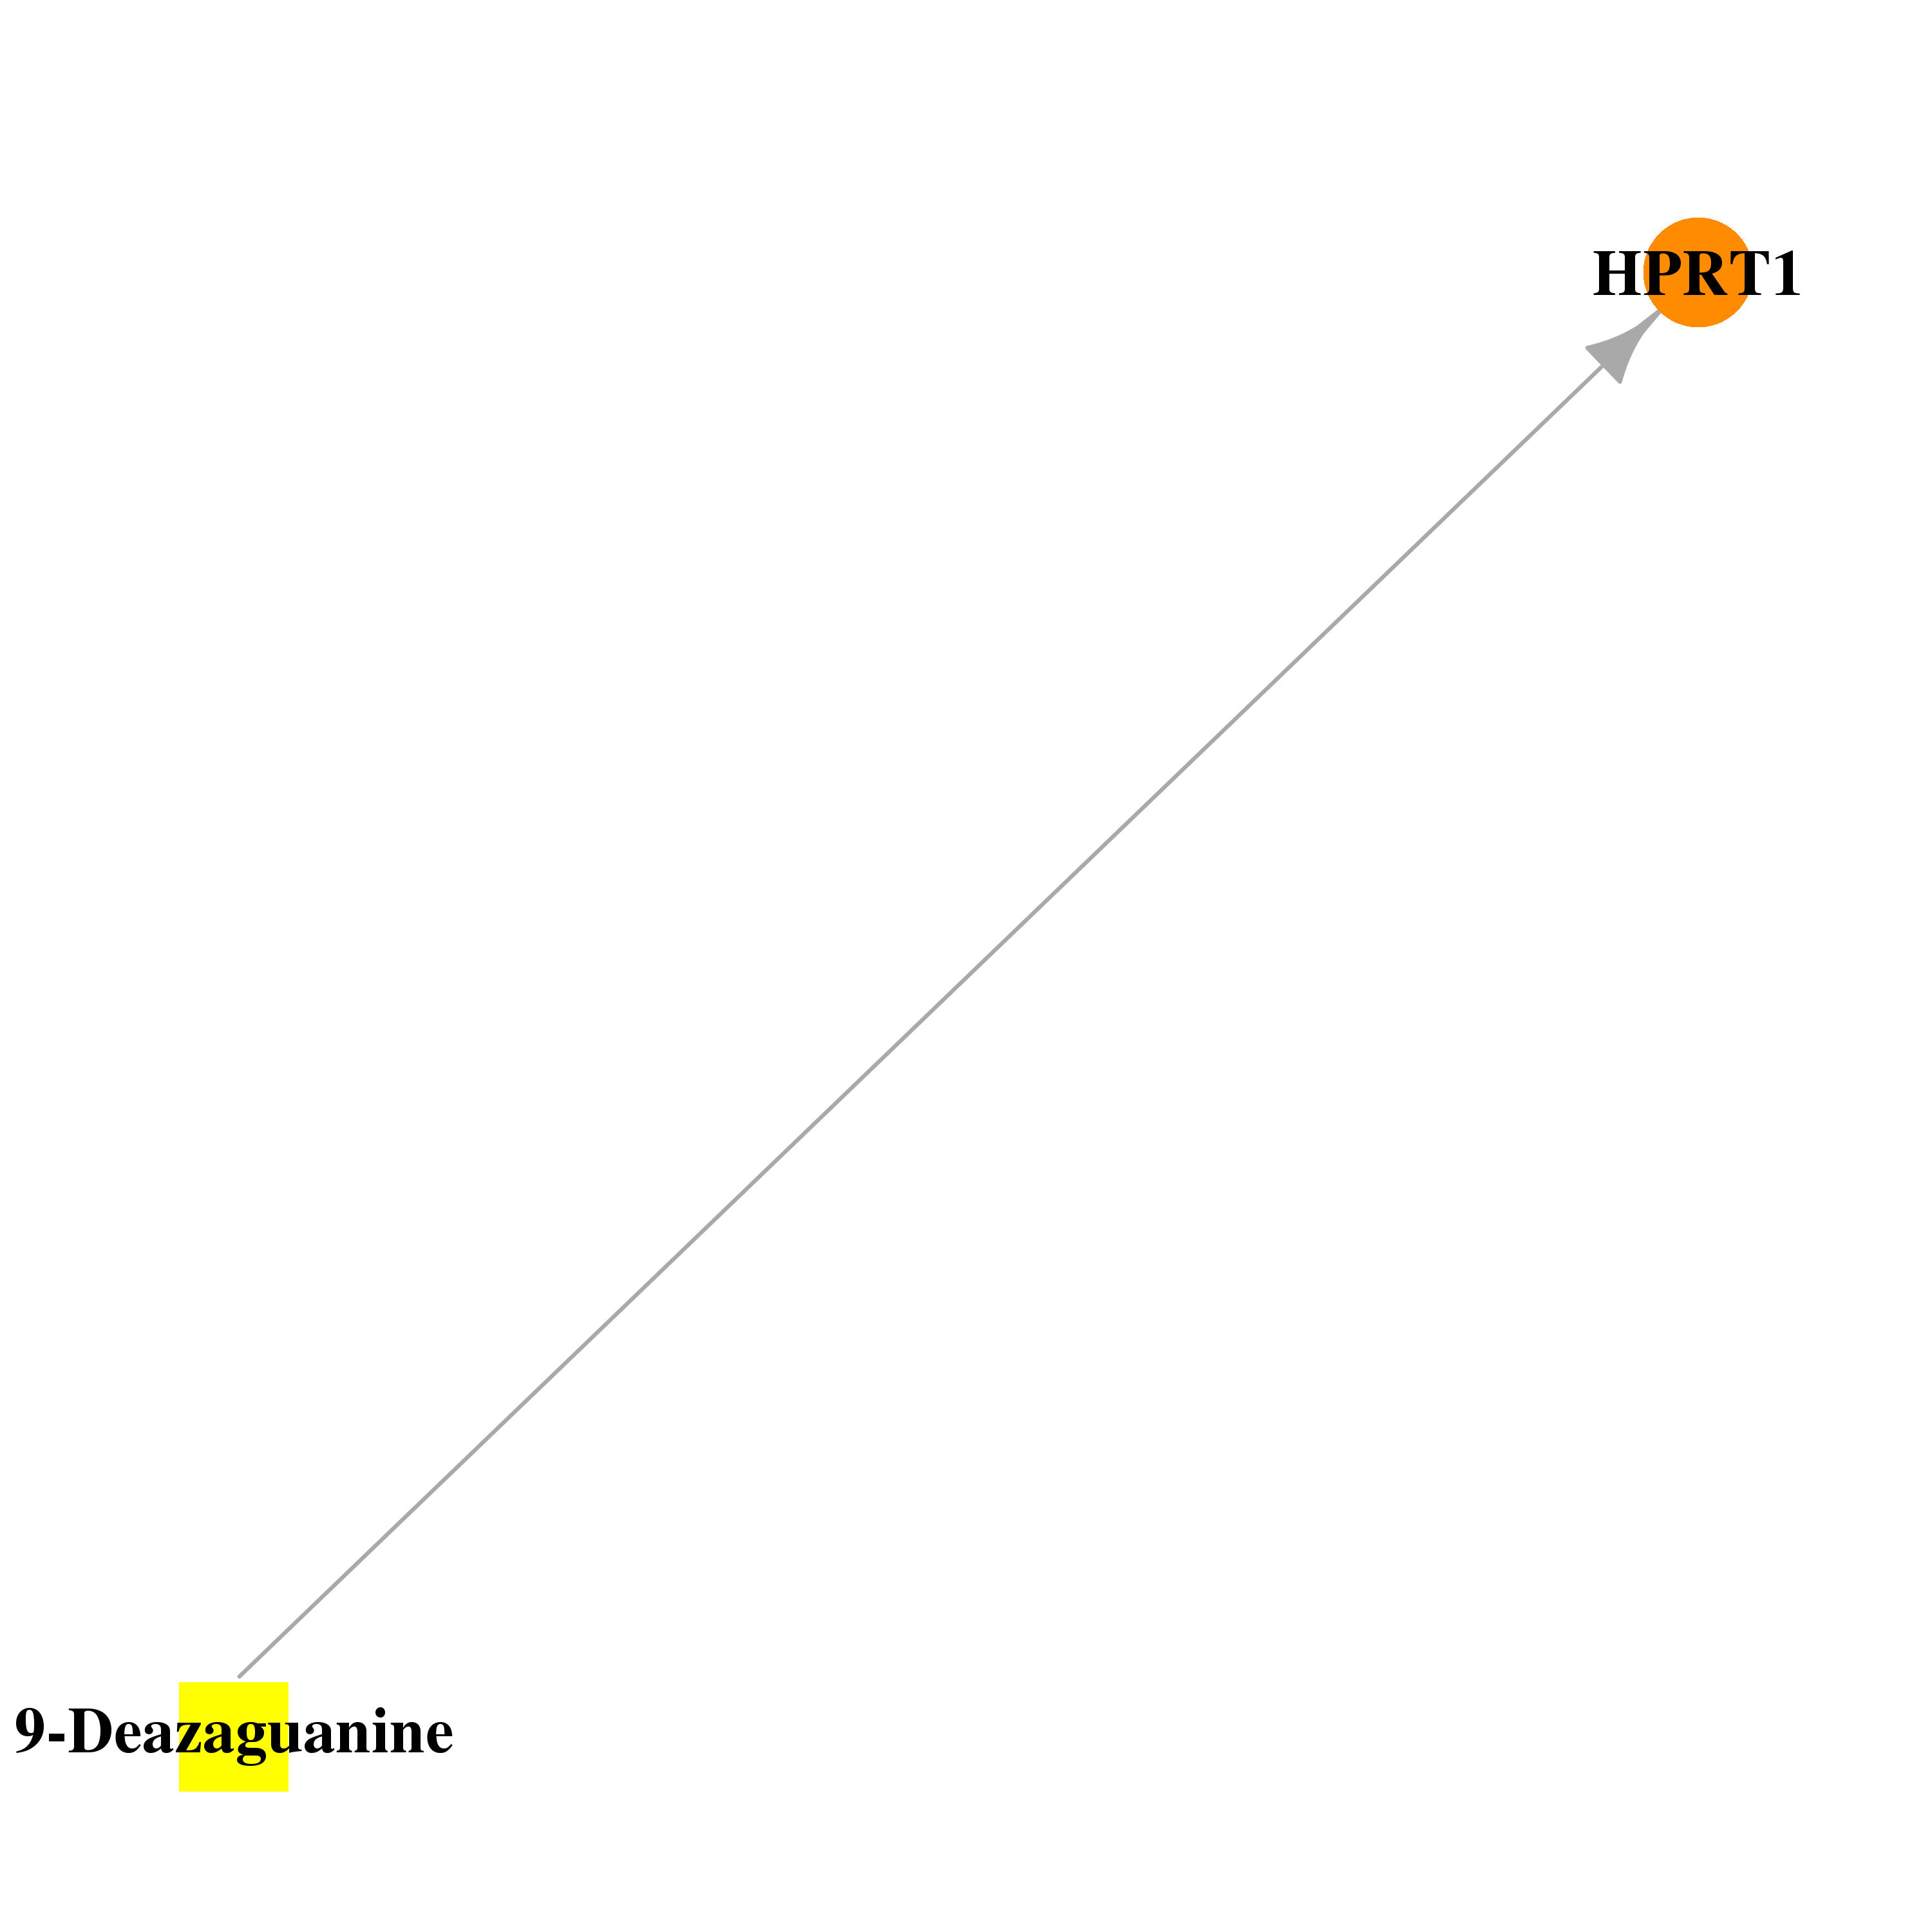 |  |
| DB00173 | hypoxanthine phosphoribosyltransferase 1 | approved; nutraceutical | Adenine | 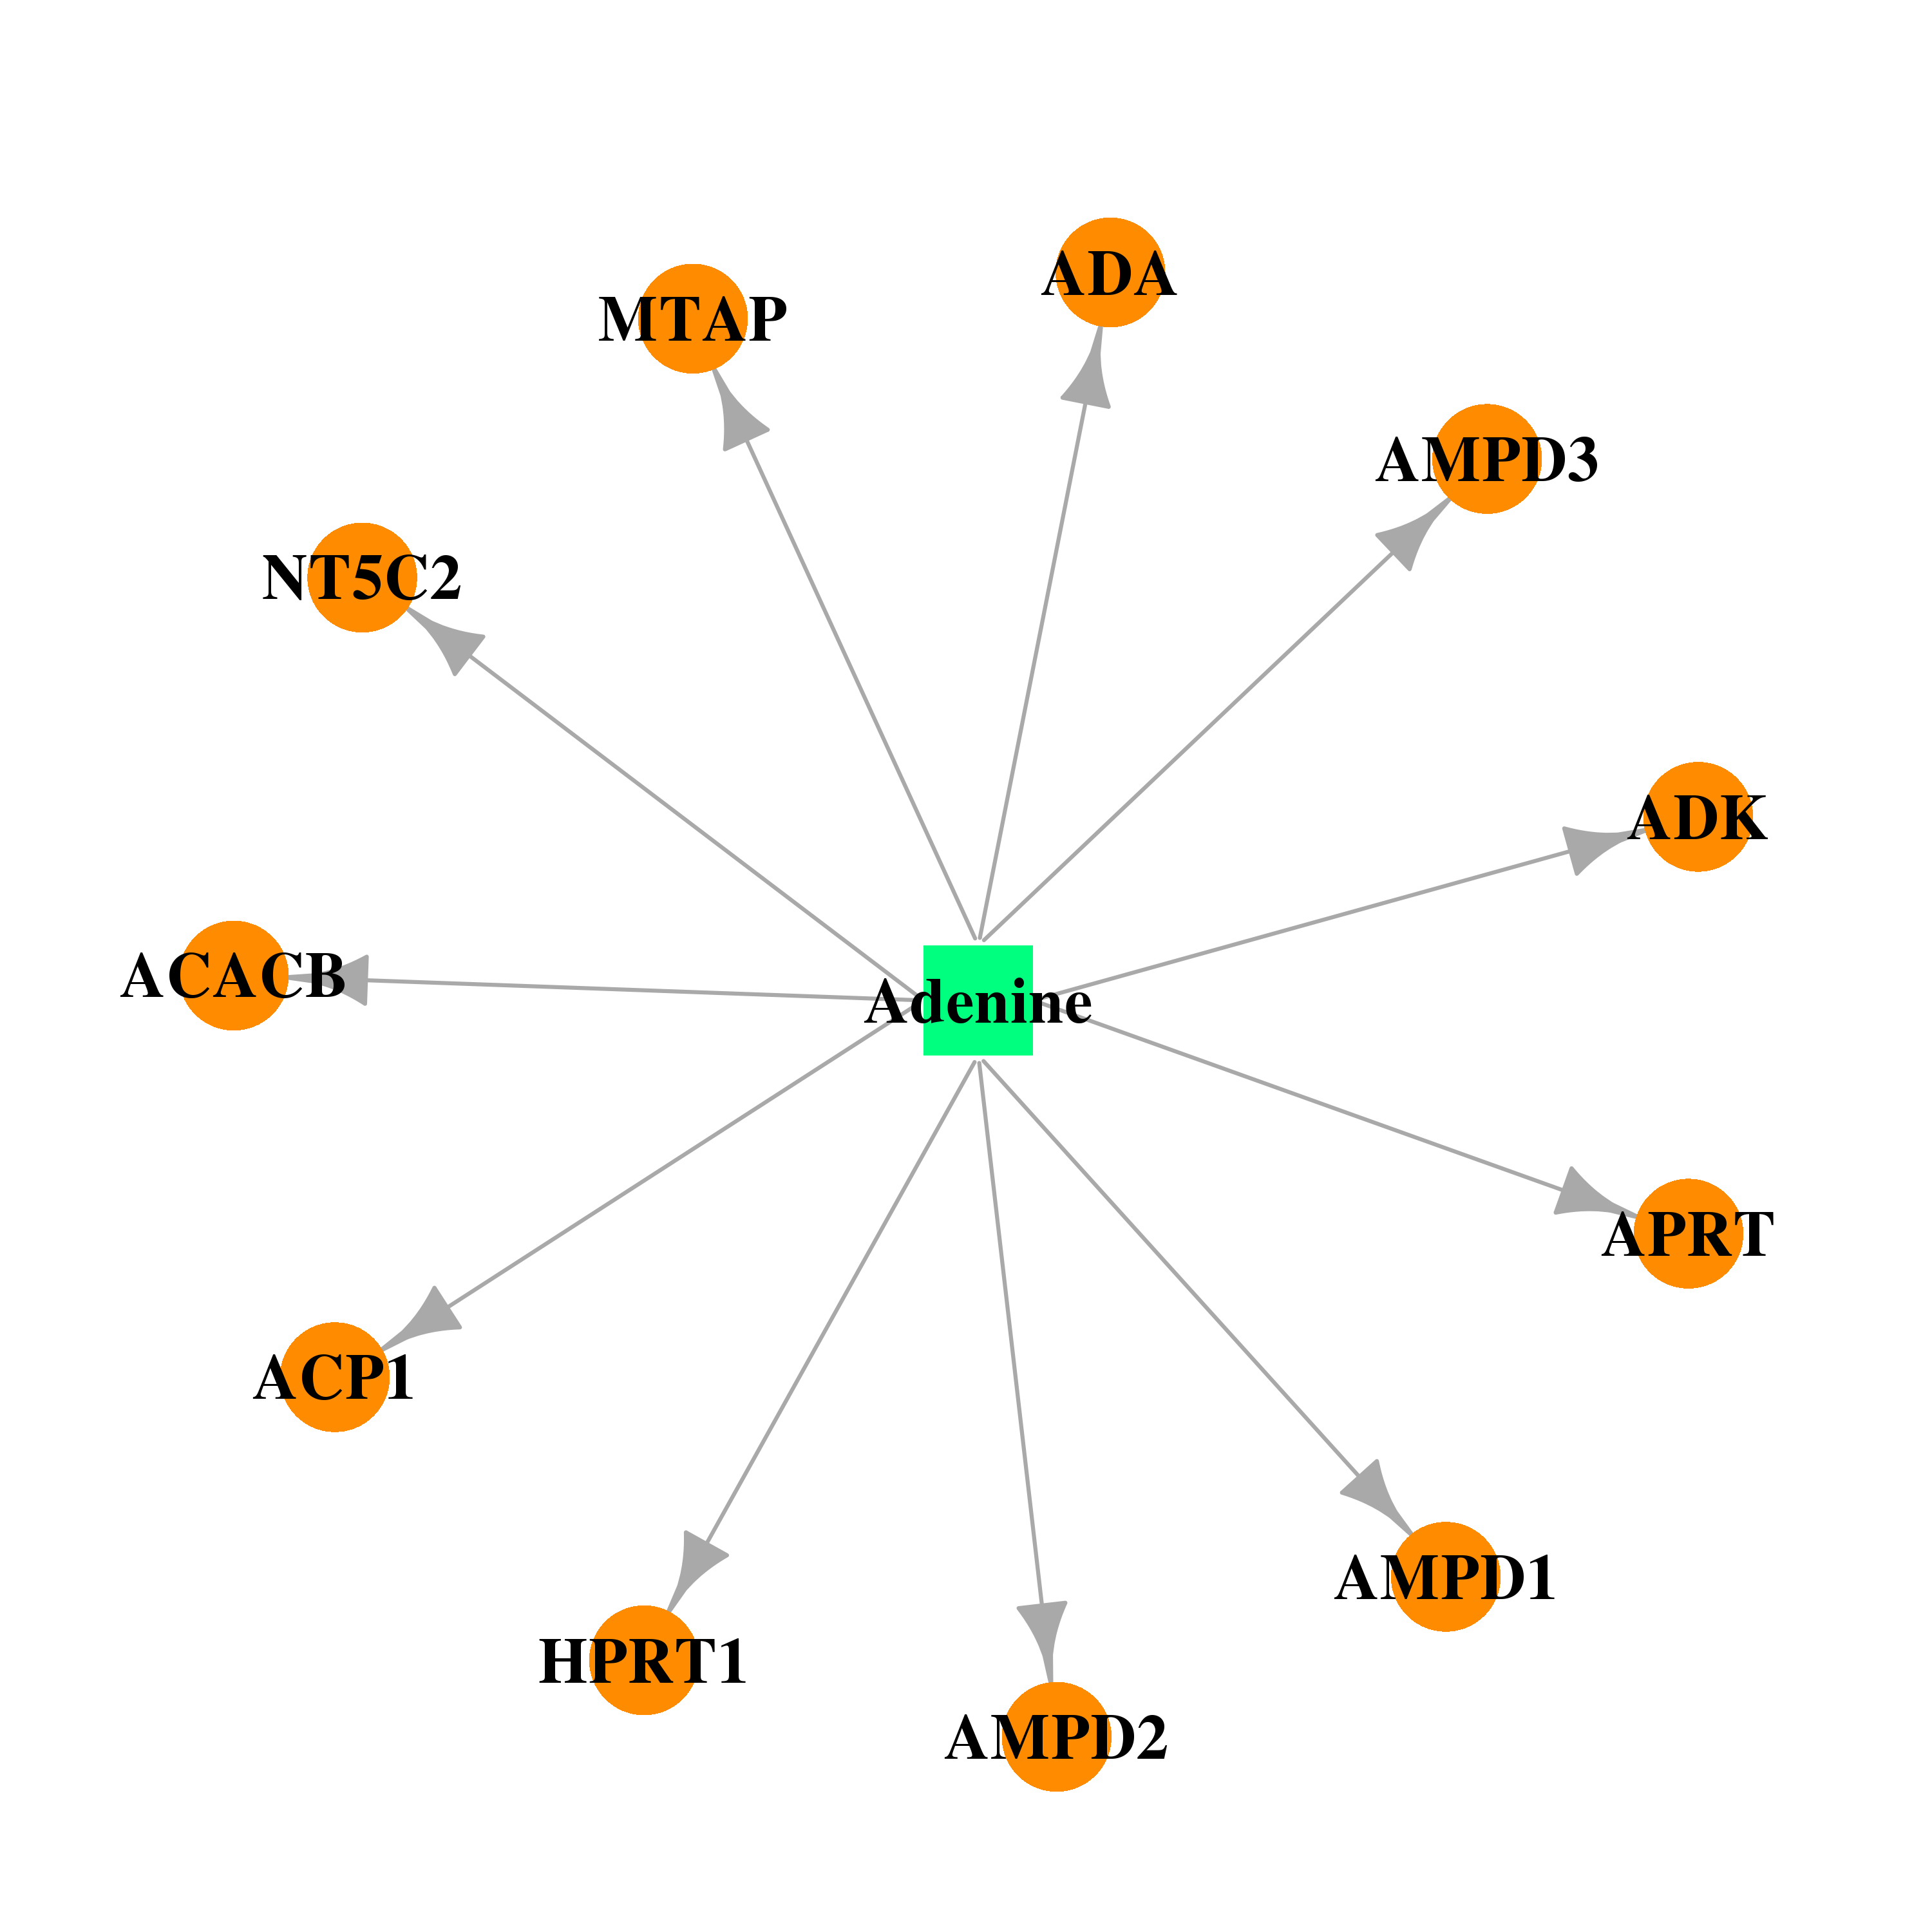 |  |
| DB00640 | hypoxanthine phosphoribosyltransferase 1 | approved; investigational | Adenosine | 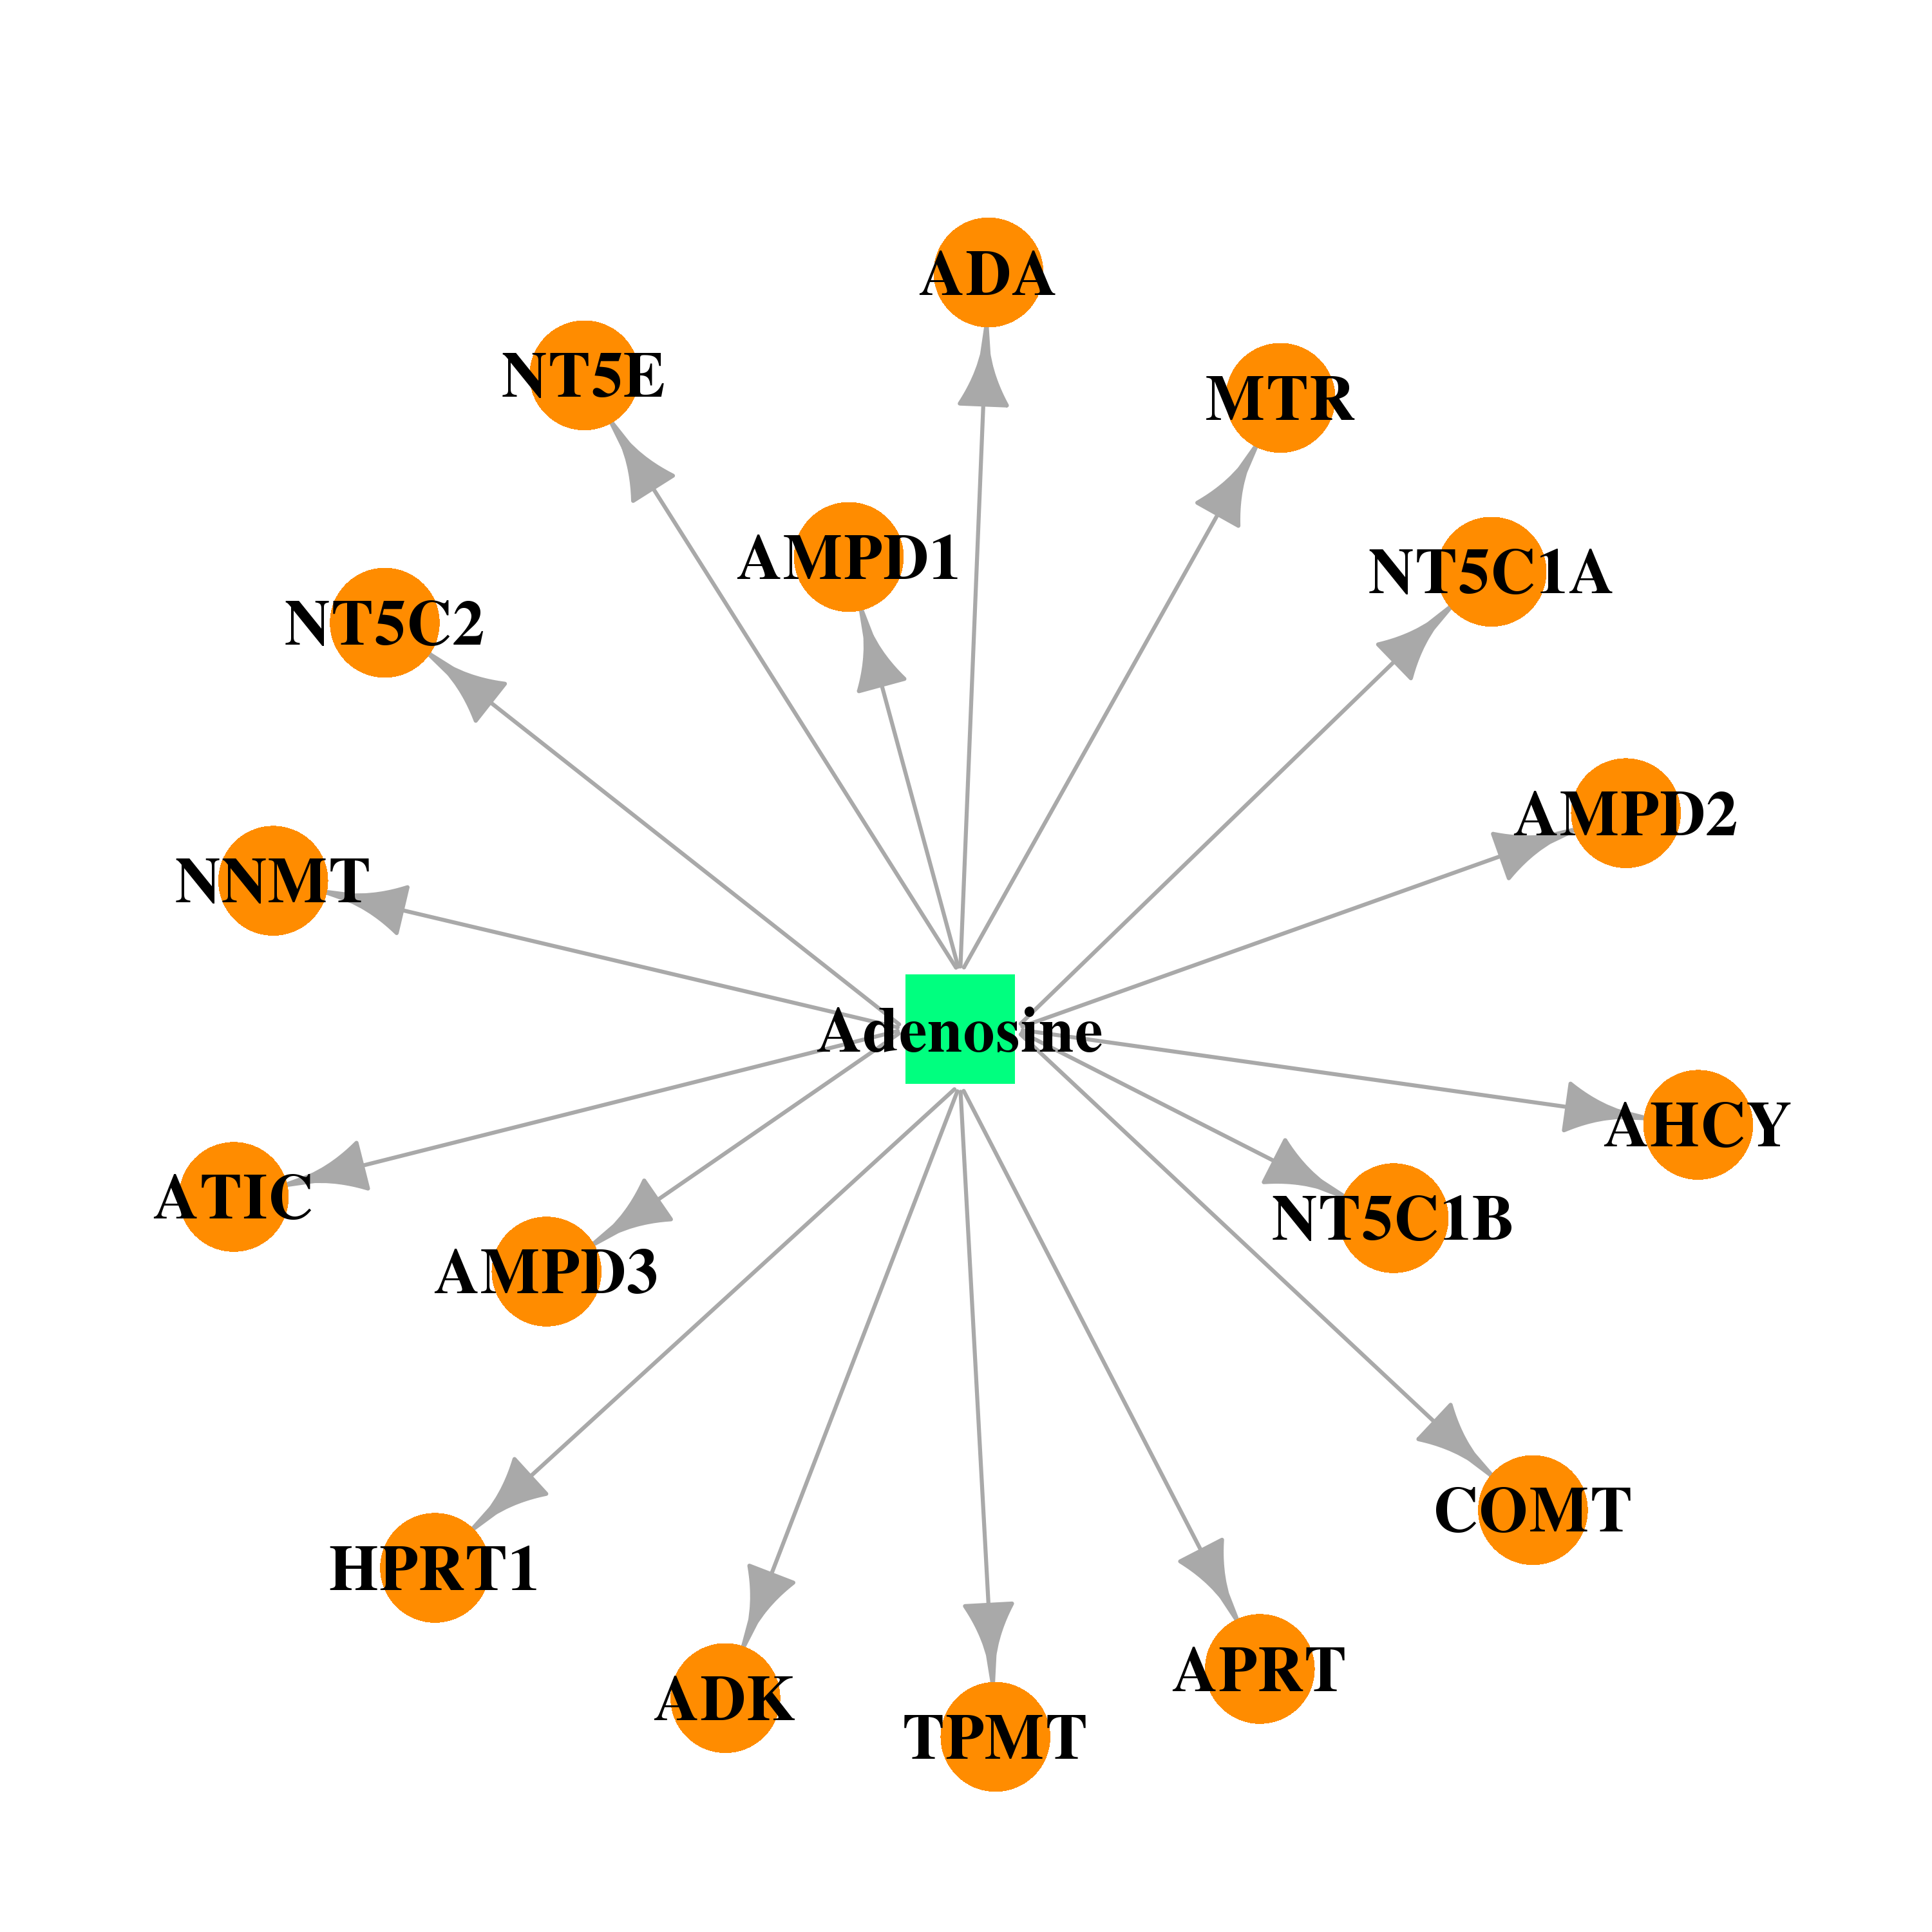 |  |
| DB00515 | hypoxanthine phosphoribosyltransferase 1 | approved | Cisplatin |  |  |
| DB00441 | hypoxanthine phosphoribosyltransferase 1 | approved | Gemcitabine | 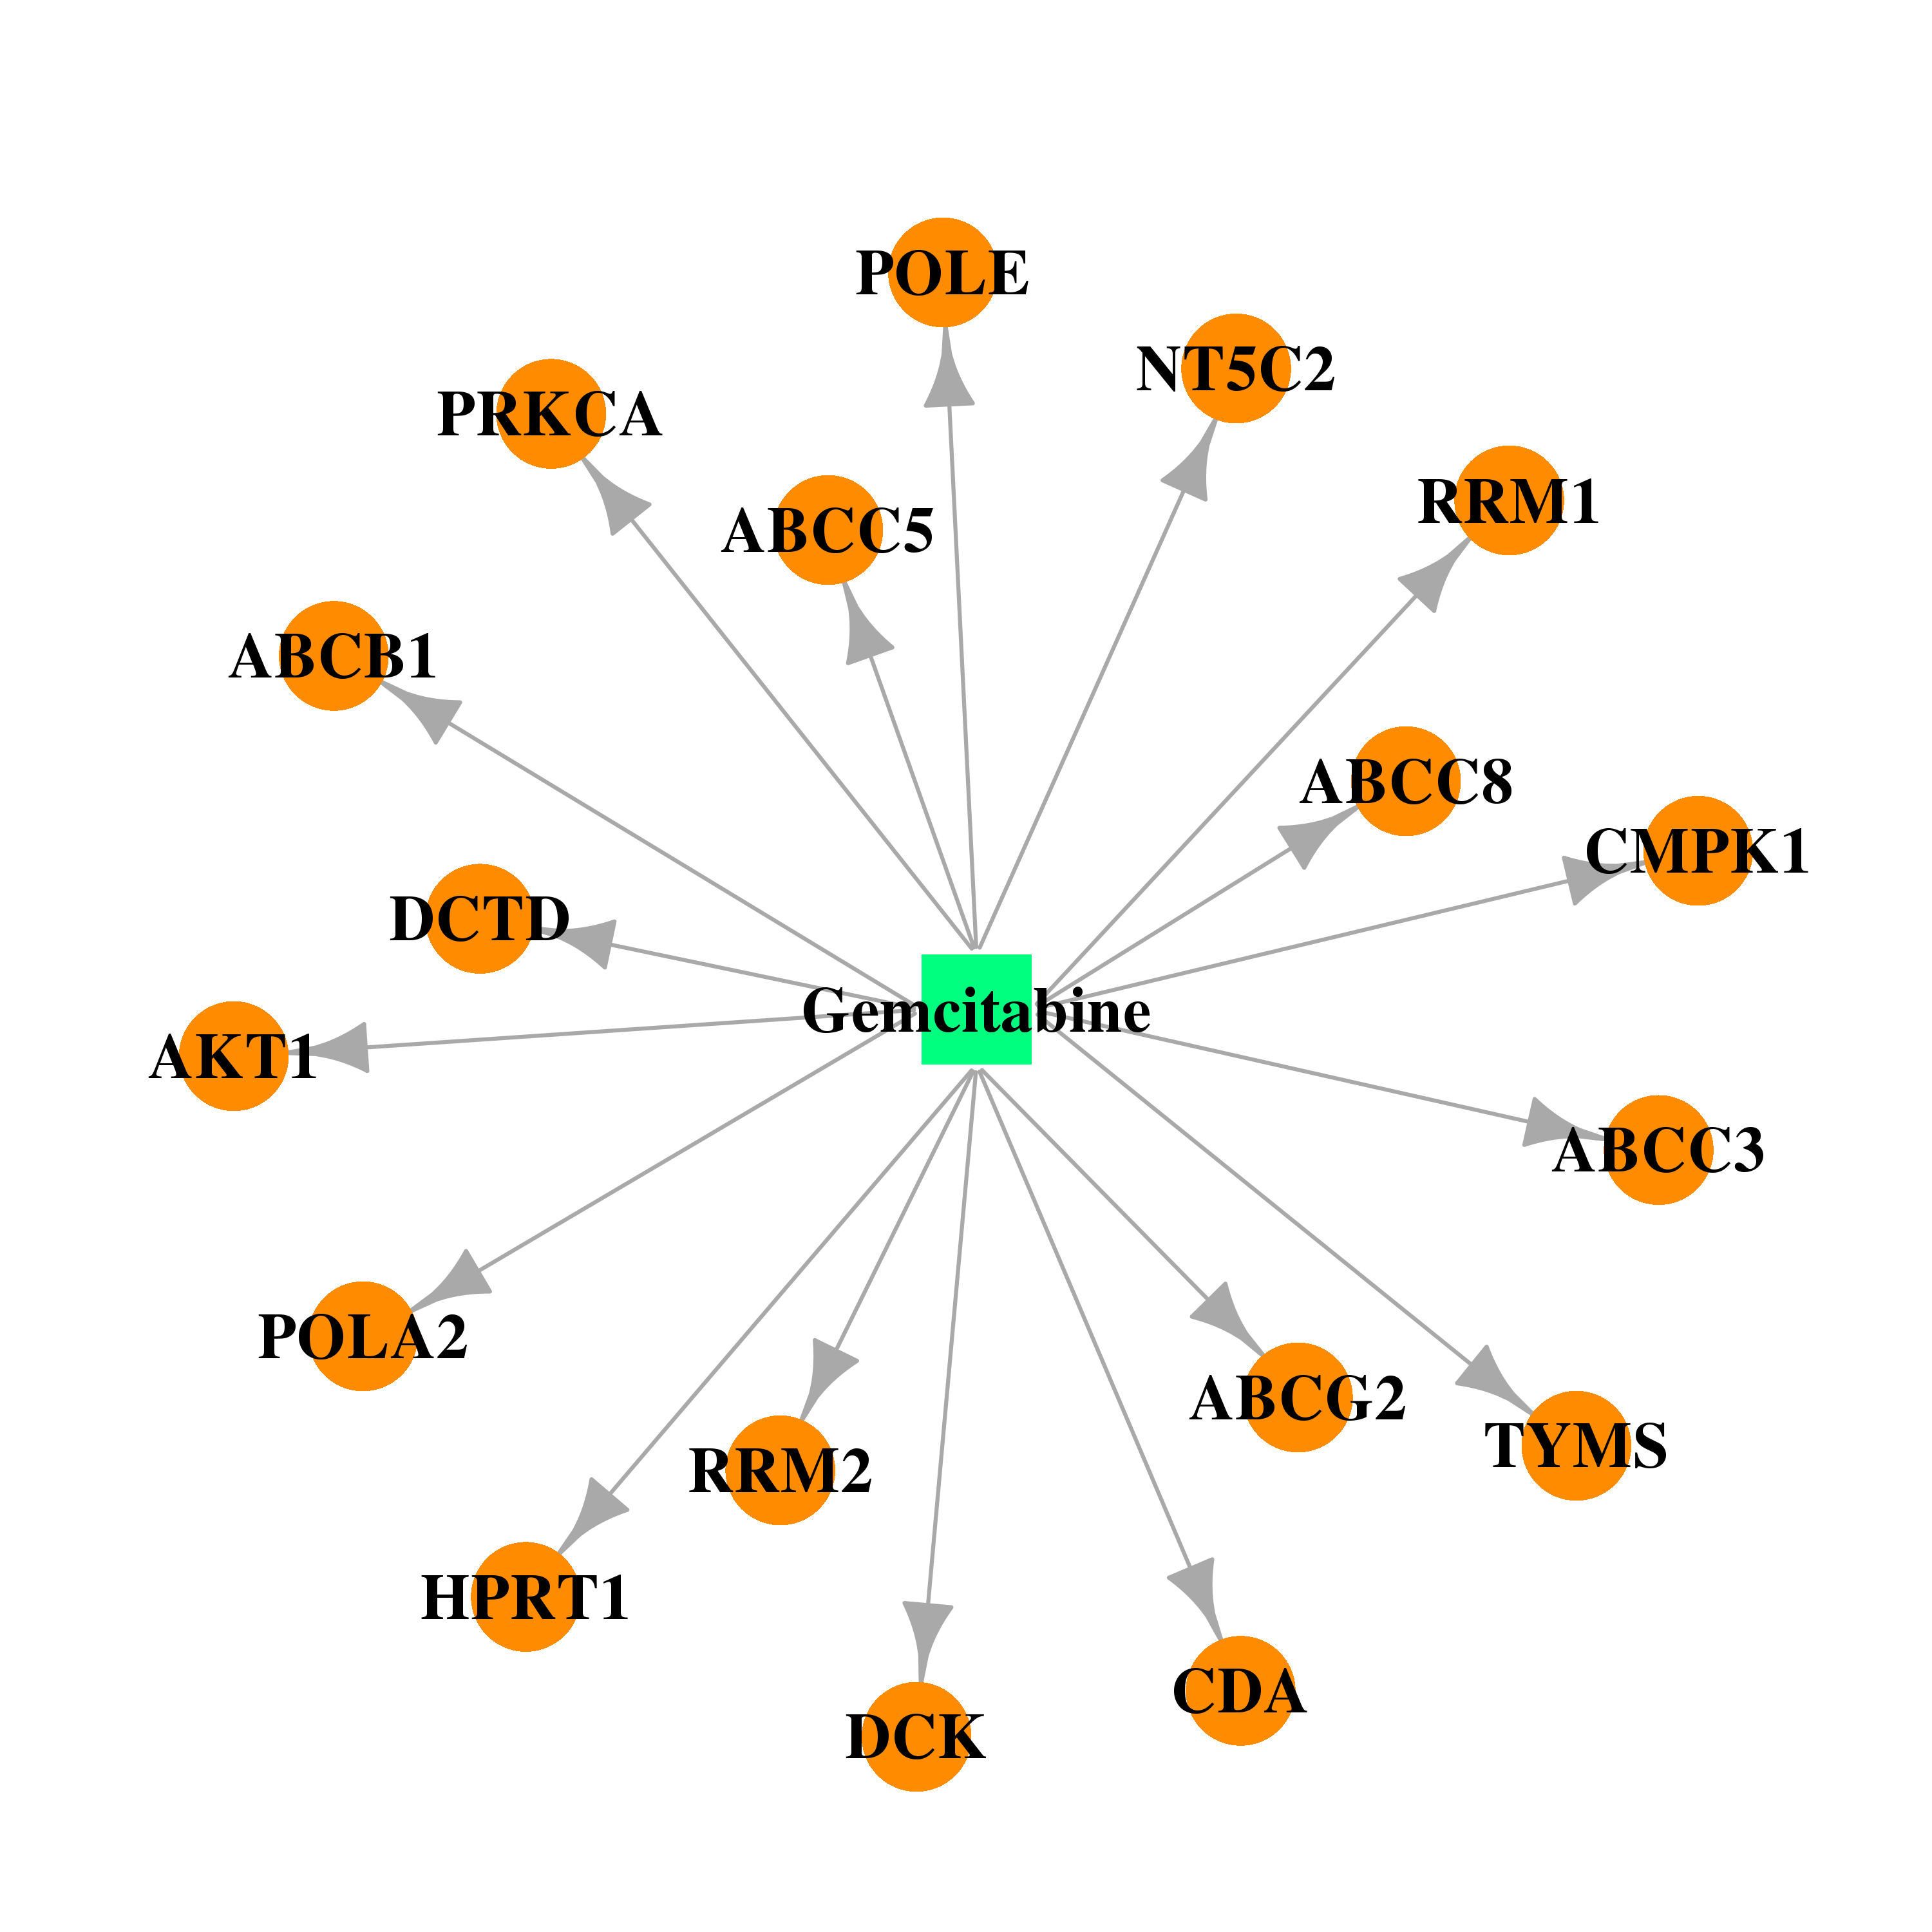 |  |
| DB00352 | hypoxanthine phosphoribosyltransferase 1 | approved | Thioguanine |  |  |
| DB00563 | hypoxanthine phosphoribosyltransferase 1 | approved | Methotrexate |  |  |
| Top |
| Cross referenced IDs for HPRT1 |
| * We obtained these cross-references from Uniprot database. It covers 150 different DBs, 18 categories. http://www.uniprot.org/help/cross_references_section |
: Open all cross reference information
|
Copyright © 2016-Present - The Univsersity of Texas Health Science Center at Houston @ |