|
|||||||||||||||||||||||||||||||||||||||||||||||||||||||||||||||||||||||||||||||||||||||||||||||||||||||||||||||||||||||||||||||||||||||||||||||||||||||||||||||||||||||||||||||||||||||||||||||||||||||||||||||||||||||||||||||||||||||||||||||||||||||||||||||||||||||||||||||||||||||||||||||||||||||||||||||||||||||||||||||||||||||||||||||||||||||||
| |
| Phenotypic Information (metabolism pathway, cancer, disease, phenome) |
| |
| |
| Gene-Gene Network Information: Co-Expression Network, Interacting Genes & KEGG |
| |
|


| Gene Summary for HSD3B1 |
| Basic gene info. | Gene symbol | HSD3B1 |
| Gene name | hydroxy-delta-5-steroid dehydrogenase, 3 beta- and steroid delta-isomerase 1 | |
| Synonyms | 3BETAHSD|HSD3B|HSDB3|HSDB3A|I|SDR11E1 | |
| Cytomap | UCSC genome browser: 1p13.1 | |
| Genomic location | chr1 :120049825-120057681 | |
| Type of gene | protein-coding | |
| RefGenes | NM_000862.2, | |
| Ensembl id | ENSG00000203857 | |
| Description | 3 beta-hydroxysteroid dehydrogenase/Delta 5-->4-isomerase type 13 beta-hydroxysteroid dehydrogenase/Delta 5-->4-isomerase type I3-beta-HSD I3-beta-hydroxy-5-ene steroid dehydrogenase3-beta-hydroxy-Delta(5)-steroid dehydrogenasedelta-5-3-ketosteroid i | |
| Modification date | 20141207 | |
| dbXrefs | MIM : 109715 | |
| HGNC : HGNC | ||
| Ensembl : ENSG00000203857 | ||
| HPRD : 04920 | ||
| Vega : OTTHUMG00000012525 | ||
| Protein | UniProt: go to UniProt's Cross Reference DB Table | |
| Expression | CleanEX: HS_HSD3B1 | |
| BioGPS: 3283 | ||
| Gene Expression Atlas: ENSG00000203857 | ||
| The Human Protein Atlas: ENSG00000203857 | ||
| Pathway | NCI Pathway Interaction Database: HSD3B1 | |
| KEGG: HSD3B1 | ||
| REACTOME: HSD3B1 | ||
| ConsensusPathDB | ||
| Pathway Commons: HSD3B1 | ||
| Metabolism | MetaCyc: HSD3B1 | |
| HUMANCyc: HSD3B1 | ||
| Regulation | Ensembl's Regulation: ENSG00000203857 | |
| miRBase: chr1 :120,049,825-120,057,681 | ||
| TargetScan: NM_000862 | ||
| cisRED: ENSG00000203857 | ||
| Context | iHOP: HSD3B1 | |
| cancer metabolism search in PubMed: HSD3B1 | ||
| UCL Cancer Institute: HSD3B1 | ||
| Assigned class in ccmGDB | C | |
| Top |
| Phenotypic Information for HSD3B1(metabolism pathway, cancer, disease, phenome) |
| Cancer | CGAP: HSD3B1 |
| Familial Cancer Database: HSD3B1 | |
| * This gene is included in those cancer gene databases. |
|
|
|
|
|
|
| |||||||||||||||||||||||||||||||||||||||||||||||||||||||||||||||||||||||||||||||||||||||||||||||||||||||||||||||||||||||||||||||||||||||||||||||||||||||||||||||||||||||||||||||||||||||||||||||||||||||||||||||||||||||||||||||||||||||||||||||||||||||||||||||||||||||||||||||||||||||||||||||||||||||||||||||||||||||||||||||||||||||||||||||||||
Oncogene 1 | Significant driver gene in | ||||||||||||||||||||||||||||||||||||||||||||||||||||||||||||||||||||||||||||||||||||||||||||||||||||||||||||||||||||||||||||||||||||||||||||||||||||||||||||||||||||||||||||||||||||||||||||||||||||||||||||||||||||||||||||||||||||||||||||||||||||||||||||||||||||||||||||||||||||||||||||||||||||||||||||||||||||||||||||||||||||||||||||||||||||||||
| cf) number; DB name 1 Oncogene; http://nar.oxfordjournals.org/content/35/suppl_1/D721.long, 2 Tumor Suppressor gene; https://bioinfo.uth.edu/TSGene/, 3 Cancer Gene Census; http://www.nature.com/nrc/journal/v4/n3/abs/nrc1299.html, 4 CancerGenes; http://nar.oxfordjournals.org/content/35/suppl_1/D721.long, 5 Network of Cancer Gene; http://ncg.kcl.ac.uk/index.php, 1Therapeutic Vulnerabilities in Cancer; http://cbio.mskcc.org/cancergenomics/statius/ |
| REACTOME_METABOLISM_OF_STEROID_HORMONES_AND_VITAMINS_A_AND_D REACTOME_METABOLISM_OF_LIPIDS_AND_LIPOPROTEINS | |
| OMIM | |
| Orphanet | |
| Disease | KEGG Disease: HSD3B1 |
| MedGen: HSD3B1 (Human Medical Genetics with Condition) | |
| ClinVar: HSD3B1 | |
| Phenotype | MGI: HSD3B1 (International Mouse Phenotyping Consortium) |
| PhenomicDB: HSD3B1 | |
| Mutations for HSD3B1 |
| * Under tables are showing count per each tissue to give us broad intuition about tissue specific mutation patterns.You can go to the detailed page for each mutation database's web site. |
| - Statistics for Tissue and Mutation type | Top |
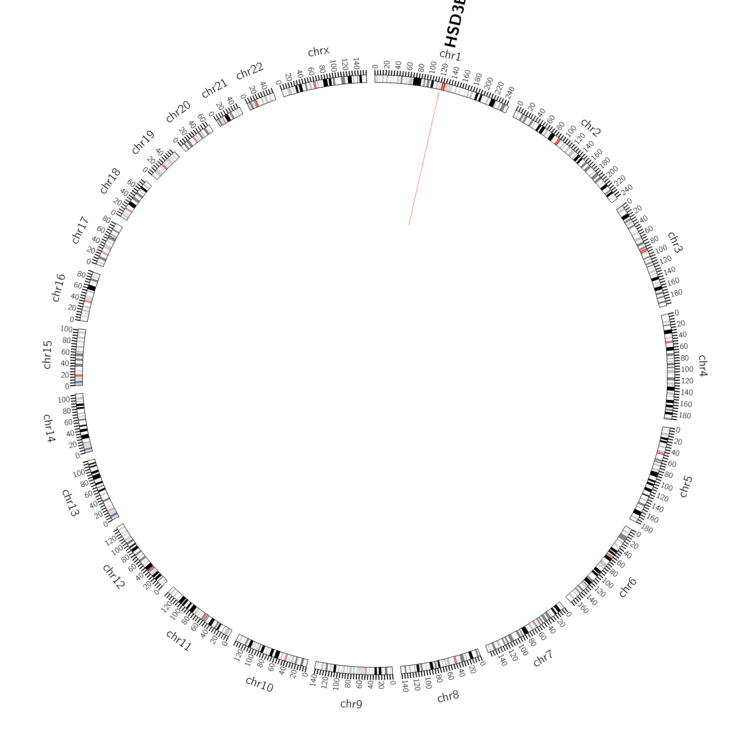 |
| - For Inter-chromosomal Variations |
| There's no inter-chromosomal structural variation. |
| - For Intra-chromosomal Variations |
| * Intra-chromosomal variantions includes 'intrachromosomal amplicon to amplicon', 'intrachromosomal amplicon to non-amplified dna', 'intrachromosomal deletion', 'intrachromosomal fold-back inversion', 'intrachromosomal inversion', 'intrachromosomal tandem duplication', 'Intrachromosomal unknown type', 'intrachromosomal with inverted orientation', 'intrachromosomal with non-inverted orientation'. |
 |
| Sample | Symbol_a | Chr_a | Start_a | End_a | Symbol_b | Chr_b | Start_b | End_b |
| skin | HSD3B1 | chr1 | 120050068 | 120050068 | chr1 | 120077813 | 120077813 |
| cf) Tissue number; Tissue name (1;Breast, 2;Central_nervous_system, 3;Haematopoietic_and_lymphoid_tissue, 4;Large_intestine, 5;Liver, 6;Lung, 7;Ovary, 8;Pancreas, 9;Prostate, 10;Skin, 11;Soft_tissue, 12;Upper_aerodigestive_tract) |
| * From mRNA Sanger sequences, Chitars2.0 arranged chimeric transcripts. This table shows HSD3B1 related fusion information. |
| ID | Head Gene | Tail Gene | Accession | Gene_a | qStart_a | qEnd_a | Chromosome_a | tStart_a | tEnd_a | Gene_a | qStart_a | qEnd_a | Chromosome_a | tStart_a | tEnd_a |
| Top |
| Mutation type/ Tissue ID | brca | cns | cerv | endome | haematopo | kidn | Lintest | liver | lung | ns | ovary | pancre | prost | skin | stoma | thyro | urina | |||
| Total # sample | 1 | |||||||||||||||||||
| GAIN (# sample) | 1 | |||||||||||||||||||
| LOSS (# sample) |
| cf) Tissue ID; Tissue type (1; Breast, 2; Central_nervous_system, 3; Cervix, 4; Endometrium, 5; Haematopoietic_and_lymphoid_tissue, 6; Kidney, 7; Large_intestine, 8; Liver, 9; Lung, 10; NS, 11; Ovary, 12; Pancreas, 13; Prostate, 14; Skin, 15; Stomach, 16; Thyroid, 17; Urinary_tract) |
| Top |
|
 |
| Top |
| Stat. for Non-Synonymous SNVs (# total SNVs=37) | (# total SNVs=23) |
 | 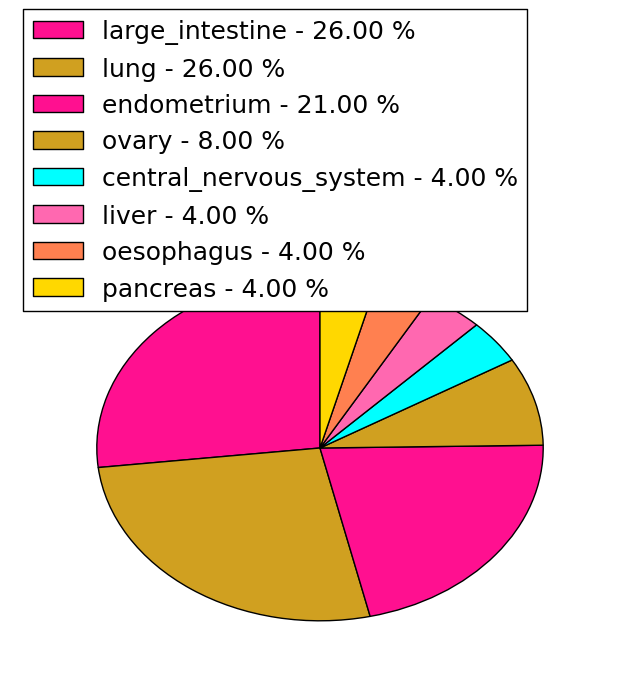 |
(# total SNVs=0) | (# total SNVs=0) |
| Top |
| * When you move the cursor on each content, you can see more deailed mutation information on the Tooltip. Those are primary_site,primary_histology,mutation(aa),pubmedID. |
| GRCh37 position | Mutation(aa) | Unique sampleID count |
| chr1:120057158-120057158 | p.L338L | 3 |
| chr1:120050152-120050152 | p.R18K | 2 |
| chr1:120057246-120057246 | p.T367N | 2 |
| chr1:120056674-120056674 | p.N176N | 2 |
| chr1:120057081-120057081 | p.R312Q | 2 |
| chr1:120050105-120050105 | p.T2T | 2 |
| chr1:120054198-120054198 | p.C73F | 1 |
| chr1:120056873-120056873 | p.P243T | 1 |
| chr1:120050126-120050126 | p.T9T | 1 |
| chr1:120056607-120056607 | p.P154L | 1 |
| Top |
|
 |
| Point Mutation/ Tissue ID | 1 | 2 | 3 | 4 | 5 | 6 | 7 | 8 | 9 | 10 | 11 | 12 | 13 | 14 | 15 | 16 | 17 | 18 | 19 | 20 |
| # sample | 1 | 1 | 10 | 1 | 1 | 1 | 1 | 8 | 5 | 3 | 12 | 3 | 7 | |||||||
| # mutation | 1 | 1 | 9 | 1 | 1 | 1 | 1 | 12 | 6 | 3 | 13 | 3 | 8 | |||||||
| nonsynonymous SNV | 1 | 1 | 5 | 1 | 1 | 1 | 8 | 5 | 2 | 8 | 1 | 3 | ||||||||
| synonymous SNV | 4 | 1 | 4 | 1 | 1 | 5 | 2 | 5 |
| cf) Tissue ID; Tissue type (1; BLCA[Bladder Urothelial Carcinoma], 2; BRCA[Breast invasive carcinoma], 3; CESC[Cervical squamous cell carcinoma and endocervical adenocarcinoma], 4; COAD[Colon adenocarcinoma], 5; GBM[Glioblastoma multiforme], 6; Glioma Low Grade, 7; HNSC[Head and Neck squamous cell carcinoma], 8; KICH[Kidney Chromophobe], 9; KIRC[Kidney renal clear cell carcinoma], 10; KIRP[Kidney renal papillary cell carcinoma], 11; LAML[Acute Myeloid Leukemia], 12; LUAD[Lung adenocarcinoma], 13; LUSC[Lung squamous cell carcinoma], 14; OV[Ovarian serous cystadenocarcinoma ], 15; PAAD[Pancreatic adenocarcinoma], 16; PRAD[Prostate adenocarcinoma], 17; SKCM[Skin Cutaneous Melanoma], 18:STAD[Stomach adenocarcinoma], 19:THCA[Thyroid carcinoma], 20:UCEC[Uterine Corpus Endometrial Carcinoma]) |
| Top |
| * We represented just top 10 SNVs. When you move the cursor on each content, you can see more deailed mutation information on the Tooltip. Those are primary_site, primary_histology, mutation(aa), pubmedID. |
| Genomic Position | Mutation(aa) | Unique sampleID count |
| chr1:120056981 | p.N176N | 2 |
| chr1:120056793 | p.A339V | 2 |
| chr1:120056657 | p.G216E | 2 |
| chr1:120057162 | p.G40R | 2 |
| chr1:120050217 | p.R279C | 2 |
| chr1:120056674 | p.G171W | 2 |
| chr1:120054211 | p.W284L | 1 |
| chr1:120057204 | p.T2M | 1 |
| chr1:120050152 | p.E46K | 1 |
| chr1:120056716 | p.L174L | 1 |
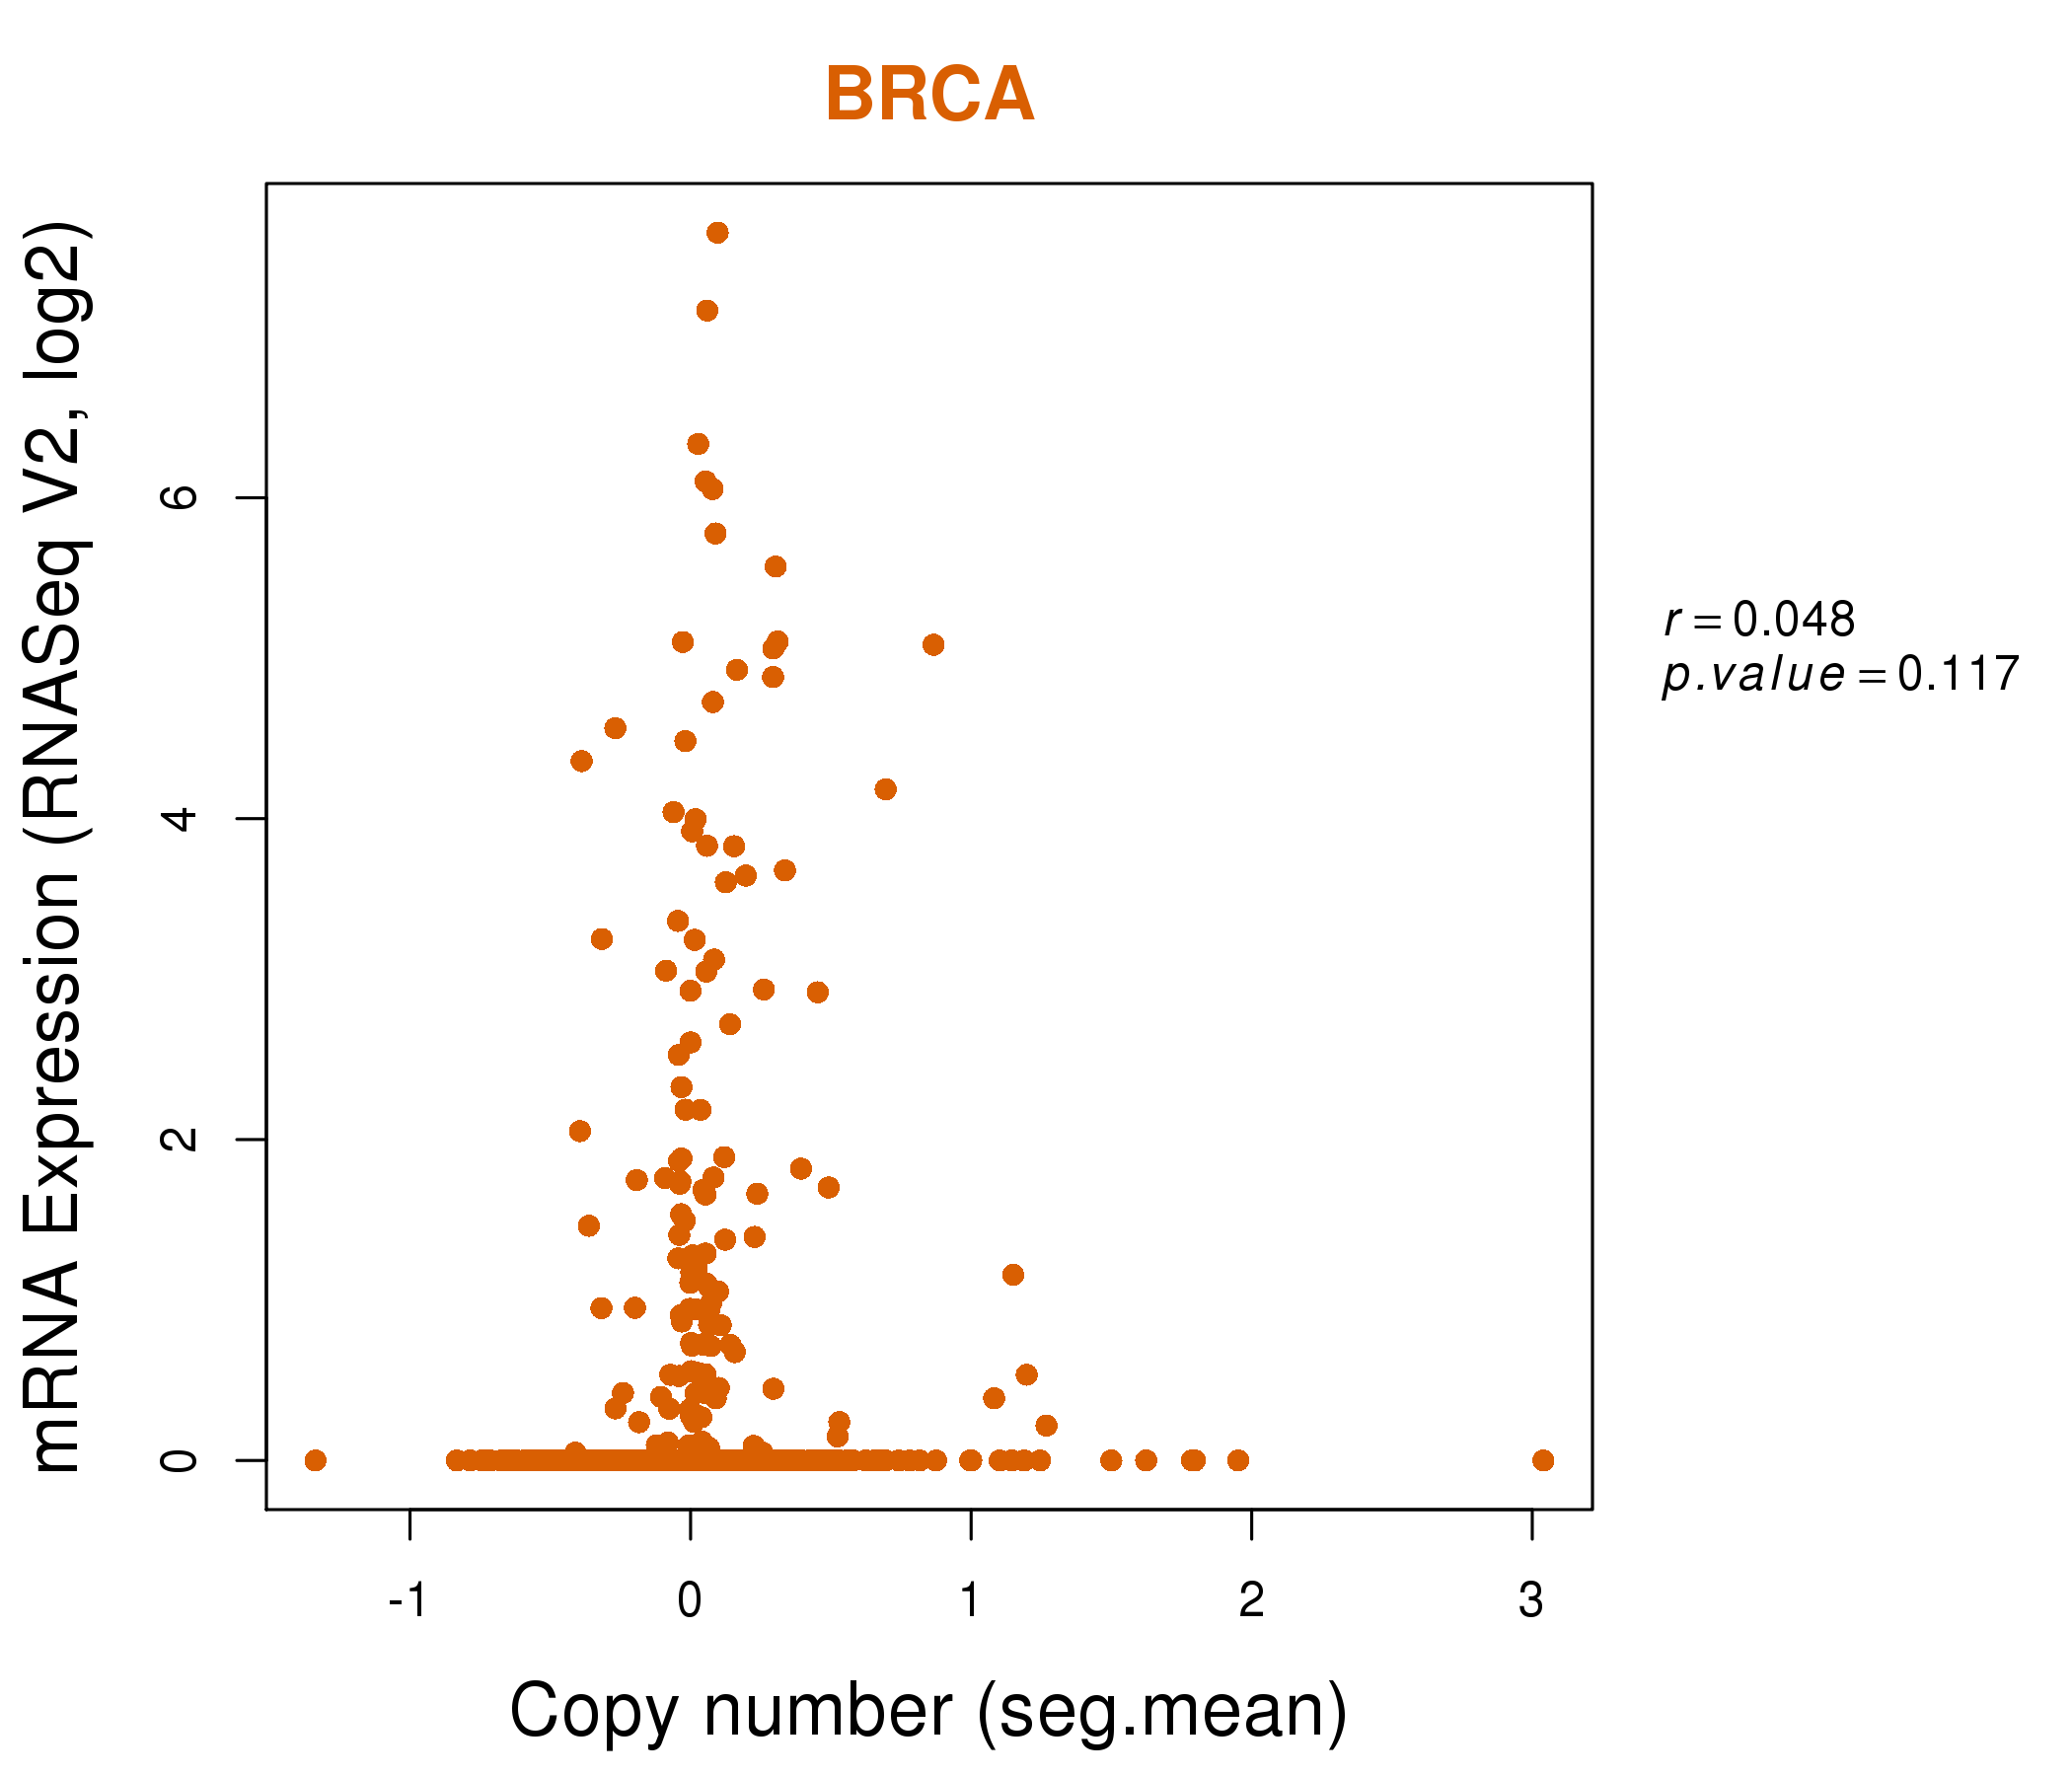
| * Copy number data were extracted from TCGA using R package TCGA-Assembler. The URLs of all public data files on TCGA DCC data server were gathered on Jan-05-2015. Function ProcessCNAData in TCGA-Assembler package was used to obtain gene-level copy number value which is calculated as the average copy number of the genomic region of a gene. |
 |
| cf) Tissue ID[Tissue type]: BLCA[Bladder Urothelial Carcinoma], BRCA[Breast invasive carcinoma], CESC[Cervical squamous cell carcinoma and endocervical adenocarcinoma], COAD[Colon adenocarcinoma], GBM[Glioblastoma multiforme], Glioma Low Grade, HNSC[Head and Neck squamous cell carcinoma], KICH[Kidney Chromophobe], KIRC[Kidney renal clear cell carcinoma], KIRP[Kidney renal papillary cell carcinoma], LAML[Acute Myeloid Leukemia], LUAD[Lung adenocarcinoma], LUSC[Lung squamous cell carcinoma], OV[Ovarian serous cystadenocarcinoma ], PAAD[Pancreatic adenocarcinoma], PRAD[Prostate adenocarcinoma], SKCM[Skin Cutaneous Melanoma], STAD[Stomach adenocarcinoma], THCA[Thyroid carcinoma], UCEC[Uterine Corpus Endometrial Carcinoma] |
| Top |
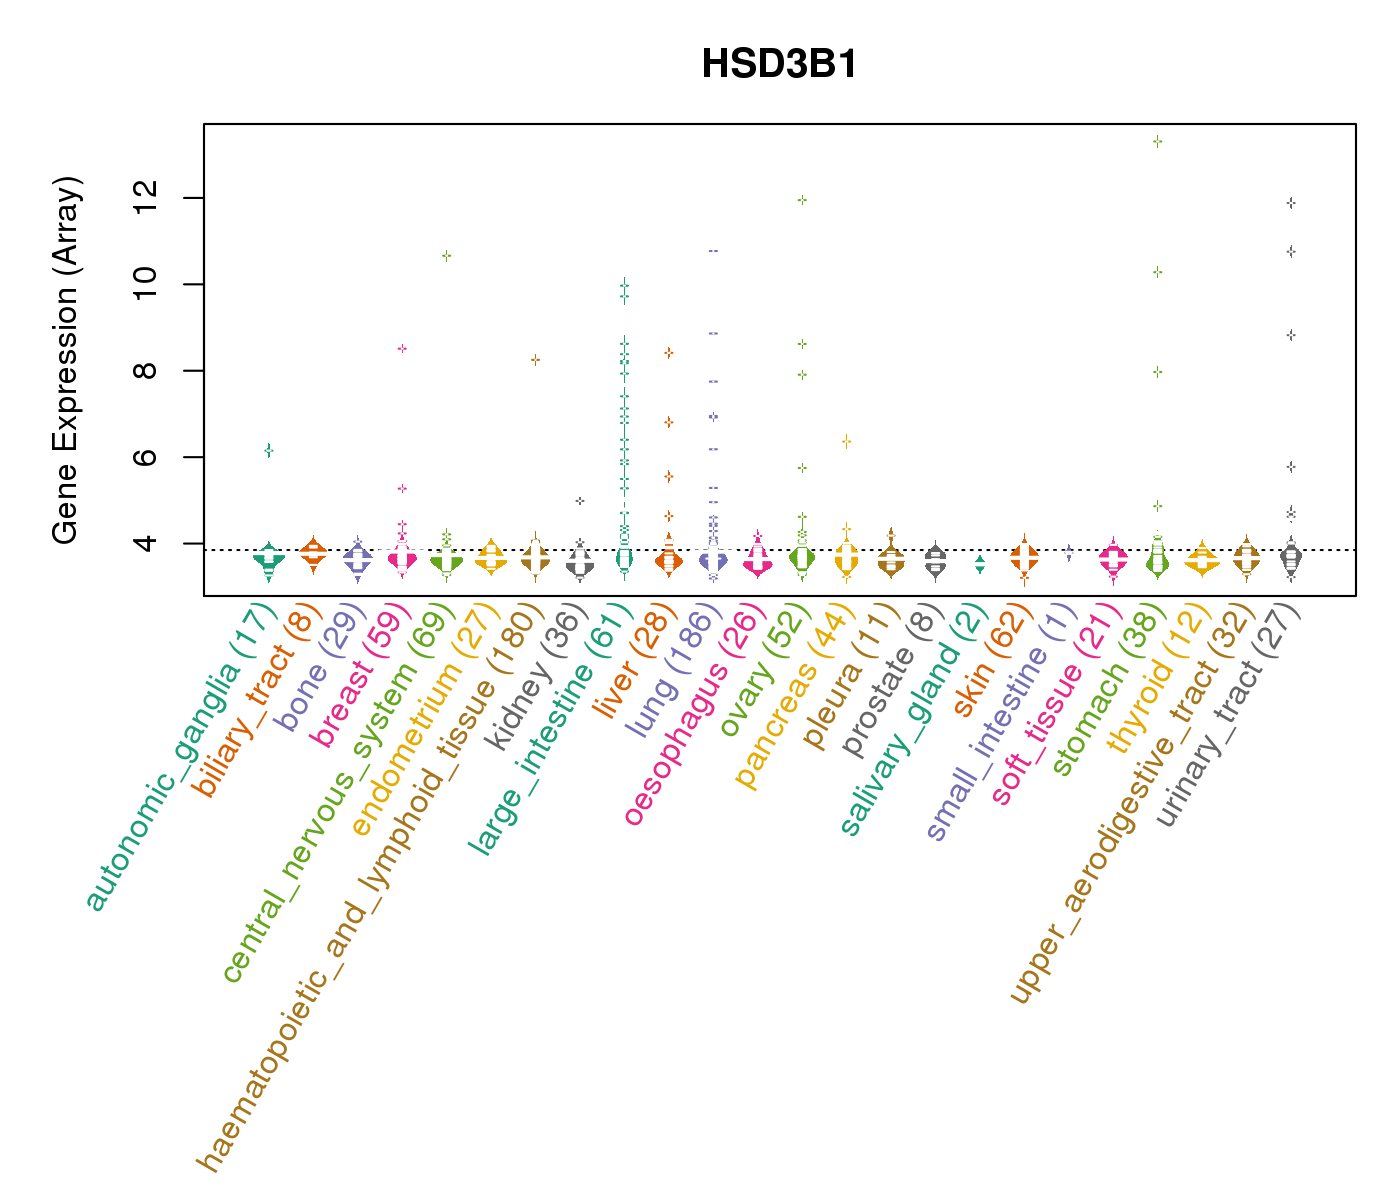
| Gene Expression for HSD3B1 |
| * CCLE gene expression data were extracted from CCLE_Expression_Entrez_2012-10-18.res: Gene-centric RMA-normalized mRNA expression data. |
 |
| * Normalized gene expression data of RNASeqV2 was extracted from TCGA using R package TCGA-Assembler. The URLs of all public data files on TCGA DCC data server were gathered at Jan-05-2015. Only eight cancer types have enough normal control samples for differential expression analysis. (t test, adjusted p<0.05 (using Benjamini-Hochberg FDR)) |
 |
| Top |
| * This plots show the correlation between CNV and gene expression. |
: Open all plots for all cancer types
 |
|
 |
|

| Top |
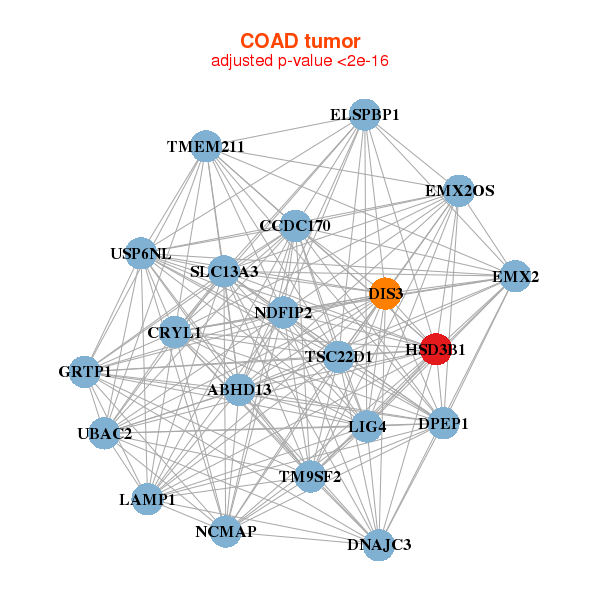
| Gene-Gene Network Information |
| * Co-Expression network figures were drawn using R package igraph. Only the top 20 genes with the highest correlations were shown. Red circle: input gene, orange circle: cell metabolism gene, sky circle: other gene |
: Open all plots for all cancer types
 |
| ||||
| AADAC,C1orf141,FOXL2NB,MGARP,CELA2A,CYP11A1,CYP17A1, CYP19A1,FSHR,HSD11B1,HSD3B1,INHA,INSL3,KLHL4, LHCGR,MBOAT4,MRO,REG3G,STAR,TCF21,TREML5P | ADAM2,AFMID,ALOX15B,AWAT2,B3GAT1,C6orf223,DHRS2, HIST1H4H,HPGD,HSD3B1,HSD3B2,MPV17L,PNLIPRP3,PPEF1, MSMO1,SERHL2,SLC5A11,SRD5A1,TARP,UGT2B10,UGT2B28 | ||||
 |
| ||||
| ABHD13,NCMAP,CCDC170,CRYL1,DIS3,DNAJC3,DPEP1, ELSPBP1,EMX2,EMX2OS,GRTP1,HSD3B1,LAMP1,LIG4, NDFIP2,SLC13A3,TM9SF2,TMEM211,TSC22D1,UBAC2,USP6NL | ABCG8,ALDOB,ERICH4,CRISP2,CYP2D6,CYP3A4,DHDH, GSTA2,HAPLN4,HSD3B1,MGAM,NAT8,NTS,PDZK1P1, RBP2,SHBG,SLC10A2,SLC13A1,SLC5A12,SLC6A4,TREH |
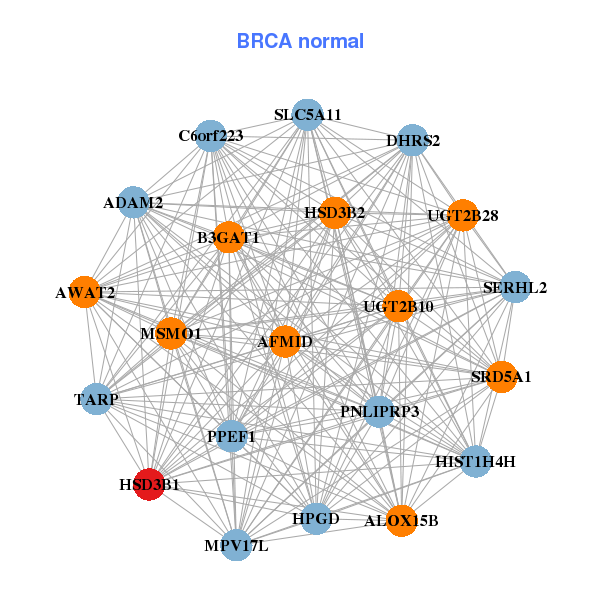
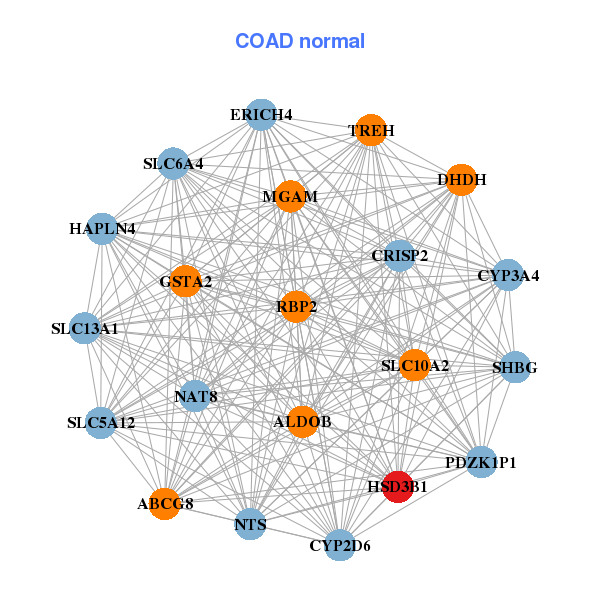
| * Co-Expression network figures were drawn using R package igraph. Only the top 20 genes with the highest correlations were shown. Red circle: input gene, orange circle: cell metabolism gene, sky circle: other gene |
: Open all plots for all cancer types
| Top |
: Open all interacting genes' information including KEGG pathway for all interacting genes from DAVID
| Top |
| Pharmacological Information for HSD3B1 |
| DB Category | DB Name | DB's ID and Url link |
| * Gene Centered Interaction Network. |
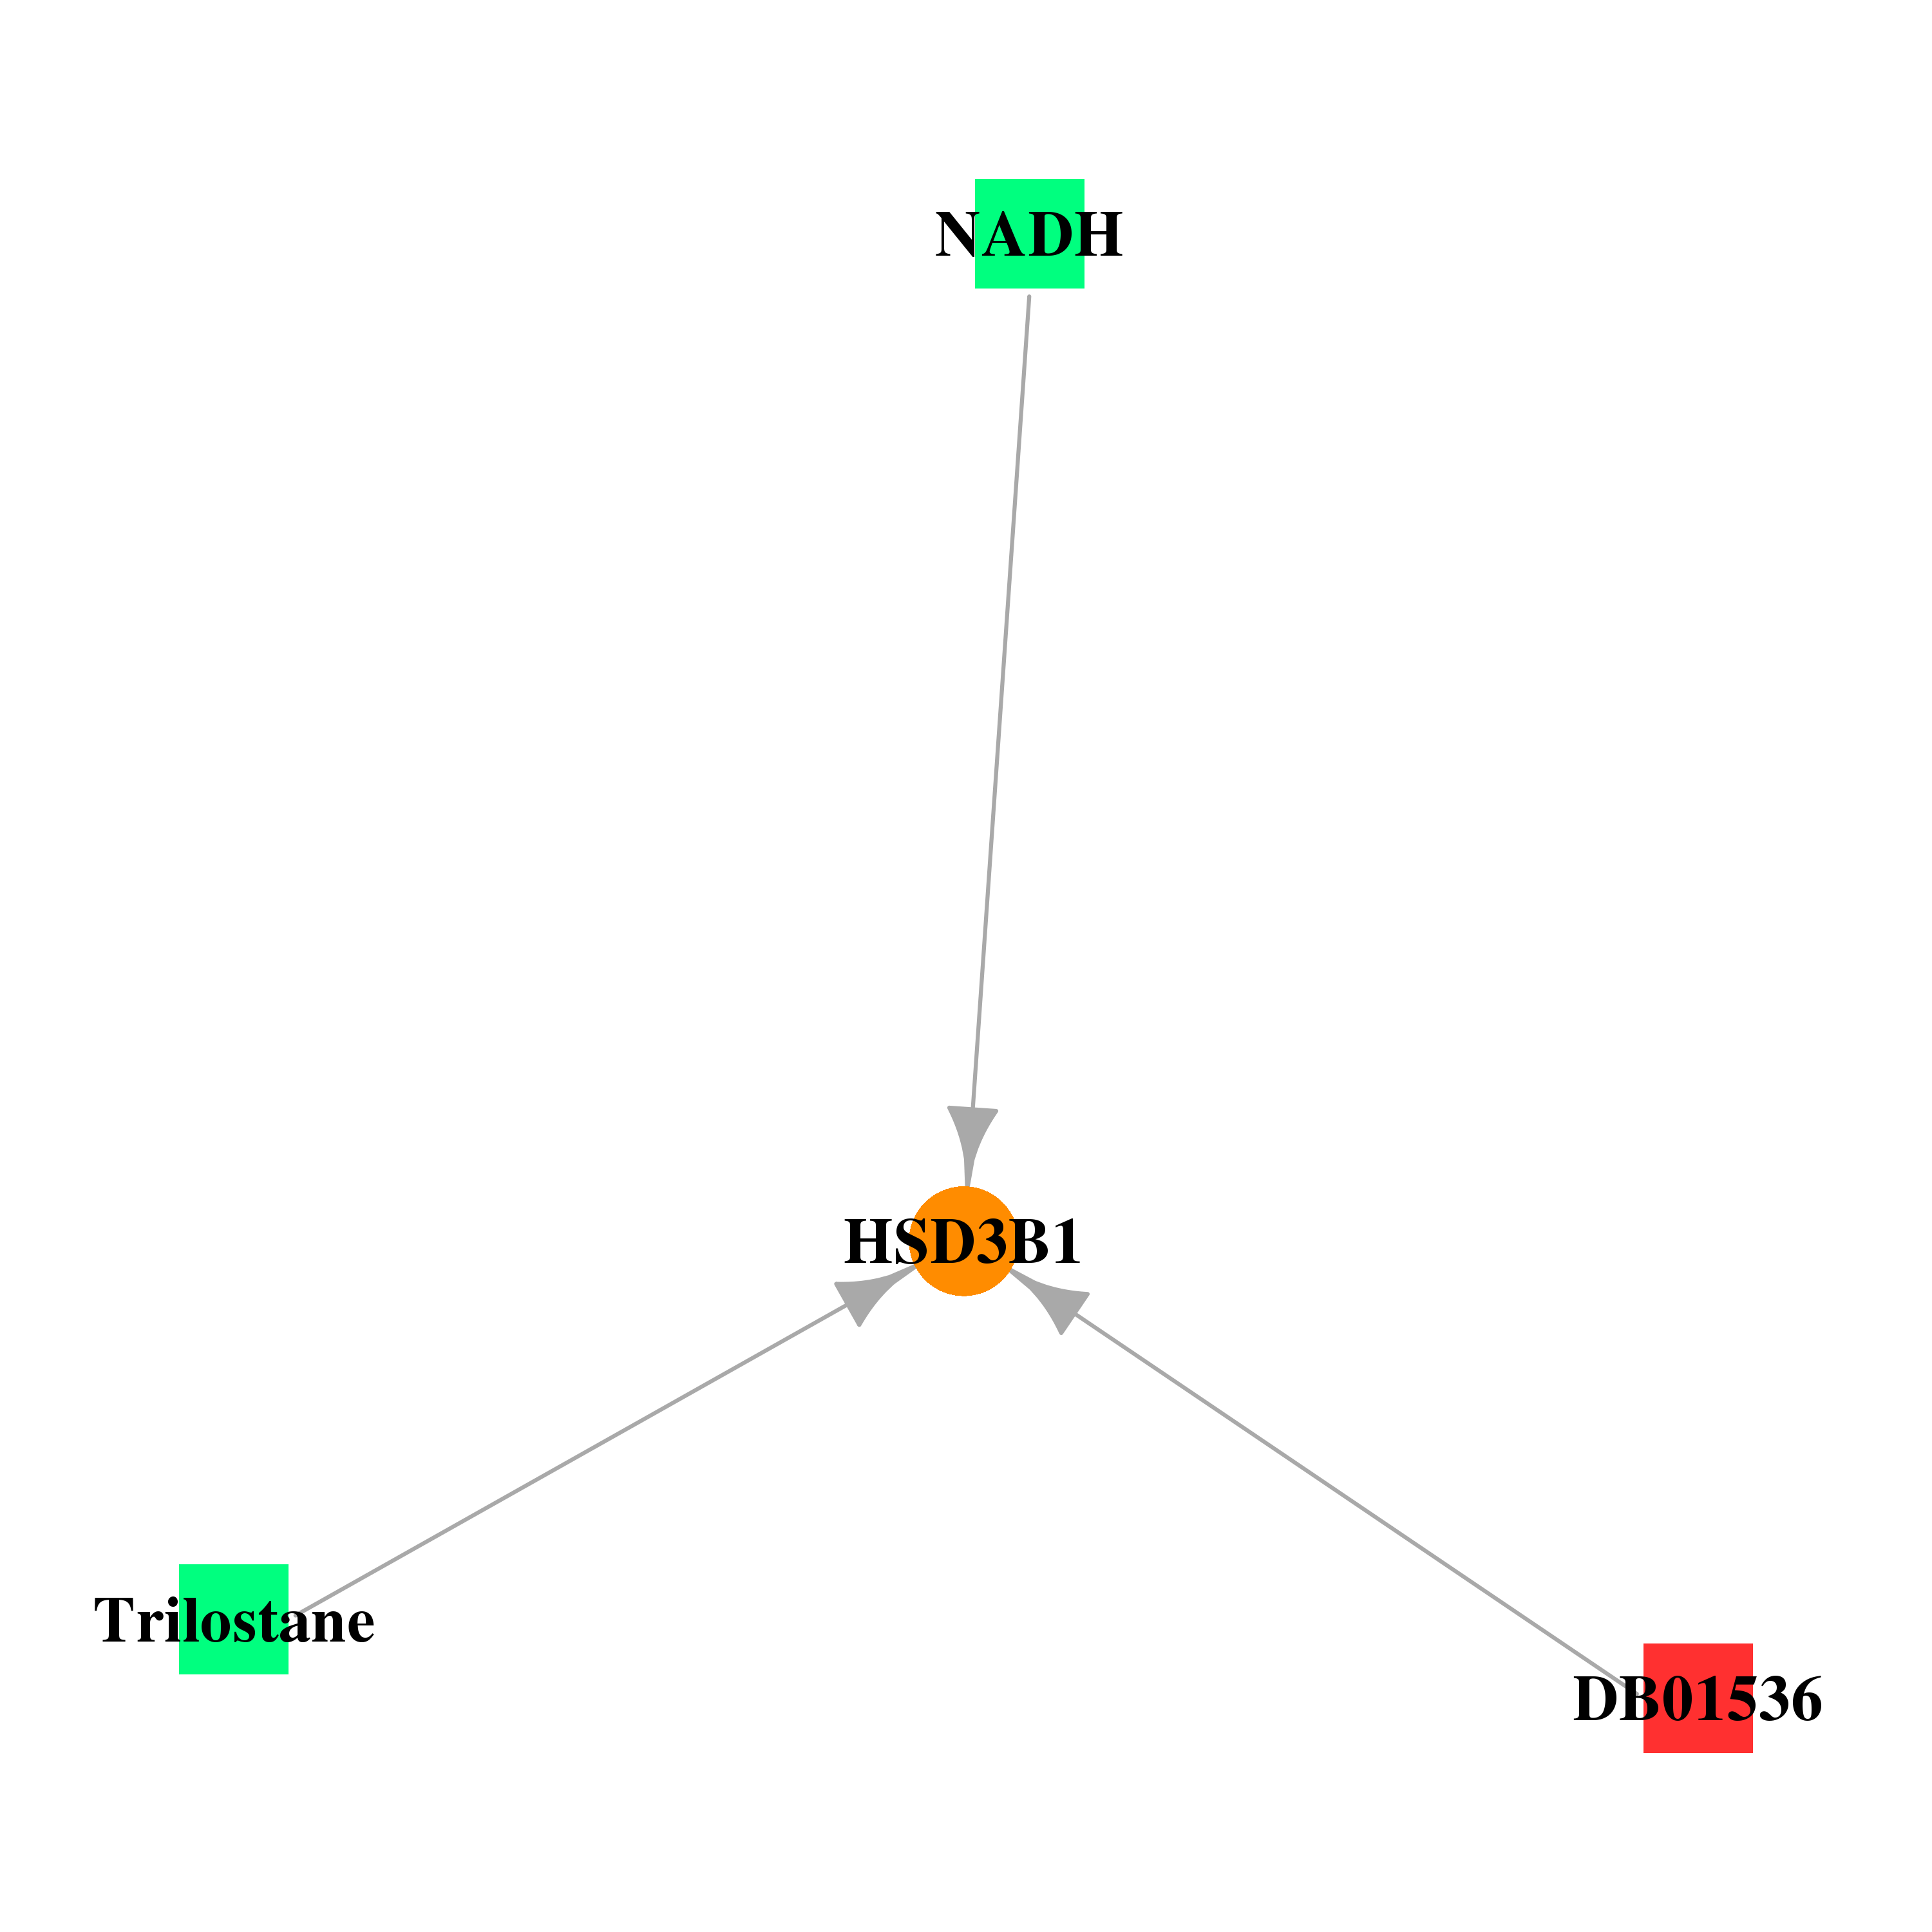 |
| * Drug Centered Interaction Network. |
| DrugBank ID | Target Name | Drug Groups | Generic Name | Drug Centered Network | Drug Structure |
| DB00157 | hydroxy-delta-5-steroid dehydrogenase, 3 beta- and steroid delta-isomerase 1 | approved; nutraceutical | NADH |  |  |
| DB01108 | hydroxy-delta-5-steroid dehydrogenase, 3 beta- and steroid delta-isomerase 1 | approved; withdrawn; investigational | Trilostane |  |  |
| DB01536 | hydroxy-delta-5-steroid dehydrogenase, 3 beta- and steroid delta-isomerase 1 | illicit; experimental | 4-Androstenedione | 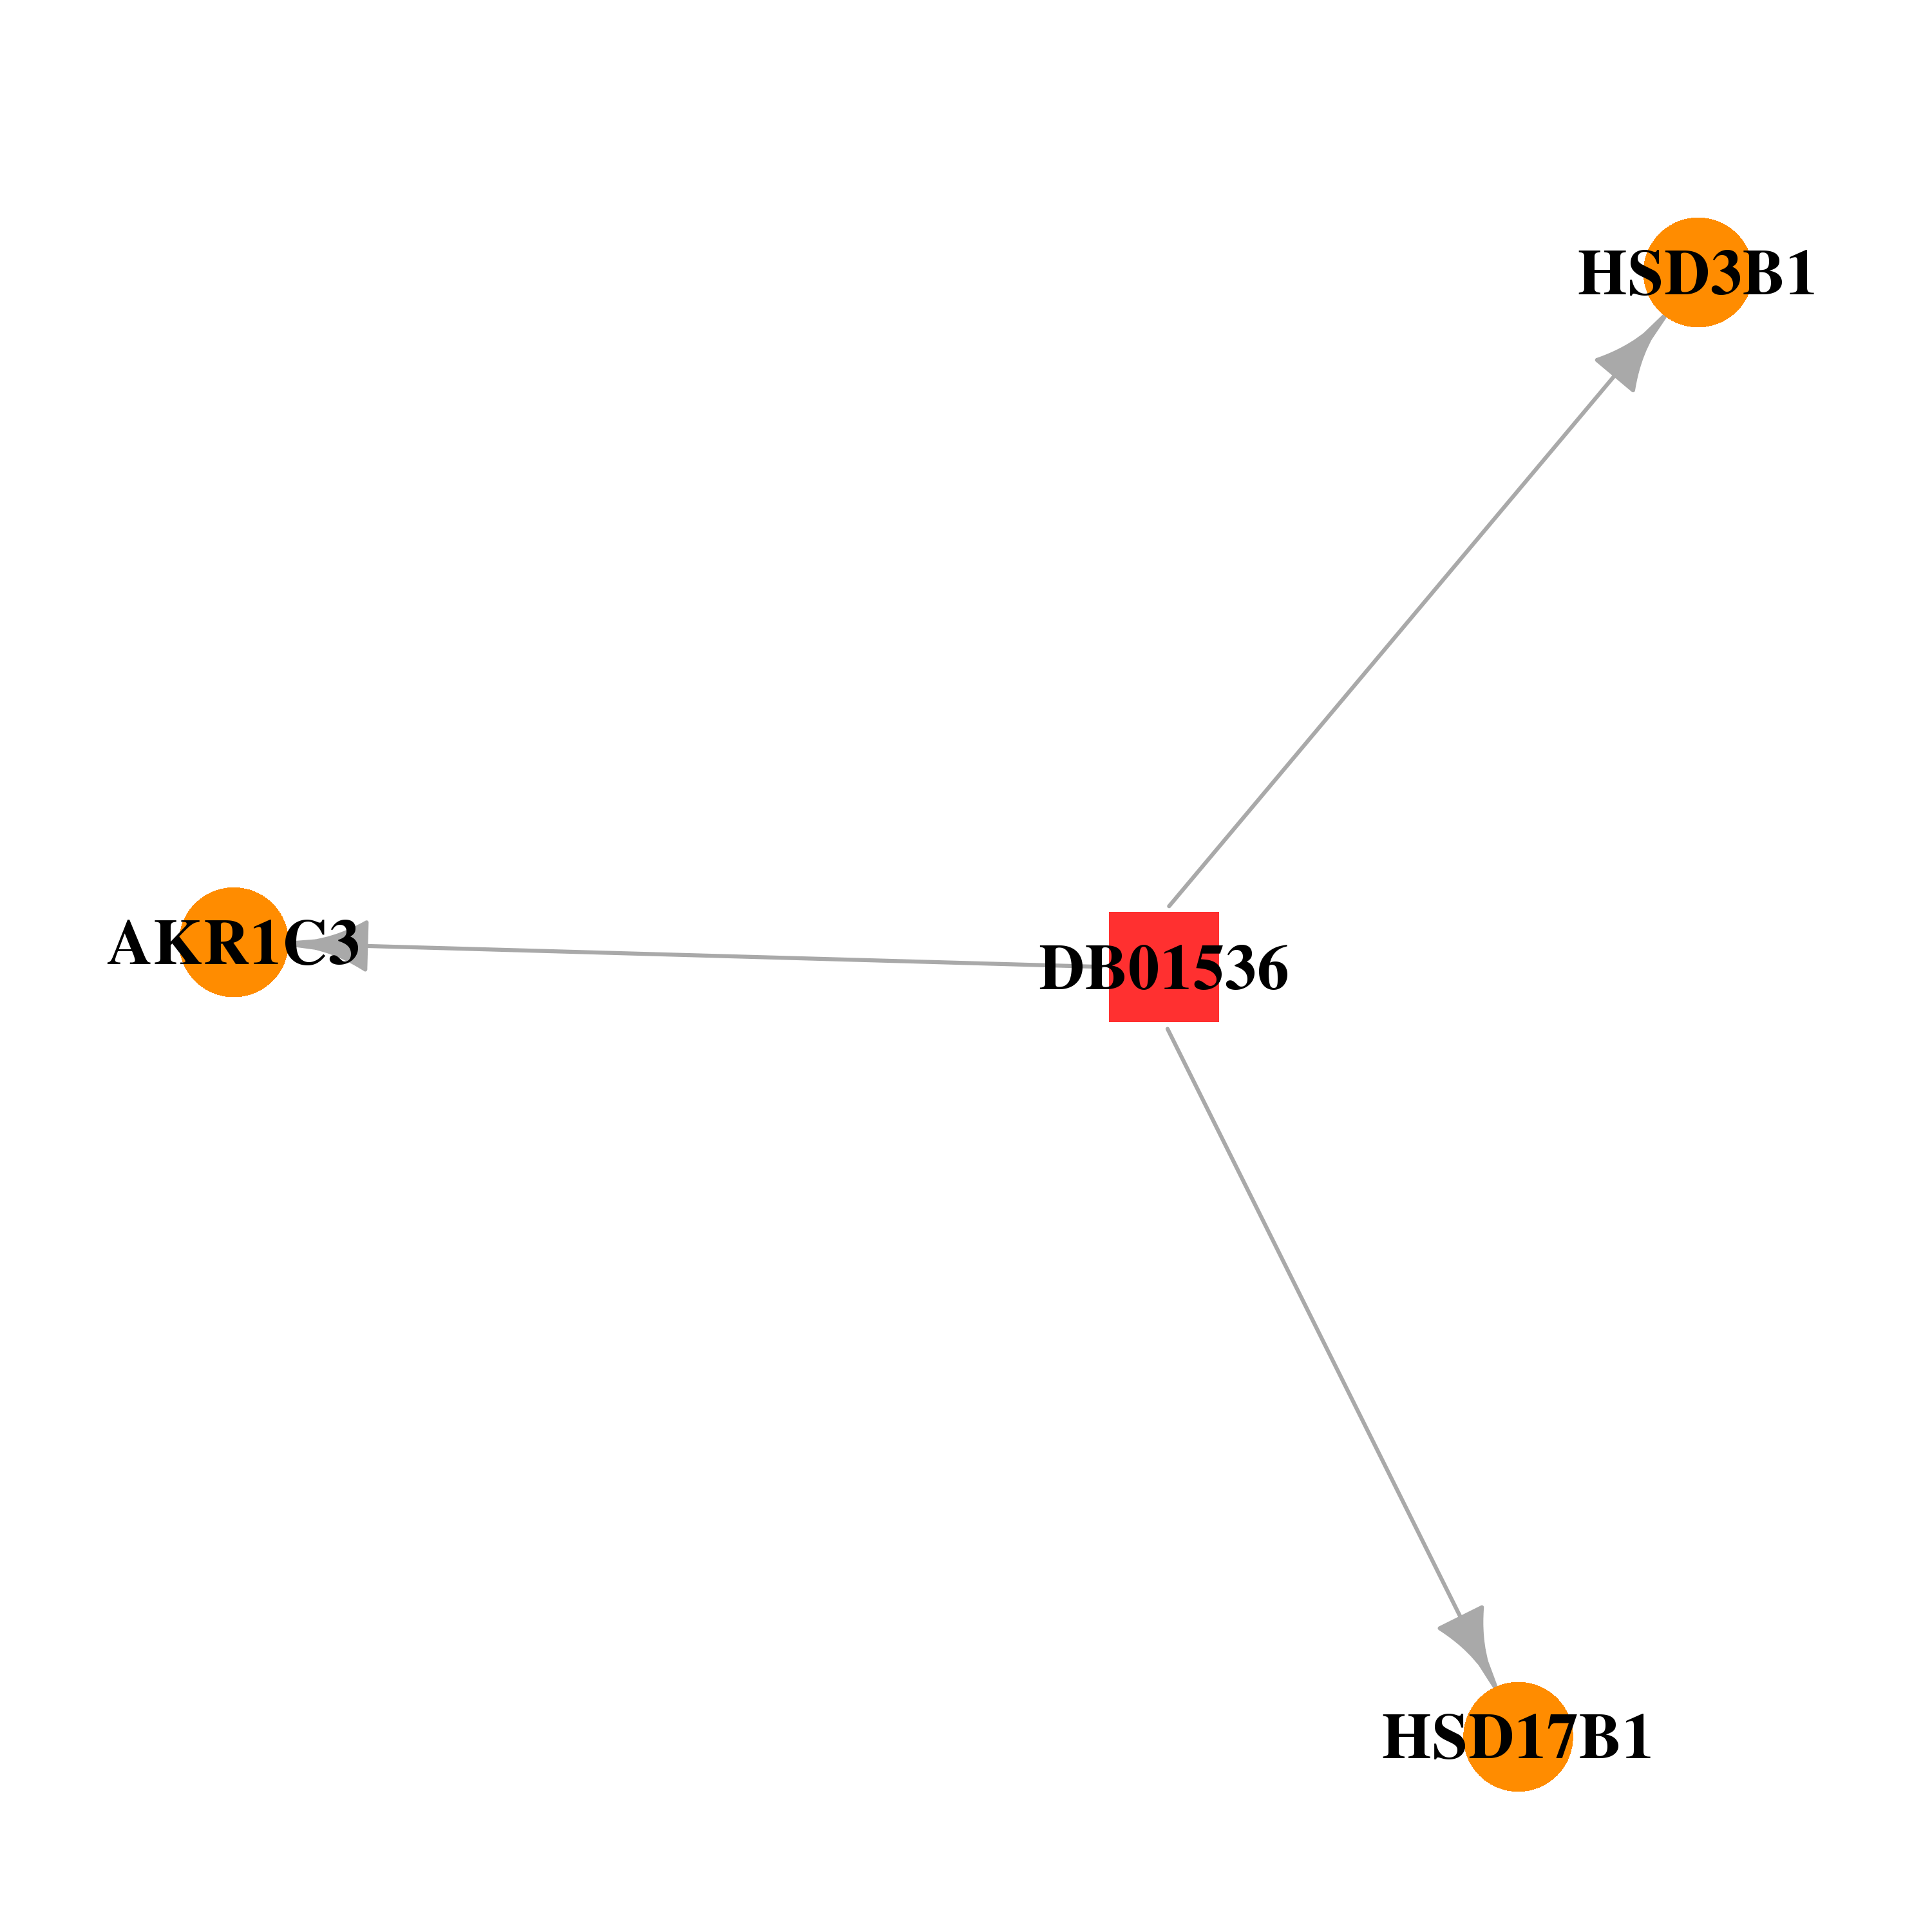 |  |
| Top |
| Cross referenced IDs for HSD3B1 |
| * We obtained these cross-references from Uniprot database. It covers 150 different DBs, 18 categories. http://www.uniprot.org/help/cross_references_section |
: Open all cross reference information
|
Copyright © 2016-Present - The Univsersity of Texas Health Science Center at Houston @ |