|
||||||||||||||||||||
| |
| Phenotypic Information (metabolism pathway, cancer, disease, phenome) |
| |
| |
| Gene-Gene Network Information: Co-Expression Network, Interacting Genes & KEGG |
| |
|


| Gene Summary for HSD3B2 |
| Basic gene info. | Gene symbol | HSD3B2 |
| Gene name | hydroxy-delta-5-steroid dehydrogenase, 3 beta- and steroid delta-isomerase 2 | |
| Synonyms | HSD3B|HSDB|SDR11E2 | |
| Cytomap | UCSC genome browser: 1p13.1 | |
| Genomic location | chr1 :119957742-119965662 | |
| Type of gene | protein-coding | |
| RefGenes | NM_000198.3, NM_001166120.1, | |
| Ensembl id | ENSG00000203859 | |
| Description | 3 beta-HSD type II3 beta-hydroxysteroid dehydrogenase type II, delta 5-delta 4-isomerase type II, 3 beta-HSD type II3 beta-hydroxysteroid dehydrogenase/Delta 5-->4-isomerase type 23 beta-hydroxysteroid dehydrogenase/Delta 5-->4-isomerase type II3-beta | |
| Modification date | 20141207 | |
| dbXrefs | MIM : 613890 | |
| HGNC : HGNC | ||
| Ensembl : ENSG00000203859 | ||
| HPRD : 01941 | ||
| Vega : OTTHUMG00000012526 | ||
| Protein | UniProt: go to UniProt's Cross Reference DB Table | |
| Expression | CleanEX: HS_HSD3B2 | |
| BioGPS: 3284 | ||
| Gene Expression Atlas: ENSG00000203859 | ||
| The Human Protein Atlas: ENSG00000203859 | ||
| Pathway | NCI Pathway Interaction Database: HSD3B2 | |
| KEGG: HSD3B2 | ||
| REACTOME: HSD3B2 | ||
| ConsensusPathDB | ||
| Pathway Commons: HSD3B2 | ||
| Metabolism | MetaCyc: HSD3B2 | |
| HUMANCyc: HSD3B2 | ||
| Regulation | Ensembl's Regulation: ENSG00000203859 | |
| miRBase: chr1 :119,957,742-119,965,662 | ||
| TargetScan: NM_000198 | ||
| cisRED: ENSG00000203859 | ||
| Context | iHOP: HSD3B2 | |
| cancer metabolism search in PubMed: HSD3B2 | ||
| UCL Cancer Institute: HSD3B2 | ||
| Assigned class in ccmGDB | C | |
| Top |
| Phenotypic Information for HSD3B2(metabolism pathway, cancer, disease, phenome) |
| Cancer | CGAP: HSD3B2 |
| Familial Cancer Database: HSD3B2 | |
| * This gene is included in those cancer gene databases. |
|
|
|
|
|
|
| ||||||||||||||
Oncogene 1 | Significant driver gene in | |||||||||||||||||||
| cf) number; DB name 1 Oncogene; http://nar.oxfordjournals.org/content/35/suppl_1/D721.long, 2 Tumor Suppressor gene; https://bioinfo.uth.edu/TSGene/, 3 Cancer Gene Census; http://www.nature.com/nrc/journal/v4/n3/abs/nrc1299.html, 4 CancerGenes; http://nar.oxfordjournals.org/content/35/suppl_1/D721.long, 5 Network of Cancer Gene; http://ncg.kcl.ac.uk/index.php, 1Therapeutic Vulnerabilities in Cancer; http://cbio.mskcc.org/cancergenomics/statius/ |
| REACTOME_METABOLISM_OF_STEROID_HORMONES_AND_VITAMINS_A_AND_D REACTOME_METABOLISM_OF_LIPIDS_AND_LIPOPROTEINS | |
| OMIM | |
| Orphanet | |
| Disease | KEGG Disease: HSD3B2 |
| MedGen: HSD3B2 (Human Medical Genetics with Condition) | |
| ClinVar: HSD3B2 | |
| Phenotype | MGI: HSD3B2 (International Mouse Phenotyping Consortium) |
| PhenomicDB: HSD3B2 | |
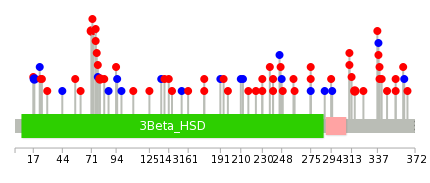
| Mutations for HSD3B2 |
| * Under tables are showing count per each tissue to give us broad intuition about tissue specific mutation patterns.You can go to the detailed page for each mutation database's web site. |
| There's no structural variation information in COSMIC data for this gene. |
| * From mRNA Sanger sequences, Chitars2.0 arranged chimeric transcripts. This table shows HSD3B2 related fusion information. |
| ID | Head Gene | Tail Gene | Accession | Gene_a | qStart_a | qEnd_a | Chromosome_a | tStart_a | tEnd_a | Gene_a | qStart_a | qEnd_a | Chromosome_a | tStart_a | tEnd_a |
| Top |
| There's no copy number variation information in COSMIC data for this gene. |
| Top |
|
 |
| Top |
| Stat. for Non-Synonymous SNVs (# total SNVs=42) | (# total SNVs=11) |
 |  |
(# total SNVs=1) | (# total SNVs=0) |
 |
| Top |
| * When you move the cursor on each content, you can see more deailed mutation information on the Tooltip. Those are primary_site,primary_histology,mutation(aa),pubmedID. |
| GRCh37 position | Mutation(aa) | Unique sampleID count |
| chr1:119962135-119962135 | p.I79M | 2 |
| chr1:119965071-119965071 | p.R316H | 2 |
| chr1:119962109-119962109 | p.A71T | 2 |
| chr1:119958096-119958096 | p.I18I | 2 |
| chr1:119964650-119964650 | p.G176S | 2 |
| chr1:119965140-119965140 | p.Y339S | 2 |
| chr1:119958115-119958115 | p.E25Q | 1 |
| chr1:119964717-119964717 | p.S198Y | 1 |
| chr1:119965160-119965160 | p.E346K | 1 |
| chr1:119962125-119962125 | p.S76L | 1 |
| Top |
|
 |
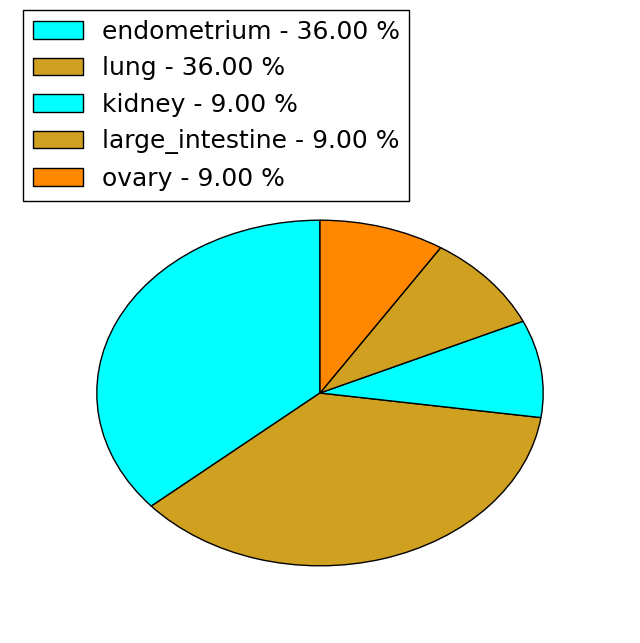
| Point Mutation/ Tissue ID | 1 | 2 | 3 | 4 | 5 | 6 | 7 | 8 | 9 | 10 | 11 | 12 | 13 | 14 | 15 | 16 | 17 | 18 | 19 | 20 |
| # sample | 2 | 3 | 5 | 3 | 1 | 12 | 5 | 2 | 12 | 2 | 8 | |||||||||
| # mutation | 3 | 3 | 5 | 3 | 1 | 16 | 5 | 2 | 15 | 2 | 9 | |||||||||
| nonsynonymous SNV | 3 | 3 | 4 | 2 | 15 | 3 | 1 | 8 | 1 | 5 | ||||||||||
| synonymous SNV | 1 | 1 | 1 | 1 | 2 | 1 | 7 | 1 | 4 |
| cf) Tissue ID; Tissue type (1; BLCA[Bladder Urothelial Carcinoma], 2; BRCA[Breast invasive carcinoma], 3; CESC[Cervical squamous cell carcinoma and endocervical adenocarcinoma], 4; COAD[Colon adenocarcinoma], 5; GBM[Glioblastoma multiforme], 6; Glioma Low Grade, 7; HNSC[Head and Neck squamous cell carcinoma], 8; KICH[Kidney Chromophobe], 9; KIRC[Kidney renal clear cell carcinoma], 10; KIRP[Kidney renal papillary cell carcinoma], 11; LAML[Acute Myeloid Leukemia], 12; LUAD[Lung adenocarcinoma], 13; LUSC[Lung squamous cell carcinoma], 14; OV[Ovarian serous cystadenocarcinoma ], 15; PAAD[Pancreatic adenocarcinoma], 16; PRAD[Prostate adenocarcinoma], 17; SKCM[Skin Cutaneous Melanoma], 18:STAD[Stomach adenocarcinoma], 19:THCA[Thyroid carcinoma], 20:UCEC[Uterine Corpus Endometrial Carcinoma]) |
| Top |
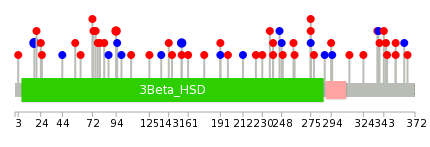
| * We represented just top 10 SNVs. When you move the cursor on each content, you can see more deailed mutation information on the Tooltip. Those are primary_site, primary_histology, mutation(aa), pubmedID. |
| Genomic Position | Mutation(aa) | Unique sampleID count |
| chr1:119958096 | p.I18I,HSD3B2 | 3 |
| chr1:119962178 | p.P155P,HSD3B2 | 2 |
| chr1:119964589 | p.E94K,HSD3B2 | 2 |
| chr1:119958115 | p.T56N,HSD3B2 | 1 |
| chr1:119964862 | p.L146Q,HSD3B2 | 1 |
| chr1:119965009 | p.R249L,HSD3B2 | 1 |
| chr1:119964650 | p.W345L,HSD3B2 | 1 |
| chr1:119965210 | p.D61H,HSD3B2 | 1 |
| chr1:119958174 | p.P155Q,HSD3B2 | 1 |
| chr1:119964868 | p.T259M,HSD3B2 | 1 |
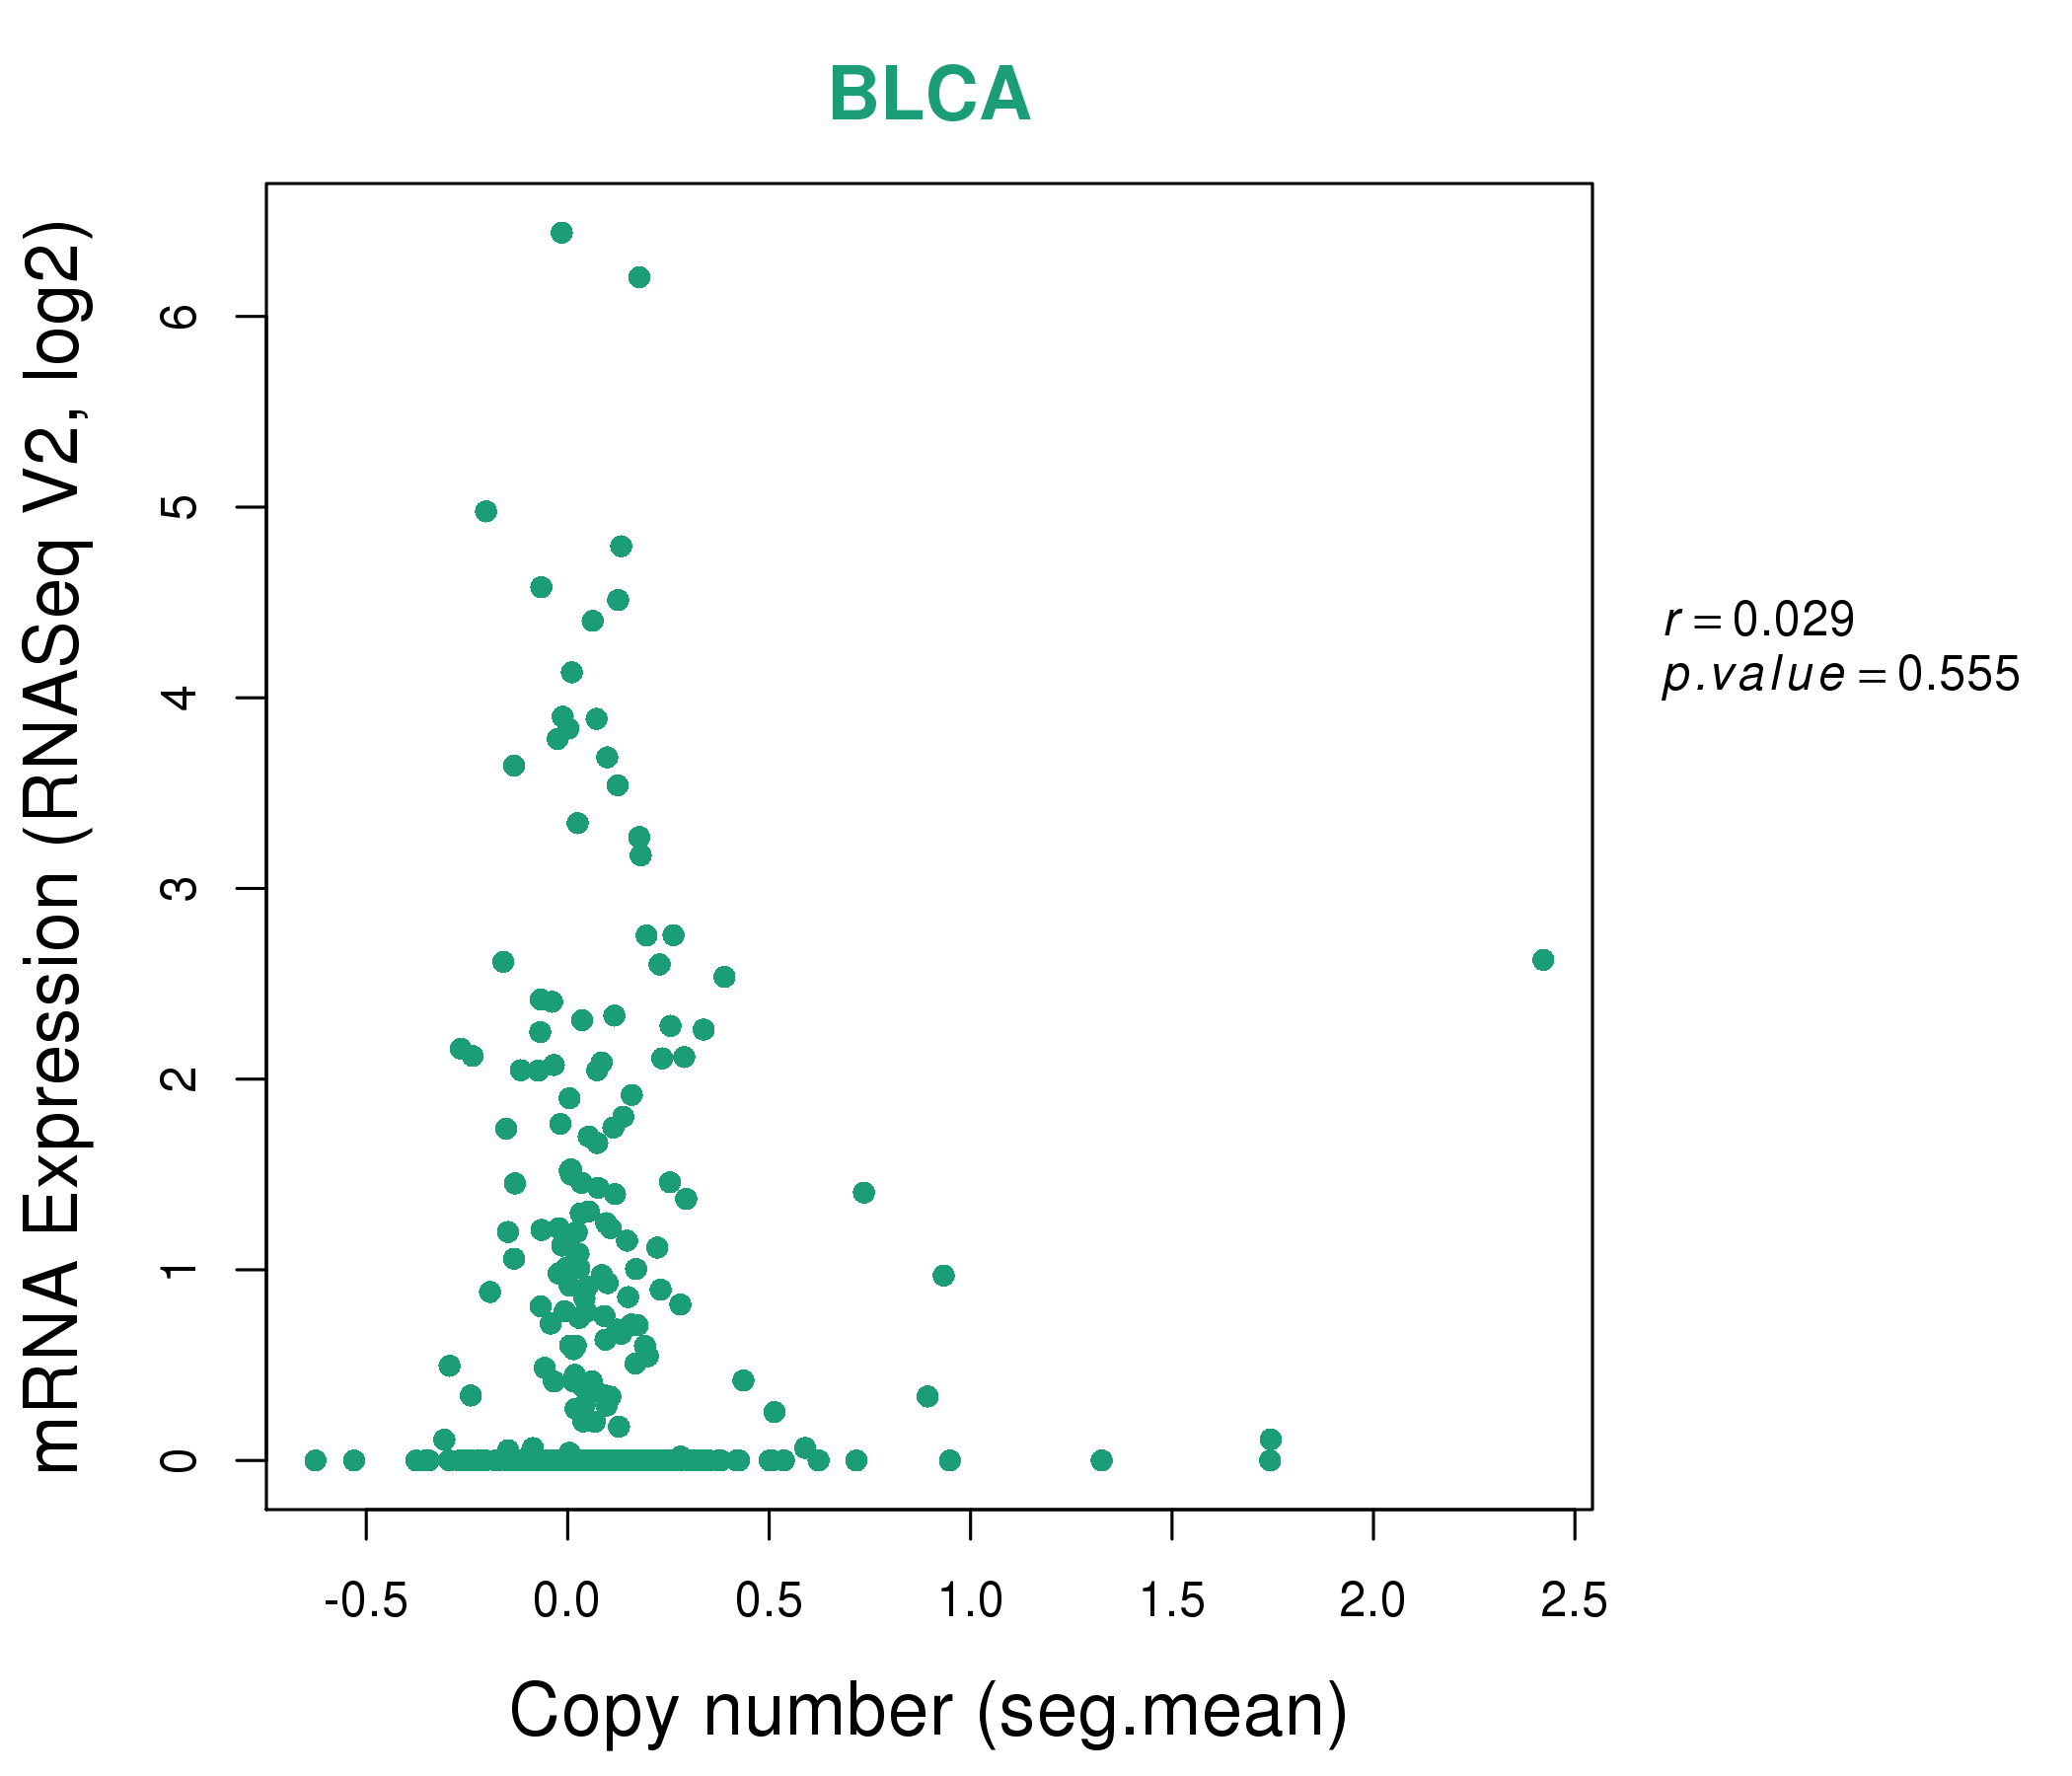
| * Copy number data were extracted from TCGA using R package TCGA-Assembler. The URLs of all public data files on TCGA DCC data server were gathered on Jan-05-2015. Function ProcessCNAData in TCGA-Assembler package was used to obtain gene-level copy number value which is calculated as the average copy number of the genomic region of a gene. |
 |
| cf) Tissue ID[Tissue type]: BLCA[Bladder Urothelial Carcinoma], BRCA[Breast invasive carcinoma], CESC[Cervical squamous cell carcinoma and endocervical adenocarcinoma], COAD[Colon adenocarcinoma], GBM[Glioblastoma multiforme], Glioma Low Grade, HNSC[Head and Neck squamous cell carcinoma], KICH[Kidney Chromophobe], KIRC[Kidney renal clear cell carcinoma], KIRP[Kidney renal papillary cell carcinoma], LAML[Acute Myeloid Leukemia], LUAD[Lung adenocarcinoma], LUSC[Lung squamous cell carcinoma], OV[Ovarian serous cystadenocarcinoma ], PAAD[Pancreatic adenocarcinoma], PRAD[Prostate adenocarcinoma], SKCM[Skin Cutaneous Melanoma], STAD[Stomach adenocarcinoma], THCA[Thyroid carcinoma], UCEC[Uterine Corpus Endometrial Carcinoma] |
| Top |
| Gene Expression for HSD3B2 |
| * CCLE gene expression data were extracted from CCLE_Expression_Entrez_2012-10-18.res: Gene-centric RMA-normalized mRNA expression data. |
 |
| * Normalized gene expression data of RNASeqV2 was extracted from TCGA using R package TCGA-Assembler. The URLs of all public data files on TCGA DCC data server were gathered at Jan-05-2015. Only eight cancer types have enough normal control samples for differential expression analysis. (t test, adjusted p<0.05 (using Benjamini-Hochberg FDR)) |
 |
| Top |
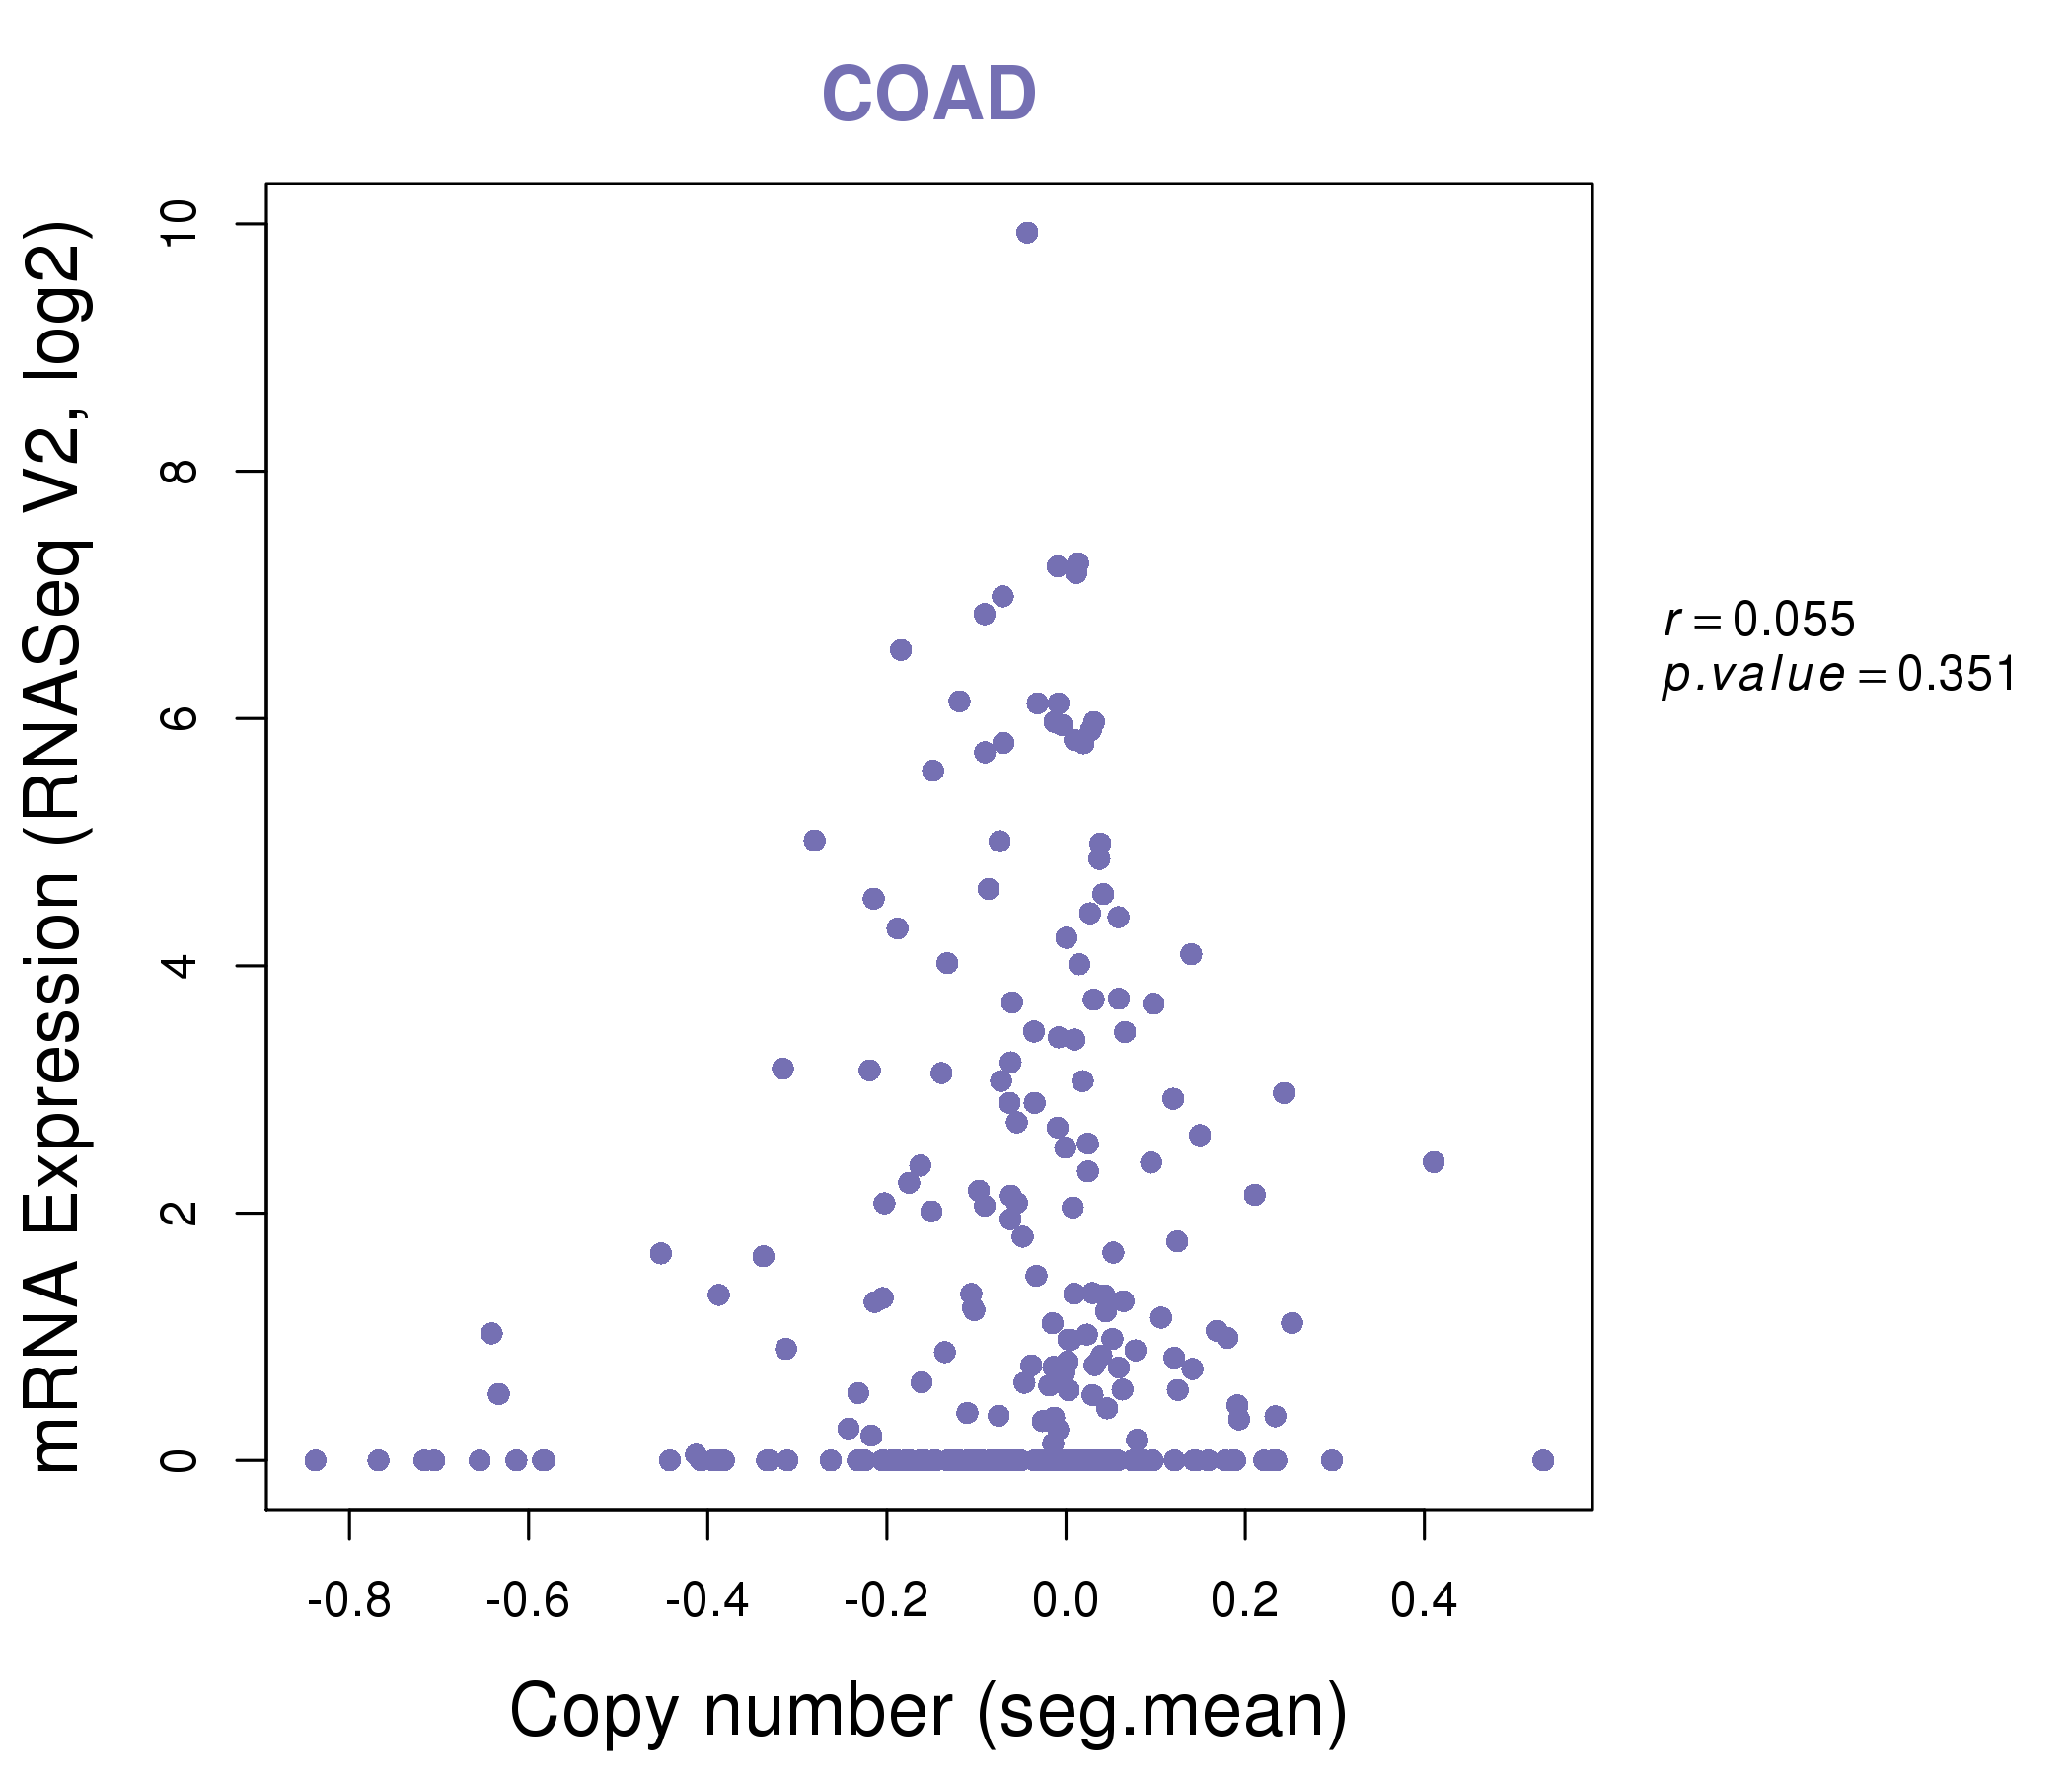
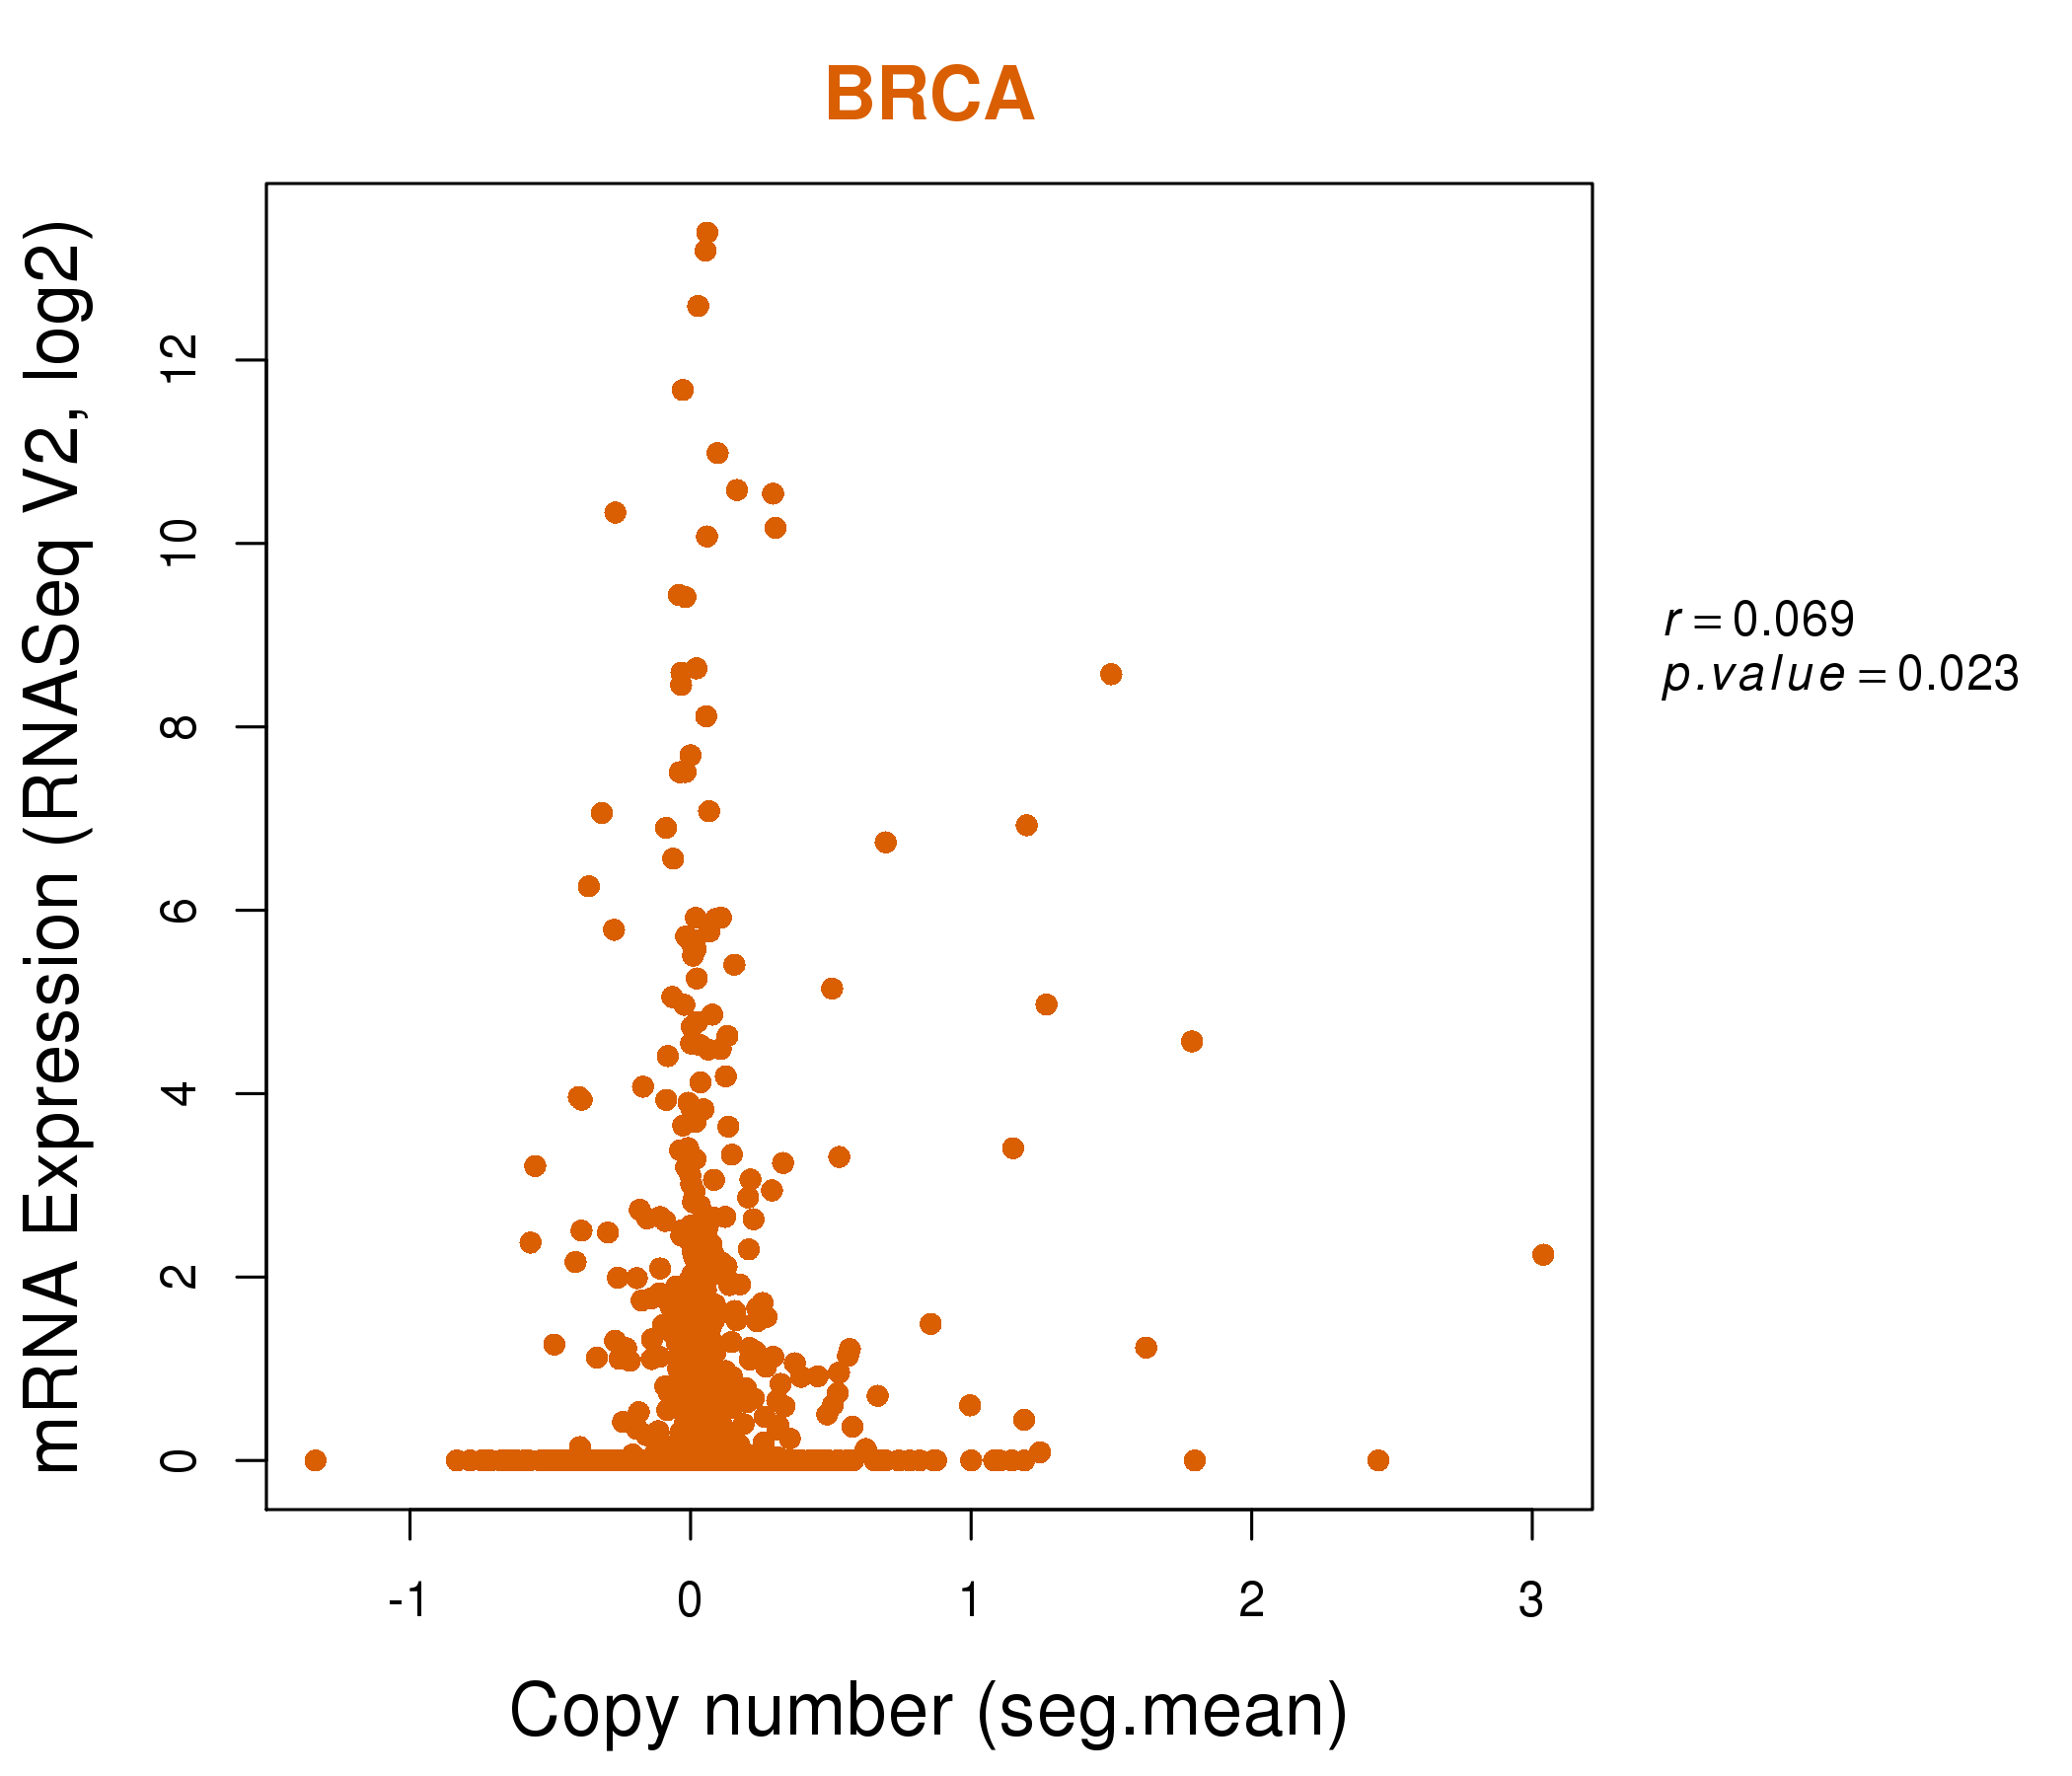
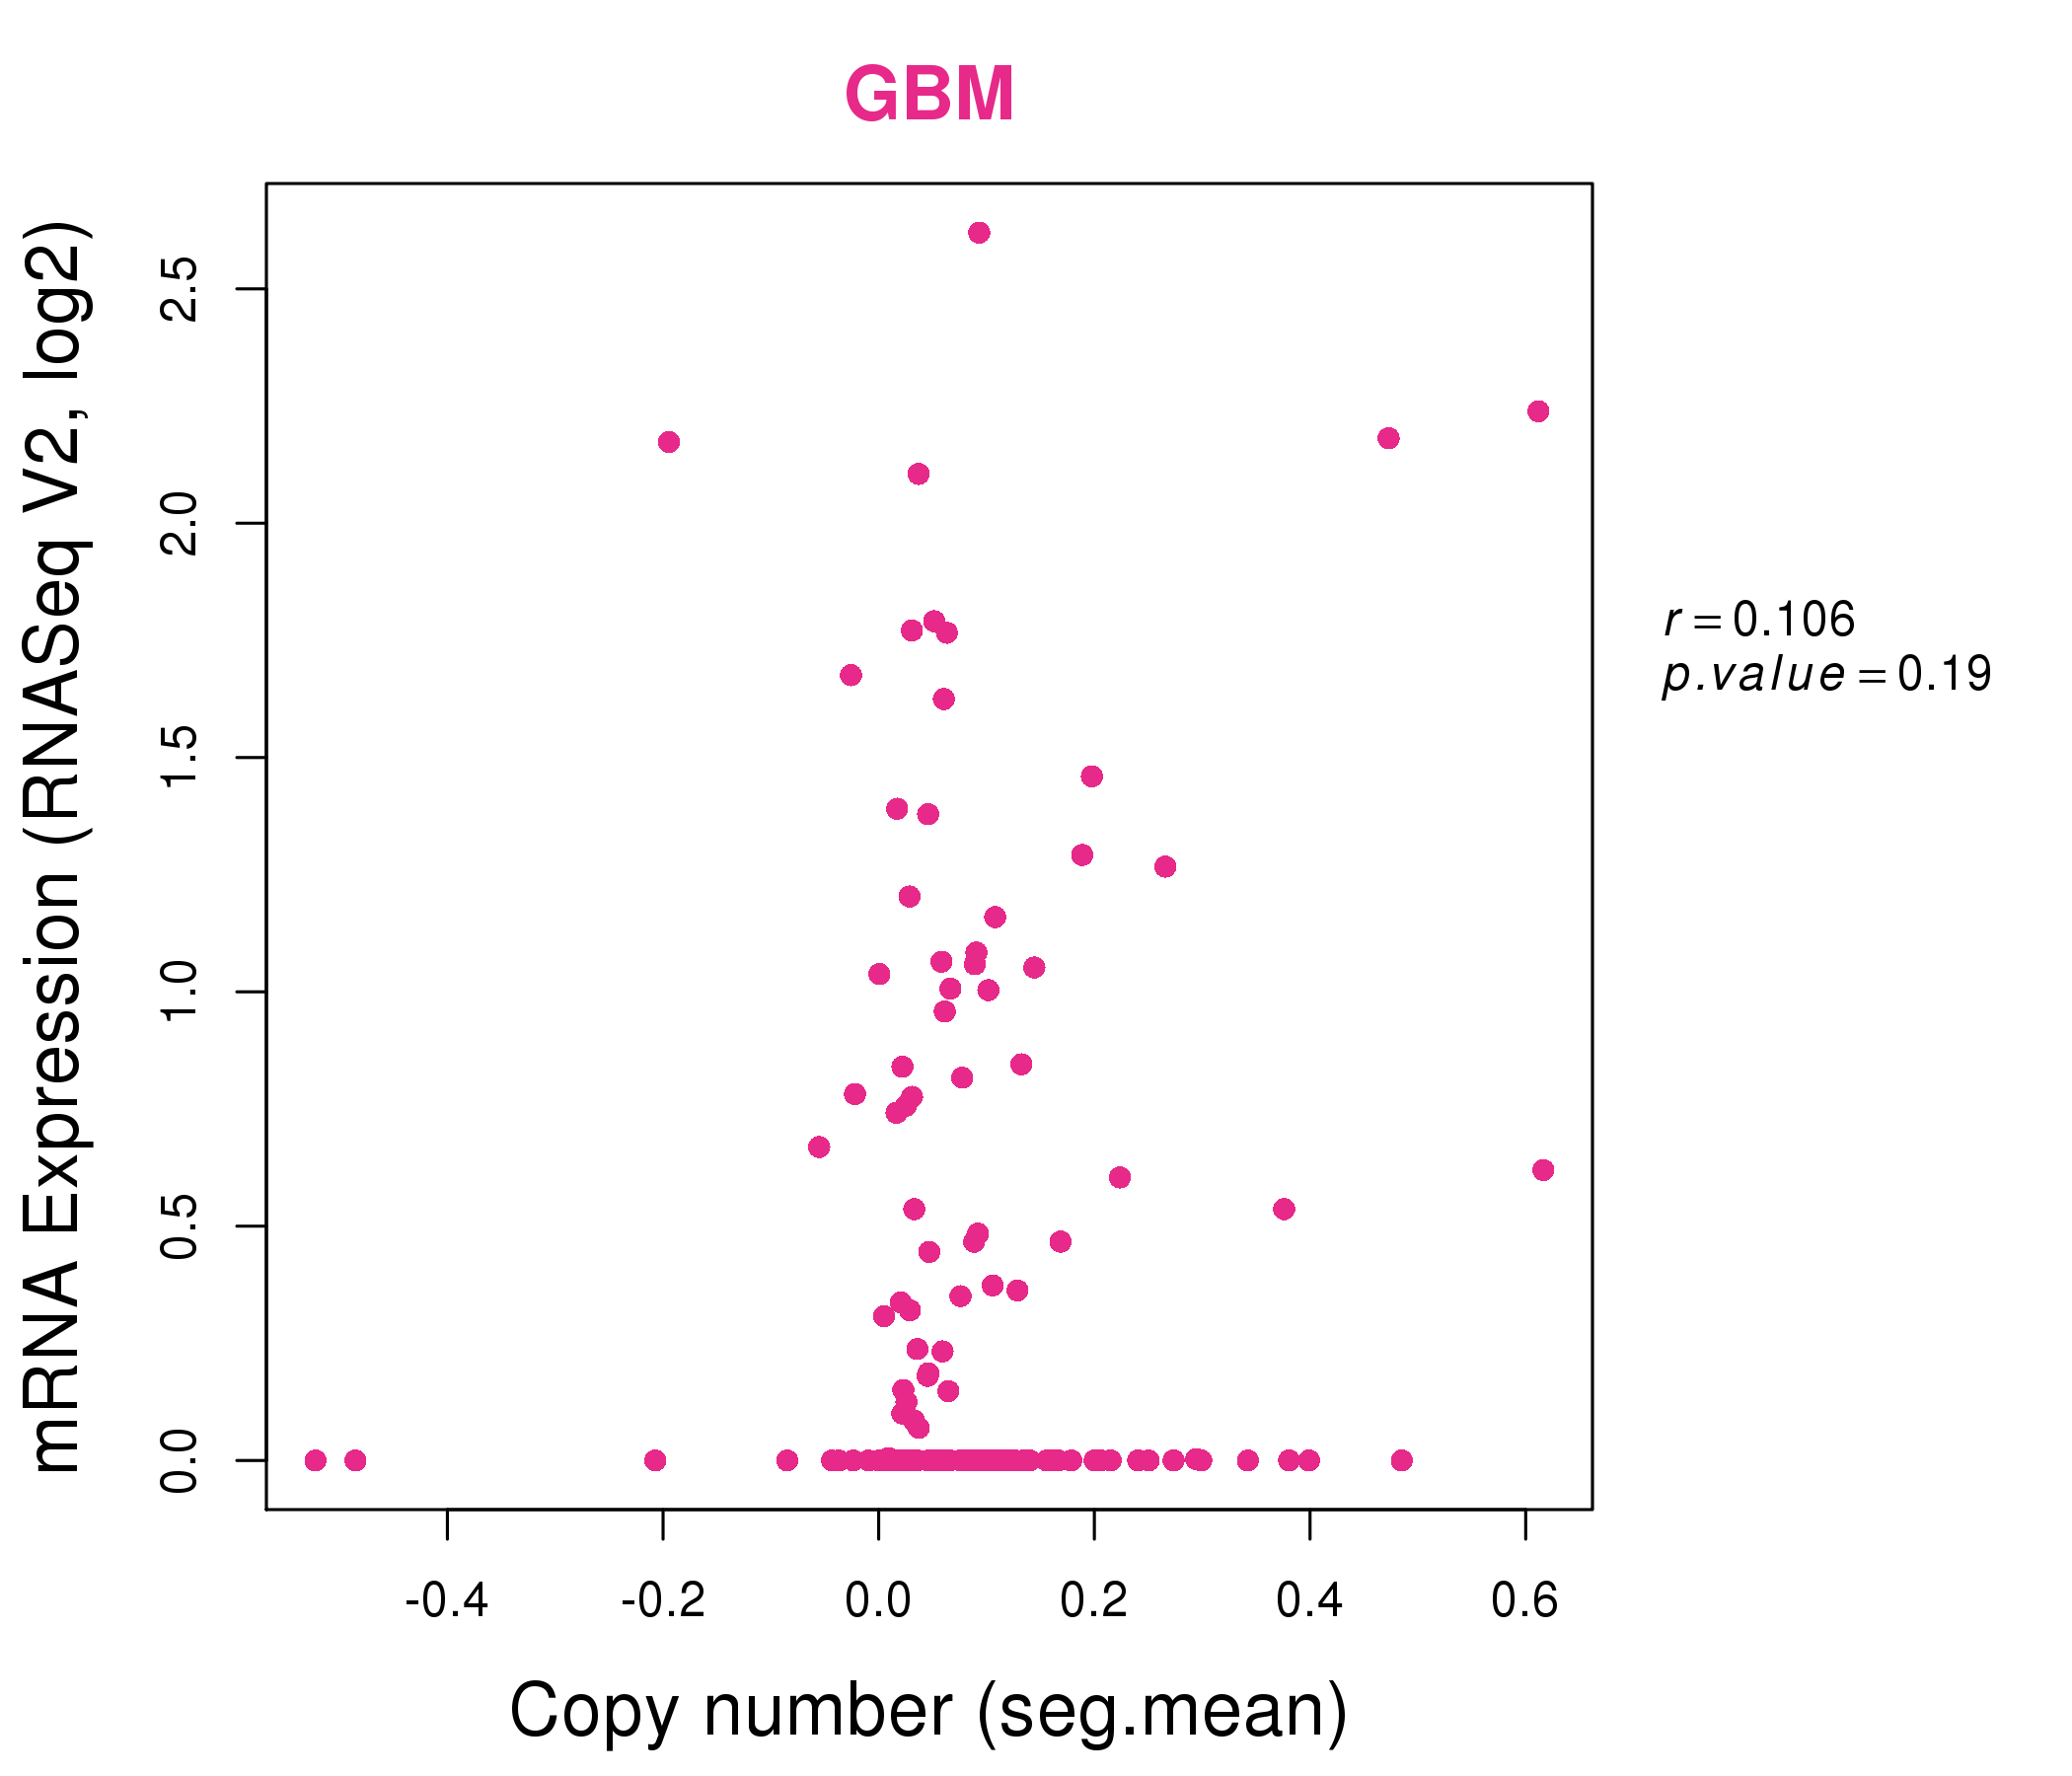
| * This plots show the correlation between CNV and gene expression. |
: Open all plots for all cancer types
 |
|
 |
|
| Top |
| Gene-Gene Network Information |
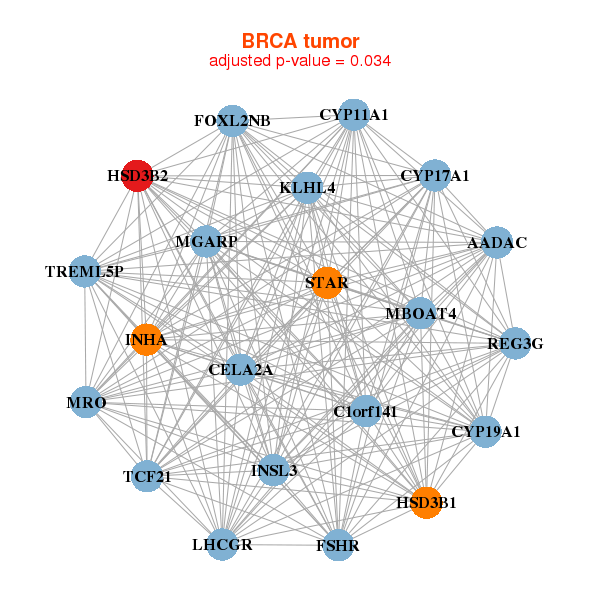
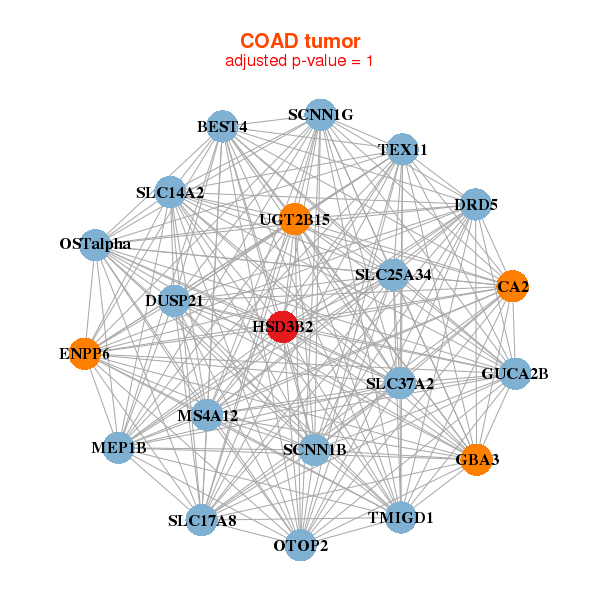
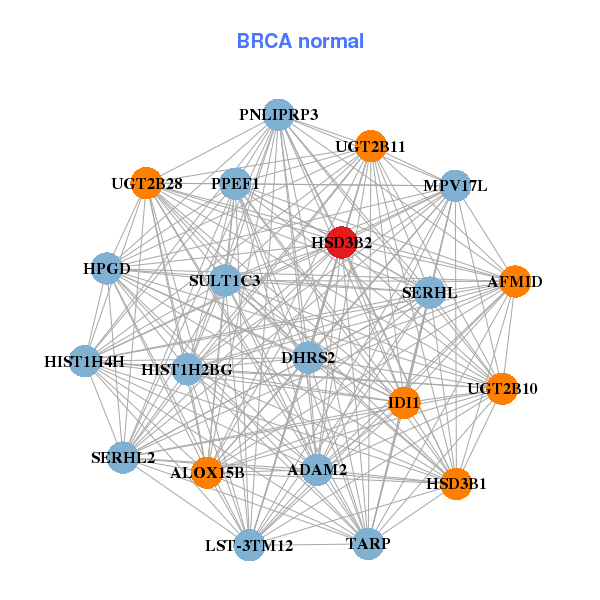
| * Co-Expression network figures were drawn using R package igraph. Only the top 20 genes with the highest correlations were shown. Red circle: input gene, orange circle: cell metabolism gene, sky circle: other gene |
: Open all plots for all cancer types
 |
| ||||
| AADAC,C1orf141,FOXL2NB,MGARP,CELA2A,CYP11A1,CYP17A1, CYP19A1,FSHR,HSD3B1,HSD3B2,INHA,INSL3,KLHL4, LHCGR,MBOAT4,MRO,REG3G,STAR,TCF21,TREML5P | ADAM2,AFMID,ALOX15B,DHRS2,HIST1H2BG,HIST1H4H,HPGD, HSD3B1,HSD3B2,IDI1,LST-3TM12,MPV17L,PNLIPRP3,PPEF1, SERHL2,SERHL,SULT1C3,TARP,UGT2B10,UGT2B11,UGT2B28 | ||||
 |
| ||||
| BEST4,CA2,DRD5,DUSP21,ENPP6,GBA3,GUCA2B, HSD3B2,MEP1B,MS4A12,OSTalpha,OTOP2,SCNN1B,SCNN1G, SLC14A2,SLC17A8,SLC25A34,SLC37A2,TEX11,TMIGD1,UGT2B15 | ALDH1L1,ARRDC4,ART1,LINC01565,C8orf74,CAPN11,CCT8L2, ERBB4,FAM138D,HSD3B2,HTR3D,LOC339240,LRRC6,LRRIQ4, MFAP3L,MS4A12,SBK2,SERPINA11,SOX14,TEX101,WNT5A |
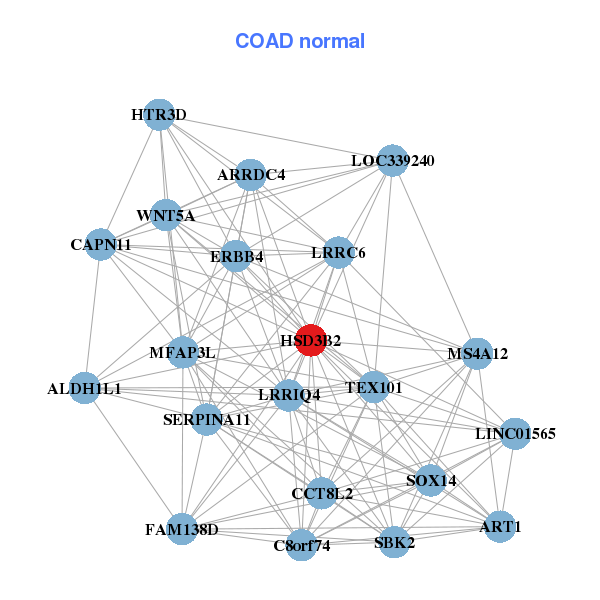
| * Co-Expression network figures were drawn using R package igraph. Only the top 20 genes with the highest correlations were shown. Red circle: input gene, orange circle: cell metabolism gene, sky circle: other gene |
: Open all plots for all cancer types
| Top |
: Open all interacting genes' information including KEGG pathway for all interacting genes from DAVID
| Top |
| Pharmacological Information for HSD3B2 |
| DB Category | DB Name | DB's ID and Url link |
| * Gene Centered Interaction Network. |
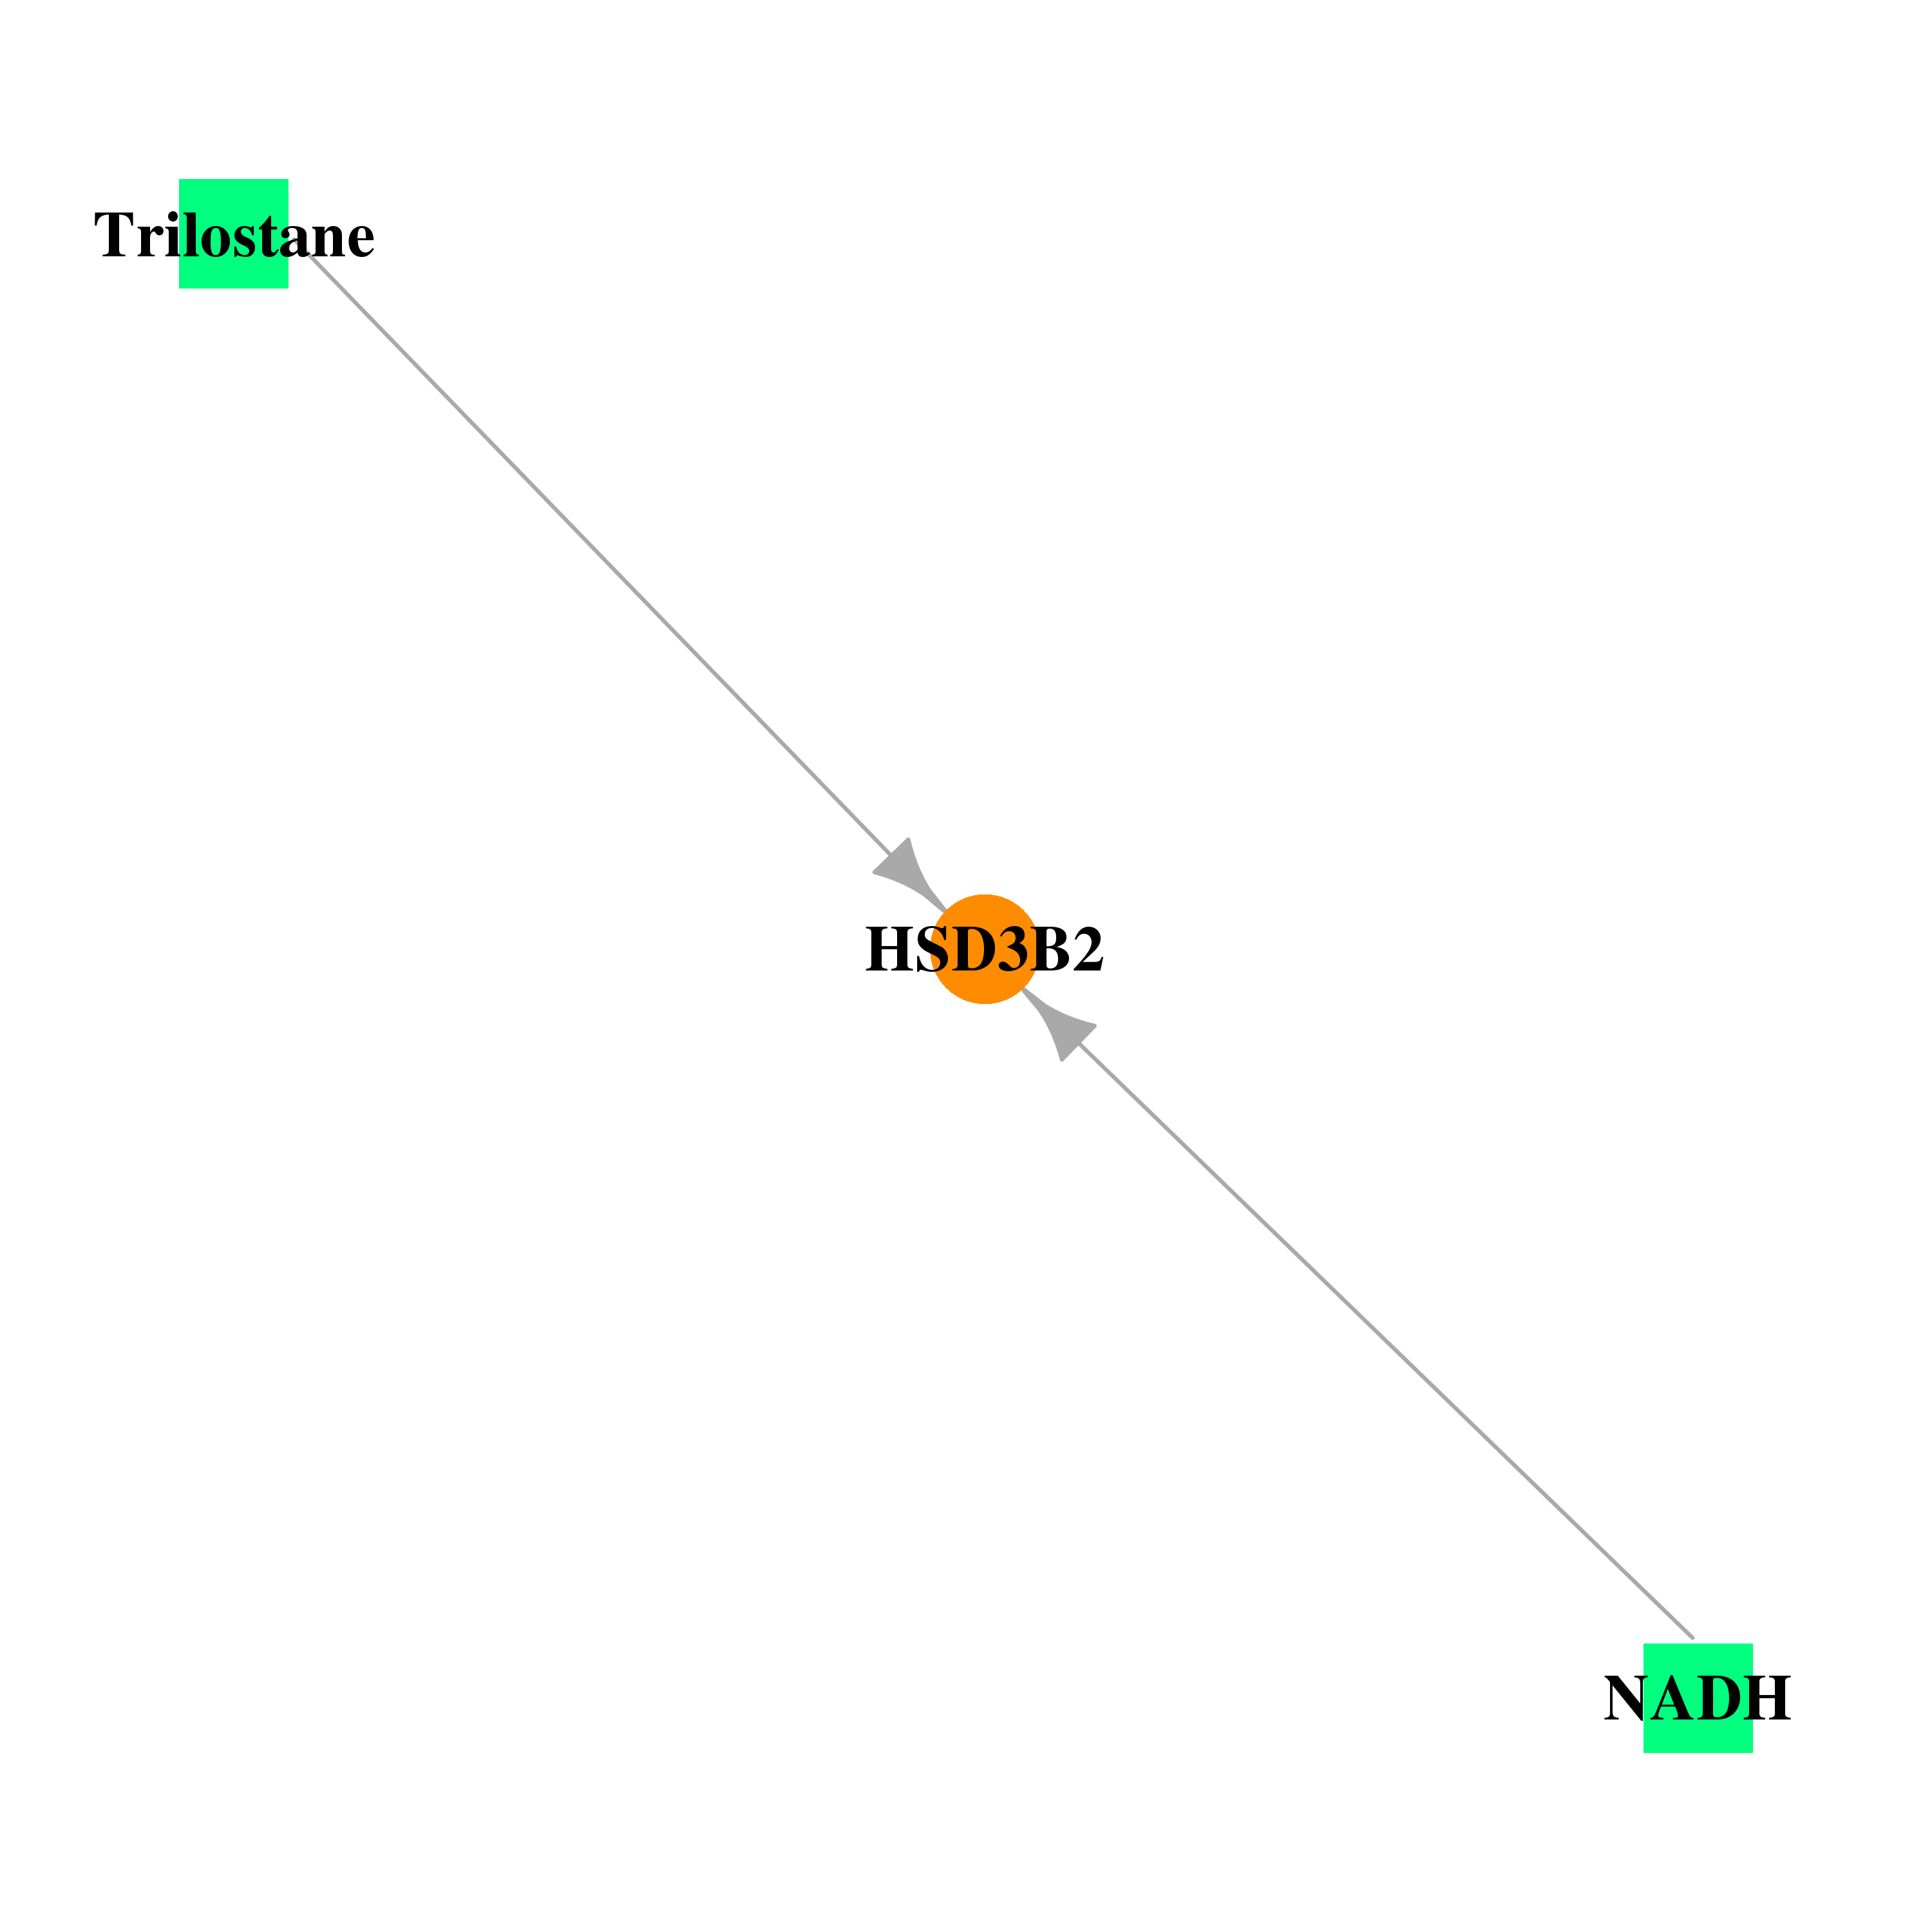 |
| * Drug Centered Interaction Network. |
| DrugBank ID | Target Name | Drug Groups | Generic Name | Drug Centered Network | Drug Structure |
| DB00157 | hydroxy-delta-5-steroid dehydrogenase, 3 beta- and steroid delta-isomerase 2 | approved; nutraceutical | NADH |  |  |
| DB01108 | hydroxy-delta-5-steroid dehydrogenase, 3 beta- and steroid delta-isomerase 2 | approved; withdrawn; investigational | Trilostane |  |  |
| Top |
| Cross referenced IDs for HSD3B2 |
| * We obtained these cross-references from Uniprot database. It covers 150 different DBs, 18 categories. http://www.uniprot.org/help/cross_references_section |
: Open all cross reference information
|
Copyright © 2016-Present - The Univsersity of Texas Health Science Center at Houston @ |