|
|||||||||||||||||||||||||||||||||||||||||||||||||||||||||||||||||||||||||||||||||||||||||||||||||||||||||||||||||||||||||||||||||||||||||||||||||||||||||||||||||||||||||||||||||||||||||||||||||||||||||||||||||||||||||||||||||||||||||||||||||||||||||||||||||||||||||||||||||||||||||||||||||||||||||||||||||||||||||||||||||||||||||||||||||||||||||
| |
| Phenotypic Information (metabolism pathway, cancer, disease, phenome) |
| |
| |
| Gene-Gene Network Information: Co-Expression Network, Interacting Genes & KEGG |
| |
|


| Gene Summary for HSD17B3 |
| Basic gene info. | Gene symbol | HSD17B3 |
| Gene name | hydroxysteroid (17-beta) dehydrogenase 3 | |
| Synonyms | EDH17B3|SDR12C2 | |
| Cytomap | UCSC genome browser: 9q22 | |
| Genomic location | chr9 :98997588-99064434 | |
| Type of gene | protein-coding | |
| RefGenes | NM_000197.1, | |
| Ensembl id | ENSG00000130948 | |
| Description | 17-beta-HSD 317-beta-HSD317-beta-hydroxysteroid dehydrogenase type 3short chain dehydrogenase/reductase family 12C, member 2testicular 17-beta-hydroxysteroid dehydrogenasetestosterone 17-beta-dehydrogenase 3 | |
| Modification date | 20141207 | |
| dbXrefs | MIM : 605573 | |
| HGNC : HGNC | ||
| Ensembl : ENSG00000130948 | ||
| HPRD : 05716 | ||
| Vega : OTTHUMG00000020292 | ||
| Protein | UniProt: go to UniProt's Cross Reference DB Table | |
| Expression | CleanEX: HS_HSD17B3 | |
| BioGPS: 3293 | ||
| Gene Expression Atlas: ENSG00000130948 | ||
| The Human Protein Atlas: ENSG00000130948 | ||
| Pathway | NCI Pathway Interaction Database: HSD17B3 | |
| KEGG: HSD17B3 | ||
| REACTOME: HSD17B3 | ||
| ConsensusPathDB | ||
| Pathway Commons: HSD17B3 | ||
| Metabolism | MetaCyc: HSD17B3 | |
| HUMANCyc: HSD17B3 | ||
| Regulation | Ensembl's Regulation: ENSG00000130948 | |
| miRBase: chr9 :98,997,588-99,064,434 | ||
| TargetScan: NM_000197 | ||
| cisRED: ENSG00000130948 | ||
| Context | iHOP: HSD17B3 | |
| cancer metabolism search in PubMed: HSD17B3 | ||
| UCL Cancer Institute: HSD17B3 | ||
| Assigned class in ccmGDB | C | |
| Top |
| Phenotypic Information for HSD17B3(metabolism pathway, cancer, disease, phenome) |
| Cancer | CGAP: HSD17B3 |
| Familial Cancer Database: HSD17B3 | |
| * This gene is included in those cancer gene databases. |
|
|
|
|
|
|
| |||||||||||||||||||||||||||||||||||||||||||||||||||||||||||||||||||||||||||||||||||||||||||||||||||||||||||||||||||||||||||||||||||||||||||||||||||||||||||||||||||||||||||||||||||||||||||||||||||||||||||||||||||||||||||||||||||||||||||||||||||||||||||||||||||||||||||||||||||||||||||||||||||||||||||||||||||||||||||||||||||||||||||||||||||
Oncogene 1 | Significant driver gene in | ||||||||||||||||||||||||||||||||||||||||||||||||||||||||||||||||||||||||||||||||||||||||||||||||||||||||||||||||||||||||||||||||||||||||||||||||||||||||||||||||||||||||||||||||||||||||||||||||||||||||||||||||||||||||||||||||||||||||||||||||||||||||||||||||||||||||||||||||||||||||||||||||||||||||||||||||||||||||||||||||||||||||||||||||||||||||
| cf) number; DB name 1 Oncogene; http://nar.oxfordjournals.org/content/35/suppl_1/D721.long, 2 Tumor Suppressor gene; https://bioinfo.uth.edu/TSGene/, 3 Cancer Gene Census; http://www.nature.com/nrc/journal/v4/n3/abs/nrc1299.html, 4 CancerGenes; http://nar.oxfordjournals.org/content/35/suppl_1/D721.long, 5 Network of Cancer Gene; http://ncg.kcl.ac.uk/index.php, 1Therapeutic Vulnerabilities in Cancer; http://cbio.mskcc.org/cancergenomics/statius/ |
| REACTOME_METABOLISM_OF_STEROID_HORMONES_AND_VITAMINS_A_AND_D REACTOME_METABOLISM_OF_LIPIDS_AND_LIPOPROTEINS | |
| Mutations for HSD17B3 |
| * Under tables are showing count per each tissue to give us broad intuition about tissue specific mutation patterns.You can go to the detailed page for each mutation database's web site. |
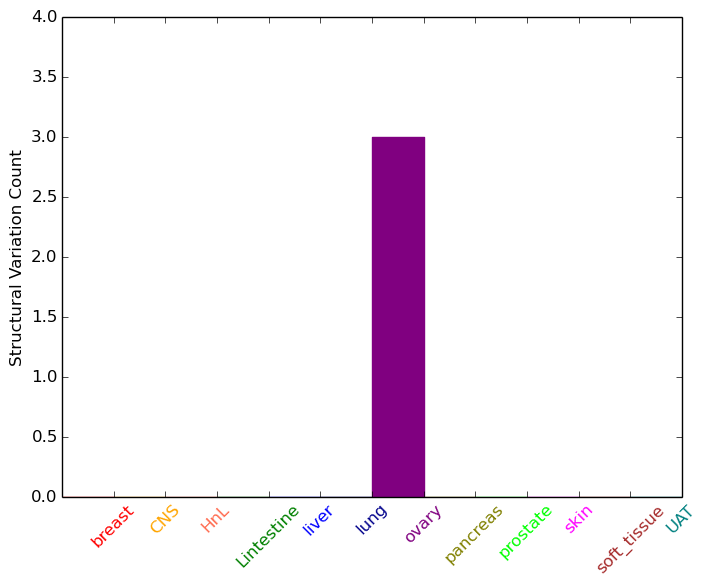
| - Statistics for Tissue and Mutation type | Top |
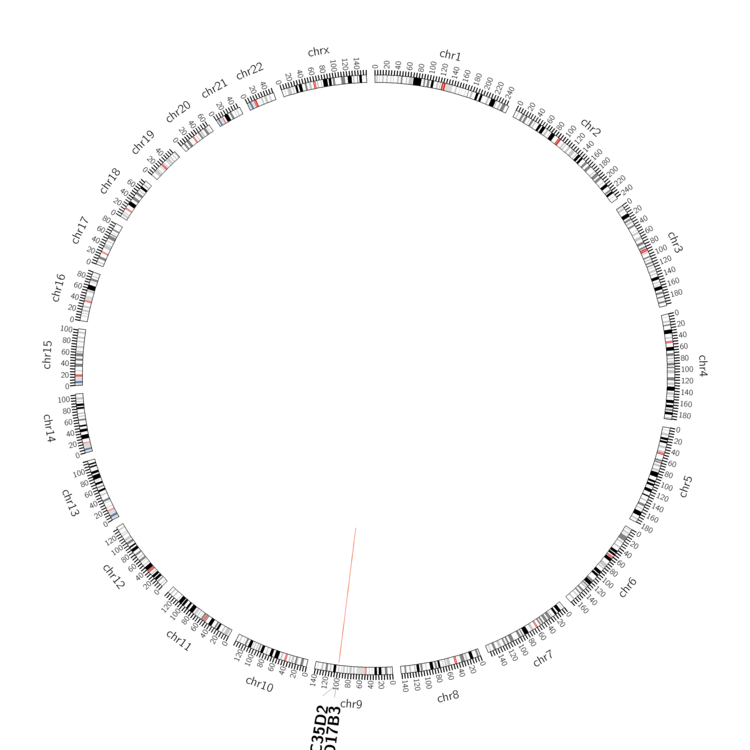 |
| - For Inter-chromosomal Variations |
| There's no inter-chromosomal structural variation. |
| - For Intra-chromosomal Variations |
| * Intra-chromosomal variantions includes 'intrachromosomal amplicon to amplicon', 'intrachromosomal amplicon to non-amplified dna', 'intrachromosomal deletion', 'intrachromosomal fold-back inversion', 'intrachromosomal inversion', 'intrachromosomal tandem duplication', 'Intrachromosomal unknown type', 'intrachromosomal with inverted orientation', 'intrachromosomal with non-inverted orientation'. |
 |
| Sample | Symbol_a | Chr_a | Start_a | End_a | Symbol_b | Chr_b | Start_b | End_b |
| ovary | HSD17B3 | chr9 | 99045702 | 99045722 | SLC35D2 | chr9 | 99100996 | 99101016 |
| ovary | HSD17B3 | chr9 | 99059287 | 99059307 | chr9 | 98926204 | 98926224 |
| cf) Tissue number; Tissue name (1;Breast, 2;Central_nervous_system, 3;Haematopoietic_and_lymphoid_tissue, 4;Large_intestine, 5;Liver, 6;Lung, 7;Ovary, 8;Pancreas, 9;Prostate, 10;Skin, 11;Soft_tissue, 12;Upper_aerodigestive_tract) |
| * From mRNA Sanger sequences, Chitars2.0 arranged chimeric transcripts. This table shows HSD17B3 related fusion information. |
| ID | Head Gene | Tail Gene | Accession | Gene_a | qStart_a | qEnd_a | Chromosome_a | tStart_a | tEnd_a | Gene_a | qStart_a | qEnd_a | Chromosome_a | tStart_a | tEnd_a |
| Top |
| Mutation type/ Tissue ID | brca | cns | cerv | endome | haematopo | kidn | Lintest | liver | lung | ns | ovary | pancre | prost | skin | stoma | thyro | urina | |||
| Total # sample | 1 | 1 | ||||||||||||||||||
| GAIN (# sample) | 1 | 1 | ||||||||||||||||||
| LOSS (# sample) |
| cf) Tissue ID; Tissue type (1; Breast, 2; Central_nervous_system, 3; Cervix, 4; Endometrium, 5; Haematopoietic_and_lymphoid_tissue, 6; Kidney, 7; Large_intestine, 8; Liver, 9; Lung, 10; NS, 11; Ovary, 12; Pancreas, 13; Prostate, 14; Skin, 15; Stomach, 16; Thyroid, 17; Urinary_tract) |
| Top |
|
 |
| Top |
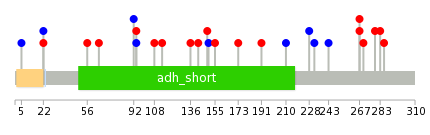
| Stat. for Non-Synonymous SNVs (# total SNVs=23) | (# total SNVs=11) |
 |  |
(# total SNVs=0) | (# total SNVs=0) |
| Top |
| * When you move the cursor on each content, you can see more deailed mutation information on the Tooltip. Those are primary_site,primary_histology,mutation(aa),pubmedID. |
| GRCh37 position | Mutation(aa) | Unique sampleID count |
| chr9:99007679-99007679 | p.S185F | 3 |
| chr9:99007682-99007682 | p.S184Y | 3 |
| chr9:99006664-99006664 | p.A207T | 2 |
| chr9:99060718-99060718 | p.G61W | 2 |
| chr9:99060732-99060732 | p.A56V | 2 |
| chr9:99064321-99064321 | p.A22A | 2 |
| chr9:98997817-98997817 | p.F286F | 2 |
| chr9:99006625-99006625 | p.E220* | 2 |
| chr9:99003048-99003048 | p.E272K | 1 |
| chr9:99060710-99060710 | p.A63A | 1 |
| Top |
|
 |
| Point Mutation/ Tissue ID | 1 | 2 | 3 | 4 | 5 | 6 | 7 | 8 | 9 | 10 | 11 | 12 | 13 | 14 | 15 | 16 | 17 | 18 | 19 | 20 |
| # sample | 1 | 1 | 1 | 1 | 1 | 5 | 1 | 1 | 8 | 1 | 6 | |||||||||
| # mutation | 1 | 1 | 1 | 1 | 1 | 5 | 1 | 1 | 8 | 1 | 6 | |||||||||
| nonsynonymous SNV | 1 | 1 | 1 | 1 | 3 | 1 | 5 | 1 | 4 | |||||||||||
| synonymous SNV | 1 | 2 | 1 | 3 | 2 |
| cf) Tissue ID; Tissue type (1; BLCA[Bladder Urothelial Carcinoma], 2; BRCA[Breast invasive carcinoma], 3; CESC[Cervical squamous cell carcinoma and endocervical adenocarcinoma], 4; COAD[Colon adenocarcinoma], 5; GBM[Glioblastoma multiforme], 6; Glioma Low Grade, 7; HNSC[Head and Neck squamous cell carcinoma], 8; KICH[Kidney Chromophobe], 9; KIRC[Kidney renal clear cell carcinoma], 10; KIRP[Kidney renal papillary cell carcinoma], 11; LAML[Acute Myeloid Leukemia], 12; LUAD[Lung adenocarcinoma], 13; LUSC[Lung squamous cell carcinoma], 14; OV[Ovarian serous cystadenocarcinoma ], 15; PAAD[Pancreatic adenocarcinoma], 16; PRAD[Prostate adenocarcinoma], 17; SKCM[Skin Cutaneous Melanoma], 18:STAD[Stomach adenocarcinoma], 19:THCA[Thyroid carcinoma], 20:UCEC[Uterine Corpus Endometrial Carcinoma]) |
| Top |
| * We represented just top 10 SNVs. When you move the cursor on each content, you can see more deailed mutation information on the Tooltip. Those are primary_site, primary_histology, mutation(aa), pubmedID. |
| Genomic Position | Mutation(aa) | Unique sampleID count |
| chr9:99064321 | p.A270T | 1 |
| chr9:99003054 | p.R94R | 1 |
| chr9:99013708 | p.G267D | 1 |
| chr9:99064323 | p.R94Q | 1 |
| chr9:99003062 | p.G267S | 1 |
| chr9:99013729 | p.I92I | 1 |
| chr9:99064372 | p.V243V | 1 |
| chr9:99003063 | p.S65L | 1 |
| chr9:99013747 | p.S232S | 1 |
| chr9:99003133 | p.A56V | 1 |
| * Copy number data were extracted from TCGA using R package TCGA-Assembler. The URLs of all public data files on TCGA DCC data server were gathered on Jan-05-2015. Function ProcessCNAData in TCGA-Assembler package was used to obtain gene-level copy number value which is calculated as the average copy number of the genomic region of a gene. |
 |
| cf) Tissue ID[Tissue type]: BLCA[Bladder Urothelial Carcinoma], BRCA[Breast invasive carcinoma], CESC[Cervical squamous cell carcinoma and endocervical adenocarcinoma], COAD[Colon adenocarcinoma], GBM[Glioblastoma multiforme], Glioma Low Grade, HNSC[Head and Neck squamous cell carcinoma], KICH[Kidney Chromophobe], KIRC[Kidney renal clear cell carcinoma], KIRP[Kidney renal papillary cell carcinoma], LAML[Acute Myeloid Leukemia], LUAD[Lung adenocarcinoma], LUSC[Lung squamous cell carcinoma], OV[Ovarian serous cystadenocarcinoma ], PAAD[Pancreatic adenocarcinoma], PRAD[Prostate adenocarcinoma], SKCM[Skin Cutaneous Melanoma], STAD[Stomach adenocarcinoma], THCA[Thyroid carcinoma], UCEC[Uterine Corpus Endometrial Carcinoma] |
| Top |
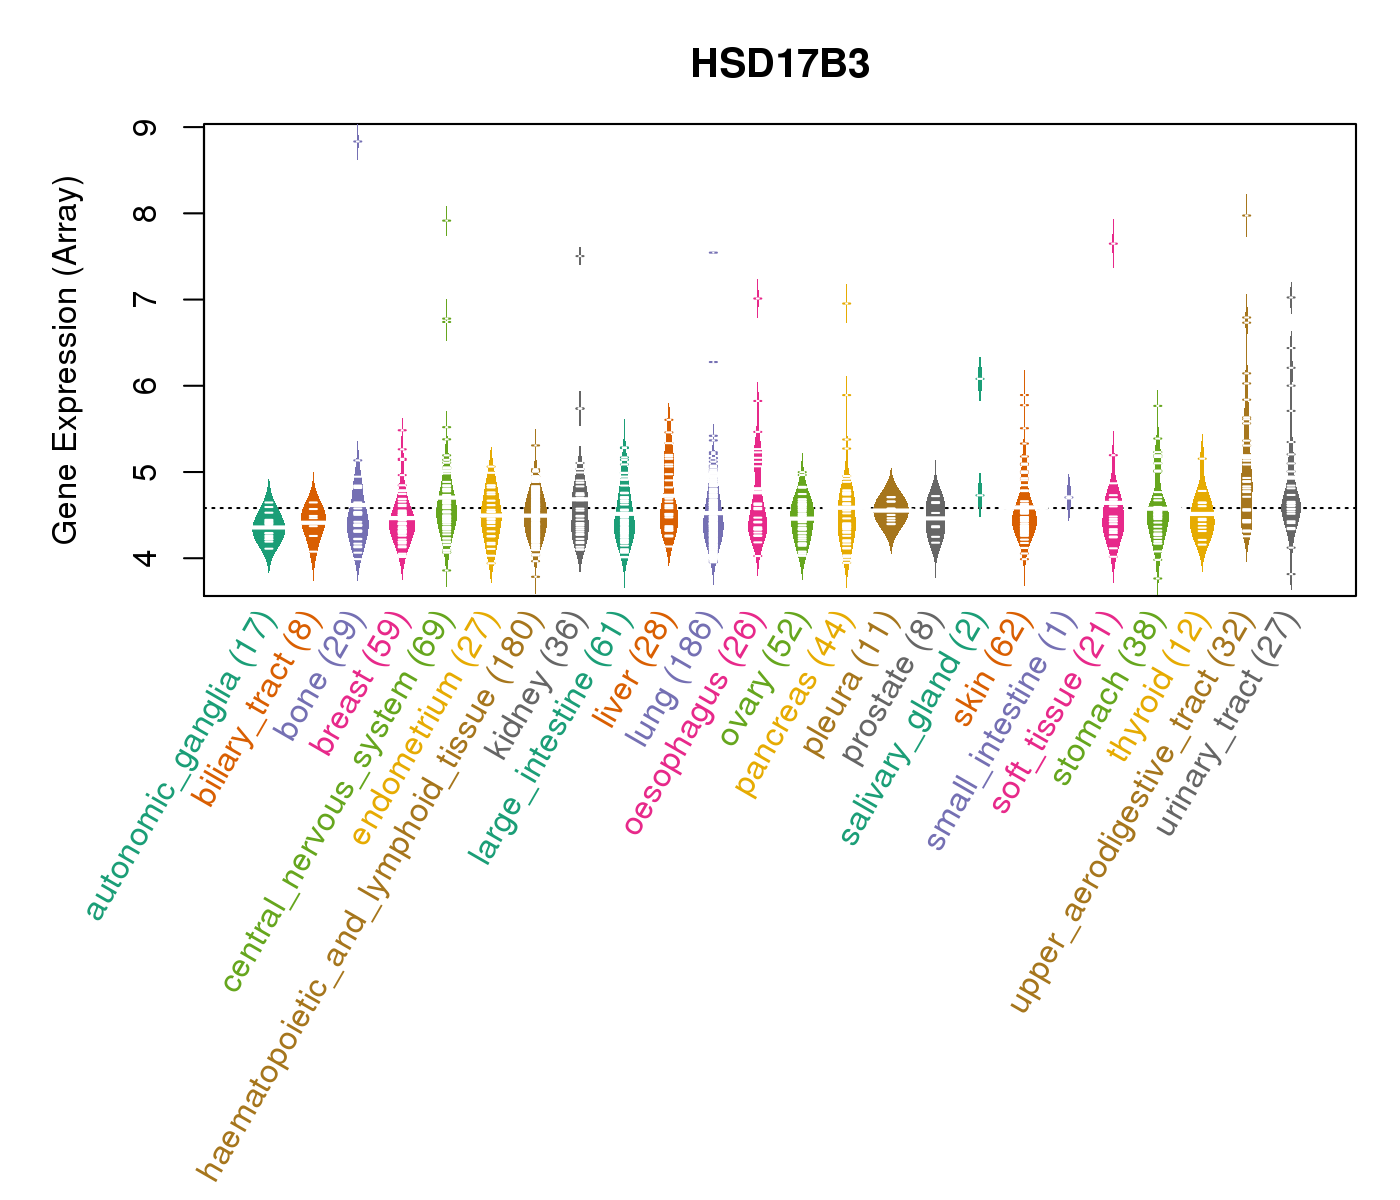
| Gene Expression for HSD17B3 |
| * CCLE gene expression data were extracted from CCLE_Expression_Entrez_2012-10-18.res: Gene-centric RMA-normalized mRNA expression data. |
 |
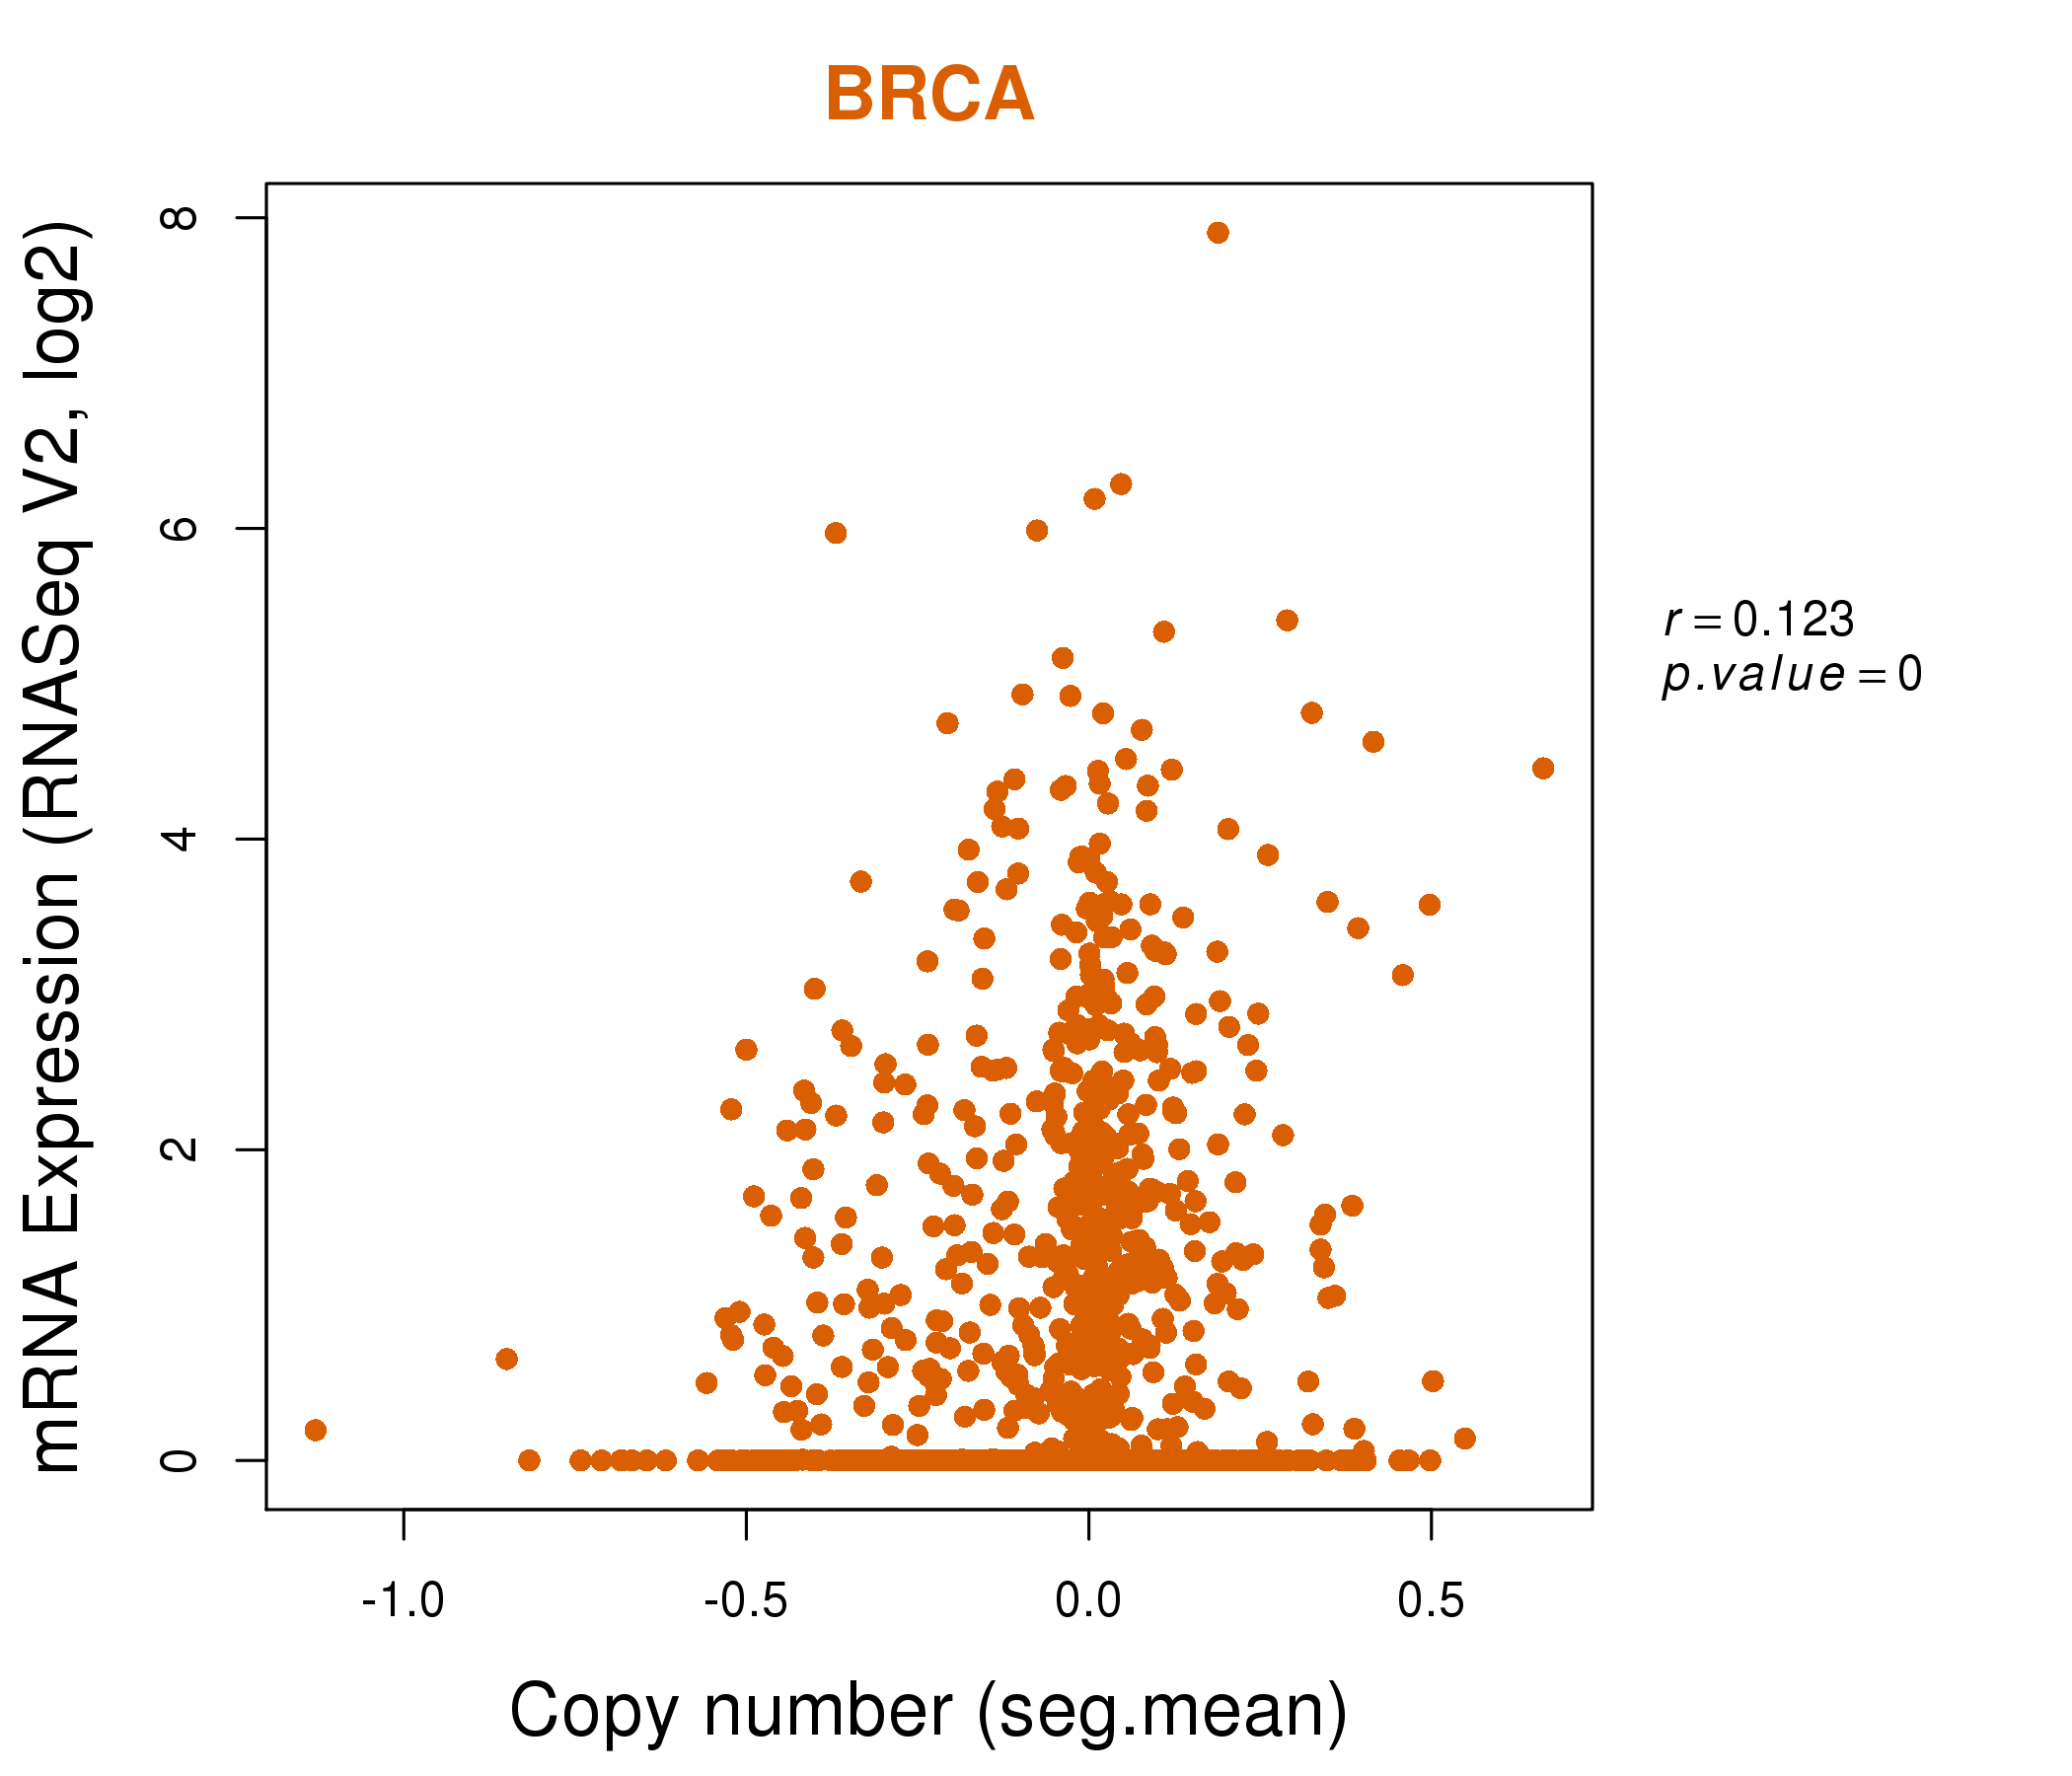
| * Normalized gene expression data of RNASeqV2 was extracted from TCGA using R package TCGA-Assembler. The URLs of all public data files on TCGA DCC data server were gathered at Jan-05-2015. Only eight cancer types have enough normal control samples for differential expression analysis. (t test, adjusted p<0.05 (using Benjamini-Hochberg FDR)) |
 |
| Top |
| * This plots show the correlation between CNV and gene expression. |
: Open all plots for all cancer types
 |
|
 |
|

| Top |
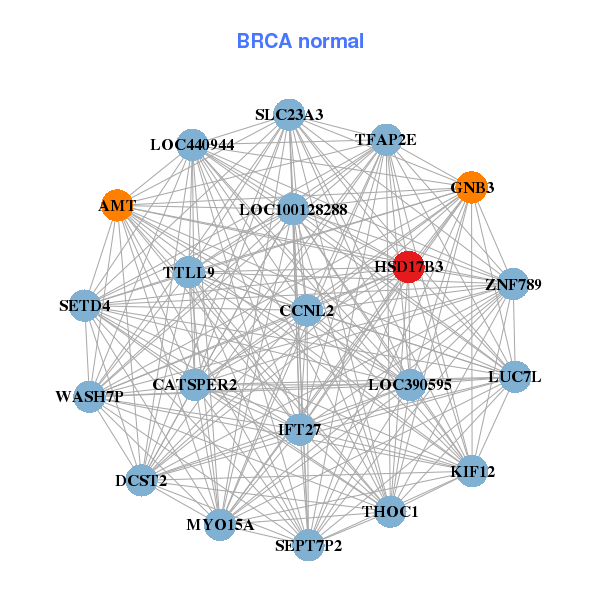
| Gene-Gene Network Information |
| * Co-Expression network figures were drawn using R package igraph. Only the top 20 genes with the highest correlations were shown. Red circle: input gene, orange circle: cell metabolism gene, sky circle: other gene |
: Open all plots for all cancer types
 |
| ||||
| BNC1,C11orf87,CDH4,COL17A1,FGFBP1,HAS3,HMGA2, HSD17B3,KRT5,KRT75,LOC150527,MT4,MYO7B,OR2J3, PADI3,PCSK9,PLEK2,RPSAP52,S100A2,SOX15,TNFSF9 | AMT,CATSPER2,CCNL2,DCST2,GNB3,HSD17B3,IFT27, KIF12,LOC100128288,LOC390595,LOC440944,LUC7L,MYO15A,SEPT7P2, SETD4,SLC23A3,TFAP2E,THOC1,TTLL9,WASH7P,ZNF789 | ||||
 |
| ||||
| AGBL2,C12orf42,MROH7,MLLT4-AS1,CCNL2,CROCCP3,DNHD1, HGFAC,HSD17B3,KLHL31,LOC100270804,NPHP3,NTN5,PAK7, SOHLH1,TCHH,TCTE3,TEX19,THSD1P1,ZNF735,ZNF83 | TMEM74B,CCDC108,CREB3L3,CYP2C9,CYP4F2,CYP4F3,DGAT1, DNASE1,FAM151A,FGF19,HAPLN4,HSD17B3,MLXIPL,MUC17, PLB1,SI,SLC5A2,SULT1E1,UGT1A3,UGT1A4,UGT1A5 |
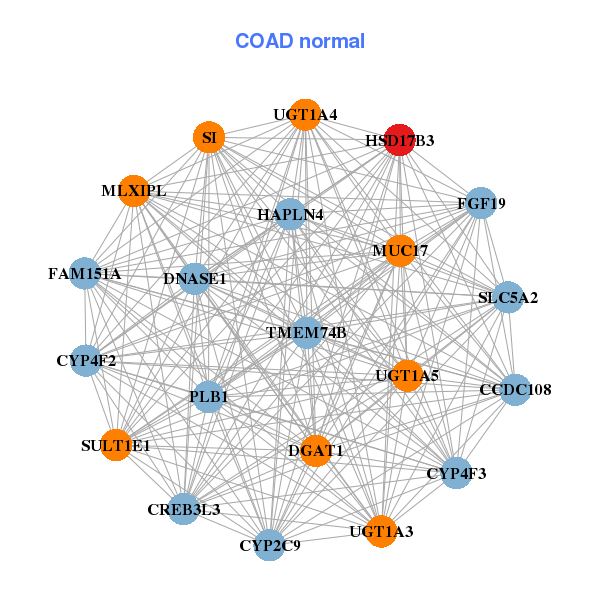
| * Co-Expression network figures were drawn using R package igraph. Only the top 20 genes with the highest correlations were shown. Red circle: input gene, orange circle: cell metabolism gene, sky circle: other gene |
: Open all plots for all cancer types
| Top |
: Open all interacting genes' information including KEGG pathway for all interacting genes from DAVID
| Top |
| Pharmacological Information for HSD17B3 |
| DB Category | DB Name | DB's ID and Url link |
| * Gene Centered Interaction Network. |
 |
| * Drug Centered Interaction Network. |
| DrugBank ID | Target Name | Drug Groups | Generic Name | Drug Centered Network | Drug Structure |
| DB00157 | hydroxysteroid (17-beta) dehydrogenase 3 | approved; nutraceutical | NADH |  |  |
| DB00396 | hydroxysteroid (17-beta) dehydrogenase 3 | approved | Progesterone | 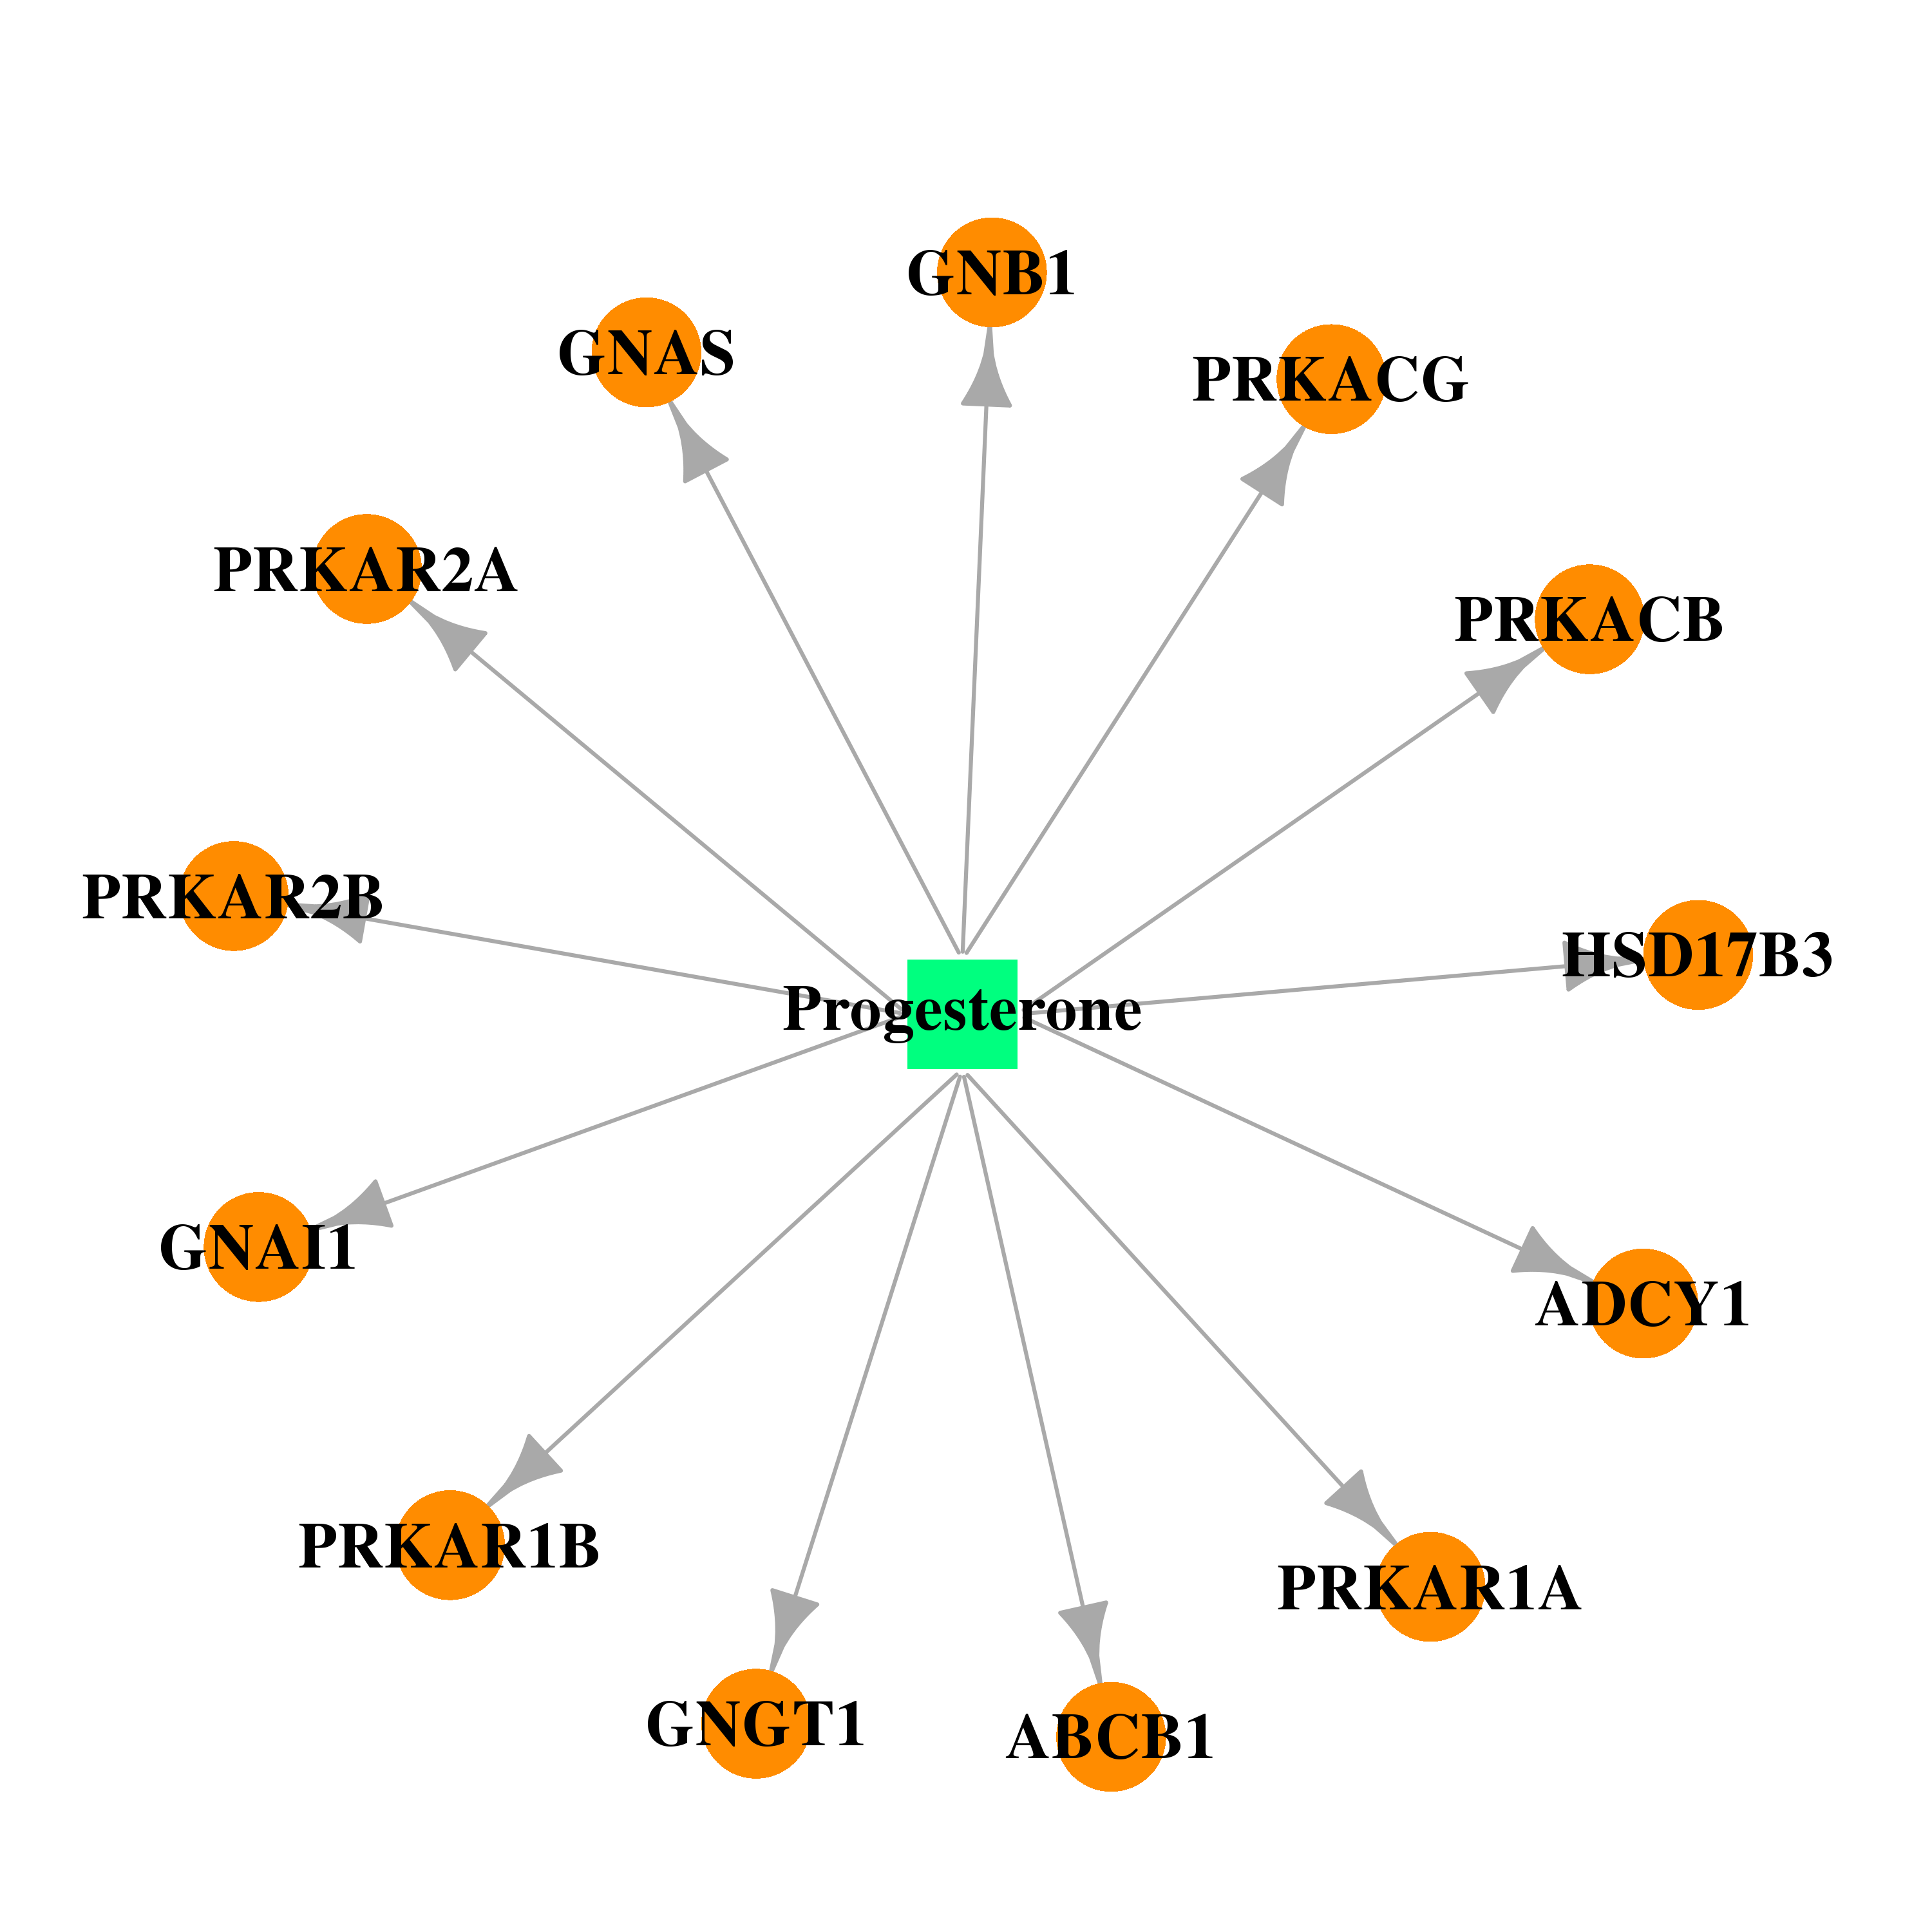 | 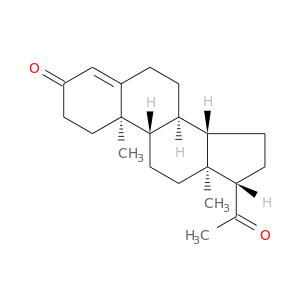 |
| DB00624 | hydroxysteroid (17-beta) dehydrogenase 3 | approved; investigational | Testosterone | 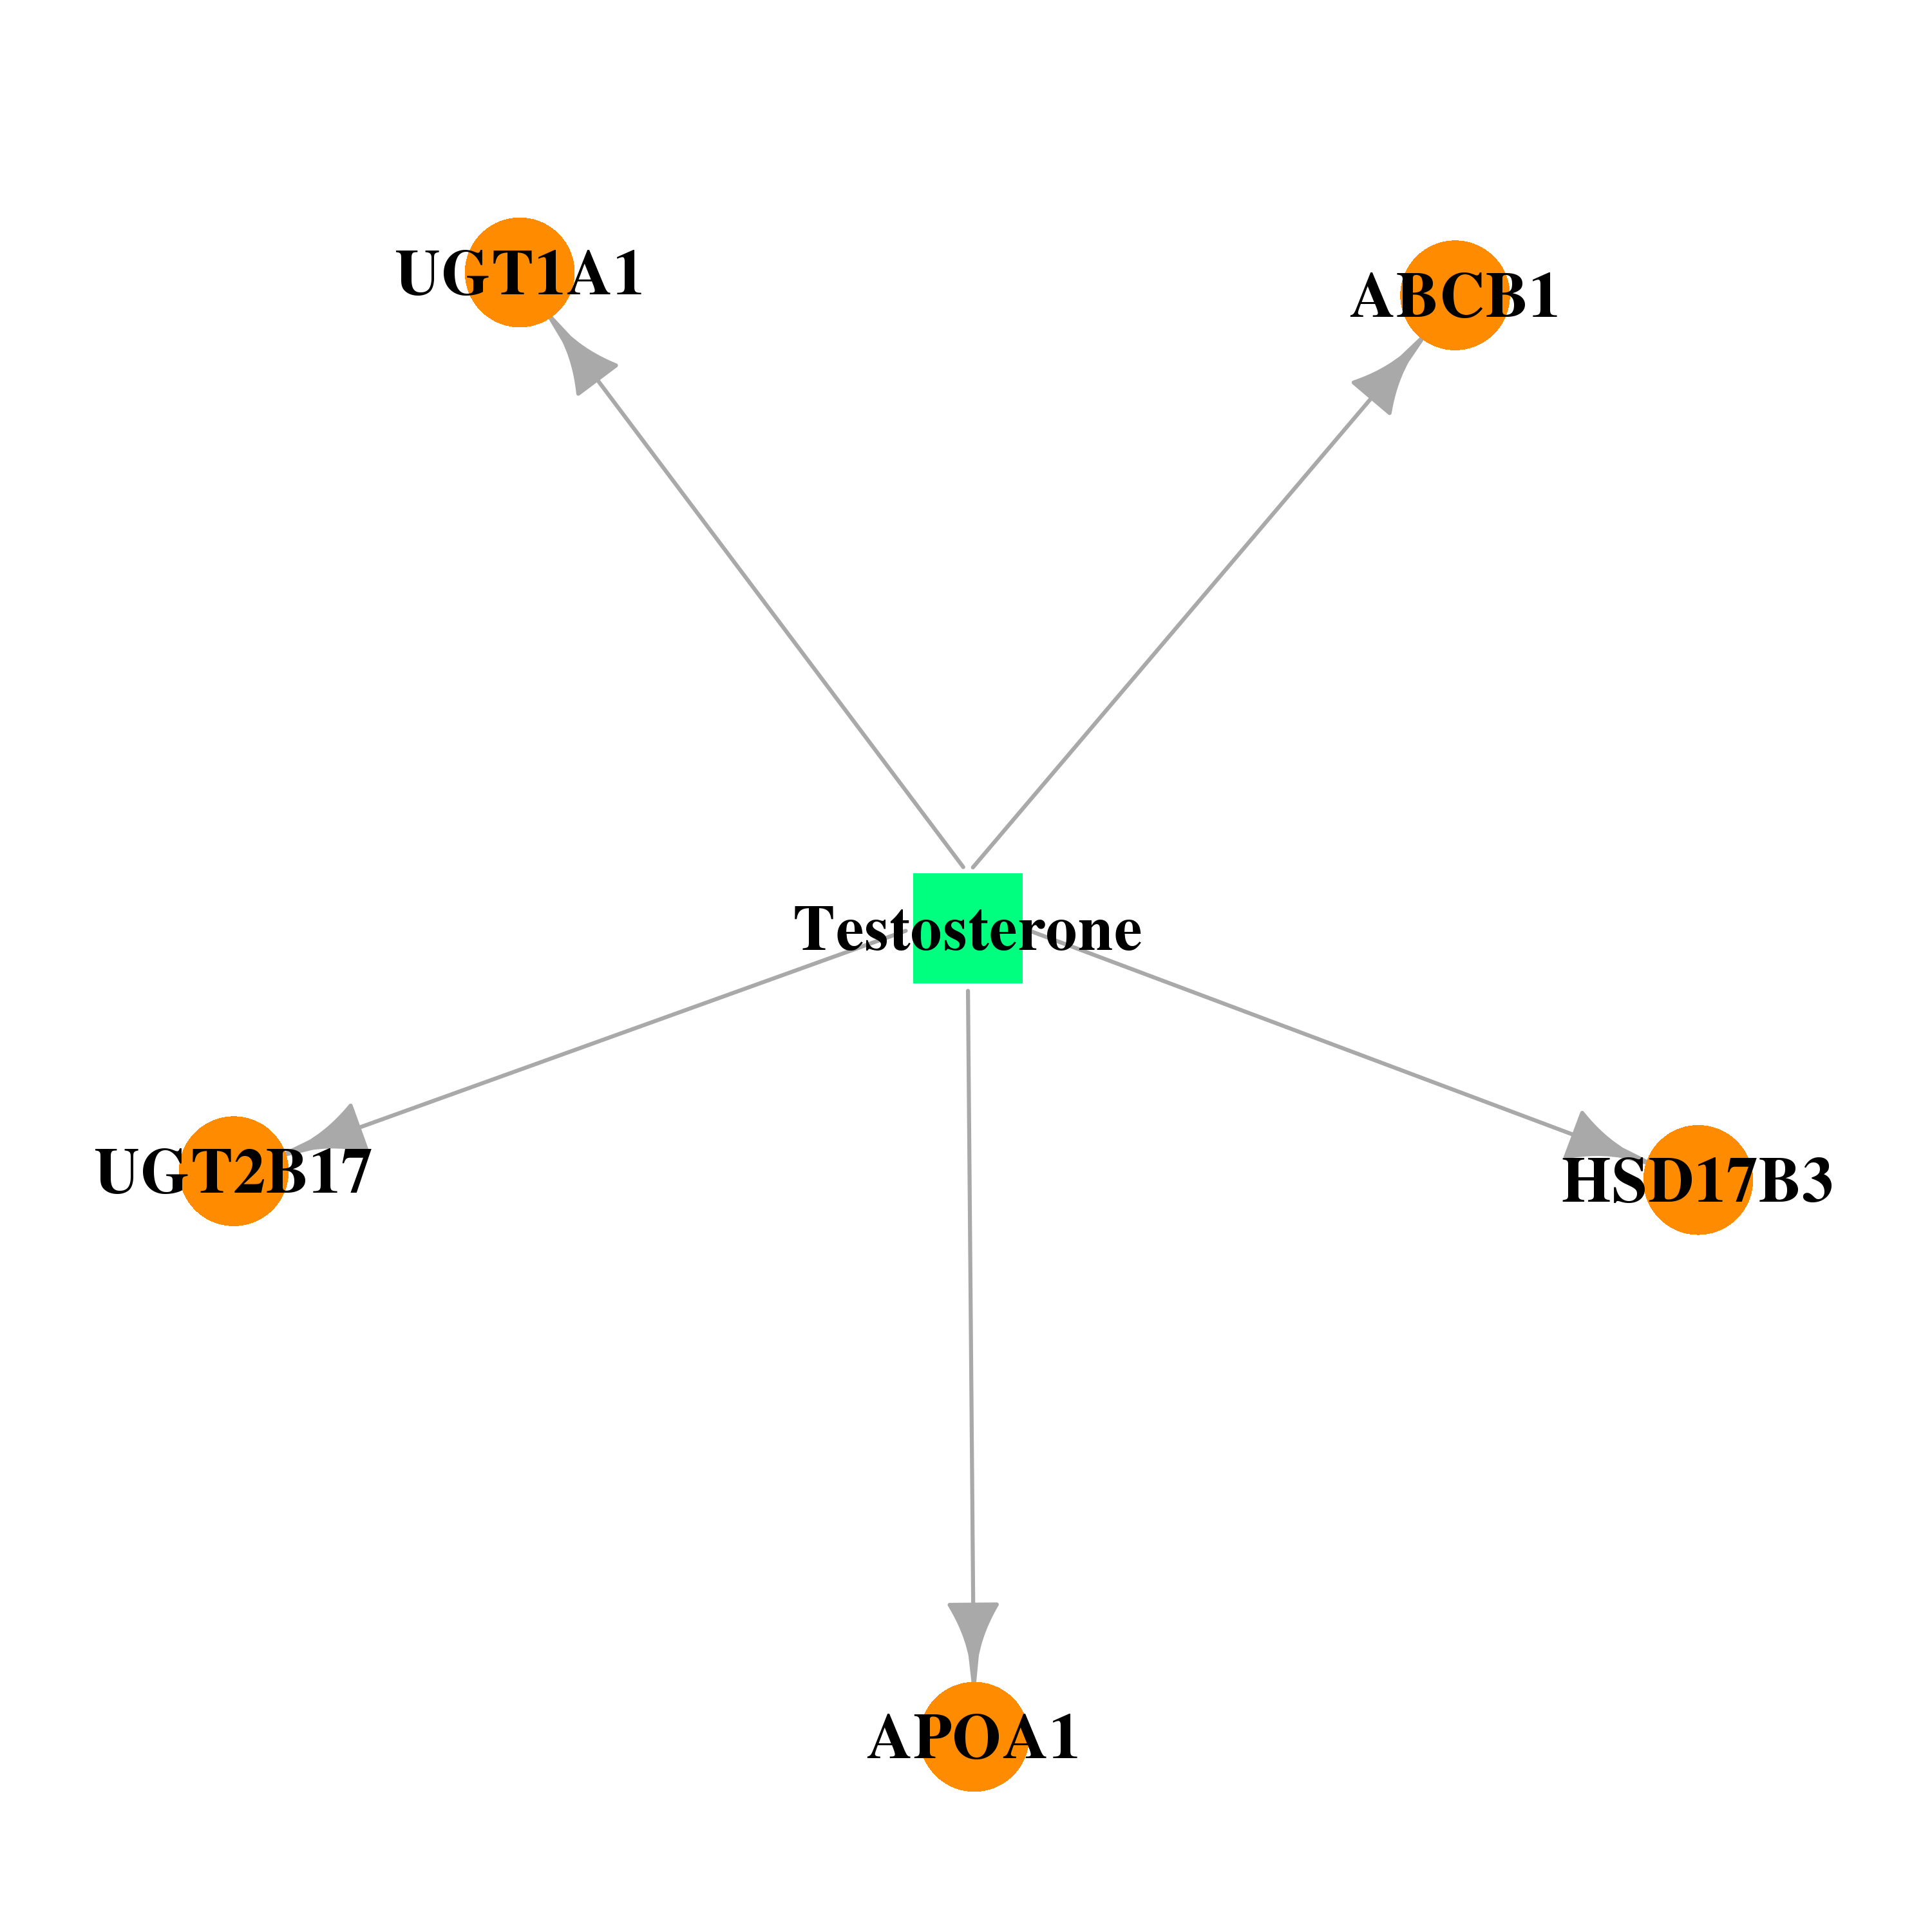 | 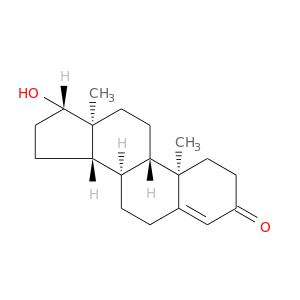 |
| Top |
| Cross referenced IDs for HSD17B3 |
| * We obtained these cross-references from Uniprot database. It covers 150 different DBs, 18 categories. http://www.uniprot.org/help/cross_references_section |
: Open all cross reference information
|
Copyright © 2016-Present - The Univsersity of Texas Health Science Center at Houston @ |