|
||||||||||||||||||||
| |
| Phenotypic Information (metabolism pathway, cancer, disease, phenome) |
| |
| |
| Gene-Gene Network Information: Co-Expression Network, Interacting Genes & KEGG |
| |
|


| Gene Summary for HSPA8 |
| Basic gene info. | Gene symbol | HSPA8 |
| Gene name | heat shock 70kDa protein 8 | |
| Synonyms | HEL-33|HEL-S-72p|HSC54|HSC70|HSC71|HSP71|HSP73|HSPA10|LAP-1|LAP1|NIP71 | |
| Cytomap | UCSC genome browser: 11q24.1 | |
| Genomic location | chr11 :122928199-122932901 | |
| Type of gene | protein-coding | |
| RefGenes | NM_006597.5, NM_153201.3, | |
| Ensembl id | ENSG00000109971 | |
| Description | LPS-associated protein 1N-myristoyltransferase inhibitor protein 71constitutive heat shock protein 70epididymis luminal protein 33epididymis secretory sperm binding protein Li 72pheat shock 70kd protein 10heat shock cognate 71 kDa proteinheat shock | |
| Modification date | 20141207 | |
| dbXrefs | MIM : 600816 | |
| HGNC : HGNC | ||
| Ensembl : ENSG00000109971 | ||
| HPRD : 07205 | ||
| Vega : OTTHUMG00000166030 | ||
| Protein | UniProt: P11142 go to UniProt's Cross Reference DB Table | |
| Expression | CleanEX: HS_HSPA8 | |
| BioGPS: 3312 | ||
| Gene Expression Atlas: ENSG00000109971 | ||
| The Human Protein Atlas: ENSG00000109971 | ||
| Pathway | NCI Pathway Interaction Database: HSPA8 | |
| KEGG: HSPA8 | ||
| REACTOME: HSPA8 | ||
| ConsensusPathDB | ||
| Pathway Commons: HSPA8 | ||
| Metabolism | MetaCyc: HSPA8 | |
| HUMANCyc: HSPA8 | ||
| Regulation | Ensembl's Regulation: ENSG00000109971 | |
| miRBase: chr11 :122,928,199-122,932,901 | ||
| TargetScan: NM_006597 | ||
| cisRED: ENSG00000109971 | ||
| Context | iHOP: HSPA8 | |
| cancer metabolism search in PubMed: HSPA8 | ||
| UCL Cancer Institute: HSPA8 | ||
| Assigned class in ccmGDB | B - This gene belongs to cancer gene. | |
| Top |
| Phenotypic Information for HSPA8(metabolism pathway, cancer, disease, phenome) |
| Cancer | CGAP: HSPA8 |
| Familial Cancer Database: HSPA8 | |
| * This gene is included in those cancer gene databases. |
|
|
|
|
|
| . | ||||||||||||||
Oncogene 1 | Significant driver gene in | |||||||||||||||||||
| cf) number; DB name 1 Oncogene; http://nar.oxfordjournals.org/content/35/suppl_1/D721.long, 2 Tumor Suppressor gene; https://bioinfo.uth.edu/TSGene/, 3 Cancer Gene Census; http://www.nature.com/nrc/journal/v4/n3/abs/nrc1299.html, 4 CancerGenes; http://nar.oxfordjournals.org/content/35/suppl_1/D721.long, 5 Network of Cancer Gene; http://ncg.kcl.ac.uk/index.php, 1Therapeutic Vulnerabilities in Cancer; http://cbio.mskcc.org/cancergenomics/statius/ |
| REACTOME_METABOLISM_OF_MRNA REACTOME_METABOLISM_OF_RNA | |
| OMIM | 600816; gene. |
| Orphanet | |
| Disease | KEGG Disease: HSPA8 |
| MedGen: HSPA8 (Human Medical Genetics with Condition) | |
| ClinVar: HSPA8 | |
| Phenotype | MGI: HSPA8 (International Mouse Phenotyping Consortium) |
| PhenomicDB: HSPA8 | |
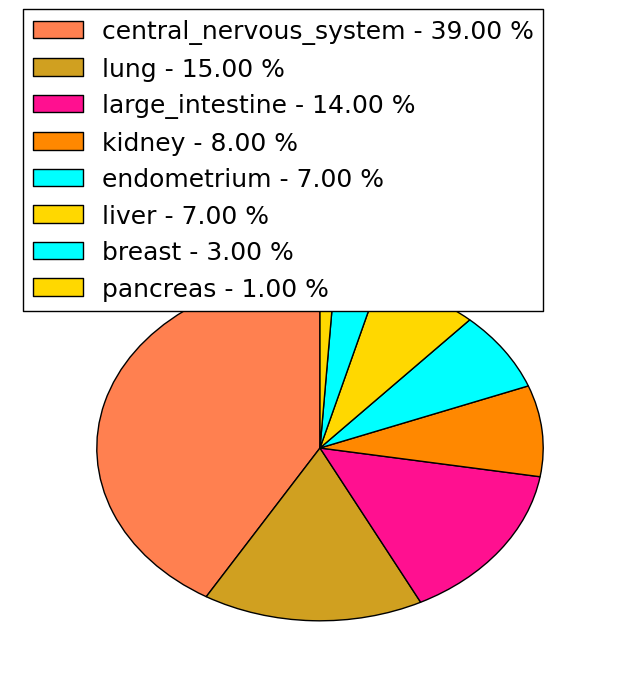
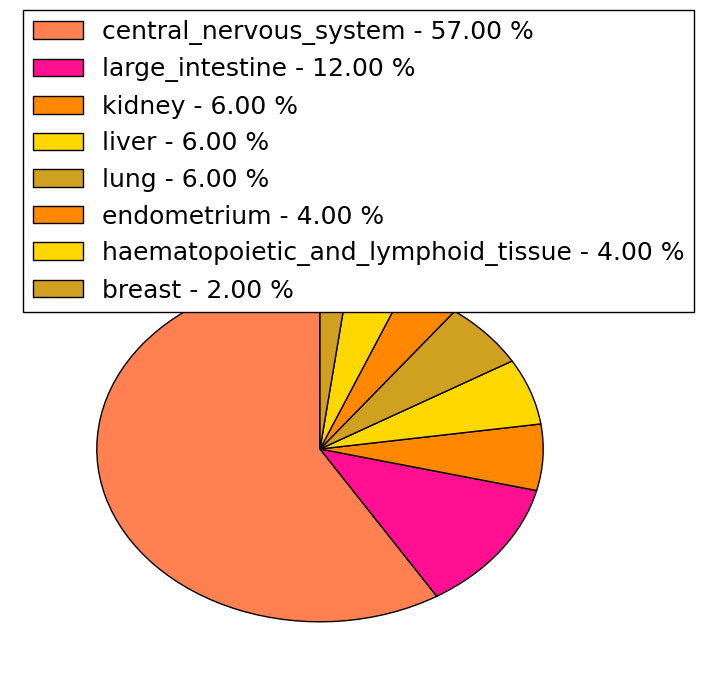
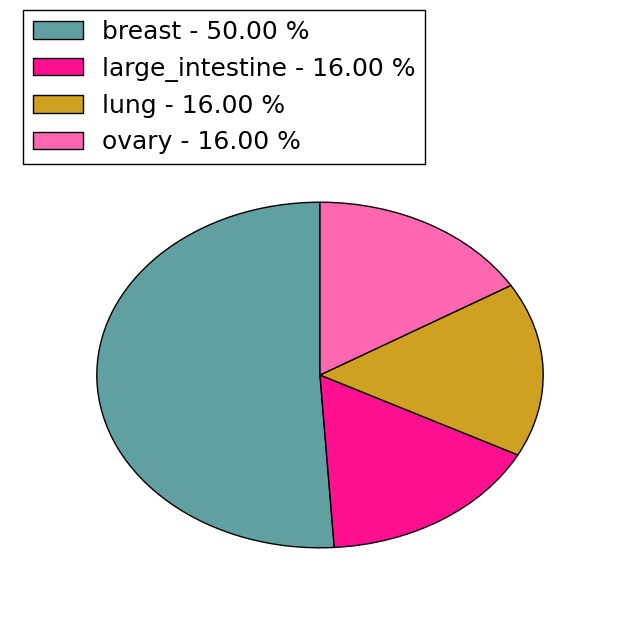
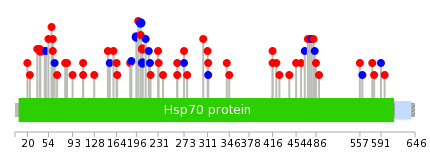
| Mutations for HSPA8 |
| * Under tables are showing count per each tissue to give us broad intuition about tissue specific mutation patterns.You can go to the detailed page for each mutation database's web site. |
| There's no structural variation information in COSMIC data for this gene. |
| * From mRNA Sanger sequences, Chitars2.0 arranged chimeric transcripts. This table shows HSPA8 related fusion information. |
| ID | Head Gene | Tail Gene | Accession | Gene_a | qStart_a | qEnd_a | Chromosome_a | tStart_a | tEnd_a | Gene_a | qStart_a | qEnd_a | Chromosome_a | tStart_a | tEnd_a |
| BQ362492 | HSPA8 | 4 | 267 | 11 | 122930679 | 122931356 | STX3 | 263 | 600 | 11 | 59569219 | 59569557 | |
| CN338266 | CCDC47 | 1 | 243 | 17 | 61843410 | 61850869 | HSPA8 | 242 | 574 | 11 | 122928549 | 122929360 | |
| DA668305 | HSPA8 | 2 | 89 | 11 | 122930043 | 122930129 | ALDH1A1 | 90 | 558 | 9 | 75531952 | 75542085 | |
| DA378775 | RNU12 | 1 | 150 | 22 | 43011250 | 43011399 | HSPA8 | 151 | 627 | 11 | 122931313 | 122932844 | |
| BP357681 | UTP18 | 6 | 402 | 17 | 49337943 | 49340686 | HSPA8 | 401 | 582 | 11 | 122930290 | 122930472 | |
| DB195849 | HSPA8 | 1 | 88 | 11 | 122930042 | 122930127 | HSPD1 | 89 | 555 | 2 | 198361911 | 198364590 | |
| BE812526 | HSPA8 | 1 | 78 | 11 | 122929387 | 122929465 | HSPA8 | 76 | 335 | 11 | 122928553 | 122929140 | |
| BC112920 | HIST1H1D | 1 | 177 | 6 | 26235016 | 26235192 | HSPA8 | 176 | 1249 | 11 | 122928205 | 122930196 | |
| CV345070 | NCL | 1 | 230 | 2 | 232320299 | 232321412 | HSPA8 | 214 | 474 | 11 | 122929415 | 122929903 | |
| AA063643 | MAP4 | 1 | 188 | 3 | 47912302 | 47912490 | HSPA8 | 186 | 425 | 11 | 122930412 | 122930651 | |
| BF885577 | HSPA8 | 78 | 339 | 11 | 122928553 | 122929149 | HSPA8 | 337 | 524 | 11 | 122930401 | 122930588 | |
| BF154448 | RND3 | 8 | 83 | 2 | 151335355 | 151335433 | HSPA8 | 80 | 136 | 11 | 122928500 | 122928556 | |
| BE771086 | HSPA8 | 41 | 305 | 11 | 122929030 | 122929439 | INADL | 302 | 546 | 1 | 62390453 | 62391045 | |
| BF082086 | HSPA8 | 1 | 67 | 11 | 122929399 | 122929465 | HSPA8 | 65 | 420 | 11 | 122928553 | 122929385 | |
| BF082156 | HSPA8 | 13 | 98 | 11 | 122929378 | 122929465 | HSPA8 | 96 | 371 | 11 | 122928553 | 122929160 | |
| CV322984 | C16orf72 | 9 | 206 | 16 | 9207939 | 9208138 | HSPA8 | 201 | 359 | 11 | 122929390 | 122929776 | |
| BQ338693 | HSPA8 | 30 | 388 | 11 | 122928960 | 122929465 | SLC7A6 | 385 | 514 | 16 | 68334246 | 68334375 | |
| Top |
| There's no copy number variation information in COSMIC data for this gene. |
| Top |
|
 |
| Top |
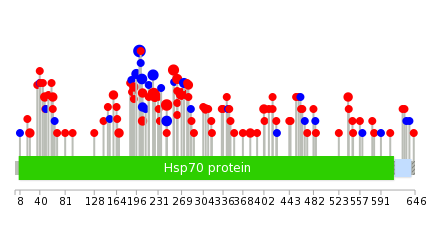
| Stat. for Non-Synonymous SNVs (# total SNVs=107) | (# total SNVs=47) |
 |  |
(# total SNVs=6) | (# total SNVs=0) |
 |
| Top |
| * When you move the cursor on each content, you can see more deailed mutation information on the Tooltip. Those are primary_site,primary_histology,mutation(aa),pubmedID. |
| GRCh37 position | Mutation(aa) | Unique sampleID count |
| chr11:122930698-122930698 | p.G201G | 10 |
| chr11:122930631-122930631 | p.G224R | 9 |
| chr11:122930495-122930495 | p.R269H | 7 |
| chr11:122930568-122930568 | p.F245L | 7 |
| chr11:122930632-122930632 | p.A223A | 5 |
| chr11:122930534-122930534 | p.N256S | 5 |
| chr11:122930686-122930686 | p.F205F | 4 |
| chr11:122930517-122930517 | p.R262C | 4 |
| chr11:122930566-122930566 | p.F245F | 4 |
| chr11:122930482-122930482 | p.T273T | 3 |
| Top |
|
 |
| Point Mutation/ Tissue ID | 1 | 2 | 3 | 4 | 5 | 6 | 7 | 8 | 9 | 10 | 11 | 12 | 13 | 14 | 15 | 16 | 17 | 18 | 19 | 20 |
| # sample | 5 | 1 | 17 | 1 | 5 | 9 | 1 | 8 | 3 | 1 | 6 | 6 | 1 | 7 | ||||||
| # mutation | 5 | 1 | 14 | 1 | 5 | 9 | 1 | 8 | 3 | 1 | 7 | 6 | 1 | 9 | ||||||
| nonsynonymous SNV | 3 | 1 | 10 | 1 | 3 | 6 | 1 | 7 | 2 | 1 | 5 | 5 | 1 | 7 | ||||||
| synonymous SNV | 2 | 4 | 2 | 3 | 1 | 1 | 2 | 1 | 2 |
| cf) Tissue ID; Tissue type (1; BLCA[Bladder Urothelial Carcinoma], 2; BRCA[Breast invasive carcinoma], 3; CESC[Cervical squamous cell carcinoma and endocervical adenocarcinoma], 4; COAD[Colon adenocarcinoma], 5; GBM[Glioblastoma multiforme], 6; Glioma Low Grade, 7; HNSC[Head and Neck squamous cell carcinoma], 8; KICH[Kidney Chromophobe], 9; KIRC[Kidney renal clear cell carcinoma], 10; KIRP[Kidney renal papillary cell carcinoma], 11; LAML[Acute Myeloid Leukemia], 12; LUAD[Lung adenocarcinoma], 13; LUSC[Lung squamous cell carcinoma], 14; OV[Ovarian serous cystadenocarcinoma ], 15; PAAD[Pancreatic adenocarcinoma], 16; PRAD[Prostate adenocarcinoma], 17; SKCM[Skin Cutaneous Melanoma], 18:STAD[Stomach adenocarcinoma], 19:THCA[Thyroid carcinoma], 20:UCEC[Uterine Corpus Endometrial Carcinoma]) |
| Top |
| * We represented just top 10 SNVs. When you move the cursor on each content, you can see more deailed mutation information on the Tooltip. Those are primary_site, primary_histology, mutation(aa), pubmedID. |
| Genomic Position | Mutation(aa) | Unique sampleID count |
| chr11:122930713 | p.D206D,HSPA8 | 2 |
| chr11:122930683 | p.D206Y,HSPA8 | 2 |
| chr11:122930685 | p.G203G,HSPA8 | 2 |
| chr11:122930692 | p.L196L,HSPA8 | 2 |
| chr11:122931384 | p.Y41H,HSPA8 | 2 |
| chr11:122931912 | p.E110Q,HSPA8 | 2 |
| chr11:122929417 | p.Q84E,HSPA8 | 1 |
| chr11:122931462 | p.W580C | 1 |
| chr11:122930365 | p.G312G,HSPA8 | 1 |
| chr11:122931915 | p.A81G,HSPA8 | 1 |
| * Copy number data were extracted from TCGA using R package TCGA-Assembler. The URLs of all public data files on TCGA DCC data server were gathered on Jan-05-2015. Function ProcessCNAData in TCGA-Assembler package was used to obtain gene-level copy number value which is calculated as the average copy number of the genomic region of a gene. |
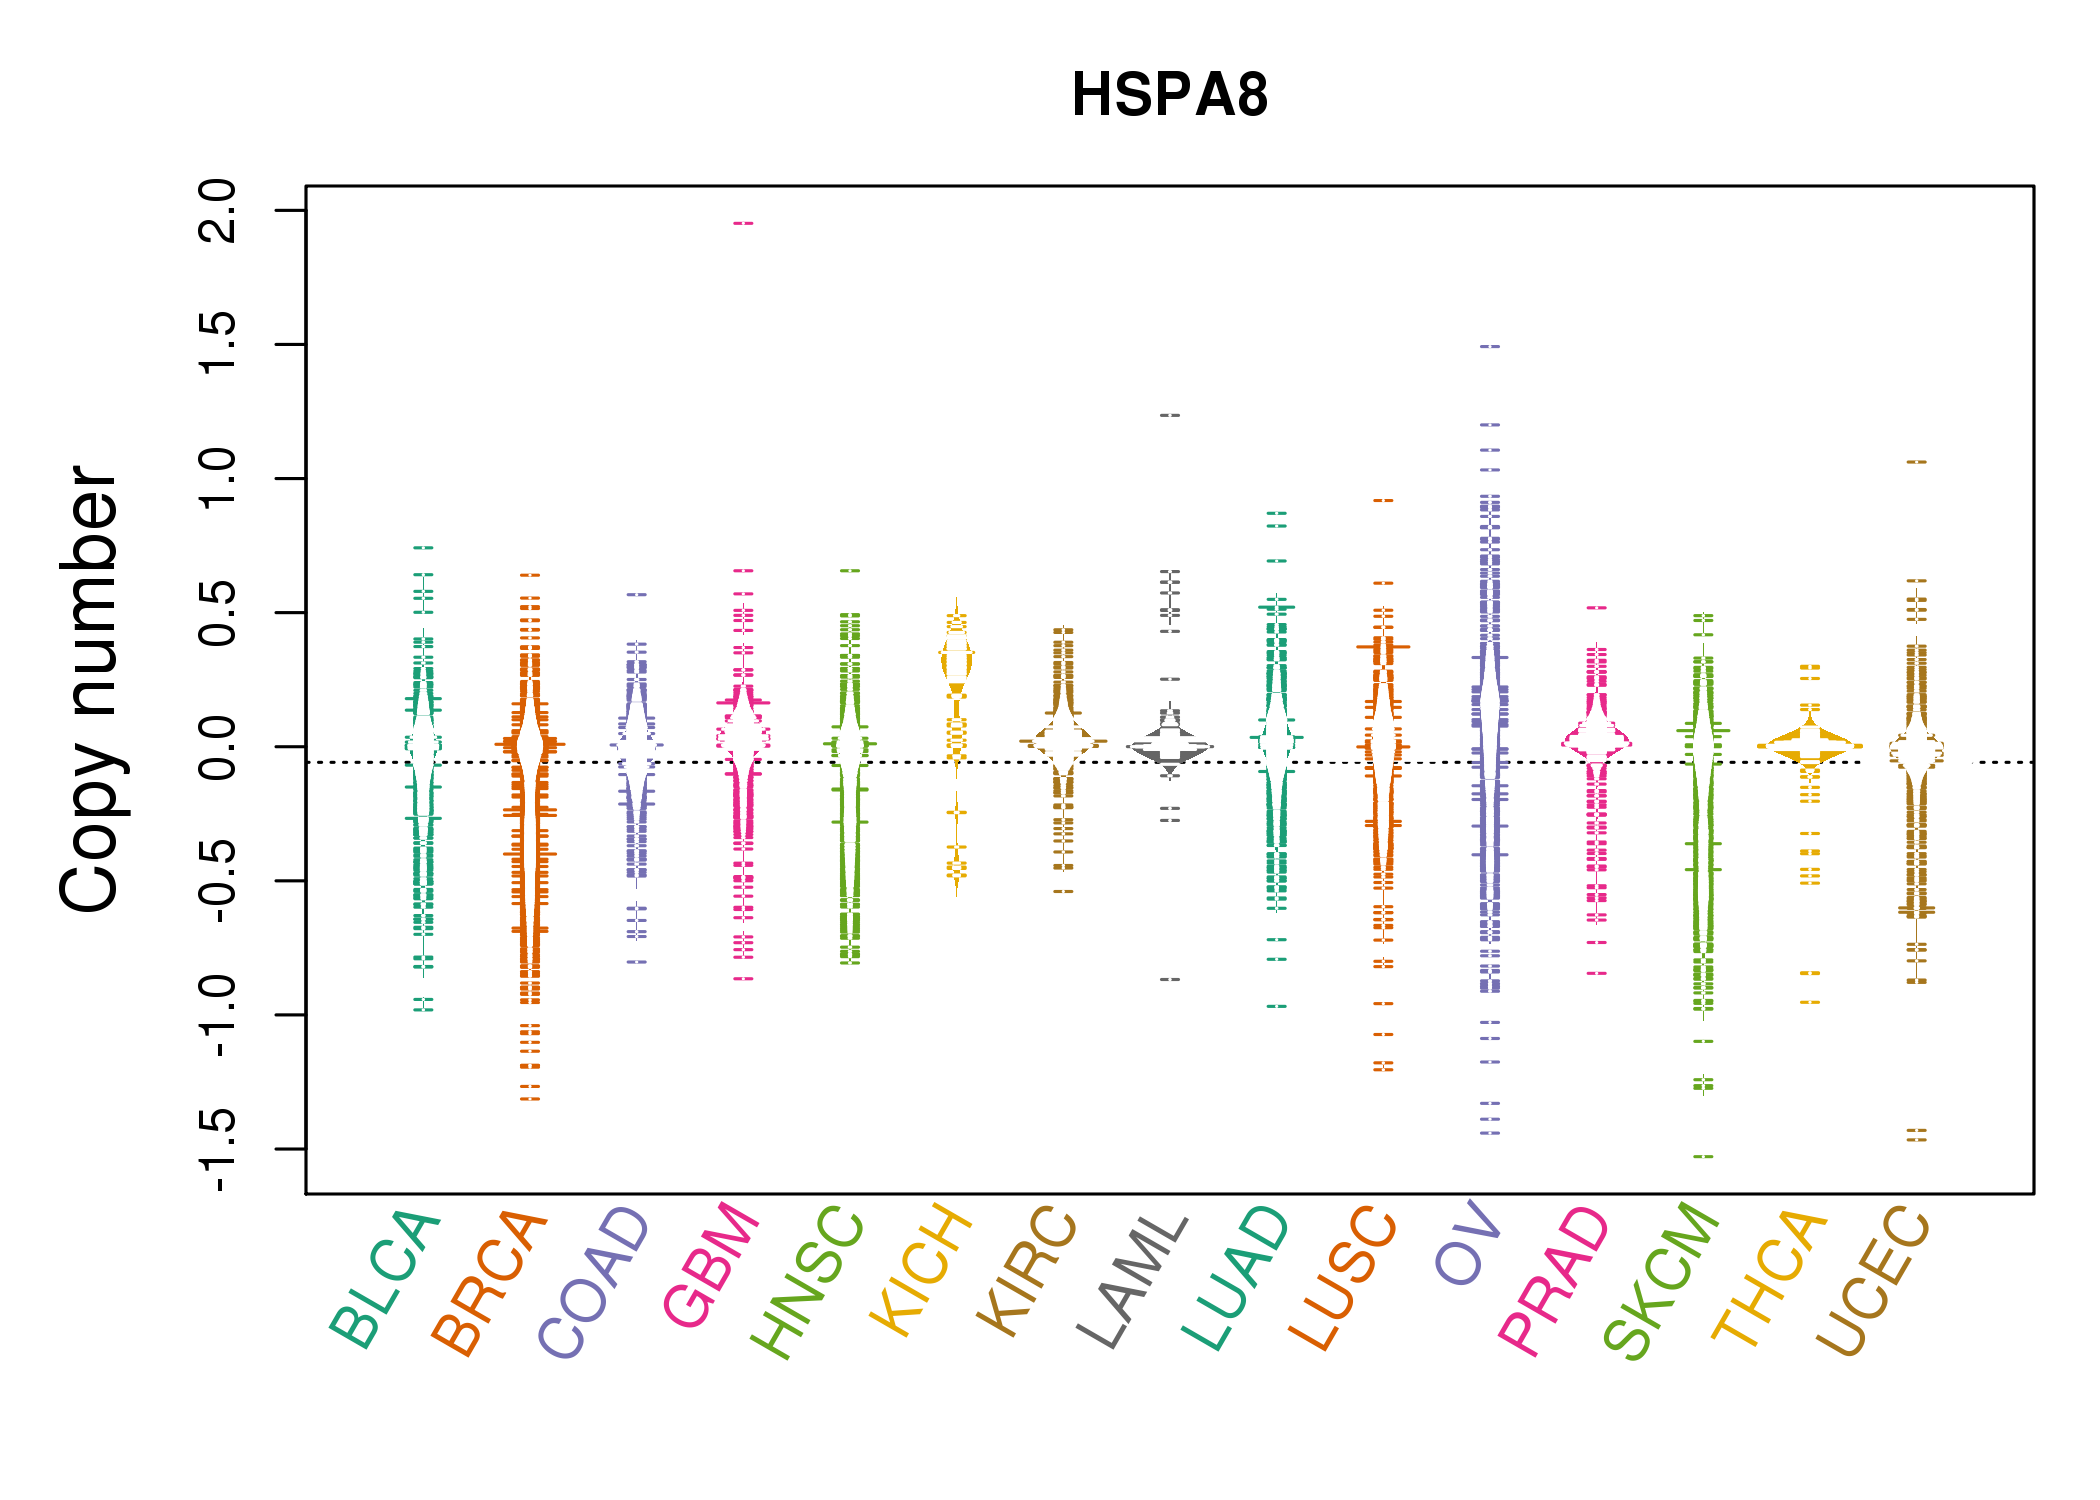 |
| cf) Tissue ID[Tissue type]: BLCA[Bladder Urothelial Carcinoma], BRCA[Breast invasive carcinoma], CESC[Cervical squamous cell carcinoma and endocervical adenocarcinoma], COAD[Colon adenocarcinoma], GBM[Glioblastoma multiforme], Glioma Low Grade, HNSC[Head and Neck squamous cell carcinoma], KICH[Kidney Chromophobe], KIRC[Kidney renal clear cell carcinoma], KIRP[Kidney renal papillary cell carcinoma], LAML[Acute Myeloid Leukemia], LUAD[Lung adenocarcinoma], LUSC[Lung squamous cell carcinoma], OV[Ovarian serous cystadenocarcinoma ], PAAD[Pancreatic adenocarcinoma], PRAD[Prostate adenocarcinoma], SKCM[Skin Cutaneous Melanoma], STAD[Stomach adenocarcinoma], THCA[Thyroid carcinoma], UCEC[Uterine Corpus Endometrial Carcinoma] |
| Top |
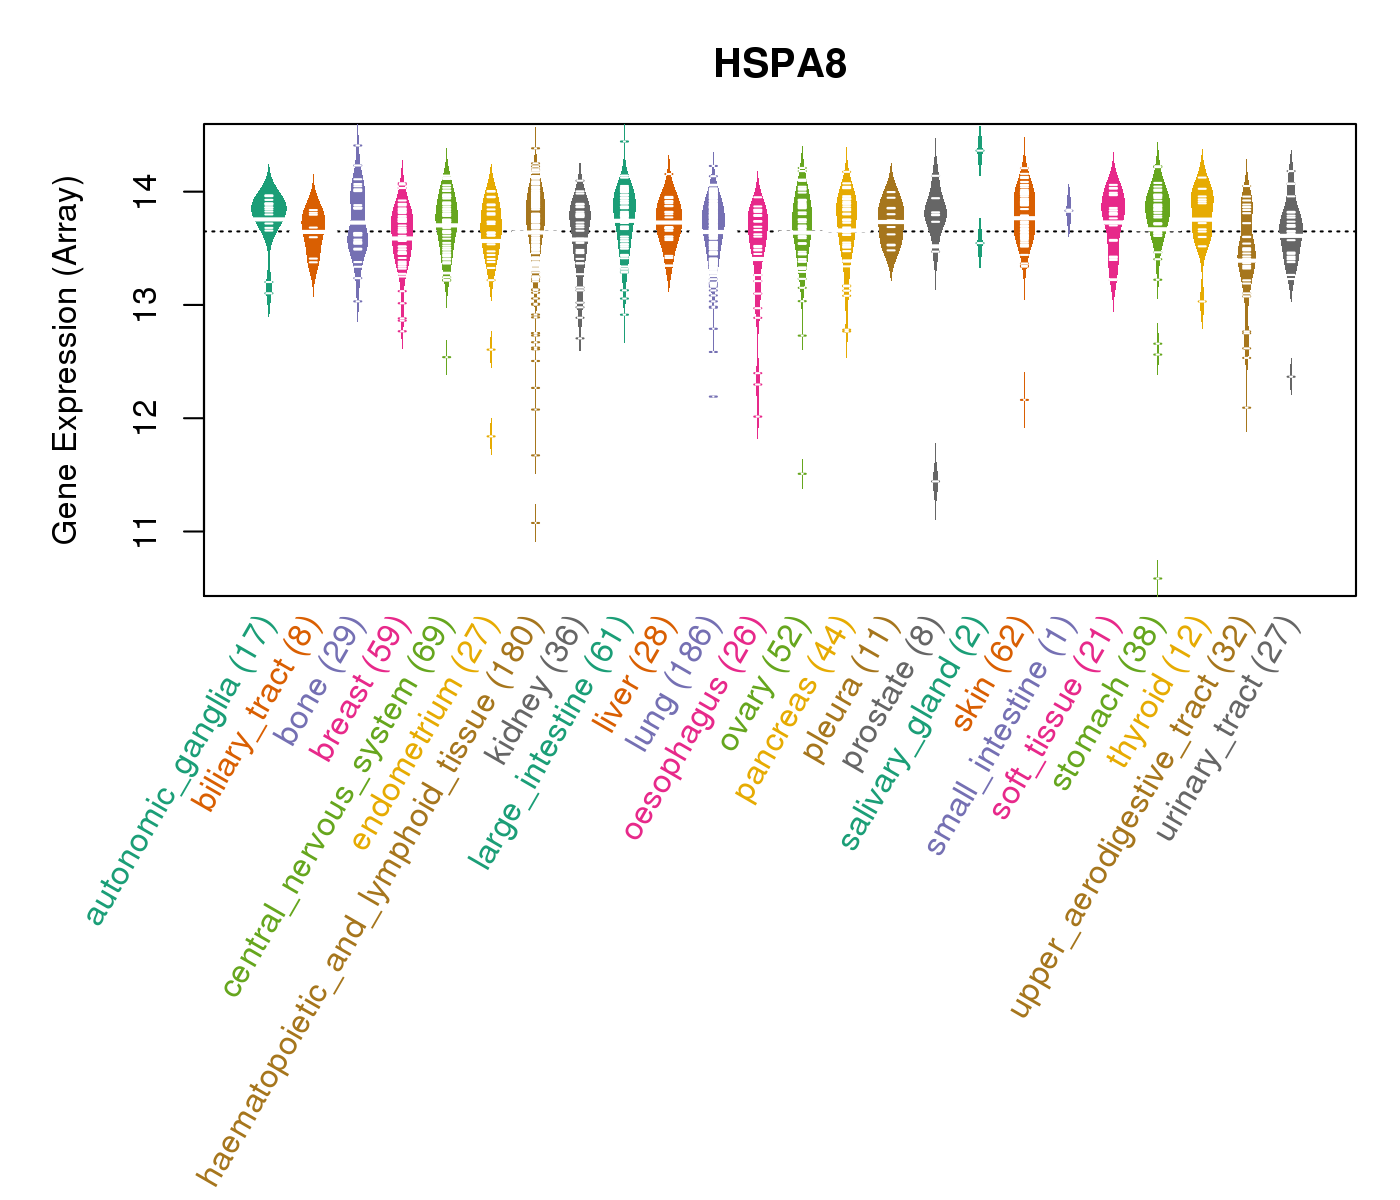
| Gene Expression for HSPA8 |
| * CCLE gene expression data were extracted from CCLE_Expression_Entrez_2012-10-18.res: Gene-centric RMA-normalized mRNA expression data. |
 |
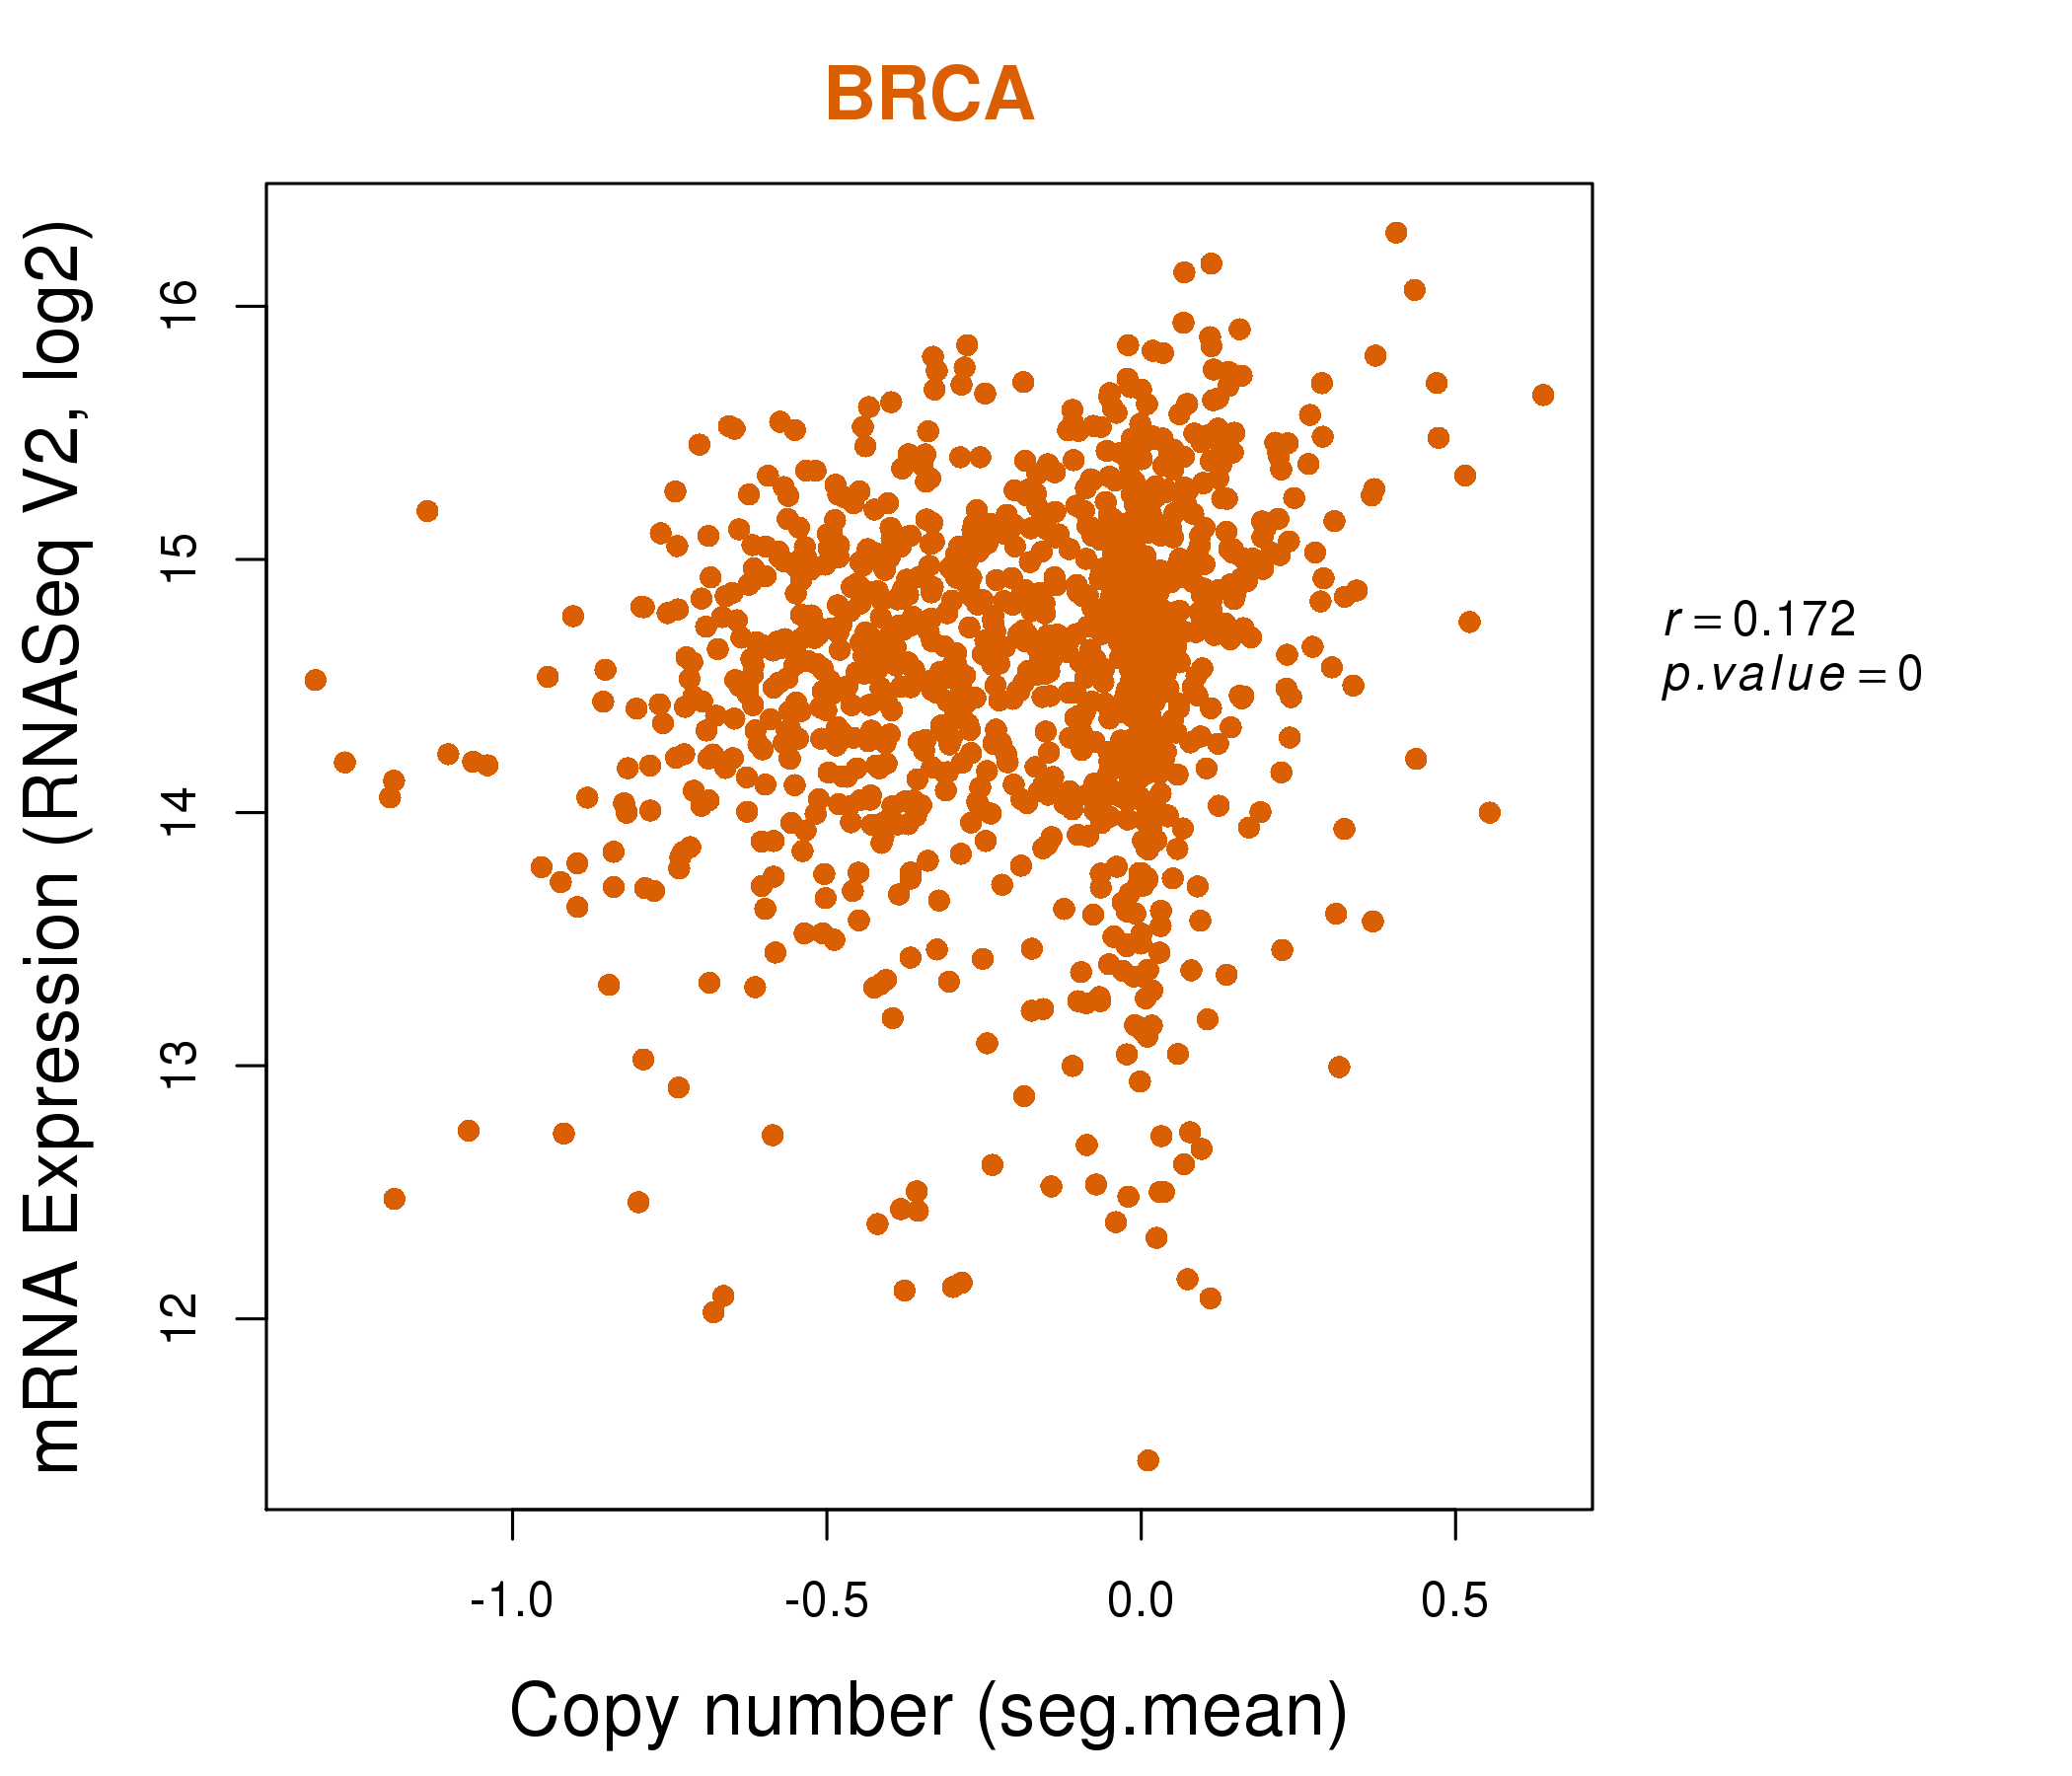
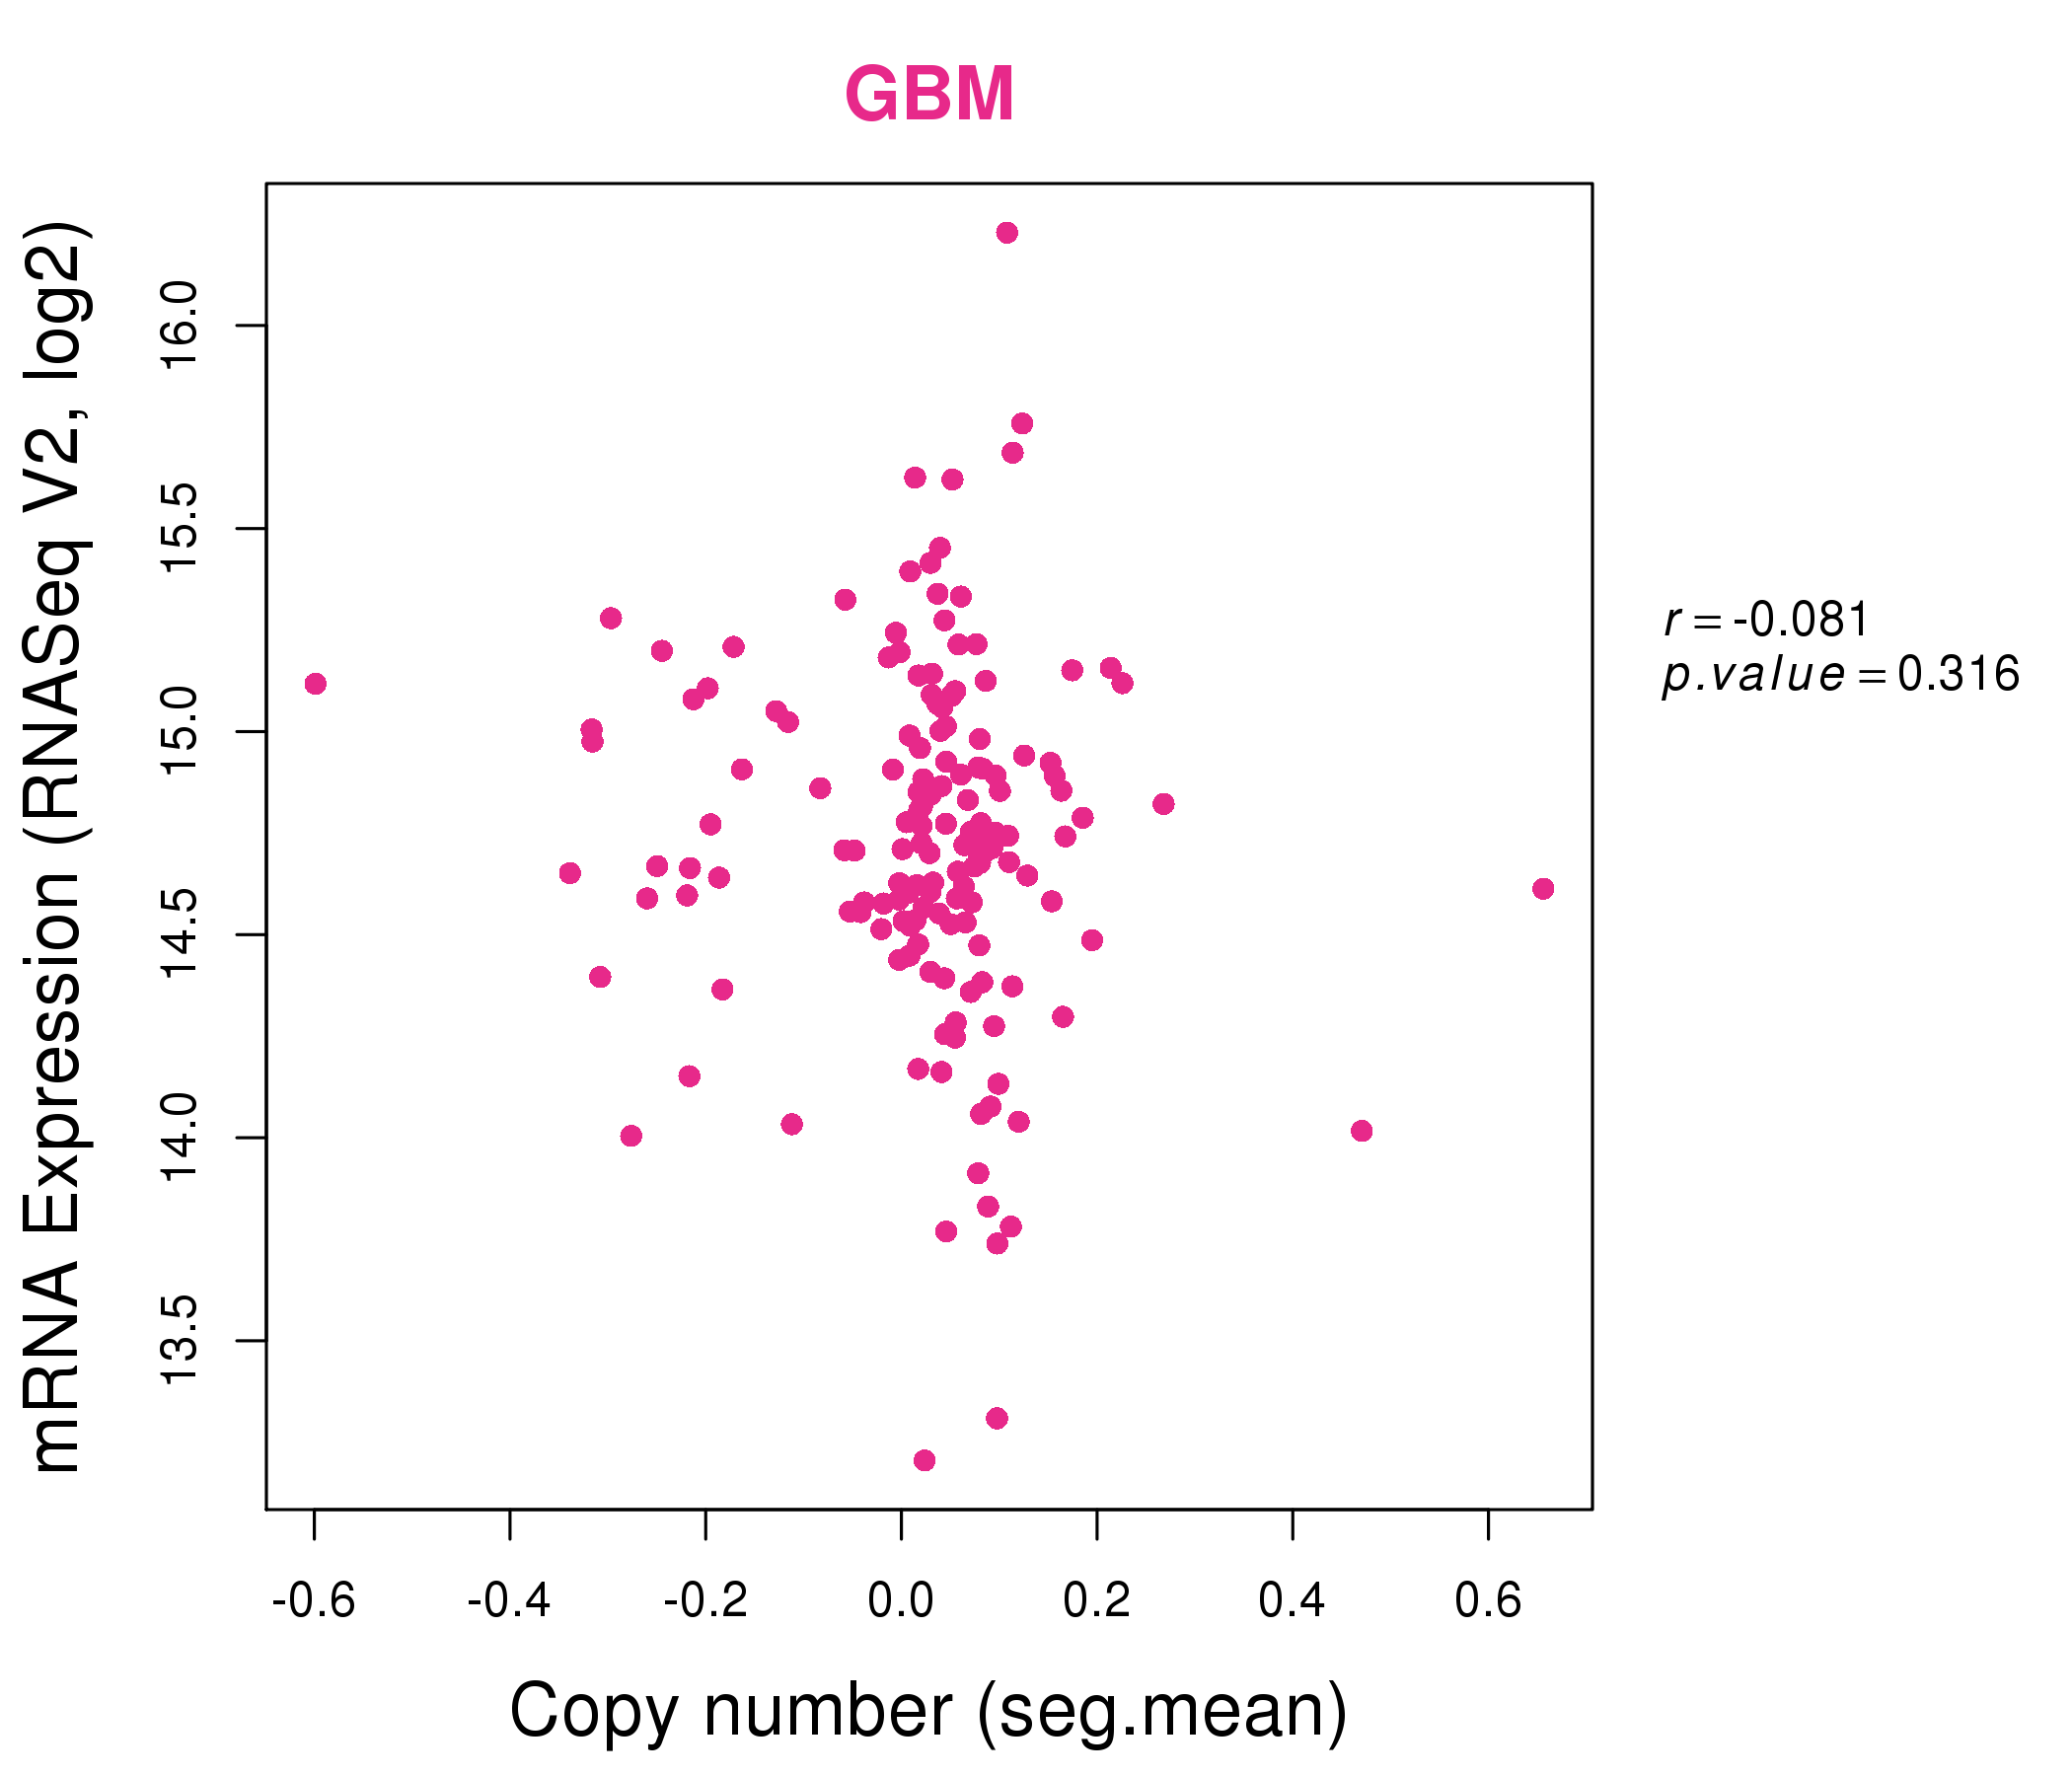
| * Normalized gene expression data of RNASeqV2 was extracted from TCGA using R package TCGA-Assembler. The URLs of all public data files on TCGA DCC data server were gathered at Jan-05-2015. Only eight cancer types have enough normal control samples for differential expression analysis. (t test, adjusted p<0.05 (using Benjamini-Hochberg FDR)) |
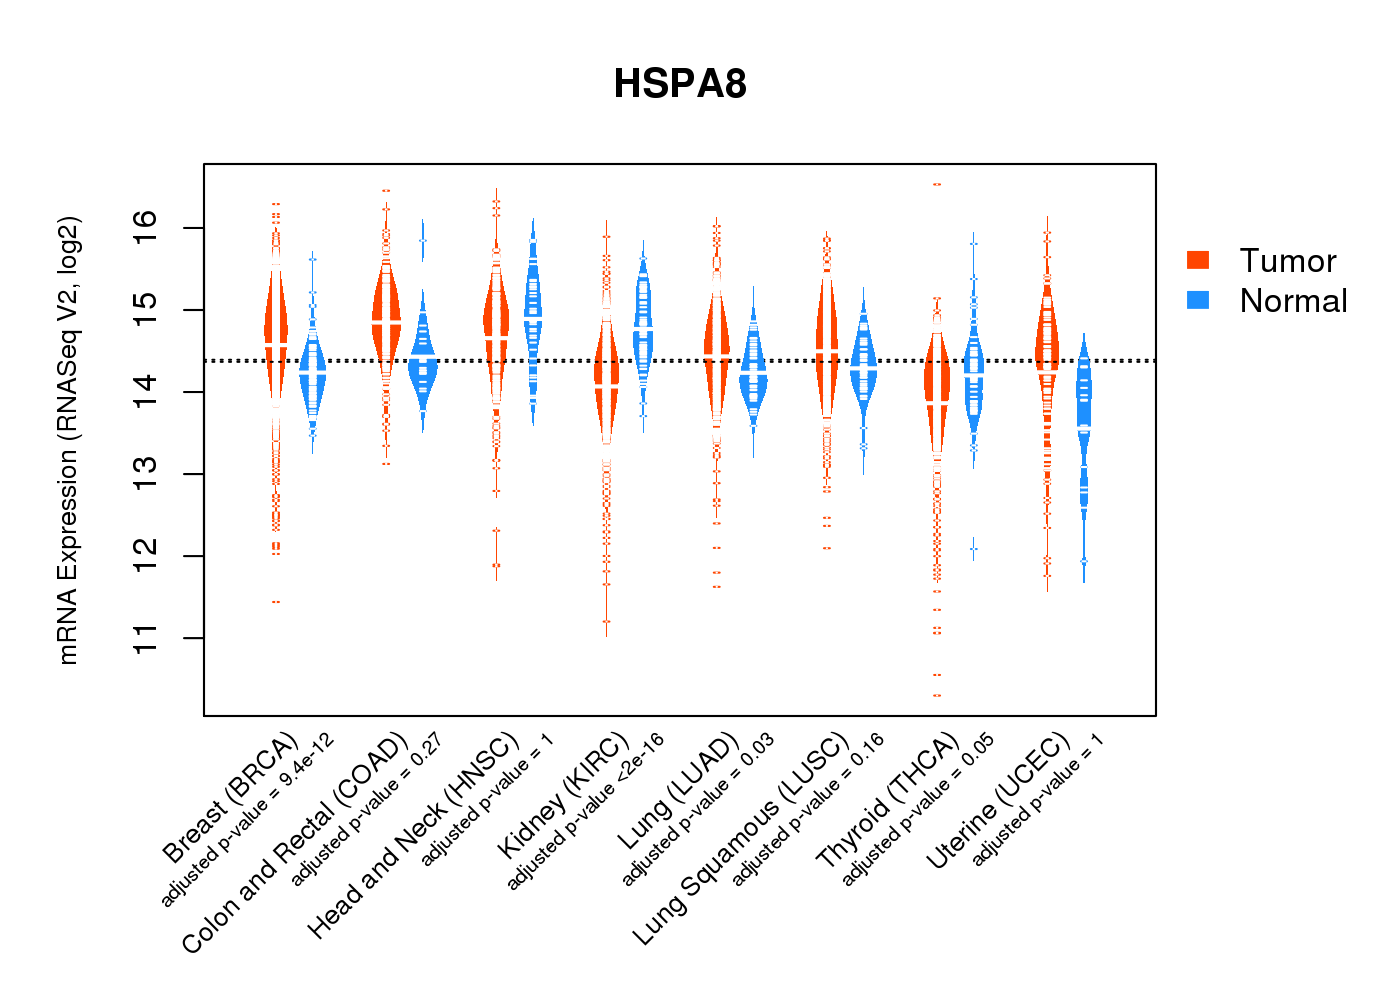 |
| Top |
| * This plots show the correlation between CNV and gene expression. |
: Open all plots for all cancer types
 |
|
 |
|
| Top |
| Gene-Gene Network Information |
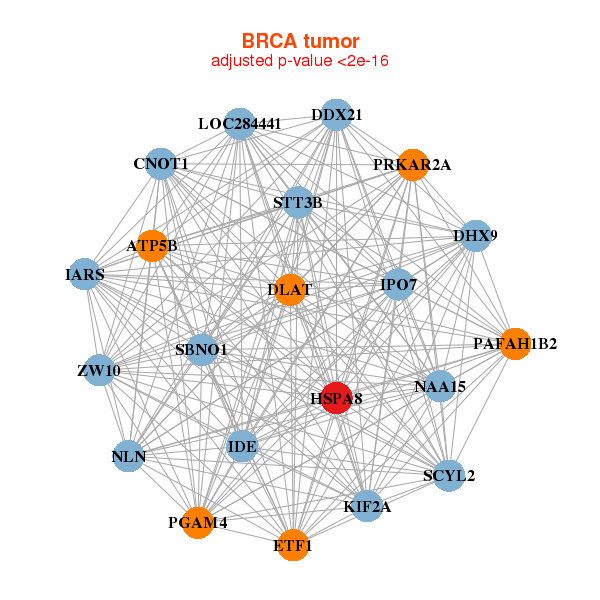
| * Co-Expression network figures were drawn using R package igraph. Only the top 20 genes with the highest correlations were shown. Red circle: input gene, orange circle: cell metabolism gene, sky circle: other gene |
: Open all plots for all cancer types
 |
| ||||
| ATP5B,CNOT1,DDX21,DHX9,DLAT,ETF1,HSPA8, IARS,IDE,IPO7,KIF2A,LOC284441,NAA15,NLN, PAFAH1B2,PGAM4,PRKAR2A,SBNO1,SCYL2,STT3B,ZW10 | ABCF2,AIMP2,APOO,ATP5G1,COQ2,DNAJB6,EIF4E2, EIF5AL1,GTF3C6,HN1,HSPA8,NDUFS3,PGK1,PSMA5, PSMD14,TIMM8B,EMC6,TPI1,UTP11L,VDAC1,WDR77 | ||||
 |
| ||||
| ATP5B,C1QBP,CCT2,CCT4,CHTF8,CNIH1,COPS4, G3BP1,GPN3,GTF2H3,HMMR,HSPA8,MED31,MRPL44, MRPL49,NOC3L,PNP,RAN,RQCD1,SNRNP40,TTC5 | CACYBP,CCT2,CELA3A,CHAC2,DPH2,EIF4E,HSP90AA1, HSPA8,HSPE1,IAPP,METTL1,NOC3L,PAK1IP1,PNO1, PSG1,RPP40,SRPRB,SSX8,TBCE,VCY,WDR12 |

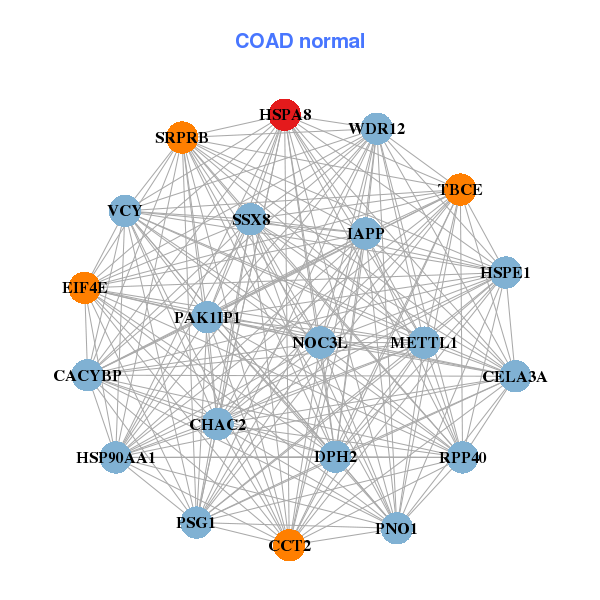
| * Co-Expression network figures were drawn using R package igraph. Only the top 20 genes with the highest correlations were shown. Red circle: input gene, orange circle: cell metabolism gene, sky circle: other gene |
: Open all plots for all cancer types
| Top |
: Open all interacting genes' information including KEGG pathway for all interacting genes from DAVID
| Top |
| Pharmacological Information for HSPA8 |
| DB Category | DB Name | DB's ID and Url link |
| Chemistry | BindingDB | P11142; -. |
| Chemistry | ChEMBL | CHEMBL1275223; -. |
| Organism-specific databases | PharmGKB | PA29507; -. |
| Organism-specific databases | CTD | 3312; -. |
| * Gene Centered Interaction Network. |
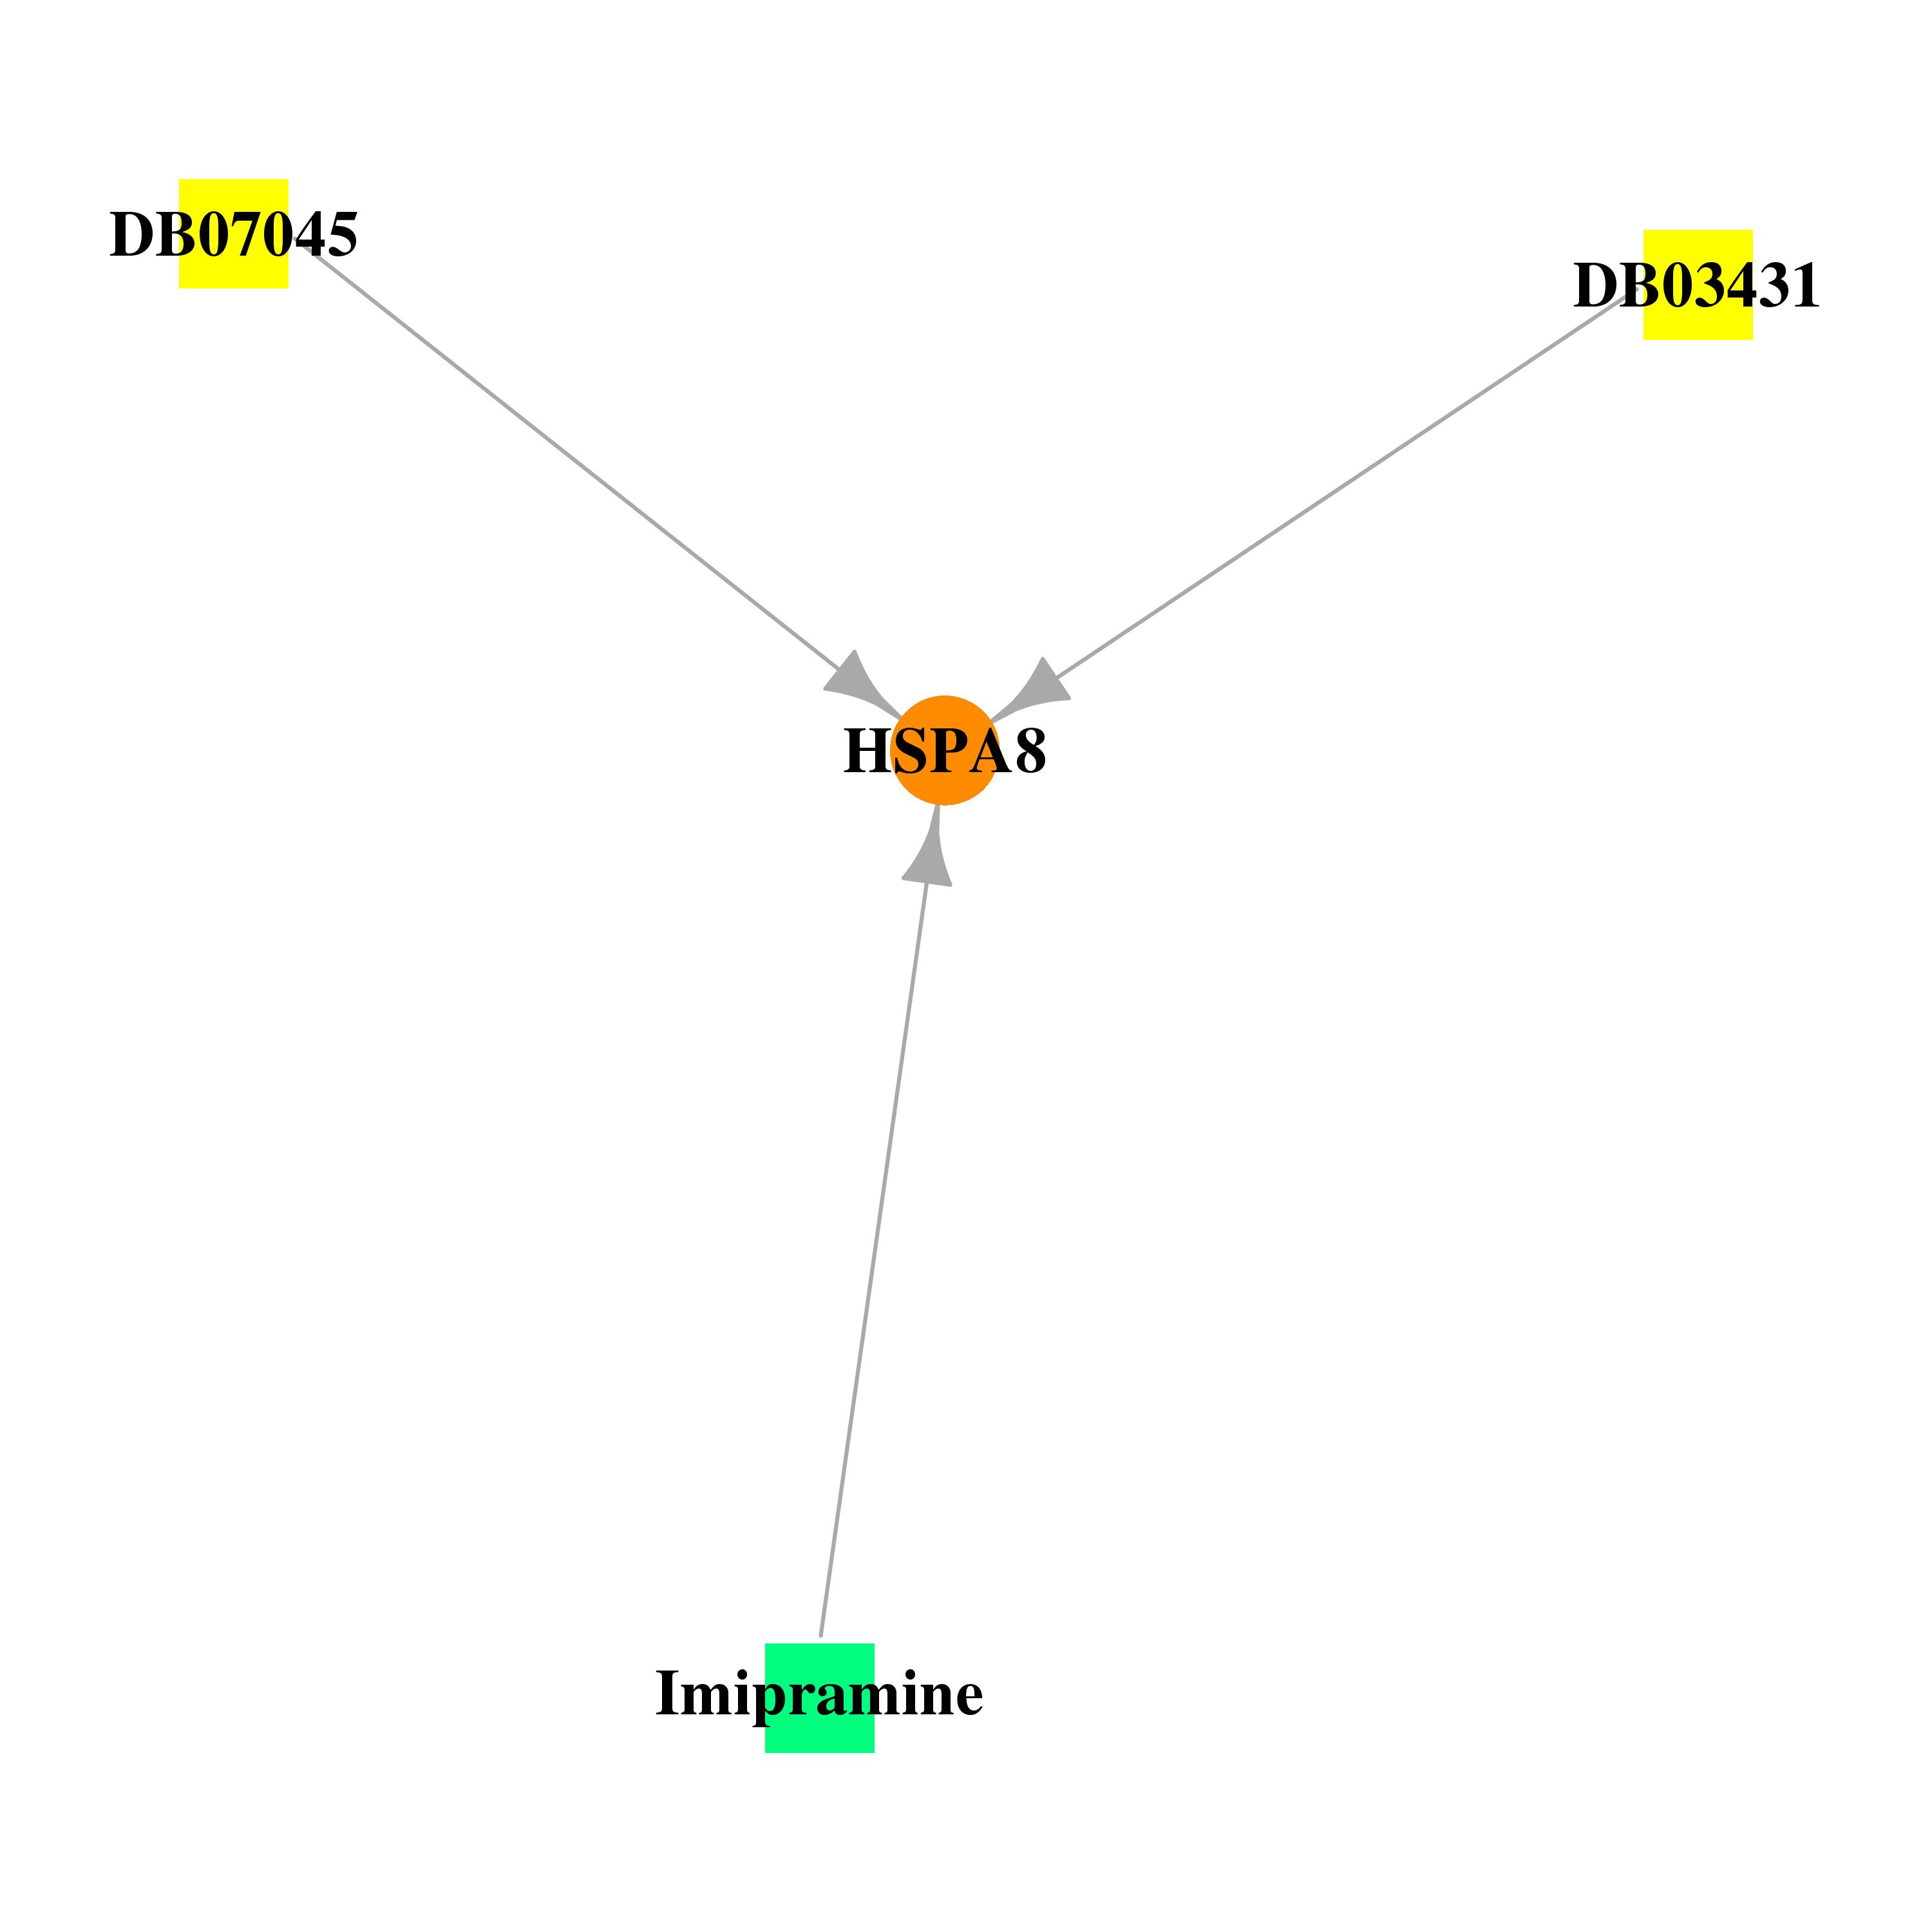 |
| * Drug Centered Interaction Network. |
| DrugBank ID | Target Name | Drug Groups | Generic Name | Drug Centered Network | Drug Structure |
| DB03431 | heat shock 70kDa protein 8 | experimental | Adenosine-5'-Diphosphate | 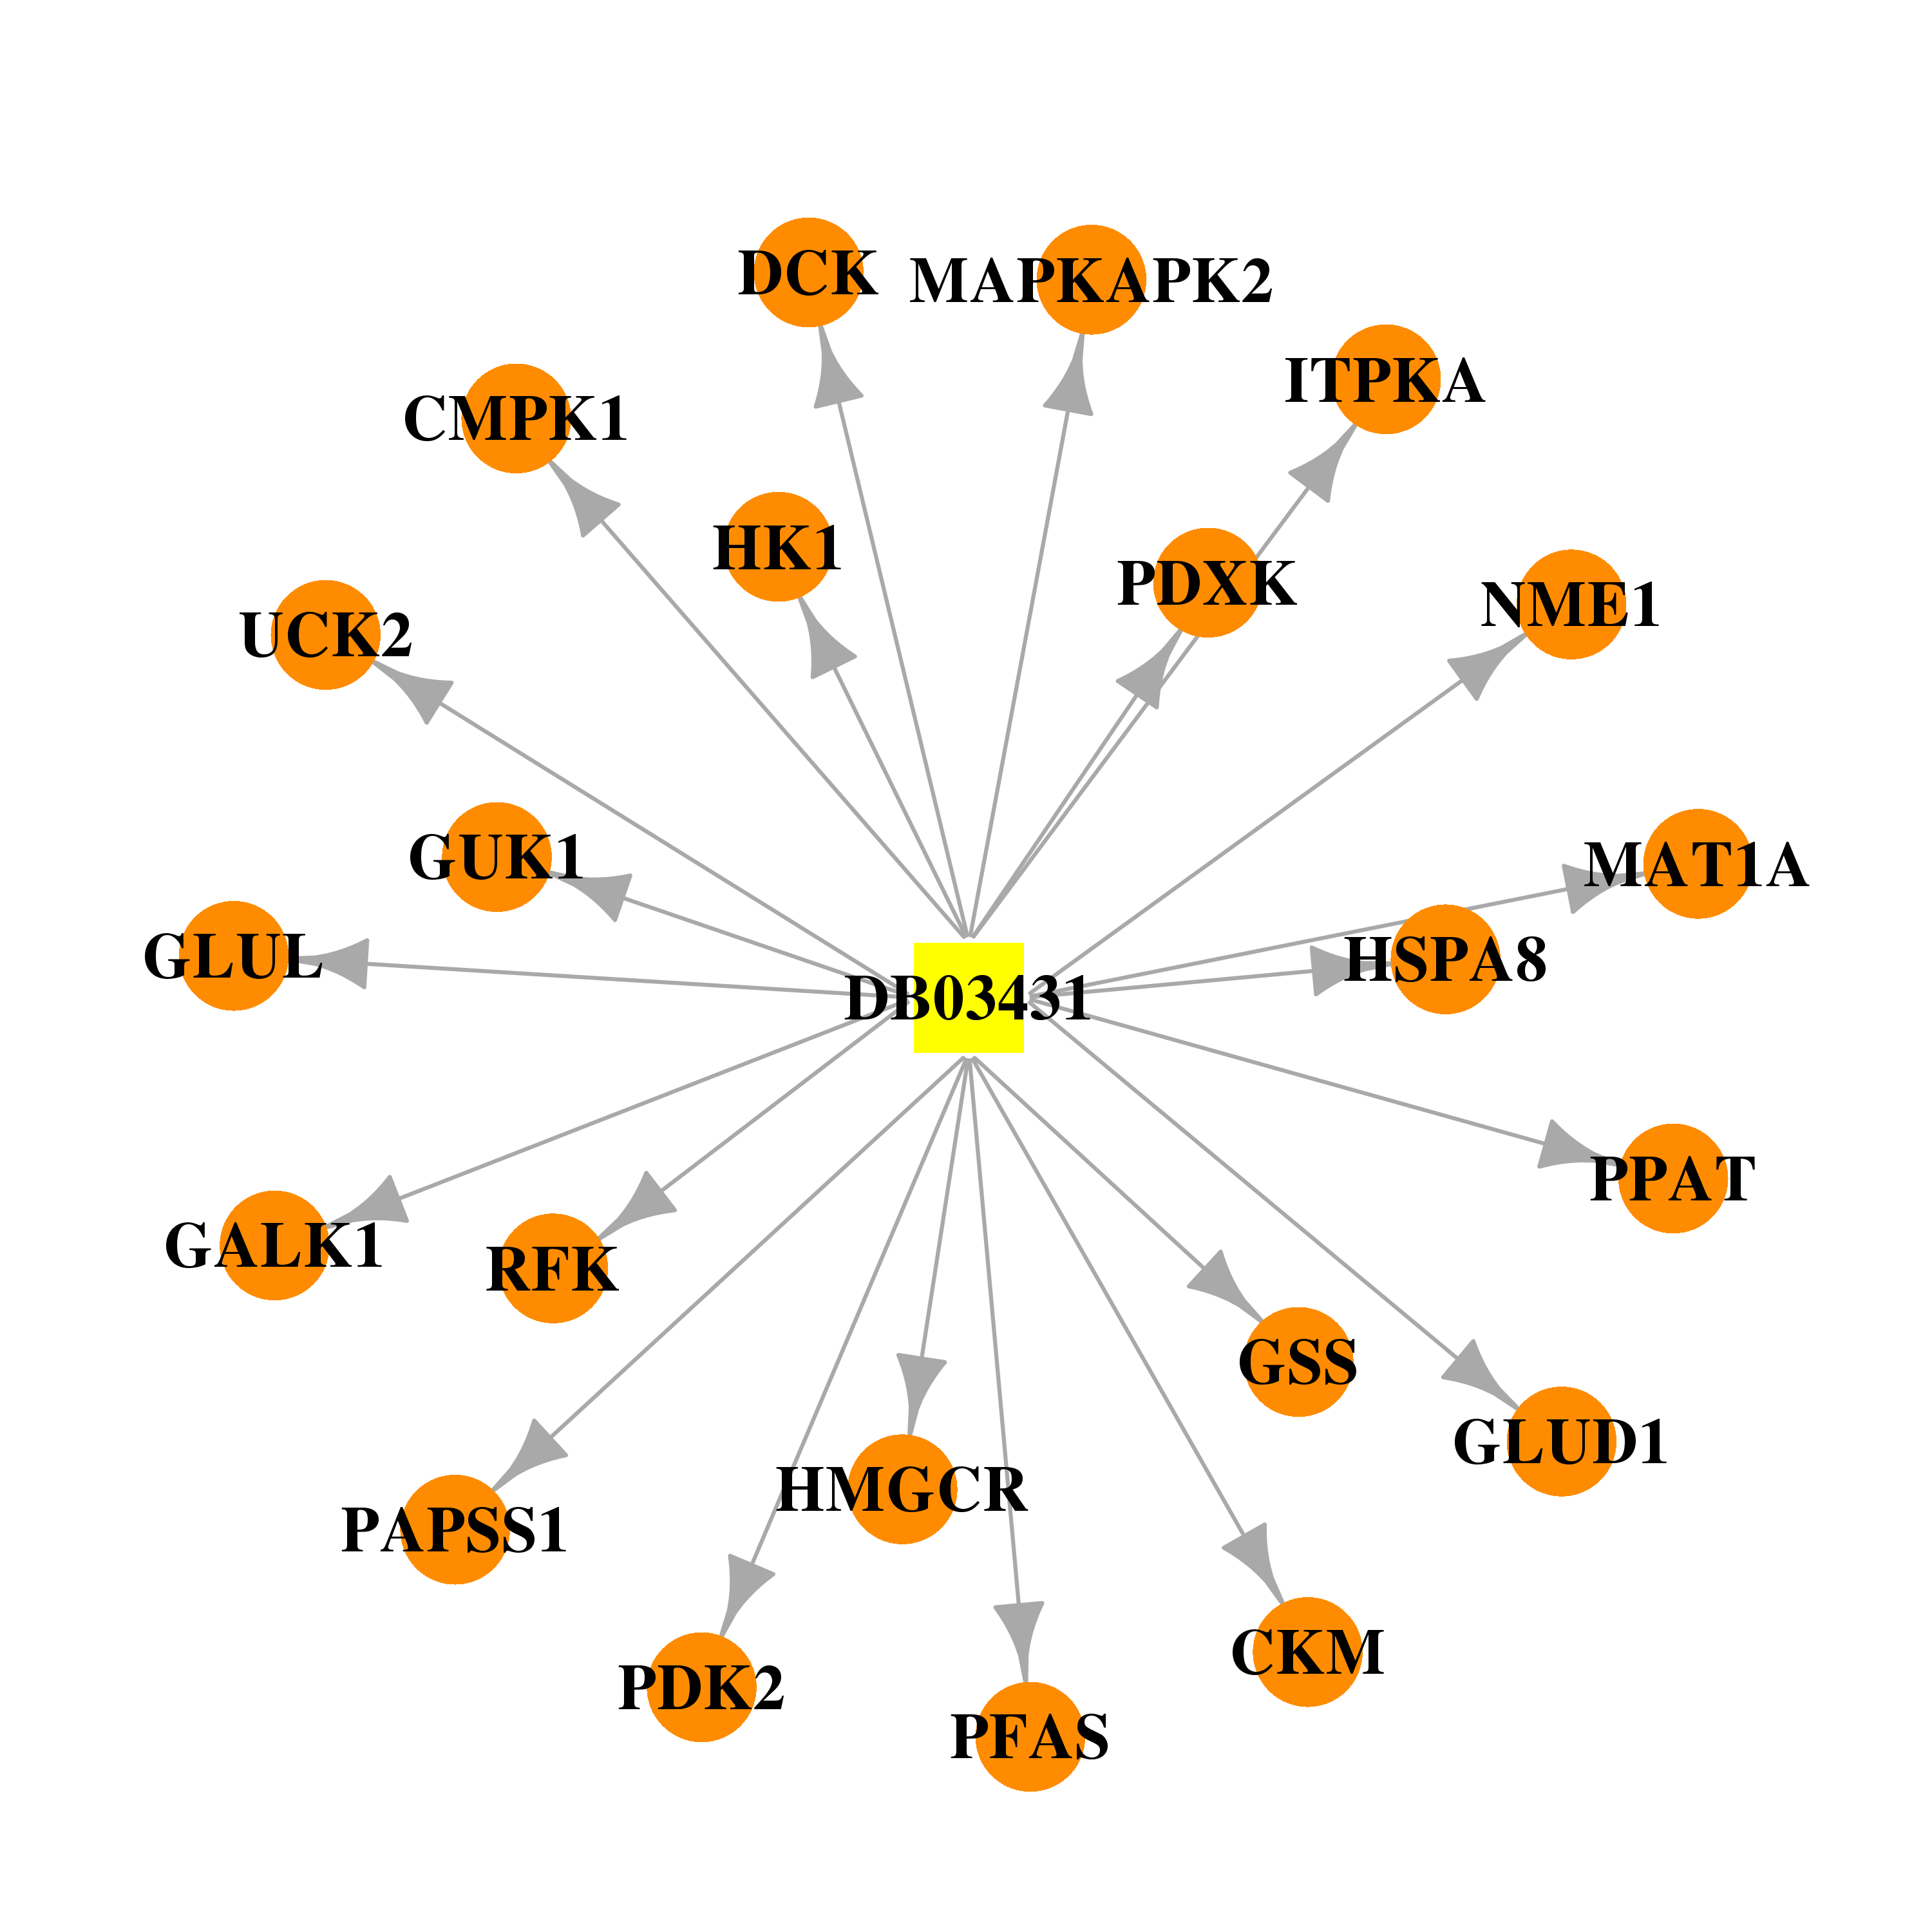 | 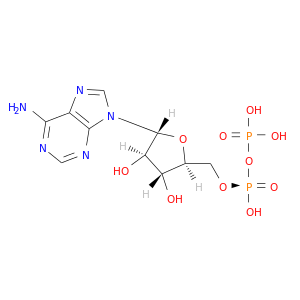 |
| DB07045 | heat shock 70kDa protein 8 | experimental | (2R,3R,4S,5R)-2-[6-amino-8-[(3,4-dichlorophenyl)methylamino]purin-9-yl]-5-(hydroxymethyl)oxolane-3,4-diol | 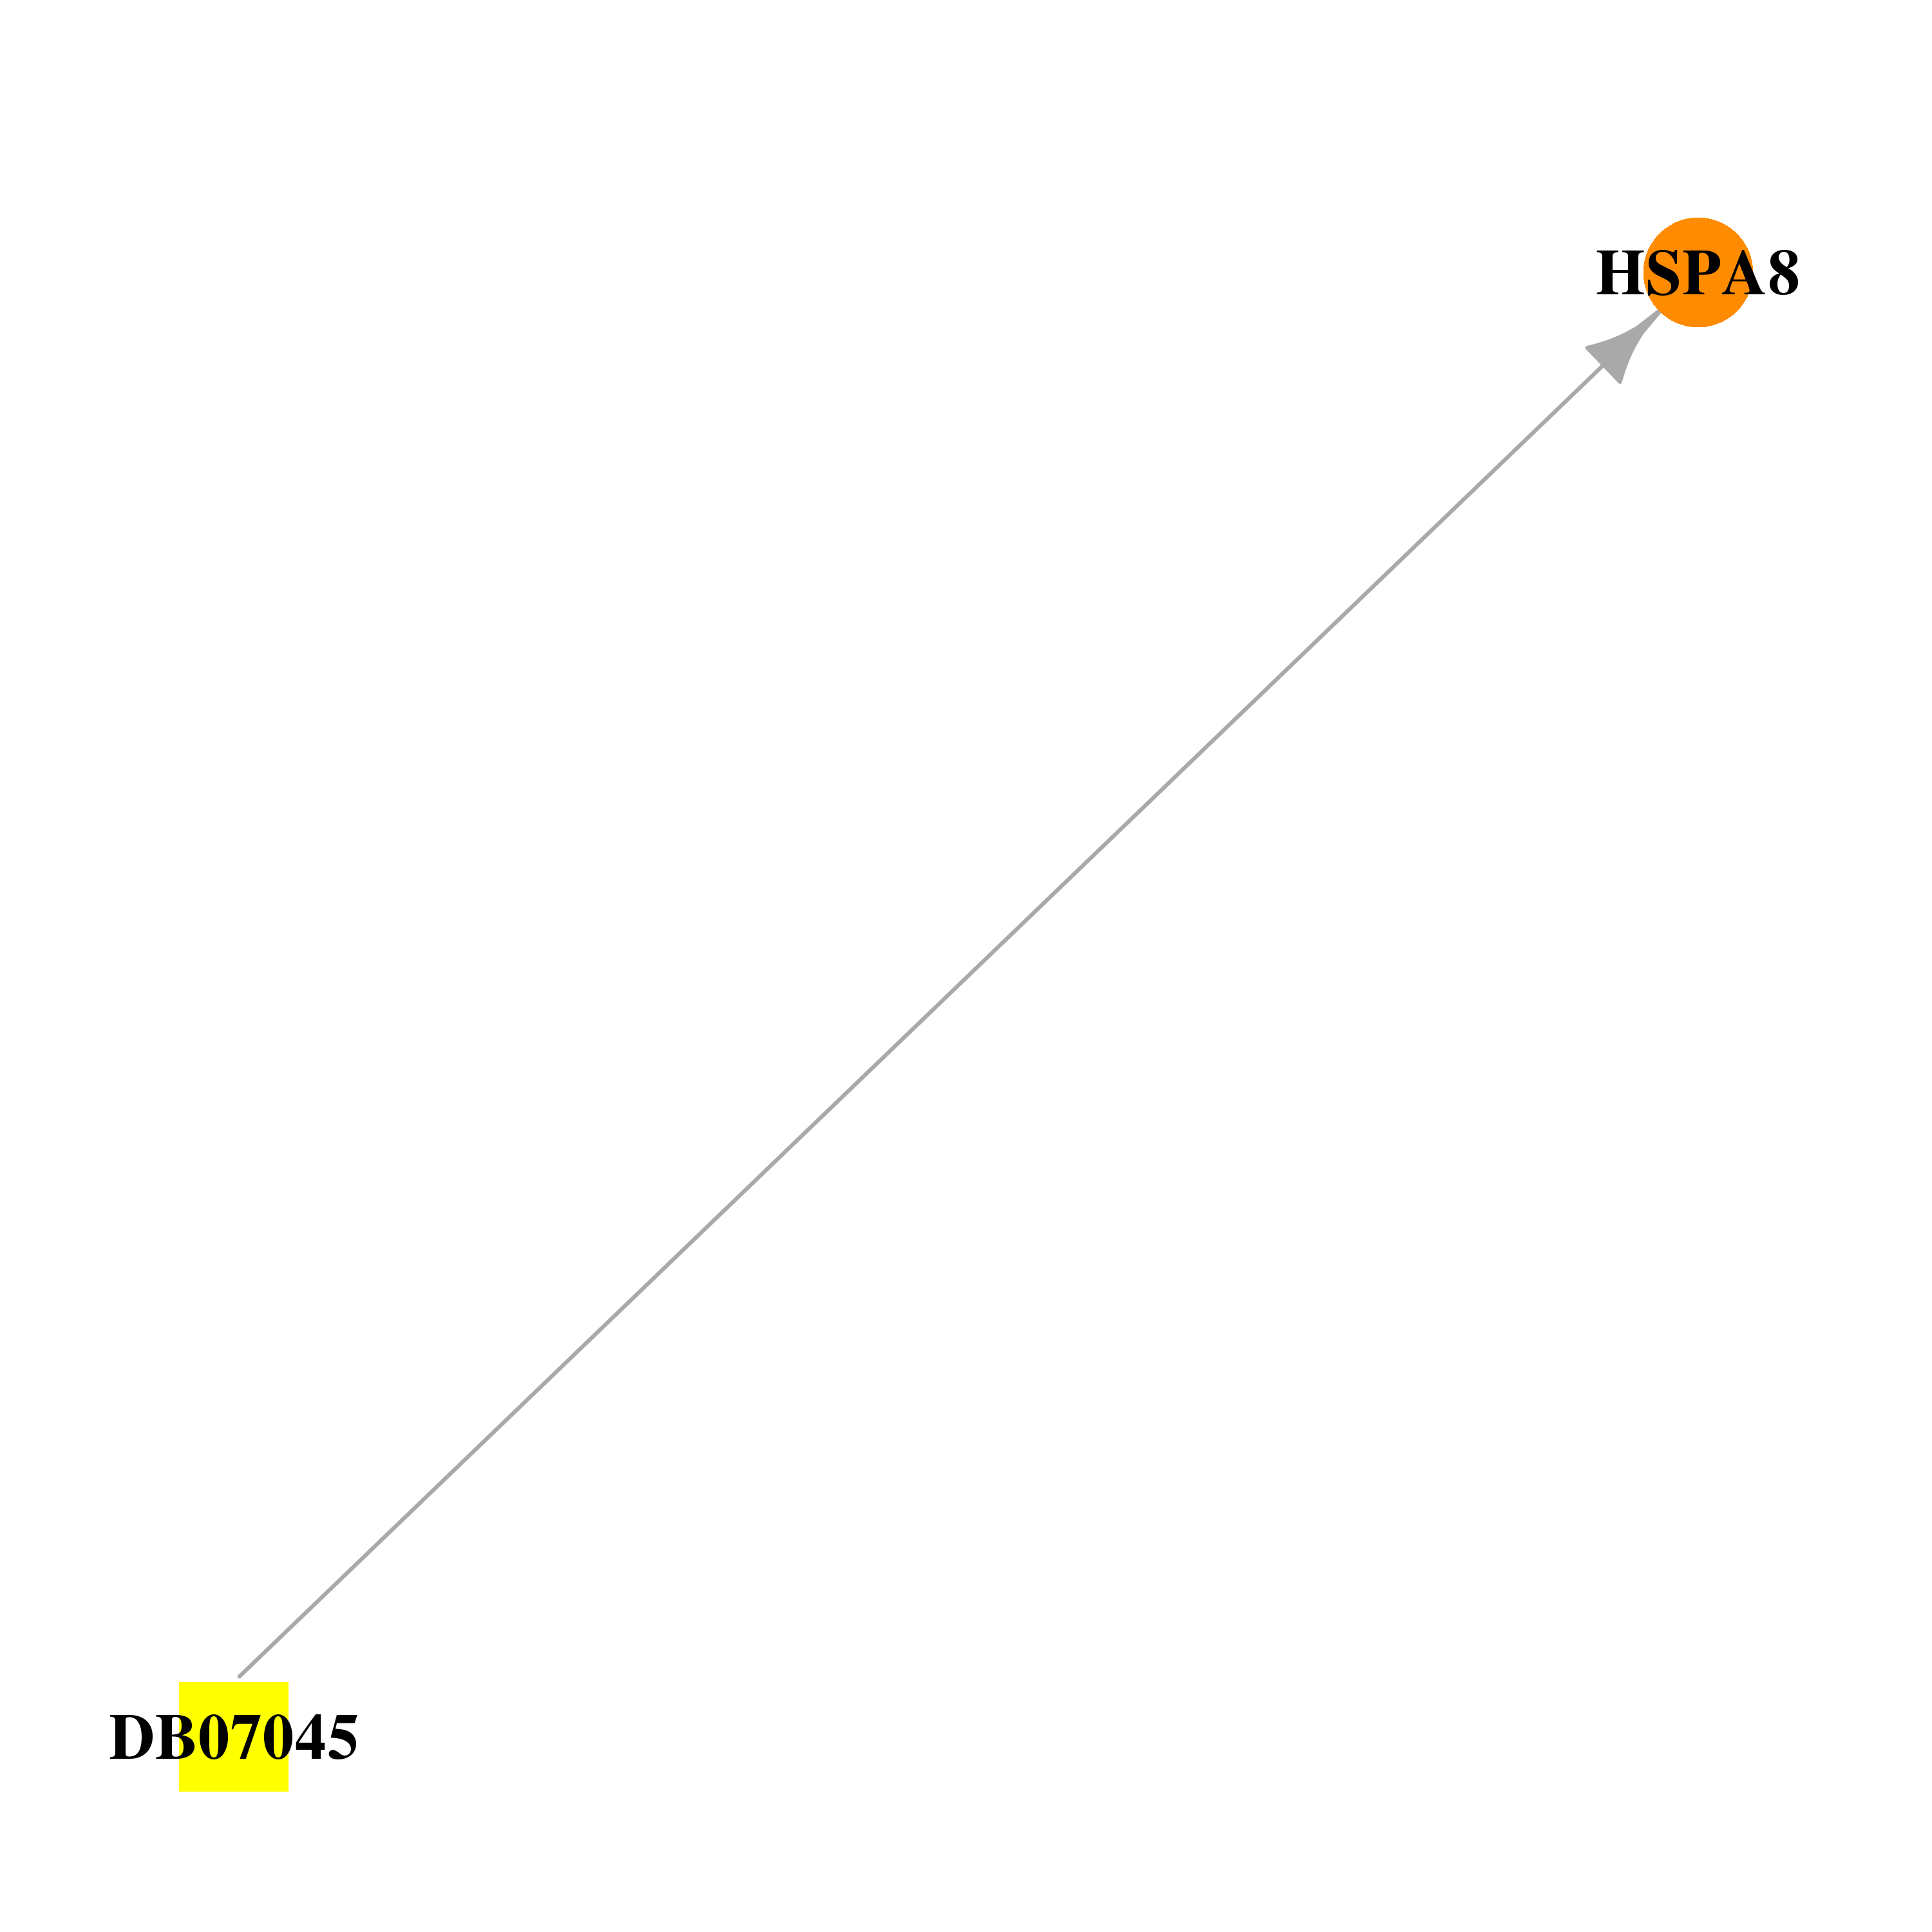 | 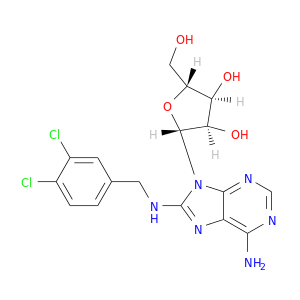 |
| DB00458 | heat shock 70kDa protein 8 | approved | Imipramine | 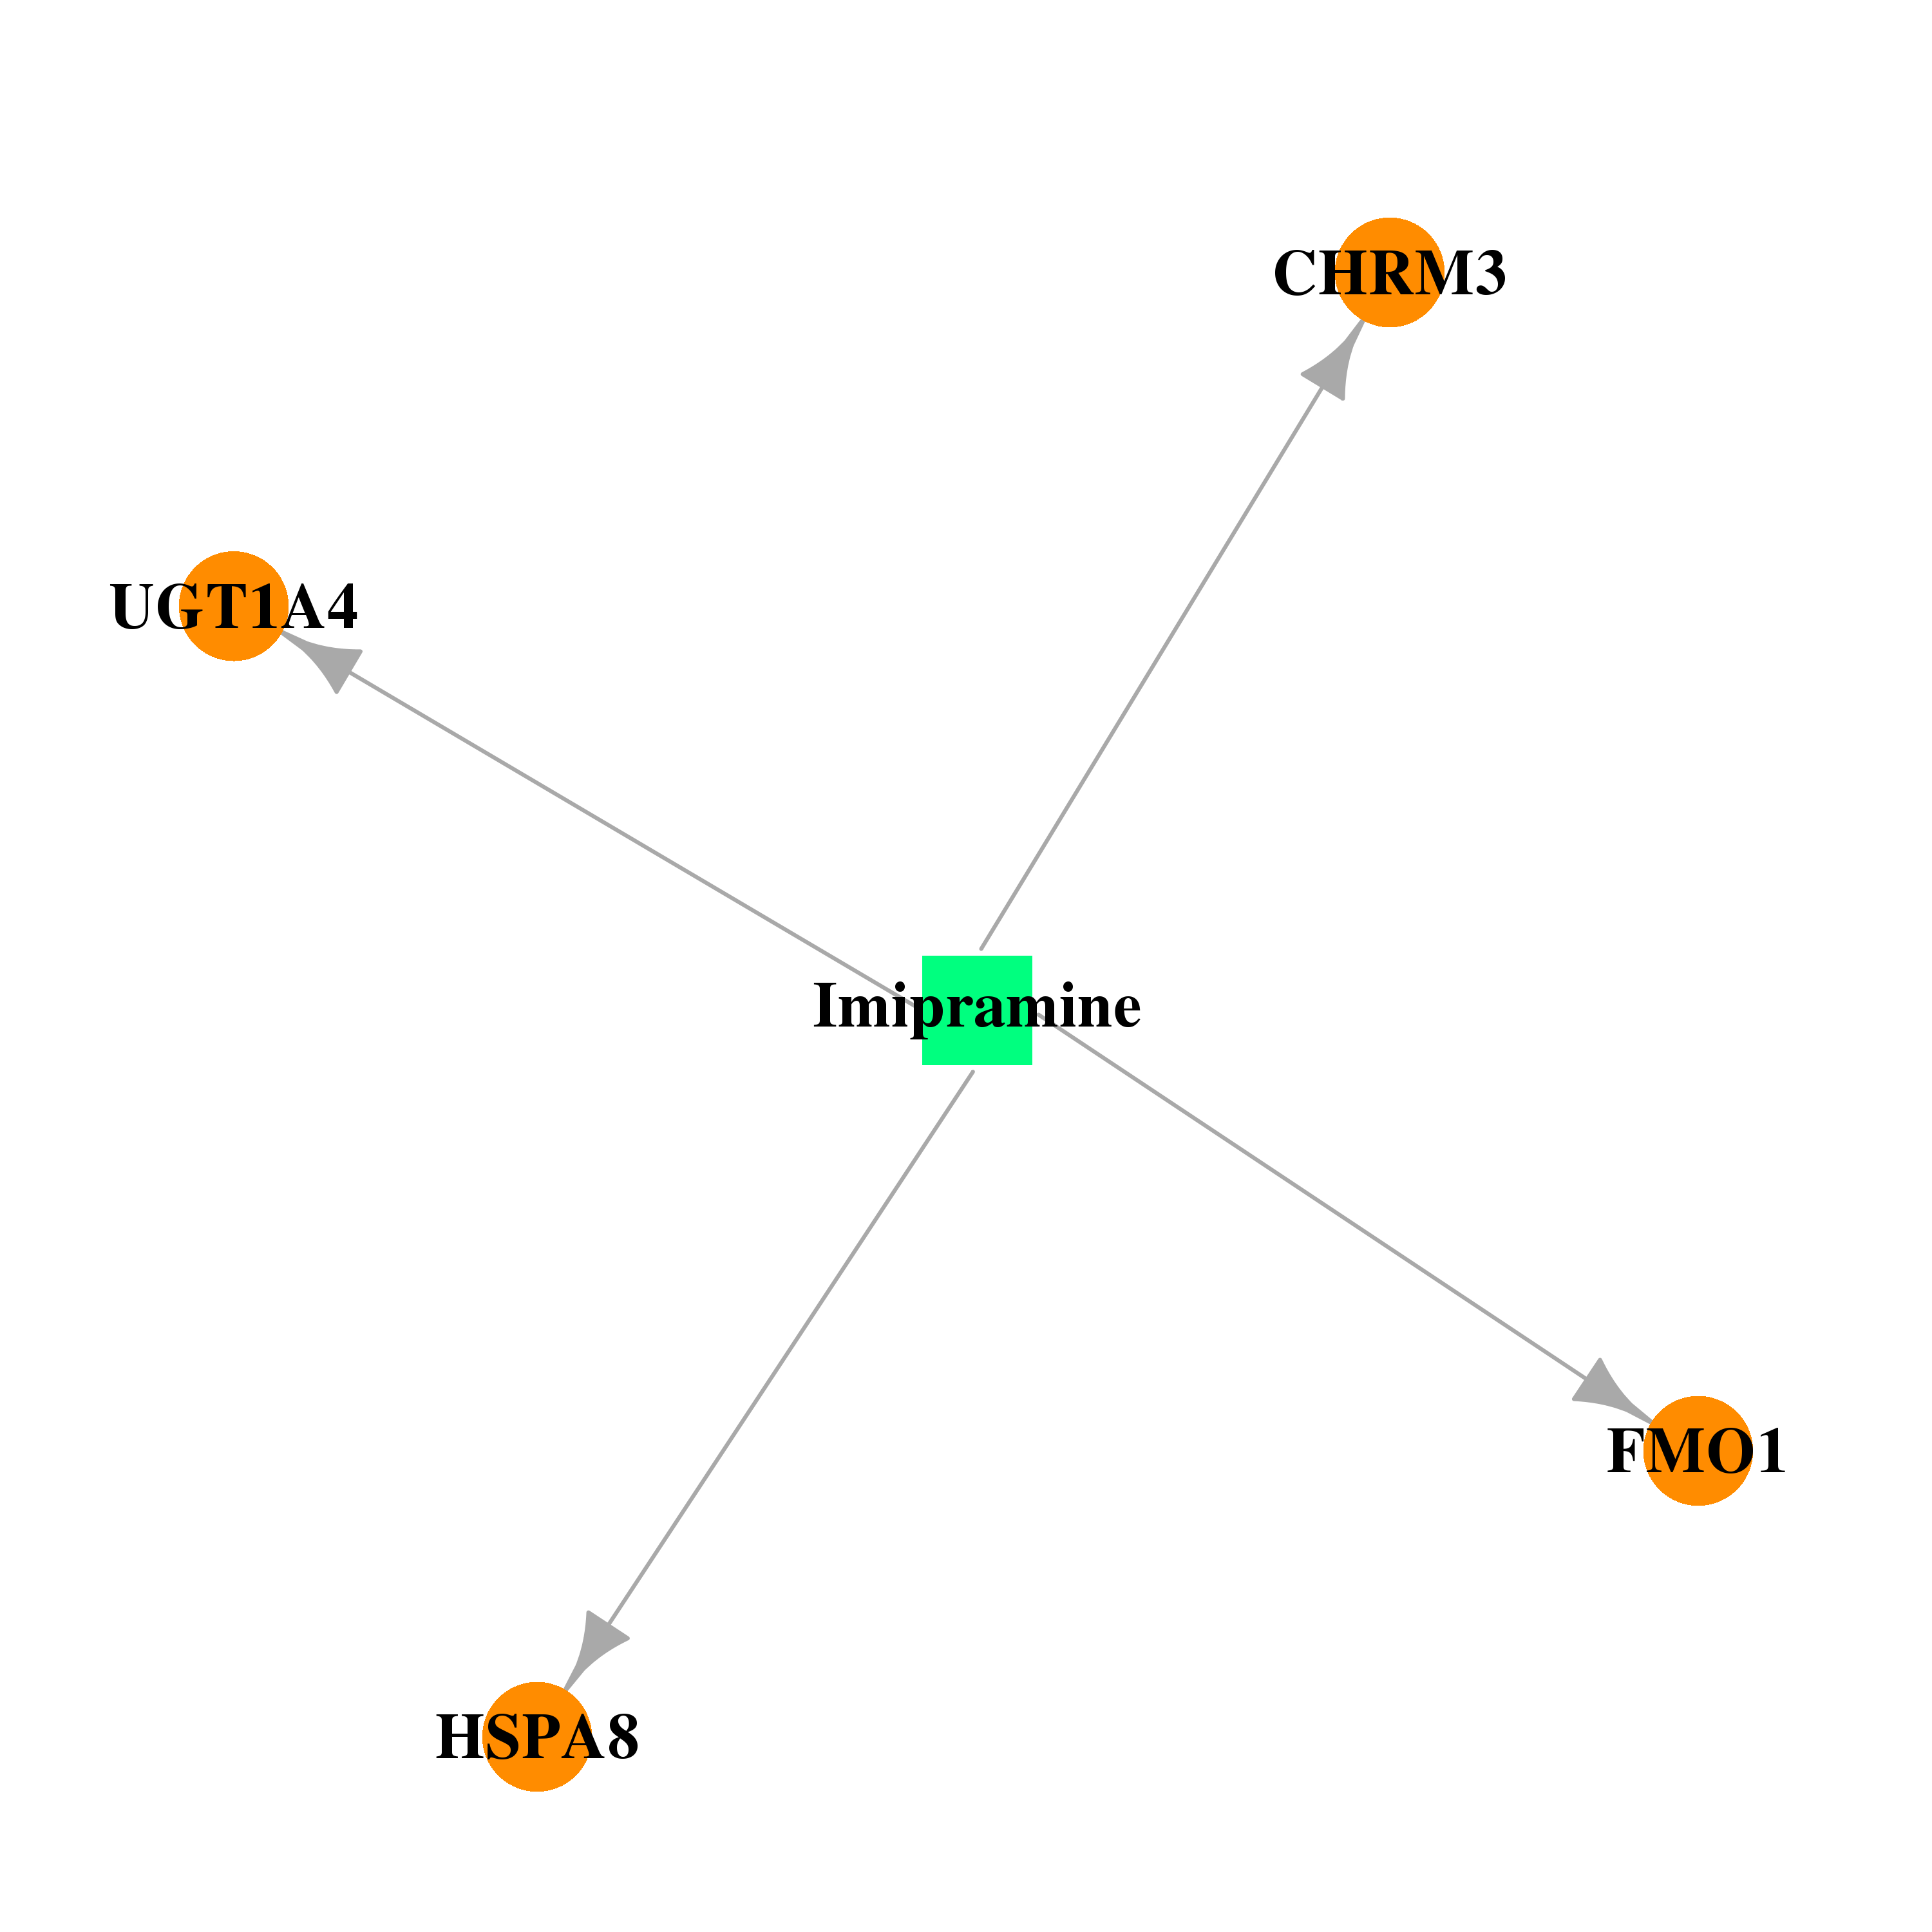 |  |
| Top |
| Cross referenced IDs for HSPA8 |
| * We obtained these cross-references from Uniprot database. It covers 150 different DBs, 18 categories. http://www.uniprot.org/help/cross_references_section |
: Open all cross reference information
|
Copyright © 2016-Present - The Univsersity of Texas Health Science Center at Houston @ |